management strategy - smfg · management strategy ... average loan balance*4 average loan spread*4...
TRANSCRIPT

Management Strategy
Sumitomo Mitsui Financial Group, Inc.February & March 2017
Agenda
1
Business environment and our initiativesI
II 3Q, FY3/2017 performance
III Business strategy
IV Corporate governance
V Capital policy
Business environment and our initiativesI

3
I. Business environment and our initiatives
Business environment
Unexpected global events
“Unexpected” events may continue to occur worldwide
Real GDP growth rate*
Tightening of International financial regulations
Strengthening of prudential regulation Improvement of quality and quantity of capital Leverage ratio requirement Minimum standards for liquidity (LCR, NSFR) Revision of measures to calculate risk-weighted
assets, credit risk, operational risk, IRRBB, capital floors, revision to internal models
Measures against Too-Big-To-Fail G-SIBs surcharge TLAC
OTC derivatives market reforms
2016 2017
BOJ’s negative interest rate policy
Brexit
US Presidential election
Elections in European countries (Netherlands, France, Germany)
・・・
(1)
0
1
2
3
4
5
6
7
8
9
10
10 11 12 13 14 15 16E 17P
(%)
Emerging and Developing Asia
World
Euro area
USUK
Japan
* Source: IMF World Economic Outlook Update Jan. 2017. 2016 numbers are estimates. 2017 numbers are projections
4
I. Business environment and our initiatives
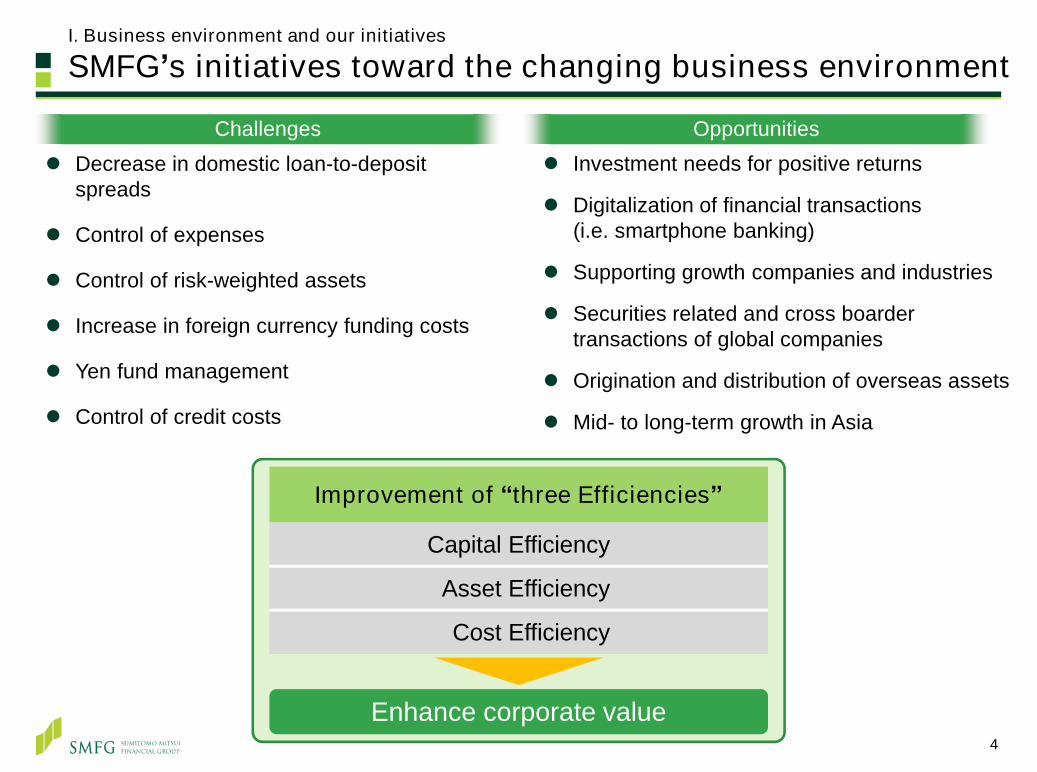
SMFG’s initiatives toward the changing business environment
Decrease in domestic loan-to-deposit spreads
Control of expenses
Control of risk-weighted assets
Increase in foreign currency funding costs
Yen fund management
Control of credit costs
Challenges Opportunities
Improvement of “three Efficiencies”
Capital Efficiency
Asset Efficiency
Cost Efficiency
Enhance corporate value
Investment needs for positive returns
Digitalization of financial transactions(i.e. smartphone banking)
Supporting growth companies and industries
Securities related and cross boarder transactions of global companies
Origination and distribution of overseas assets
Mid- to long-term growth in Asia
3Q, FY3/2017 performanceII
II. 3Q, FY3/2017 performance
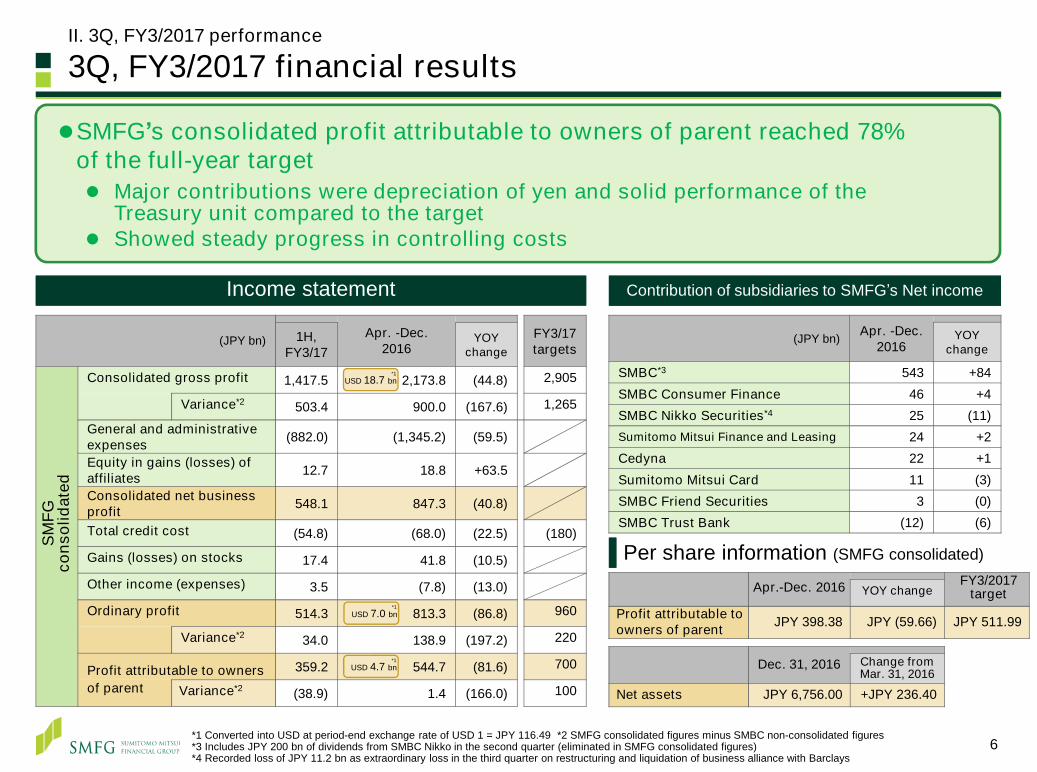
3Q, FY3/2017 financial results
Income statementIncome statement Contribution of subsidiaries to SMFG’s Net incomeContribution of subsidiaries to SMFG’s Net income
(JPY bn) Apr. -Dec. 2016
YOYchange
SMBC*3 543 +84SMBC Consumer Finance 46 +4SMBC Nikko Securities*4 25 (11)Sumitomo Mitsui Finance and Leasing 24 +2Cedyna 22 +1Sumitomo Mitsui Card 11 (3)SMBC Friend Securities 3 (0)SMBC Trust Bank (12) (6)
*1 Converted into USD at period-end exchange rate of USD 1 = JPY 116.49 *2 SMFG consolidated figures minus SMBC non-consolidated figures*3 Includes JPY 200 bn of dividends from SMBC Nikko in the second quarter (eliminated in SMFG consolidated figures)*4 Recorded loss of JPY 11.2 bn as extraordinary loss in the third quarter on restructuring and liquidation of business alliance with Barclays
Apr.-Dec. 2016 FY3/2017 targetYOY change
Profit attributable to owners of parent JPY 398.38 JPY (59.66) JPY 511.99
Dec. 31, 2016 Change from Mar. 31, 2016
Net assets JPY 6,756.00 +JPY 236.40
Per share information (SMFG consolidated)
(JPY bn) Apr. -Dec.2016
FY3/17targets
1H, FY3/17
YOY change
Consolidated gross profit 1,417.5 2,173.8 (44.8) 2,905
Variance*2 503.4 900.0 (167.6) 1,265
General and administrative expenses (882.0) (1,345.2) (59.5)
Equity in gains (losses) of affiliates 12.7 18.8 +63.5
Consolidated net business profit 548.1 847.3 (40.8)
Total credit cost (54.8) (68.0) (22.5) (180)
Gains (losses) on stocks 17.4 41.8 (10.5)
Other income (expenses) 3.5 (7.8) (13.0)
Ordinary profit 514.3 813.3 (86.8) 960
Variance*2 34.0 138.9 (197.2) 220
Profit attributable to owners 359.2 544.7 (81.6) 700
of parent Variance*2 (38.9) 1.4 (166.0) 100
SMFG
cons
olid
ated
USD 18.7 bn*1
USD 4.7 bn*1
USD 7.0 bn*1
SMFG’s consolidated profit attributable to owners of parent reached 78% of the full-year target Major contributions were depreciation of yen and solid performance of the
Treasury unit compared to the target Showed steady progress in controlling costs
6
7
II. 3Q, FY3/2017 performance
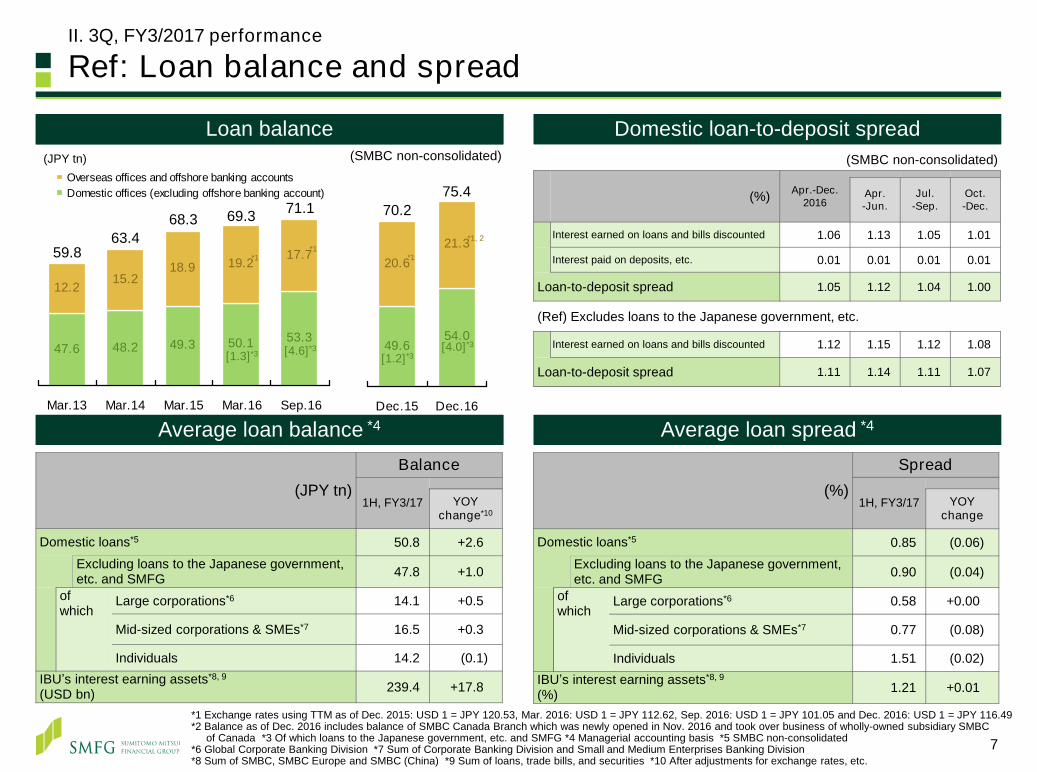
Ref: Loan balance and spread
Average loan balance *4Average loan balance *4 Average loan spread *4Average loan spread *4
Domestic loan-to-deposit spreadDomestic loan-to-deposit spread(SMBC non-consolidated)
Loan balanceLoan balance
(%) Apr.-Dec.2016
Apr.-Jun.
Jul.-Sep.
Oct.-Dec.
Interest earned on loans and bills discounted 1.06 1.13 1.05 1.01
Interest paid on deposits, etc. 0.01 0.01 0.01 0.01
Loan-to-deposit spread 1.05 1.12 1.04 1.00
(Ref) Excludes loans to the Japanese government, etc.
Interest earned on loans and bills discounted 1.12 1.15 1.12 1.08
Loan-to-deposit spread 1.11 1.14 1.11 1.07
(JPY tn)Balance
1H, FY3/17 YOYchange*10
Domestic loans*5 50.8 +2.6Excluding loans to the Japanese government, etc. and SMFG 47.8 +1.0
of which
Large corporations*6 14.1 +0.5
Mid-sized corporations & SMEs*7 16.5 +0.3
Individuals 14.2 (0.1)IBU’s interest earning assets*8, 9
(USD bn) 239.4 +17.8
(%)Spread
1H, FY3/17 YOYchange
Domestic loans*5 0.85 (0.06)Excluding loans to the Japanese government, etc. and SMFG 0.90 (0.04)
of which
Large corporations*6 0.58 +0.00
Mid-sized corporations & SMEs*7 0.77 (0.08)
Individuals 1.51 (0.02)IBU’s interest earning assets*8, 9
(%) 1.21 +0.01
49.654.0
20.621.3
Dec.15 Dec.16
47.6 48.2 49.3 50.1 53.3
12.2 15.218.9 19.2 17.7
Mar.13 Mar.14 Mar.15 Mar.16 Sep.16
Overseas offices and offshore banking accountsDomestic offices (excluding offshore banking account)
59.863.4
68.3
(SMBC non-consolidated)(JPY tn)
75.470.269.3
*1, 2
*1*1
[4.0]*3
[1.2]*3[1.3]*3
71.1
*1
[4.6]*3
*1 Exchange rates using TTM as of Dec. 2015: USD 1 = JPY 120.53, Mar. 2016: USD 1 = JPY 112.62, Sep. 2016: USD 1 = JPY 101.05 and Dec. 2016: USD 1 = JPY 116.49*2 Balance as of Dec. 2016 includes balance of SMBC Canada Branch which was newly opened in Nov. 2016 and took over business of wholly-owned subsidiary SMBC
of Canada *3 Of which loans to the Japanese government, etc. and SMFG *4 Managerial accounting basis *5 SMBC non-consolidated *6 Global Corporate Banking Division *7 Sum of Corporate Banking Division and Small and Medium Enterprises Banking Division*8 Sum of SMBC, SMBC Europe and SMBC (China) *9 Sum of loans, trade bills, and securities *10 After adjustments for exchange rates, etc.

II. 3Q, FY3/2017 performance
Ref: Net fees and commissions
(JPY bn) FY3/16 1H, FY3/17
YOYChange*3
Loan syndication 45.6 19.7 +2.8Structured finance 26.5 20.4 +11.6Asset finance*4 16.7 9.0 +1.5Sales of derivatives products 26.4 11.2 +1.1
Income related to domestic corporate business 115.2 60.3 +17.0
Investment trusts 25.7 9.6 (5.6)Pension-type insurance 10.9 2.8 (2.0)Single premium type permanent life insurance 20.3 2.3 (8.3)Level premium insurance 6.9 3.1 (0.1)
Income related to domestic consumer business 63.8 17.8 (16.0)
Money remittance, electronic banking 92.6 46.4 (0.1)Foreign exchange 52.2 26.6 +0.5
Domestic Non-interest income 316.0 146.5 +7.9IBU’s loan related income*5 72.7 28.3 (2.5)
IBU’s Non-interest income*5 130.6 55.4 (3.0)
Non-interest income 446.6 201.9 +4.9
Income on domestic loans 421.2 211.7 (4.1)Income on domestic yen deposits 98.7 32.7 (1.3)IBU’s interest related income*5 225.4 92.8 +0.9
Interest income 827.5 373.1 (6.4)
Gross banking profit of SMBC’s Marketing units 1,274.1 575.0 (1.5)
Reference: Gross banking profit of SMBC’s Marketing units*2Reference: Gross banking profit of SMBC’s Marketing units*2
of which:
of which:
of which:
(JPY bn) FY3/16 1H, FY3/17 YOY
change
SMFG consolidated*1 1,003.8 464.1 (28.8)
SMBC 358.6 151.9 (12.0)
Sumitomo Mitsui Card 190.0 98.0 +5.0
SMBC Nikko Securities 165.0 77.0 (14.0)
Cedyna 116.0 59.0 +1.0
SMBC Consumer Finance
59.0 32.0 +4.0
SMBC Friend Securities 27.0 10.0 (4.0)
of which:
*1 Numbers excluding SMBC are rounded *2 Managerial accounting basis *3 After adjustments of interest rates and exchange rates, etc.*4 Profit from real estate finance, securitization of monetary claims, etc. *5 International Banking Unit
8

0.990.90 0.92
0.620.52 0.56
1.15% 1.03% 0.99%
0.78% 0.64% 0.64%0%
2%
4%
6%
8%
10%
0.0
0.4
0.8
1.2
1.6
2.0
2.4
Mar. 13 Mar. 14 Mar. 15 Mar. 16 Sep. 16 Dec. 16
千
SMFG consolidated (left axis)SMBC non-consolidated (left axis)SMFG consolidated (right axis)SMBC non-consolidated (right axis)
II. 3Q, FY3/2017 performance
Ref: NPLs and Total credit cost
7.8
102.8
68.0
(80.1)
(3.2) (2.4)1bp
12bp
(10)bp
(0)bp
(30)
(20)
(10)
0
10
20
30
40
50
60
(200)
(100)
0
100
200
300
400
FY3/12 3/13 3/14 3/15 3/16
SMFG consolidated (left axis)SMBC non-consolidated (left axis)SMFG consolidated (right axis)SMBC non-consolidated (right axis)
3Q, 3/17
NPLs and NPL ratio*1 Total credit cost and Total credit cost ratio*3
(JPY tn) (JPY bn) (bp)
Claims on borrowers requiring caution*2 1.6 1.6 1.4 1.2 1.4
Total claims 73 79 80 81 87
(JPY tn)SMFG consolidated
SMBC non-consolidated
*1 NPL ratio = NPLs based on the Financial Reconstruction Act (excluding normal assets) / Total claims*2 Excludes claims to Substandard borrowers*3 Total credit cost ratio = Total credit cost / Total claims
Total claims 79 85 87 87 93
9

III Business strategy

11
III. Business strategy
Wholesale Business
(SMBC non-consolidated)
(SMBC non-consolidated)
0.4%
0.6%
0.8%
1.0%
1.2%
1.4%
Mar. 13 Sep. 13 Mar. 14 Sep. 14 Mar. 15 Sep. 15 Mar. 16 Sep. 16
Mid-sized corporations and SMEs (CBD, SMEBD*)
Large corporations (GLCBD)
FY3/14 FY3/16 FY3/17
* CBD : Corporate Banking Division* GLCBD : Global Corporate Banking Division
FY3/15
Apr. 13
Loan balance of Wholesale Banking Unit*1, 2
Loan balance and spreadLoan balance and spread
Domestic corporate loan spread*1, 3
* SMEBD: Small and Medium Enterprises Banking Division
Dec. 16
12
14
16
1Q 2Q 3Q 4Q 1Q 2Q 3Q 4Q 1Q 2Q 3Q 4Q 1Q 2Q 3Q
(JPY tn)
Mid-sized corporations and SMEs (CBD*)Large corporations (GLCBD*)
Bank-securities collaboration (accumulated no. of casesvia referral / intermediary services from SMBC to SMBC Nikko)Bank-securities collaboration (accumulated no. of cases
via referral / intermediary services from SMBC to SMBC Nikko)
Asset management Investment banking
League tables (Apr. -Dec. 2016)*4League tables (Apr. -Dec. 2016)*4
Rank Mktshare
Global equity & equity-related (book runner, underwriting amount)*5, 6 #2 18.6%
JPY denominated bonds(lead manager, underwriting amount)*5, 7 #3 16.8%
Financial advisor (M&A, No. of deals)*5, 8 #2 4.1%
IPO (lead manager, No. of deals)*9 #3 16.4%
(Thousand) (Thousand)
0
10
20
30
Jun.15 Sep.15 Dec.15 Mar.16 Jun.16 Sep.16 Dec.160
2
4
6
8
Jun.15 Sep.15 Dec.15 Mar.16 Jun.16 Sep.16 Dec.16
*1 Managerial accounting basis. Excludes loans to the Japanese government, etc. Managerial accounting rules was revised in Apr. 2014. Figures for FY3/14 were recalculated based on the new rules *2 Quarterly average *3 Monthly average loan spread of existing loans *4 SMBC Nikko Securities for Global equity & equity-related, JPY denominated bonds and IPO. SMFG for Financial advisor *5 Source: SMBC Nikko, based on data from Thomson Reuters *6 Japanese corporate related only. Includes overseas offices *7 Consisting of corporate bonds, FILP agency bonds, municipality bonds for proportional shares as lead manager, and samurai bonds *8 Japanese corporate related only. Group basis *9 Excludes REIT IPO. Includes overseas offices. Source: Thomson Reuters

0
1
2
3
4
5
Jun. 13
Sep.13
Dec.13
Mar. 14
Jun. 14
Sep.14
Dec.14
Mar. 15
Jun. 15
Sep.15
Dec.15
Mar. 16
Jun.16
Sep.16
Dec.16
III. Business strategy
Retail business
12*1 Retroactive adjustment was introduced to assets under management (of which bonds) at SMBC Nikko since Jun. 2014*2 Assets under management at SMBC Nikko via referral or financial instruments intermediary services from SMBC to SMBC Nikko. Includes assets transferred from
SMBC Friend Securities to SMBC Nikko in Jan. 2011 upon integrating SMBC Friend’s collaborative business with SMBC into SMBC Nikko and assets at the Private Banking division of SMBC Nikko *3 Converted into USD at respective period-end exchange rates
Promote customer-oriented consulting based on the bank-securities integration strategy
0
500
1,000
Mar.14 Sep.14 Mar.15 Sep.15 Mar.16 Sep.16
SMBC Nikko fund wrap
SMBC fund wrap
(JPY bn)
0
5
10
15
Mar.14 Sep.14 Mar.15 Sep.15 Mar.16 Sep.16
SMBC Trust Bank
SMBC
(USD bn)
Integration of PRESTIA(Nov.15)
[+6%]
[+29%]
[vs Mar.16]
Foreign deposit balance(SMBC (Individuals)+SMBC Trust Bank)*3
Foreign deposit balance(SMBC (Individuals)+SMBC Trust Bank)*3
Topped JPY1 tn mark
among deposits increased with special ratesapprox. 30% of customers were first time investorsapprox. 60% of funds were used to buy other investment
products after maturity
Balance of Fund wrap (SMBC+SMBC Nikko)Balance of Fund wrap (SMBC+SMBC Nikko)Bank-securities collaboration in retail businessBank-securities collaboration in retail business
AuM through bank-securities collaboration*1, 2
(SMBC Nikko Securities)
Building up financial assets
Investment and succession
Active wealthmanagement needs
Asset and businesssuccession needs
28 mn accounts
0.7 mn accounts
2.8 mn accounts
SMBC Nikko Securities and SMBC Friend Securities plan to merge in Jan. 2018
Restructuring domestic private banking alliance scheme with Barclays From Apr. 2017, SMBC and SMBC Nikko will be responsible for business
operation, while products and services are provided by Barclays
(JPY tn)
Bank-securities retail integration・Initiated trial in May 2013・Expanded to all offices in Jul. 2014

III. Business strategy
International business (1) Evolving the business model
13
Improve profitability by promoting cross-selling and executing nimble portfolio management
Be selective in risk taking. Pay attention to credit control and funding
Non-Japanese
JapaneseProject finance
Tradefinance
Japanese/non-Japaneselarge corporateclientsapprox. 60%
High profit assets・Aircraft / Railcar leasing・Subscription finance*1
・Middle market business, etc.
approx. 20%
Trade finance,Project finance,etc.approx. 20%
Promote cross-selling
Enhance business with non-Japanese core clients Transactions connecting Japanese and
non-Japanese corporations
Nimble portfolio management
Increasing high profit assets Asset turn over Enhancing Origination & Distribution model
International Banking Unit’s portfolio (Sep. 2016)International Banking Unit’s portfolio (Sep. 2016)
0123
全体 Client-focused Credit-focused プロファイ・トレード
(%)
IBUTotal
High profitassets
Trade finance,Project finance,
etc.
Japanese/non-Japanese large
corporate clients
Average margin*2
*1 Extending loans to funds based on commitments from investors*2 Excludes up-front fees*3 Subject to certain conditions and adjustments
Acquisition of American Railcar Leasing (ARL)
Build a more diversified high-quality portfolio by enhancing our transportation leasing business SMBC Rail Services will acquire ARL, the 6th largest railcar
leasing company in the U.S.; Expected to close 1H 2017 Asset size: approx. USD 3.4 bn (approx. 34 thousand
railcars)*3
Purchasing price of the entity is expected to be lower than the appraisal value of the railcars conducted by a third party. Therefore, impact to SMFG CET1 capital ratio is minimal
(USD bn)CDs & CP : less than 3 monthsCDs & CP : 3 months or moreDeposits*5
14
III. Business strategy
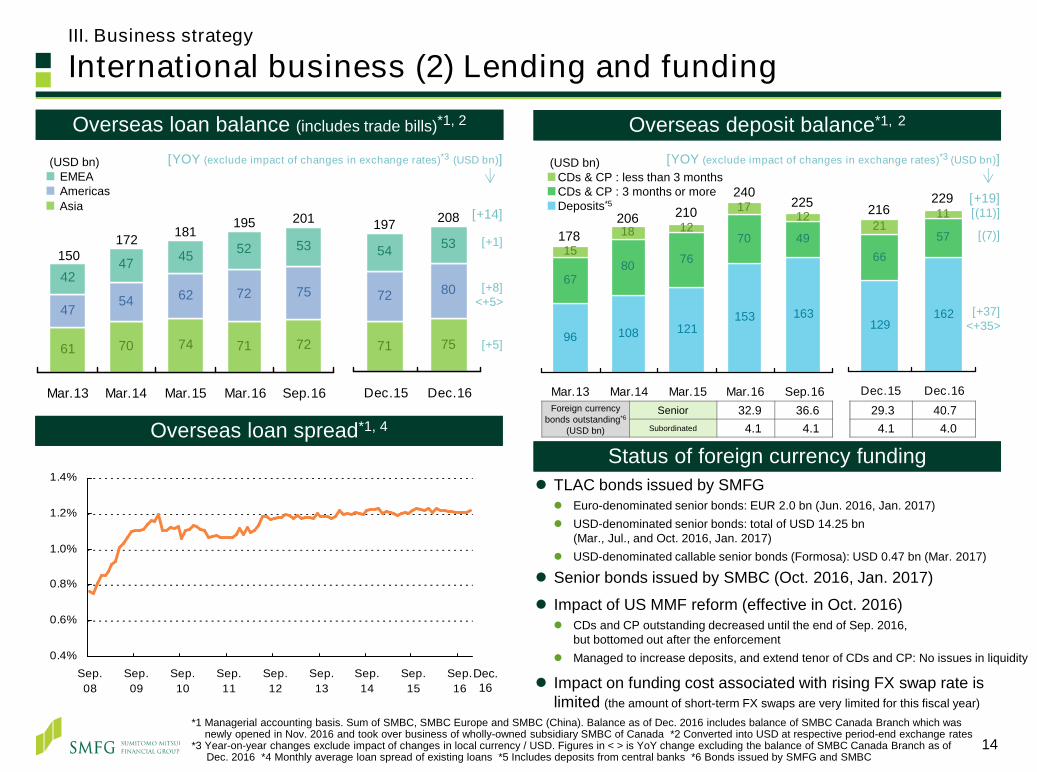
International business (2) Lending and fundingOverseas loan balance (includes trade bills)*1, 2Overseas loan balance (includes trade bills)*1, 2
71 75
72 80
54 53
Dec.15 Dec.16
197 208 [+14]
[+1]
[+8]<+5>
[+5]
Foreign currency bonds outstanding*6
(USD bn)
Senior 32.9 36.6 29.3 40.7Subordinated 4.1 4.1 4.1 4.0
Overseas deposit balance*1, 2Overseas deposit balance*1, 2
96 108 121
6780 76
70 4915
18 1217
12
153 163
Mar.13 Mar.14 Mar.15 Mar.16 Sep.16
240
178206 210
[+19]
[+37]<+35>
[YOY (exclude impact of changes in exchange rates)*3 (USD bn)]
129162
6657
2111
Dec.15 Dec.16
216
Overseas loan spread*1, 4Overseas loan spread*1, 4
0.4%
0.6%
0.8%
1.0%
1.2%
1.4%
Sep.08
Sep.09
Sep.10
Sep.11
Sep.12
Sep.13
Sep.14
Sep.15
Sep.16
61 70 74 71 72
47 54 62 72 7542
47 45 52 53
Mar.13 Mar.14 Mar.15 Mar.16 Sep.16
(USD bn)
Asia
EMEAAmericas
150
181172195
[YOY (exclude impact of changes in exchange rates)*3 (USD bn)]
229
[(7)]
[(11)]
Dec.16
*1 Managerial accounting basis. Sum of SMBC, SMBC Europe and SMBC (China). Balance as of Dec. 2016 includes balance of SMBC Canada Branch which was newly opened in Nov. 2016 and took over business of wholly-owned subsidiary SMBC of Canada *2 Converted into USD at respective period-end exchange rates
*3 Year-on-year changes exclude impact of changes in local currency / USD. Figures in < > is YoY change excluding the balance of SMBC Canada Branch as ofDec. 2016 *4 Monthly average loan spread of existing loans *5 Includes deposits from central banks *6 Bonds issued by SMFG and SMBC
Status of foreign currency fundingStatus of foreign currency funding TLAC bonds issued by SMFG Euro-denominated senior bonds: EUR 2.0 bn (Jun. 2016, Jan. 2017) USD-denominated senior bonds: total of USD 14.25 bn
(Mar., Jul., and Oct. 2016, Jan. 2017) USD-denominated callable senior bonds (Formosa): USD 0.47 bn (Mar. 2017)
Senior bonds issued by SMBC (Oct. 2016, Jan. 2017)
Impact of US MMF reform (effective in Oct. 2016) CDs and CP outstanding decreased until the end of Sep. 2016,
but bottomed out after the enforcement Managed to increase deposits, and extend tenor of CDs and CP: No issues in liquidity
Impact on funding cost associated with rising FX swap rate is limited (the amount of short-term FX swaps are very limited for this fiscal year)
201225

Introducing new services rapidly by pursuing open innovation Establishing SMFG Silicon Valley Digital Innovation Laboratory and SMBC Silicon Valley
Representative Office to enhance its group-wide ability to gather and disseminate information in the region
III. Business strategy
Digital innovation
15
Low cost feature-phone based financial services for mass market
Smartphone based digital banking services for digitally savvy high-net-worth/middle classLaunched in
Aug. 2016
Launched inMar. 2015
Launched new digital banking servicesin two different client segment
BTPNBTPNBiometric IdentificationBiometric Identification
Offering biometrics identification app for smartphones Collaboration with NTT DATA and Daon
Identification intermediary service
Conducting POC(proof of concept) at the employee cafeterias of SMFGgroup companies
Using the world’s most accurate facial recognition authentication technology, NEC’s “NeoFace”
Commercialize facial recognition payments
Aim to expand business model in other Asian countries

Corporate governanceIV
17
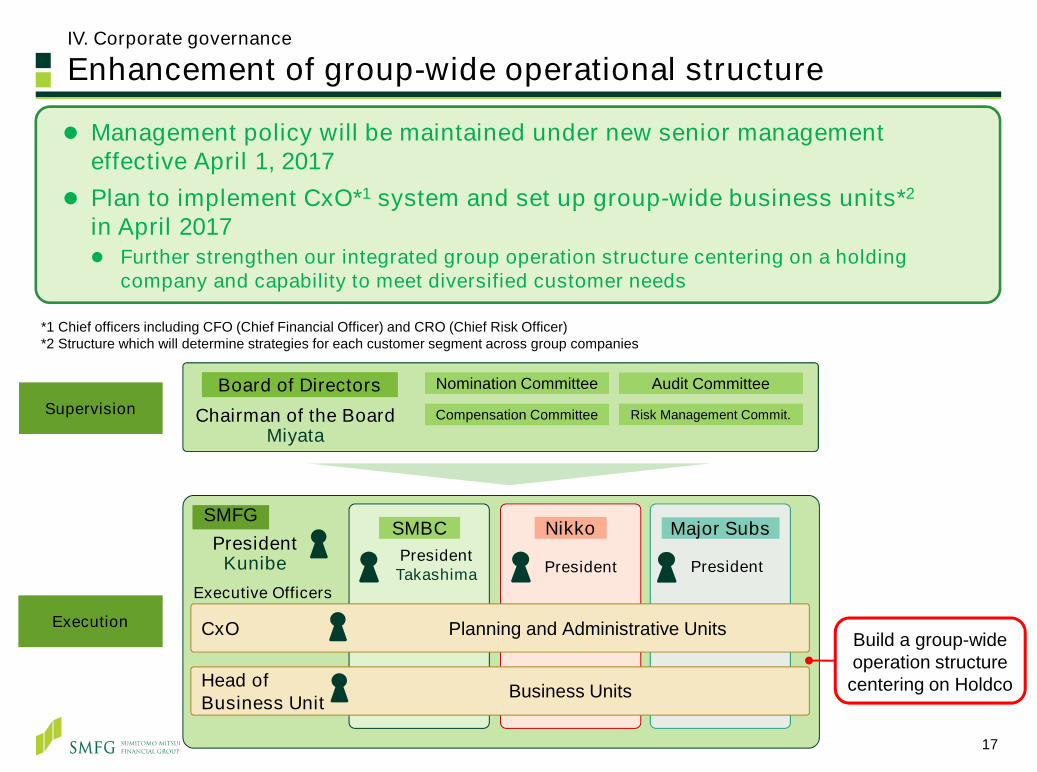
Board of Directors Nomination CommitteeSupervision
Executive Officers
Major Subs
CxO Planning and Administrative Units
Head of Business Unit
SMFGNikkoSMBC
PresidentTakashima
Build a group-wide operation structure centering on Holdco
PresidentKunibe
Execution
Compensation Committee
Audit Committee
Risk Management Commit.
Business Units
President President
Management policy will be maintained under new senior management effective April 1, 2017
Plan to implement CxO*1 system and set up group-wide business units*2
in April 2017 Further strengthen our integrated group operation structure centering on a holding
company and capability to meet diversified customer needs
*1 Chief officers including CFO (Chief Financial Officer) and CRO (Chief Risk Officer)*2 Structure which will determine strategies for each customer segment across group companies
IV. Corporate governance
Enhancement of group-wide operational structure
Chairman of the BoardMiyata

18
Business execution+Supervisory
Management Committee(Internal Directors + Executive Officers)
Board of Corporate Auditors
Management CommitteeMake decisions on the execution of business*2
Risk Management(Internal 3, External 4)*1
Compensation(Internal 3, External 5)*1
Nomination(Internal 1, External 5)*1
Audit(Internal 4, External 3)*1
Internal Committees (voluntary)
Departments Audit Dept.
Cooperation
Nomination(Majority External)*1
Board of Directors
Jun.2017
Focus on Supervisory
Reporting line(Includes election and dismissal of personnel)
Board of Directors
Internal Committees (Statutory)
Compensation(Majority External)*1
Risk ManagementAudit
(Majority External)*1
(voluntary)
Departments Audit Dept.
SMFG decided to transform into a Company with Three Committees, which is globally recognized and has affinity to international banking regulation and supervision in order to further enhance its corporate governance framework (Subject to approval by ordinary general meeting of shareholders scheduled in Jun. 2017)
Strengthen the supervisory function of the Board of Directors and expedite execution of operations by leveraging the monitoring mechanism of the new framework
*1 Number of Internal and External directors*2 Excludes authorities made to Board of Directors by law
IV. Corporate governance
Transformation to a company with Three Committees

Capital policyV

V. Capital policy
Basic capital policy
Return toshareholders
Growthinvestments
Maintain financialsoundness
Sustainable growth of
shareholder value
Secure Common Equity Tier 1 capital ratio of at least around 10% Prepare for the tightening of international financial regulations
and downside risks in the economy
Enhance shareholder return by measures such as raising dividend per share in a stable manner
Payout ratio: Realize 30%(FY3/17 target 30.2%)
Achieve higher profitability and growth with a focus on capital efficiency, risk-return and cost-return
ROE target: around 10%
20
Our commitment : Raise dividend per share in a stable manner(FY3/17 forecast) DPS: JPY 150; Payout ratio: 30.2%
Capital adequacy : A meeting of the GHOS* to finalise Basel III reforms, originallyplanned for early January 2017, was postponed. We have not changed the view that our risk-weighted assets inflation caused by the new regulations has potential to be higher than the mid-20% range but will be manageable by takingvarious initiatives
* The Group of Central Bank Governors and Heads of Supervision, the oversight body of the Basel Committee on Banking Supervision
V. Capital policy
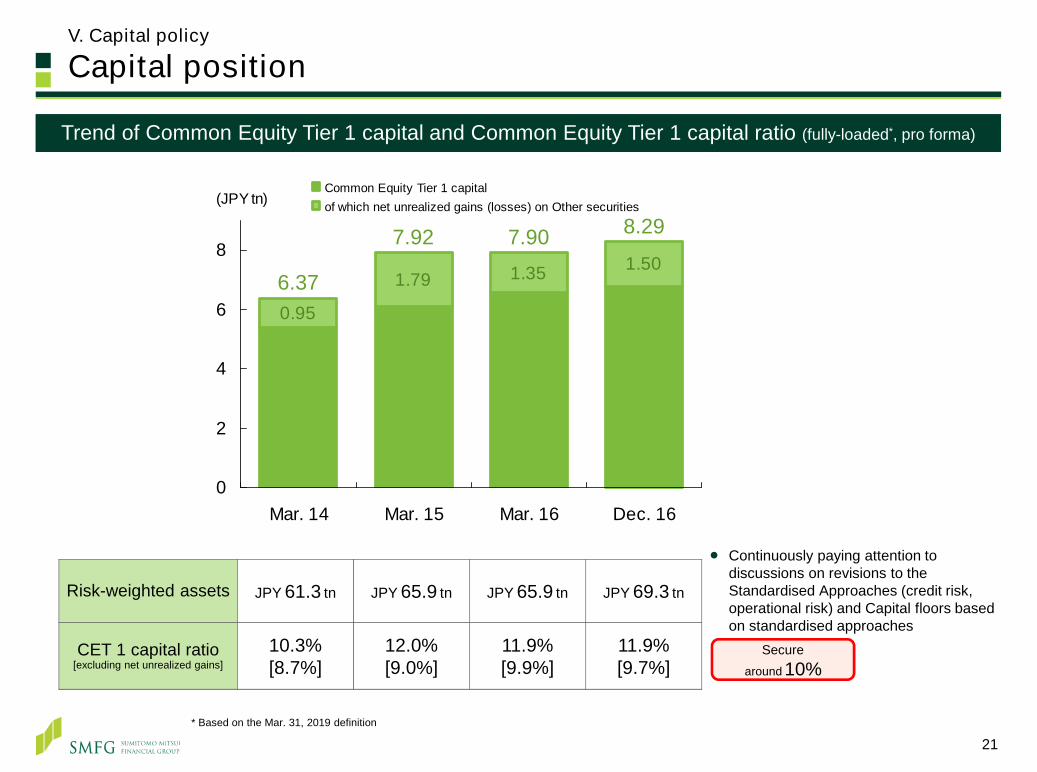
Capital position
Risk-weighted assets JPY 61.3 tn JPY 65.9 tn JPY 65.9 tn JPY 69.3 tn
CET 1 capital ratio[excluding net unrealized gains]
10.3%[8.7%]
12.0%[9.0%]
11.9%[9.9%]
11.9%[9.7%]
Trend of Common Equity Tier 1 capital and Common Equity Tier 1 capital ratio (fully-loaded*, pro forma)Trend of Common Equity Tier 1 capital and Common Equity Tier 1 capital ratio (fully-loaded*, pro forma)
Continuously paying attention to discussions on revisions to the Standardised Approaches (credit risk, operational risk) and Capital floors based on standardised approaches
1.50
0.95
1.79 1.35
0
2
4
6
8
Mar. 14 Mar. 15 Mar. 16 Dec. 16
(JPY tn)Common Equity Tier 1 capitalof which net unrealized gains (losses) on Other securities
6.37
7.92 7.90 8.29
Securearound 10%
* Based on the Mar. 31, 2019 definition
21

V. Capital policy
Strategic shareholdings
* Amount is reduced after excluding impact of the termination of hedge transactions
* SMFG consolidated basis Book value of domestic listed stocks / Common Equity Tier 1 capital (CET1)(Basel III fully-loaded basis, excluding net unrealized gains on Other securities)
Reduction results (book value)
Reduction pace: JPY 100 bn annually (book value)
Reduction plan
Transition and reduction plan of strategic shareholdings(SMFG consolidated basis)
Toward a levelappropriatefor G-SIFIs
0 %2 5%5 0%7 5%
CET1(Basel III fully-loaded basis, excluding net unrealized gains on Other securities)
Book value of domestic listed stocks within Other securities
Ratio of Stocks-to-CET1 capital
6.54
1.80
6.556.405.97
5.356.09
1.751.781.79 1.7923%
27%28% 27%30%
33%
0
2
4
6
8
Apr.01 Mar.14Mar.15Sep.15Mar.16Sep.16
0 %
25 %
50 %
75 %
Reduce the ratio by half within approx. 5 years
to 14% by around 2020
*
Reduction plan(announced Nov. 2015)
~ ~
We aim to have the assurance of reducing the Ratio of Stocks-to-CET1 capital* by half within approximately 5 years (beginning at Sep. 30, 2015), which is reducing book value of up to about 30% or about JPY 500 bn of domestic listed stocks
The current outstanding of consent of sales received from clients is in line with the reduction pace of JPY 100 bn annually
Sales of listed stocks in Apr.-Dec. 2016: approx. JPY 75 bn (the aggregated amount since Sep. 30, 2015: approx. JPY 88 bn)
Consent of sales from clients (outstanding) as of Dec. 31, 2016: approx. JPY 110 bn (the aggregated amount since Sep. 30, 2015: approx. JPY 210 bn)
1Sep.15 Mar.16 Sep.16 Mar.17
(JPY tn)
1.80 1.79
0
1.75
Up toabout 30%
approx. 5 years
~~
22
23
V. Capital policy
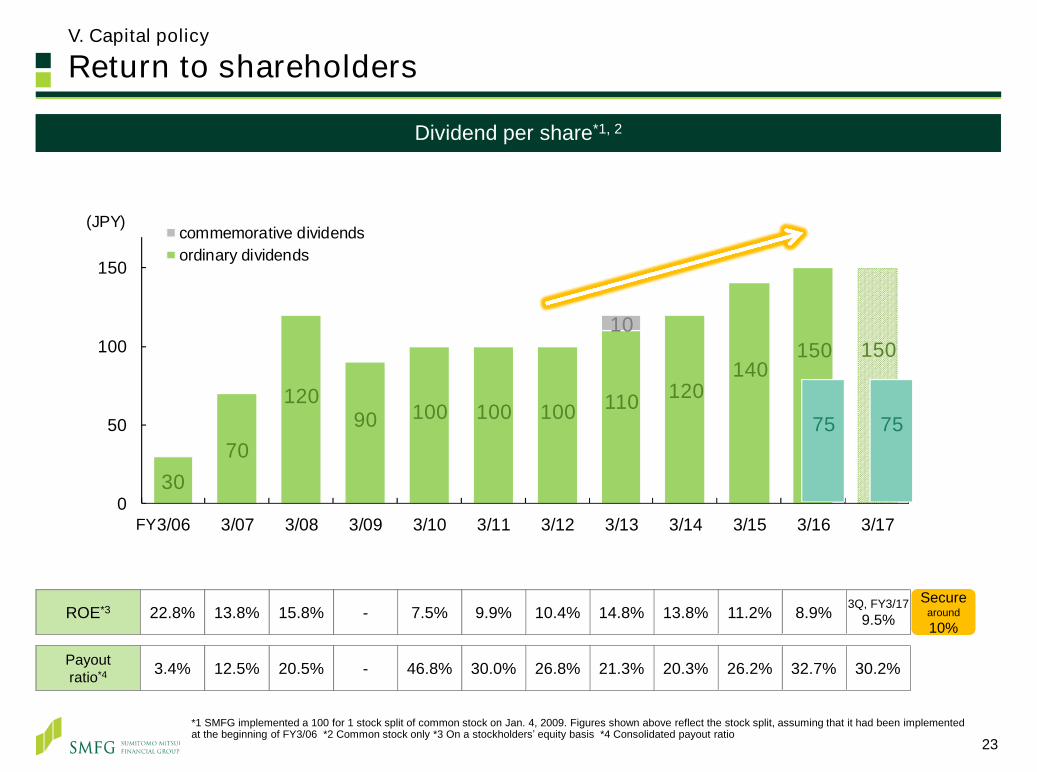
Return to shareholders
FY
Dividend per share*1, 2Dividend per share*1, 2
ROE*3 22.8% 13.8% 15.8% - 7.5% 9.9% 10.4% 14.8% 13.8% 11.2% 8.9% 3Q, FY3/179.5%
Payoutratio*4 3.4% 12.5% 20.5% - 46.8% 30.0% 26.8% 21.3% 20.3% 26.2% 32.7% 30.2%
*1 SMFG implemented a 100 for 1 stock split of common stock on Jan. 4, 2009. Figures shown above reflect the stock split, assuming that it had been implemented at the beginning of FY3/06 *2 Common stock only *3 On a stockholders’ equity basis *4 Consolidated payout ratio
Securearound 10%
3070
12090 100 100 100 110 120
140150 150
10
0
50
100
150
3/06 3/07 3/08 3/09 3/10 3/11 3/12 3/13 3/14 3/15 3/16 3/17
commemorative dividendsordinary dividends
(JPY)
75 75

Closing remarks
3Q, FY3/2017 financial results were on track with the annual target; Showed steady progress in strengthening major businesses, while taking risk-sensitive approach in certain areas
I
IV We have a proven track record of steadily increasing dividend per share.FY3/2017 forecast is dividend per share 150 yen with a payout ratio of 30.2%
III RWA inflation caused by the new regulations has potential to be higher than the mid-20% range but will be manageable by taking various initiatives- Focusing on improving “capital”, “asset” and “cost” efficiencies
Management policy will be maintained under new senior managementII
24

Appendix

26
Group structure*1
Japan Research Institute100% Other business
SMBC Friend Securities
100%
100%
Securities Services
SMBC Aviation Capital
60%
30%
40%
10%
Leasing
60%
Sumitomo Mitsui Card
Cedyna
SMBC Consumer Finance
100%
66%
100%
100%
34%
Consumer FinanceSMFG Card & Credit
Sumitomo Corporation
NTTdocomo
Daiwa SB Investments44%
60%
【No. of accounts: approx. 2.8 mn】
【No. of card holders: approx. 25 mn】
【No. of existing customers: approx. 17 mn】
【No. of accounts of unsecured loans: approx. 1.3 mn】
Became a subsidiary in Jun. 2012
Became a wholly-owned subsidiary in May 2011
Became a wholly-owned subsidiary in Apr. 2012
Sumitomo Mitsui Financial Group
JPY 180 tnConsolidated total assets
12.04%Consolidated Common Equity Tier 1 capital ratio
SMBC Trust Bank100% Became a wholly-owned subsidiary in Oct. 2013
SMFL Capital*3100%Became a wholly-owned subsidiary in Apr. 2016
*1 As of Sep. 30, 2016 for figures*2 As of Jan. 31, 2017*3 Changed name from GE Japan GK to SMFL Capital Company, Limited in Sep. 2016
Sumitomo Mitsui Finance and Leasing
Became a direct subsidiary of SMFG in Oct. 2016
SMBC Nikko Securities and SMBC Friend Securities plan to merge in Jan. 2018
Acquired Citibank Japan’s retail banking business in Nov. 2015
100%
Sumitomo Mitsui Asset ManagementBecame a subsidiary in Jul. 2016
Became a direct subsidiary of SMFG in Oct. 2016
SMBC Nikko SecuritiesBecame a wholly-owned subsidiary in Oct. 2009
JPY 148 tnAssets
JPY 99 tnDeposits
JPY 71 tnLoans
approx. 28 mnNo. of retail accounts
approx. 86,000No. of corporate loan clients
Sumitomo Mitsui Banking Corporation
Credit ratings*2
Moody’s S&P Fitch R&I JCR
A1/P-1 A/A-1 A/F1 AA-/a-1+ AA/J-1+
Credit ratings*2
Moody’s S&P Fitch R&I JCR
A1/P-1 A-/ - A/F1 A+/ - AA-/ -

27
FY3/03 1HFY3/17
SMBC’s domesticloan / deposit
related revenue35% 18%
Internationalbusiness(banking)
05% 15%
Group companies 18% 31%
Breakdown of contribution to Gross profit
2,904
1,417
0
500
1,000
1,500
2,000
2,500
3,000
3,500
3/03 3/04 3/05 3/06 3/07 3/08 3/09 3/10 3/11 3/12 3/13 3/14 3/15 3/16 3/17
FY 1H
SMFG’s consolidated Gross profitSMFG’s consolidated Gross profit(JPY bn)
0.5%
0.1%0.15% 0.1% / 0% / (0.1)%
3-tier system for BOJ’s account;
0.1% / 0% / (0.1)%
BOJ's policy interest rate
Changes in our business mix
Consolidated et business Consolidated net business profit basis: 33%

Earnings targets for FY3/2017
(JPY bn) FY3/16results
FY3/17targets1H YOY
change
Change from May
targets
Consolidated gross profit 2,904.0 1,417.5 2,905 +1.0 (95.0)
Total credit cost (102.8) (54.8) (180) (77.2) ±0.0
Ordinary profit 985.3 514.3 960 (25.3) (60.0)
Variance*2 237.4 34.0 220 (17.4) (80.0)
Profit attributable to owners of parent 646.7 359.2 700 +53.3 ±0.0
Variance*2 37.5 (38.9) 100 +62.5 (30.0)
Gross bankingprofit 1,534.3 914.0 1,640 +105.7 +10.0
Expenses*3 (805.5) (402.0) (815) (9.5) +10.0
Banking profit*4 728.8 512.0 825 +96.2 +20.0
Total credit cost 3.2 8.0 (50) (53.2) ±0.0
Ordinary profit 747.9 480.3 740 (7.9) +20.0
Net income 609.2 398.1 600 (9.2) +30.0
SMFG
cons
olid
ated
SMB
Cno
n-co
nsol
idat
ed
USD 9.5 bn*1
USD 16.2 bn*1
USD 5.9 bn*1
USD 7.3 bn*1
USD 6.9 bn*1
USD 8.2 bn*1
Assumption of earnings targets*6Assumption of earnings targets*6
USD 28.7 bn*1
*1 Converted into USD at period-end exchange rate of USD 1 = JPY 101.05 *2 SMFG consolidated figures minus SMBC non-consolidated figures*3 Excludes non-recurring losses *4 Before provision for general reserve for possible loan losses *5 Sum of Sumitomo Mitsui Card, Cedyna, and SMBC Consumer Finance *6 Nominal GDP growth rate: FY3/2016 result was +2.2%; FY3/2017 forecast estimated by Japan Research Institute was +1.1% as of May 2016,
+1.1% as of Nov. 2016; Nikkei stock average: JPY 16,758.67 as of Mar. 31, 2016, JPY 16,449.84 as of Sep. 30, 2016
FY3/2017
3M TIBOR 0.06%
Federal funds target rate 0.75%
Exchange rateJPY/USD 100.00
JPY/EUR 110.00
Breakdown of increase in Consolidated gross profitBreakdown of increase in Consolidated gross profit
2,900
2,700
3,100
2,800
FY3/17target
FY3/16results
(JPY bn)
Marketing units(excl. income from
bank-securities collaboration)
Treasury Unit
Others
SMBC Nikko
Consumer finance/Credit card*5
2,9052,904
3,000
New consolidation(PRESTIA, SMFL Capital,
SMAM)
Mainly from impact ofyen appreciation,
declining interest rate
Decrease in Tax expenses and Profit attributable to non-controlling interests
Revised from original assumptions of USD 1 = JPY 110 and EUR 1 = JPY 125
Revised down by JPY 95 bn from the May target mainly due to yen appreciation and 1H results of SMBC Nikko Securities
28

Vision for the next decade and three-year management goals
29
We will become a global financial group that, by earning the highest trust of our customers, leads the growth of Japan and the Asian region
Develop and evolve client-centric business models for main domestic and international businesses
Build a platform for realizing Asia-centric operations and capture growth opportunities
Realize sustainable growth of top-line profit while maintaining soundness and profitability
Upgrade corporate infrastructure to support next stage of growth
Vision for the next decade
Three-year management goals
We will becomea truly Asia-centric institution
We will develop the best-in-classearnings base in Japan
We will realize true globalization and continue to evolve our business model
1
2
3
4

Progress on financial targets and topline target by business unit
30
FY3/16Apr.-Dec. 2016
FY3/17targets
GrowthGrowth rate of
Consolidated gross profit*1
+0.2% +0.0%*2 around +15%
Profit-ability
Consolidated ROE 8.9% 9.5%*2 around 10%
Consolidated net income RORA 0.97% 1.04%*2 around
1%
Consolidated overhead ratio 59.4% 61.9% in the mid
50%
Sound-ness
Common Equity Tier 1 capital ratio*3 11.9% 11.9% around
10%
Progress on financial targetsProgress on financial targets
*1 Consolidated gross profit increase in comparison with FY3/14 figure *2 Annualized*3 Basel III fully-loaded basis. Based on the definition as of March 31, 2019*4 FY3/17 targeted consolidated gross profit in comparison with FY3/14 figure. After adjustments for changes in interest rates and exchange rates, etc.
Consolidated gross profit*4
Inorganic growth
SMBC Nikko Securitiesaround
+ 30%
Retail Banking Unit
above
+ 10%
JPY 490 bn
Treasury Unit
JPY 340 bn (20)%
over
+ 15%
International Banking Unit
JPY 500 bn
of whichAsiaJPY 180 bn
around
+ 15%
Consumer finance / Credit card(includes income related to collaboration with SMBC)
JPY 540 bn
+20%
+15%
Wholesale Banking Unit
+10%JPY 720 bnFY3/14=100
3/15(plan)
3/17(plan)
3/16(plan)
of whichlarge corporationsJPY 320 bn
JPY 340 bn
(includes income related to collaboration with SMBC)
Organic growth

31
Breakdown of SMFG’s consolidated gross profit
(JPY bn) FY3/16 1H, FY3/171H, FY3/16 YOY change
SMFG’s consolidated gross profit* 1,512.7 2,904.0 1,417.5 (95.3)
Net interest income 782.7 1,422.9 660.6 (122.2)
SMBC 571.9 1,023.6 639.9 +68.0
SMBC Consumer Finance 78.0 157.0 80.0 +2.0
Trust fees 1.4 3.7 1.7 +0.3
Net fees and commissions 492.9 1,003.8 464.1 (28.8)
SMBC 163.9 358.6 151.9 (12.0)
Sumitomo Mitsui Card 93.0 190.0 98.0 +5.0
SMBC Nikko Securities 92.0 165.0 77.0 (14.0)
Cedyna 58.0 116.0 59.0 +1.0
Net trading income + Net other operating income 235.7 473.5 291.1 +55.5
SMBC 66.3 149.6 121.4 +55.0
SMBC Nikko Securities 70.0 128.0 70.0 (0.0)
Sumitomo Mitsui Finance and Leasing 62.0 123.0 67.0 +4.0
of which:
of which:
of which:
* In round numbers excl. SMBC
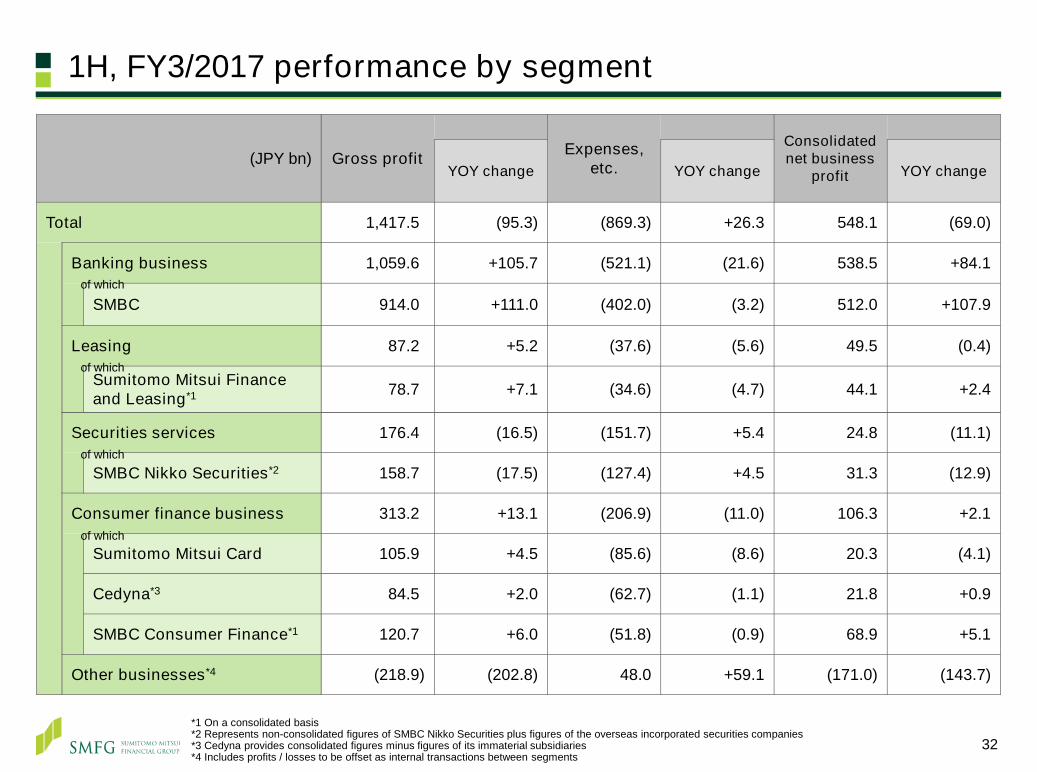
*1 On a consolidated basis *2 Represents non-consolidated figures of SMBC Nikko Securities plus figures of the overseas incorporated securities companies*3 Cedyna provides consolidated figures minus figures of its immaterial subsidiaries*4 Includes profits / losses to be offset as internal transactions between segments
1H, FY3/2017 performance by segment
32
(JPY bn) Gross profit Expenses, etc.
Consolidated net business
profitYOY change YOY change YOY change
Total 1,417.5 (95.3) (869.3) +26.3 548.1 (69.0)
Banking business 1,059.6 +105.7 (521.1) (21.6) 538.5 +84.1
SMBC 914.0 +111.0 (402.0) (3.2) 512.0 +107.9
Leasing 87.2 +5.2 (37.6) (5.6) 49.5 (0.4)
Sumitomo Mitsui Finance and Leasing*1 78.7 +7.1 (34.6) (4.7) 44.1 +2.4
Securities services 176.4 (16.5) (151.7) +5.4 24.8 (11.1)
SMBC Nikko Securities*2 158.7 (17.5) (127.4) +4.5 31.3 (12.9)
Consumer finance business 313.2 +13.1 (206.9) (11.0) 106.3 +2.1
Sumitomo Mitsui Card 105.9 +4.5 (85.6) (8.6) 20.3 (4.1)
Cedyna*3 84.5 +2.0 (62.7) (1.1) 21.8 +0.9
SMBC Consumer Finance*1 120.7 +6.0 (51.8) (0.9) 68.9 +5.1
Other businesses*4 (218.9) (202.8) 48.0 +59.1 (171.0) (143.7)
of which
of which
of which
of which

SMFG’s performance by business unit*1
*1 Managerial accounting basis. *2 After adjustments for changes in interest rates and exchange rates, etc.*3 Sum of Sumitomo Mitsui Card, Cedyna, and SMBC Consumer Finance*4 Consolidated net business profit = Consolidated gross profit - General and administrative expenses + Equity in gains (losses) of affiliates 33
(JPY bn) FY3/16 1H,FY3/17
1H,FY3/16
YOYchange*2
Wholesale Banking Unit
Gross profit 343.4 721.2 342.0 +13.7Expenses (147.6) (299.4) (144.2) (2.0)
Net business profit 195.8 421.8 197.8 +13.5
Retail Banking UnitGross profit 235.6 481.5 224.8 (9.1)Expenses (188.2) (383.2) (190.8) (2.1)
Net business profit 47.4 98.3 34.0 (11.2)
International Banking Unit
Gross profit 325.4 644.8 276.2 +6.7Expenses (124.9) (246.9) (113.3) (5.3)
Net business profit 200.5 397.9 162.9 +1.4
of whichMarketing units
Gross profit 904.4 1,847.5 843.0 +11.3Expenses (460.7) (929.5) (448.3) (7.6)
Net business profit 443.7 918.0 394.7 +3.7
of whichTreasury Unit
Gross profit 239.0 325.6 178.2 (62.1)Expenses (19.4) (38.8) (17.5) +1.2
Net business profit 219.6 286.8 160.7 (60.9)
of whichSumitomo Mitsui Finance and Leasing
of which Gross profit 71.6 142.8 78.7 +7.1of which Expenses (30.7) (63.5) (36.1) (5.4)
Net business profit 41.7 80.7 44.1 +2.4
of whichSMBC Nikko Securities
Gross profit 176.6 318.0 159.2 (14.3)Expenses (132.2) (257.2) (127.1) +3.3
Net business profit 44.4 60.8 32.1 (11.0)
of whichConsumer finance / Credit card*3
Gross profit 298.4 607.1 311.1 +12.5Expenses (189.4) (386.1) (200.1) (10.8)
Net business profit 109.0 221.0 111.0 +1.7
Total (SMFG consolidated)
Gross profit 1,512.7 2,904.0 1,417.5 (95.3)Expenses (852.2) (1,724.8) (882.0) (29.8)Ref: Gross profit - Expenses 660.5 1,179.2 535.5 (125.1)Equity in gains (losses) of affiliates (43.4) (36.2) 12.7 +56.1
Net business profit*4 617.1 1,142.9 548.1 (69.0)

SMBC’s performance by business unit*1
34
(JPY bn) FY3/16 1H, FY3/171H, FY3/16 YOYchange*2
Wholesale Banking Unit
Gross banking profit 257.6 545.3 257.7 +12.6
Expenses (101.9) (205.1) (99.6) 0.0
Banking profit 155.7 340.2 158.1 +12.6
Retail Banking Unit
Gross banking profit 182.9 372.8 169.1 (12.0)
Expenses (174.4) (354.1) (176.7) (1.7)
Banking profit 8.5 18.7 (7.6) (13.7)
International Banking Unit
Gross banking profit 180.7 356.0 148.2 (2.1)
Expenses (60.9) (116.5) (59.5) (4.2)
Banking profit 119.8 239.5 88.7 (6.3)
Marketing units
Gross banking profit 621.2 1,274.1 575.0 (1.5)
Expenses (337.2) (675.7) (335.8) (5.9)
Banking profit 284.0 598.4 239.2 (7.4)
Treasury Unit
Gross banking profit 222.5 293.6 164.3 (58.2)
Expenses (14.6) (29.1) (13.6) (0.4)
Banking profit 207.9 264.5 150.7 (58.6)
Headquarters
Gross banking profit (40.7) (33.4) 174.7 +170.7
Expenses (47.0) (100.7) (52.6) +3.1
Banking profit (87.7) (134.1) 122.1 +173.8
Total (SMBC non-consolidated)
Gross banking profit 803.0 1,534.3 914.0 +111.0
Expenses (398.8) (805.5) (402.0) (3.2)
Banking profit 404.2 728.8 512.0 +107.9
*1 SMBC non-consolidated. Managerial accounting basis *2 After adjustments for interest rates and exchange rates, etc.
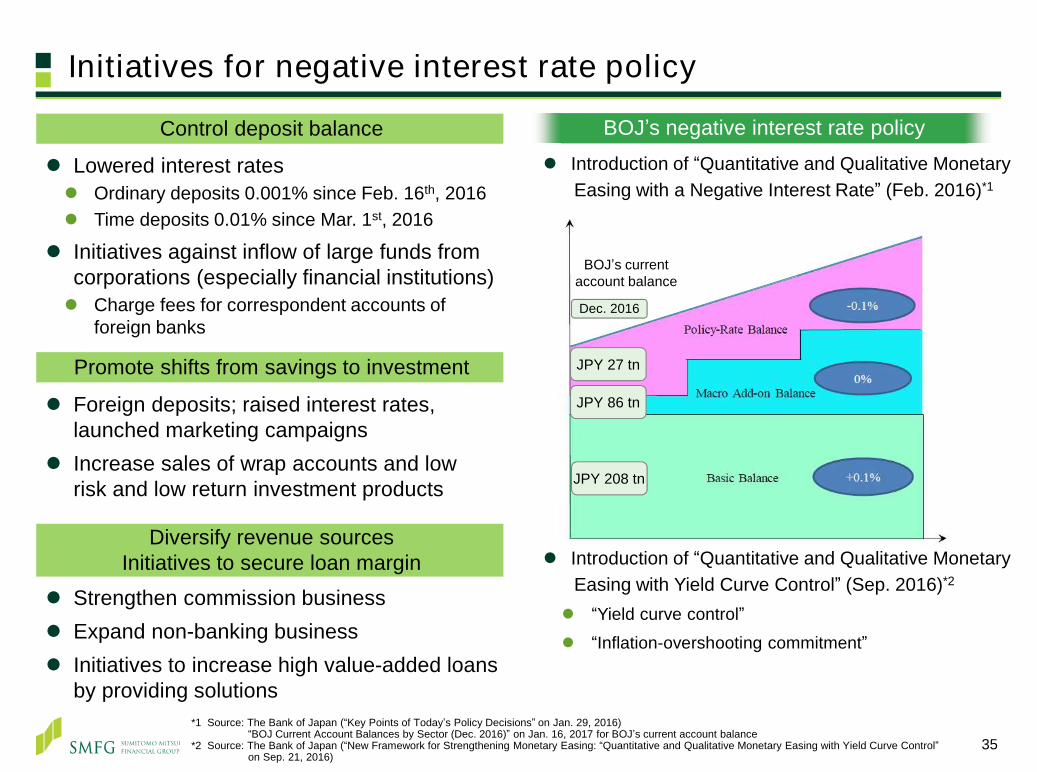
Initiatives for negative interest rate policy
35
Control deposit balance
Lowered interest rates Ordinary deposits 0.001% since Feb. 16th, 2016 Time deposits 0.01% since Mar. 1st, 2016
Initiatives against inflow of large funds fromcorporations (especially financial institutions) Charge fees for correspondent accounts of
foreign banks
Promote shifts from savings to investment
Foreign deposits; raised interest rates, launched marketing campaigns
Increase sales of wrap accounts and low risk and low return investment products
Diversify revenue sourcesInitiatives to secure loan margin
Strengthen commission business Expand non-banking business Initiatives to increase high value-added loans
by providing solutions
BOJ’s negative interest rate policy
*1 Source: The Bank of Japan (“Key Points of Today’s Policy Decisions” on Jan. 29, 2016)“BOJ Current Account Balances by Sector (Dec. 2016)” on Jan. 16, 2017 for BOJ’s current account balance
*2 Source: The Bank of Japan (“New Framework for Strengthening Monetary Easing: “Quantitative and Qualitative Monetary Easing with Yield Curve Control” on Sep. 21, 2016)
Introduction of “Quantitative and Qualitative Monetary Easing with a Negative Interest Rate” (Feb. 2016)*1
Introduction of “Quantitative and Qualitative Monetary Easing with Yield Curve Control” (Sep. 2016)*2
“Yield curve control”
“Inflation-overshooting commitment”
JPY 208 tn
JPY 86 tn
JPY 27 tn
Dec. 2016
BOJ’s current account balance
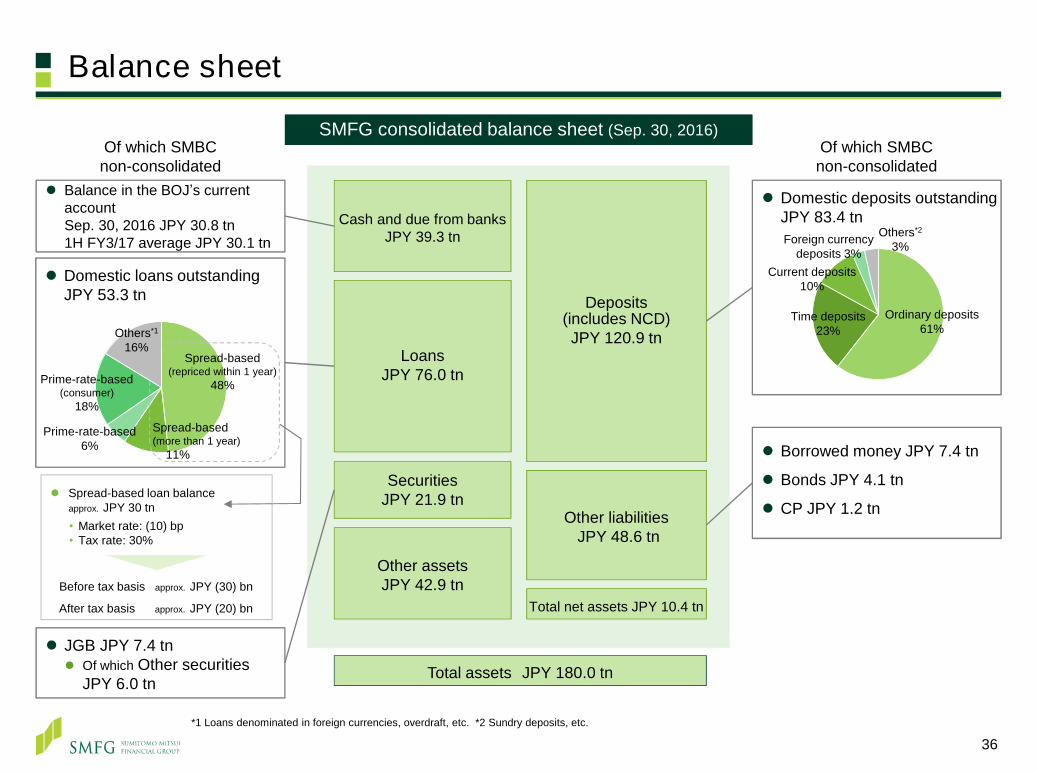
Domestic loans outstanding JPY 53.3 tn
Balance sheet
36
LoansJPY 76.0 tn
Deposits(includes NCD)JPY 120.9 tn
Other liabilitiesJPY 48.6 tn
Other assetsJPY 42.9 tn
SecuritiesJPY 21.9 tn
Total net assets JPY 10.4 tn
Cash and due from banksJPY 39.3 tn
SMFG consolidated balance sheet (Sep. 30, 2016)SMFG consolidated balance sheet (Sep. 30, 2016)
Balance in the BOJ’s current account Sep. 30, 2016 JPY 30.8 tn1H FY3/17 average JPY 30.1 tn
JGB JPY 7.4 tn Of which Other securities
JPY 6.0 tn
Domestic deposits outstanding JPY 83.4 tn
Total assets JPY 180.0 tn
Spread-based(repriced within 1 year)
48%
Prime-rate-based6%
Prime-rate-based(consumer)
18%
Others*1
16%
Ordinary deposits61%
Time deposits23%
Current deposits10%
Others*2
3%
Spread-based(more than 1 year)
11%
Of which SMBCnon-consolidated
*1 Loans denominated in foreign currencies, overdraft, etc. *2 Sundry deposits, etc.
Of which SMBCnon-consolidated
Borrowed money JPY 7.4 tn
Bonds JPY 4.1 tn
CP JPY 1.2 tn Spread-based loan balance
approx. JPY 30 tn• Market rate: (10) bp• Tax rate: 30%
Before tax basis approx. JPY (30) bn
After tax basis approx. JPY (20) bn
Foreign currencydeposits 3%

Gains (losses) on bonds
Gains (losses) on bondsGains (losses) on bonds
(JPY bn) FY3/16 1H, FY3/17
YOYChange
Gains (losses) on bonds 54.0 58.0 +37.5
Domestic operations 3.4 18.3 +18.9
International operations 50.6 39.7 +18.6
Interest rate, stock price and exchange rateInterest rate, stock price and exchange rate
SMBC non-consolidated
Gross banking profit of SMBC’s Treasury UnitGross banking profit of SMBC’s Treasury Unit
(1)
0
1
2
3
4
5 10Y US Treasury yields10Y JGB yields10Y German Bund yields
(%)
Exchange rate JPY / USD
70
80
90
100
110
120
130(JPY/USD)
8,000
10,000
12,000
14,000
16,000
18,000
20,000
(JPY)
Nikkei Stock Average
FY3/14 FY3/15 FY3/16 FY3/17 FY3/14 FY3/15 FY3/16 FY3/17 FY3/14 FY3/15 FY3/16 FY3/17
(JPY bn) FY3/16 1H, FY3/17
YOYchange
Gross banking profit of SMBC’s Treasury Unit 293.6 164.3 (58.2)
Interest rate of JGB, US Treasury and Bund
37

Treasury Unit
Diversification of earnings sources: composition of Gross profitDiversification of earnings sources: composition of Gross profit
FY3/16
Gross banking profit of SMBC’s Treasury UnitGross banking profit of SMBC’s Treasury Unit
Trading (FX, derivatives, etc.) Income gains (interest income, etc.) Capital gains (bonds, etc.)Equities Alternative investments
Gross profit: JPY 293.6 bn
31%
18%
Secure profits through flexible portfolio management adapting to the changing market environment
(JPY bn) FY3/11 FY3/12 FY3/13 FY3/14 FY3/15 FY3/16 1H, FY3/17
1H, FY3/16
Gross banking profit of SMBC’s Treasury Unit 330.7 319.3 295.3 325.5 354.0 222.5 293.6 164.3
FY3/12 FY3/14Gross profit: JPY 319.3 bn Gross profit: JPY 325.5 bn
36%
15%
30%
23%
FY3/02Gross profit: JPY 507.7 bn
75%
38
10%
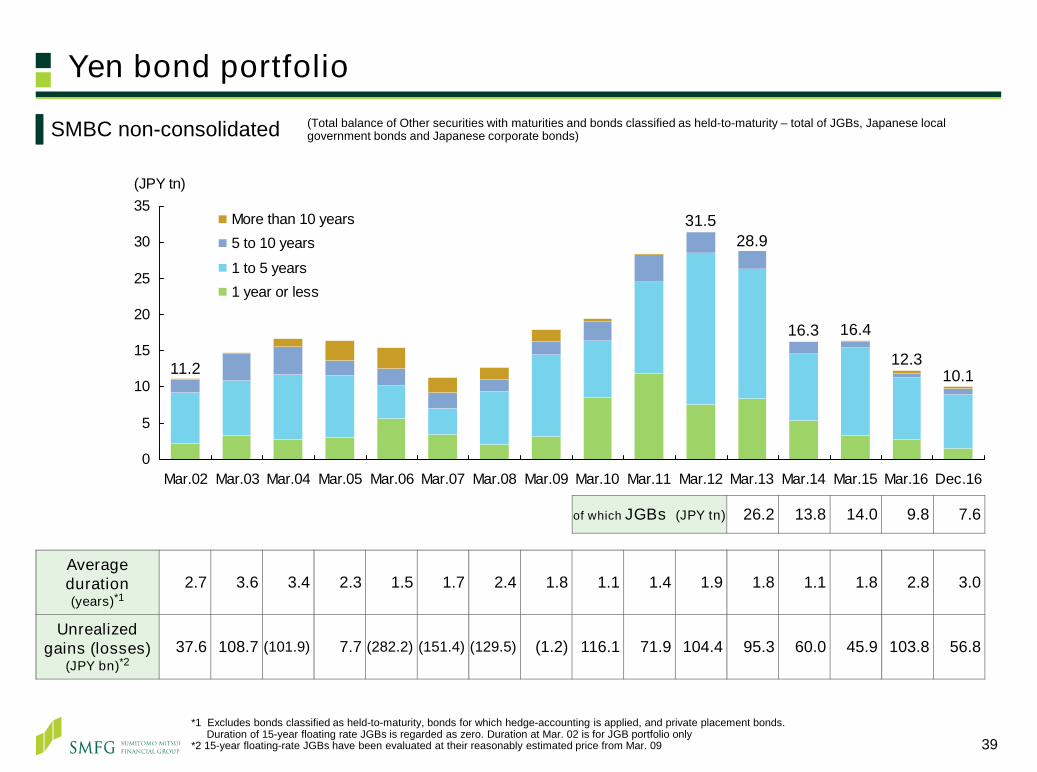
Yen bond portfolio
39
0
5
10
15
20
25
30
35
Mar.02 Mar.03 Mar.04 Mar.05 Mar.06 Mar.07 Mar.08 Mar.09 Mar.10 Mar.11 Mar.12 Mar.13 Mar.14 Mar.15 Mar.16 Dec.16
(JPY tn)
More than 10 years5 to 10 years
1 to 5 years1 year or less
SMBC non-consolidated
Average duration(years)*1
2.7 3.6 3.4 2.3 1.5 1.7 2.4 1.8 1.1 1.4 1.9 1.8 1.1 1.8 2.8 3.0
Unrealizedgains (losses)
(JPY bn)*237.6 108.7 (101.9) 7.7 (282.2) (151.4) (129.5) (1.2) 116.1 71.9 104.4 95.3 60.0 45.9 103.8 56.8
28.9
11.2
31.5
16.3 16.4
12.3
of which JGBs (JPY tn) 26.2 13.8 14.0 9.8 7.6
10.1
*1 Excludes bonds classified as held-to-maturity, bonds for which hedge-accounting is applied, and private placement bonds. Duration of 15-year floating rate JGBs is regarded as zero. Duration at Mar. 02 is for JGB portfolio only
*2 15-year floating-rate JGBs have been evaluated at their reasonably estimated price from Mar. 09
(Total balance of Other securities with maturities and bonds classified as held-to-maturity – total of JGBs, Japanese local government bonds and Japanese corporate bonds)

Bond portfolio
40
(JPY tn)
Mar. 2013 Mar. 2015 Mar. 2016 Dec. 2016
Balance sheet amount
Net unrealized gains (losses)
Balance sheet amount
Net unrealized gains (losses)
Balance sheet amount
Net unrealized gains (losses)
Balance sheet amount
Net unrealized gains (losses)
Yen-denominated bonds 30.4 0.17 17.1 0.07 13.2 0.13 10.9 0.07
of which JGB 27.0 0.12 14.3 0.03 10.3 0.08 8.0 0.03
Held-to-maturity 5.5 0.06 3.3 0.02 2.2 0.02 1.4 0.01
Others 21.5 0.06 11.0 0.01 8.1 0.06 6.6 0.02
Foreign bonds(Other securities) 5.6 0.03 6.5 0.03 6.1 (0.14)
SMFG
cons
olid
ated
Yen-denominated bonds 28.9 0.16 16.4 0.07 12.3 0.12 10.1 0.06
of which JGB 26.2 0.11 14.0 0.03 9.8 0.07 7.6 0.03
Held-to-maturity 5.5 0.06 3.3 0.02 2.0 0.01 1.2 0.01
Others 20.7 0.06 10.7 0.01 7.8 0.06 6.4 0.02
Foreign bonds(Other securities) 4.2 0.03 5.2 0.02 4.5 (0.13)
SMB
Cno
n-co
nsol
idat
ed
41
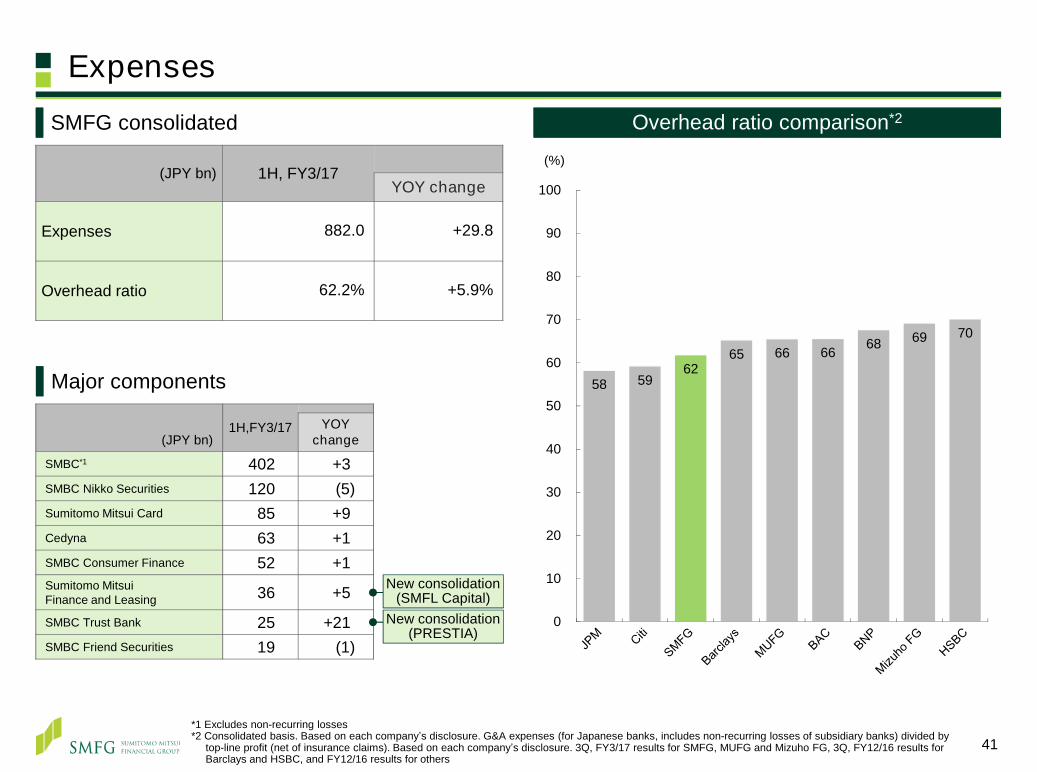
Expenses
(JPY bn) 1H, FY3/17YOY change
Expenses 882.0 +29.8
Overhead ratio 62.2% +5.9%
Overhead ratio comparison*2Overhead ratio comparison*2
*1 Excludes non-recurring losses *2 Consolidated basis. Based on each company’s disclosure. G&A expenses (for Japanese banks, includes non-recurring losses of subsidiary banks) divided by
top-line profit (net of insurance claims). Based on each company’s disclosure. 3Q, FY3/17 results for SMFG, MUFG and Mizuho FG, 3Q, FY12/16 results for Barclays and HSBC, and FY12/16 results for others
(JPY bn)1H,FY3/17 YOY
change
SMBC*1 402.0 +3.2SMBC Nikko Securities 120.0 (5)0Sumitomo Mitsui Card 85.0 +9.0Cedyna 63.0 +1.0SMBC Consumer Finance 52.0 +1.0Sumitomo Mitsui Finance and Leasing 36.0 +5.0
SMBC Trust Bank 25.0 +21.0SMBC Friend Securities 19.0 (1)0
Major components
New consolidation(SMFL Capital)
New consolidation(PRESTIA)
SMFG consolidated
58 5962
65 66 66 68 69 70
0
10
20
30
40
50
60
70
80
90
100
(%)

Expense control
42
Trend of consolidated gross profit and expensesTrend of consolidated gross profit and expenses
Gross profit JPY (435) bn
Expense control JPY (25) bn
Economy of scale Rent cost, advertisement cost,
etc.
Commonalize and commoditize Systems, marketing offices, etc.
Centralize and integrate Procurement, facility
maintenance, administrative work, etc.
Comparison withthe mid-term plan target
3.34
2.90 2.98 2.912.90
0.0
0.5
1.0
1.5
2.0
2.5
3.0
FY3/14 FY3/15 FY3/16 FY3/17 target
(兆円)
Gross profit (Consolidated, Mid-term plan)Gross profit (Consolidated, results & FY3/2017 targetExpense (Consolidated, Mid-term plan)Expense (Consolidated, results & target)
Consolidatedoverhead
ratio54.2% 55.7% 59.4% 3Q, FY3/2017
61.9%
+15%(JPY tn)
As topline growth is sluggish, we implemented group-wide cost reduction initiatives and optimal resource allocation in addition to cost cutting efforts taken by each company. Consolidated overhead ratio for this fiscal year is expected to be in the lower 60% range
Group-wide cost reduction measures
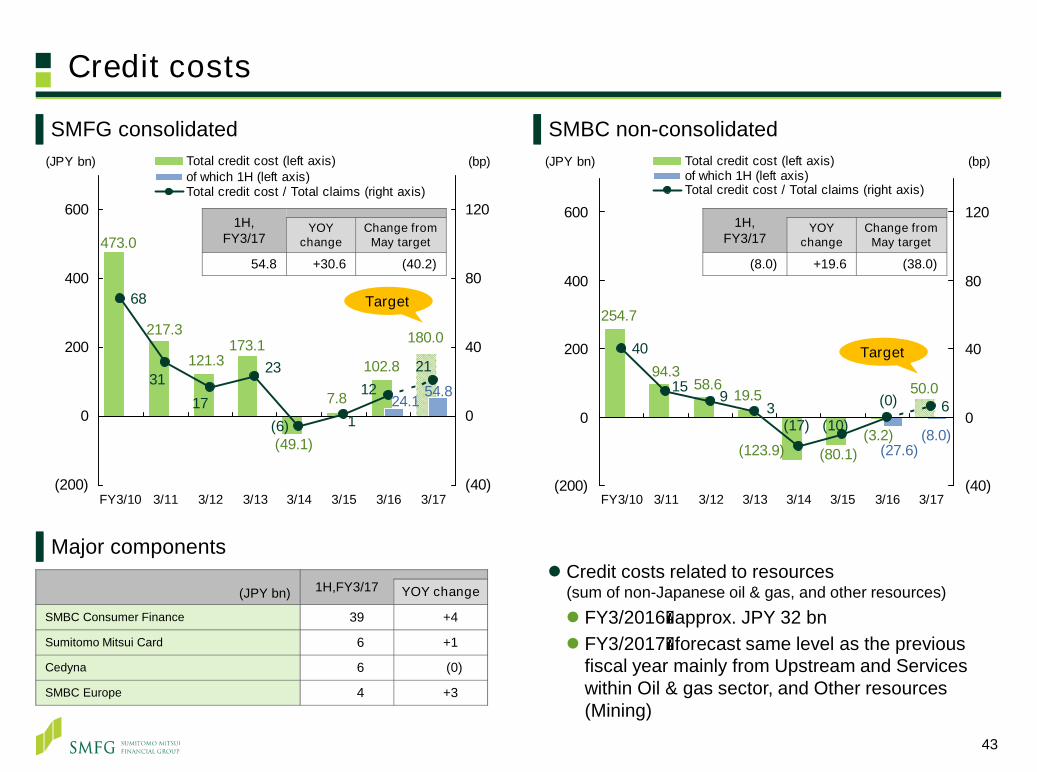
43
Credit costs
(8.0)
50.0
(3.2)(123.9)
94.358.6
254.7
19.5
(80.1) (27.6)
40
6(0)3915
(17) (10)
(200)
0
200
400
600
FY3/10 3/11 3/12 3/13 3/14 3/15 3/16 3/17
(JPY bn)
(40)
0
40
80
120
(bp)Total credit cost (left axis)of which 1H (left axis)Total credit cost / Total claims (right axis)
180.0217.3
121.3
473.0
173.1
(49.1)
7.8
102.8
24.1 54.8
68
1221
1
3123
17(6)
(200)
0
200
400
600
FY3/10 3/11 3/12 3/13 3/14 3/15 3/16 3/17
(JPY bn)
(40)
0
40
80
120
(bp)Total credit cost (left axis)of which 1H (left axis)Total credit cost / Total claims (right axis)
(JPY bn) 1H,FY3/17 YOY change
SMBC Consumer Finance 39.0 +4.0
Sumitomo Mitsui Card 6.0 +1.0
Cedyna 6.0 (0)
SMBC Europe 4.0 +3.0
1H, FY3/17
YOY change
Change from May target
(8.0) +19.6 (38.0)
SMFG consolidated SMBC non-consolidated
Major components
1H, FY3/17
YOY change
Change from May target
54.8 +30.6 (40.2)
Target
Target
Credit costs related to resources (sum of non-Japanese oil & gas, and other resources) FY3/2016:approx. JPY 32 bn FY3/2017:forecast same level as the previous
fiscal year mainly from Upstream and Services within Oil & gas sector, and Other resources (Mining)
44
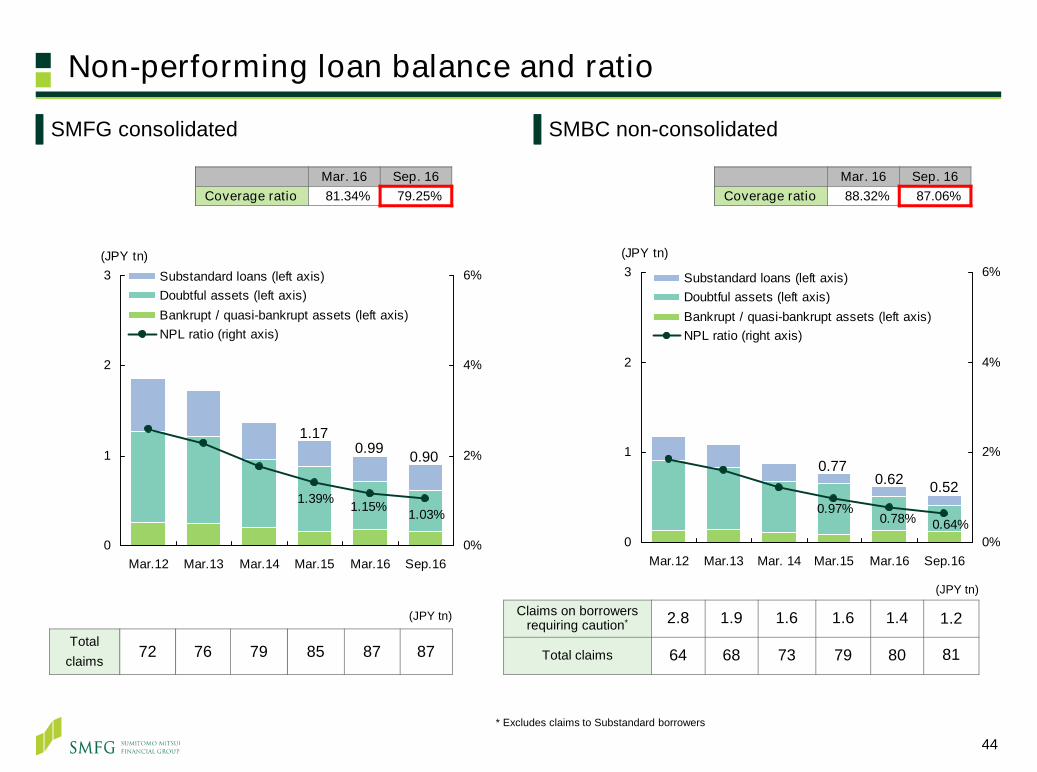
Non-performing loan balance and ratio
Claims on borrowers requiring caution* 2.8 1.9 1.6 1.6 1.4 1.2
Total claims 64 68 73 79 80 81
Mar. 16 Sep. 16Coverage ratio 88.32% 87.06%
Mar. 16 Sep. 16Coverage ratio 81.34% 79.25%
(JPY tn)
SMFG consolidated SMBC non-consolidated
* Excludes claims to Substandard borrowers
Total claims
72 76 79 85 87 87
(JPY tn)
1.39% 1.15% 1.03%
0
1
2
3
Mar.12 Mar.13 Mar.14 Mar.15 Mar.16 Sep.160%
2%
4%
6%Substandard loans (left axis)Doubtful assets (left axis)Bankrupt / quasi-bankrupt assets (left axis)NPL ratio (right axis)
(JPY tn)
0.991.17
0.97%0.78% 0.64%
0
1
2
3
Mar.12 Mar.13 Mar. 14 Mar.15 Mar.16 Sep.160%
2%
4%
6%Substandard loans (left axis)Doubtful assets (left axis)Bankrupt / quasi-bankrupt assets (left axis)NPL ratio (right axis)
(JPY tn)
0.770.62
0.90
0.52

45
DomesticDomestic OverseasOverseas
(SMFG consolidated)*1 Probability of Default. Probability of becoming default by the obligor during the course of one year*2 Loss Given Default. Percentage of loss assumed in the event of default by obligor; ratio of uncollectible amount of the exposure
owned in the event of default
Corporate, sovereign and bank exposures
Total(as of Sep. 30, 2016)JPY 93.0 trillion JPY 36.0 trillion
[as of Sep. 30, 2016][as of Sep. 30, 2016]
PD*1 LGD*2 RiskWeight
0.06% 35.74% 18.72%
0.72% 34.11% 49.71%
15.81% 34.19% 149.22%
100.00% 47.13% 8.08%
0.85% 44.47% 56.11%
0.00% 35.31% 0.01%
PD*1 LGD*2 RiskWeight
0.14% 29.04% 18.35%
3.06% 22.55% 65.80%
15.67% 25.19% 124.05%
100.00% 70.40% 51.88%
1.05% 28.09% 30.99%
- - -
(JPY tn) (JPY tn)
01020304050
Japanesegovernment,
etc.
Others
Default(7R,8-10)
7(excl.7R)
4-6
1-3
0 10 20 30 40 50
Japanesegovernment,
etc.
Others
Default(7R,8-10)
7(excl.7R)
4-6
1-3
Mar. 31, 2014
Mar. 31, 2015
Mar. 31, 2016
Sep. 30, 2016
1 - 3(Very high - Satisfactory)
4 - 6(Likely - Currently no
problem)
7 (excl. 7R)(Borrowers requiring
caution)
7R, 8-10(Substandard borrowers -
Bankrupt borrowers)
Others
Japanese Government, etc.
Internal Rating(Certainty of debt repayment)

Exposure to resource-related sectors*1
46
(JPY tn) Mar. 15
Ratio to total
exposureMar. 16
Ratio to total
exposureDec. 16
Ratio to total
exposureIntegrated Oil & Gas*2 1.8 1.6% 1.5 1.3% 1.6 1.3%Services (Drilling, field services) 0.5 0.4% 0.5 0.4% 0.5 0.4%Upstream (E&P*3) 1.5 1.3% 1.7 1.4% 1.6 1.3%Midstream (Storage/Transportation) 1.1 1.0% 1.4 1.2% 1.4 1.1%Downstream (Refining) 0.7 0.6% 0.7 0.6% 0.9 0.7%
Oil and gas 5.5 5.0% 5.8 5.0% 6.0 4.8%Other resources (Mining) 1.2 1.1% 1.1 1.0% 1.0 0.8%
Non-Japanese*4 (Resource-related sectors) 6.8 6.1% 6.9 6.0% 7.0 5.6%o/w Upstream 0.1 0.1% 0.2 0.2% 0.2 0.2%
Oil and gas 1.2 1.1% 1.6 1.4% 1.7 1.3%Other resources (Mining) 0.2 0.2% 0.2 0.2% 0.2 0.2%
Japanese (Resource-related sectors) 1.4 1.2% 1.8 1.6% 1.9 1.5%Resource-related sectors 8.1 7.3% 8.8 7.6% 8.9 7.1%
Oil and gas 6.7 6.0% 7.4 6.4% 7.6 6.2%Other resources (Mining) 1.4 1.3% 1.3 1.1% 1.2 1.0%
Non-Japanese*4 38 34.0% 38 32.9% 42 33.8%Japanese 73 66.0% 77 67.1% 82 66.2%
SMFG total exposure 111 100.0% 115 100.0% 124 100.0%
“Oil and gas” does not include petrochemical; Japanese “Other resources (Mining)” does not include general trading companies Non-Japanese (resource-related sectors) : Corporate finance approx. 70%; Project finance approx. 30% Japanese (resource-related sectors) : Corporate finance 100%. No NPLs Exposure to resource-related sectors excluding project finance which are unaffected by resource prices is JPY 7.7 tn;
Exposure at default (EAD) to the sectors is JPY 6.8 tn as of Dec. 2016*1 Loans, commitment lines, guarantees, investments, etc. *2 Majors, state-owned companies, etc. *3 Exploration & Production*4 Exchange rates using TTM as of Mar. 2015: USD 1 = JPY 120.15, Mar. 2016: USD 1 = JPY 112.62 and Dec. 2016: USD 1 = JPY 116.49

Breakdown of exposure to Non-Japanese oil & gas/other resources
47
Oil and gas : Corporate finance approx. 70%; Project finance approx. 30% Other resources (Mining) : Corporate finance approx. 80%; Project finance approx. 20%
*1 As of Dec. 31, 2016 *2 NPLs based on the Financial Reconstruction Act, excluding Normal assets*3 The balance of Claims on borrowers requiring caution are USD 0.3 bn in Asia, USD 1.8 bn in Americas, and USD 1.3 bn in EMEA.
They are mainly included in Oil and gas
[1]Exposure*1
[3]NPLs*1,2,3
[5]Reserve for
possible loan losses*1
[6]Collateral,
guarantees, etc.*1
[7]Coverage
ratio*1
([5]+[6])/[3]
[2]Drawn
amount*1
(USD bn)
[4]Ratio to drawn
amount[3]/[2]
Percentage of “1-3”*1
Percentage of “1-3”*1
Asia 16.8 89% 14.6 90% 0.088 0.6% 0.024 0.000 27%
Americas 21.6 80% 8.2 74% 0.449 5.5% 0.059 0.319 84%
EMEA 21.5 81% 11.2 73% 0.267 2.4% 0.088 0.120 78%
Total 59.9 83% 33.9 80% 0.804 2.4% 0.172 0.439 76%
Oil and gas 51.2 84% 29.4 82% 0.389 1.3% 0.066 0.280 89%
Integrated Oil & Gas(Majors, state-owned companies, etc.) 13.8 92% 7.6 89% - - - - -
Services(Drilling, field services) 4.1 43% 2.2 29% 0.090 4.2% 0.048 0.025 80%
Upstream(E&P) 13.7 74% 8.7 76% 0.299 3.4% 0.018 0.255 91%
Midstream(Storage/Transportation) 12.2 91% 5.9 89% - - - - -
Downstream(Refining) 7.4 97% 5.0 97% - - - - -
Other resources (Mining) 8.7 75% 4.6 69% 0.415 9.1% 0.106 0.159 64%

SMBC Nikko Securities / Reorganization of group companies
48
SMBC Nikko SecuritiesSMBC Nikko Securities
*1 Includes profit from overseas equity-method affiliates of SMBC Nikko (consolidated subsidiaries of SMFG) etc.*2 Recorded loss of JPY 11.2 bn as extraordinary loss in the third quarter on restructuring and liquidation of business alliance with Barclays
Financial results (consolidated)
Merger of securities subsidiaries
Reorganization of group companiesReorganization of group companies
Target of merger: Jan. 2018
Consolidation of asset management company
Increased stakes to 60%: Jul. 2016
Net operating revenue
0
20
40
60
80
100
Apr.-Jun.15 Jul.-Sep.15 Oct.-Dec.15 Jan.-Mar.16 Apr.-Jun.16 Jul.-Sep.16 Oct.-Dec.16
(JPY bn)OthersNet trading incomeUnderwriting commissions
Subscription commissions on investment trust,agent commissions on investment trusts, etc.Equity brokerage commissions (JPY bn) FY3/16 Apr.-Dec.
2016Apr.-Dec. 2015
YOY change
Net operatingrevenue 235.2 292.8 227.1 (8.1)
SG&A expenses (184.2) (241.5) (181.1) +3.1
Ordinary income*1 54.0 55.8 48.6 (5.4)
Profit attributable to owners of parent*1, 2 40.1 42.1 26.3 (13.8)

Consumer finance business
49
Financial results : SMBC Consumer Finance (consolidated)Financial results : SMBC Consumer Finance (consolidated)
Balance of unsecured card loansBalance of unsecured card loans (SMBC + SMBC Consumer Finance)
Over +20%compared with
Mar. 2014
* Converted into Japanese yen at respective period-end exchange rates
SMBC Consumer Finance: financing / loan guarantee / overseas businessesSMBC Consumer Finance: financing / loan guarantee / overseas businesses
Consumer loans outstanding(domestic) Loan guarantee amount
Consumer loans outstanding (overseas)* No. of interest refund claims
(JPY bn)
(JPY bn)
(Thousand)
(JPY bn) FY3/16 Apr.-Dec. 2016
Apr.-Dec. 2015
YOY change
Operating income 183.5 245.8 193.1 +9.5Expenses for loan losses within Expenses (42.6) (52.0) (45.2) (2.6)Losses on interest repayments within Expenses - (122.0) - -
Ordinary profit 45.8 (61.2) 50.2 +4.4Profit attributable to owners of parent 42.6 (64.8) 46.1 +3.6
Consumer loans outstanding 1,014.0 1,022.0 1,063.5Allowance on interest repayments 78.0 188.8 135.8
Loan guarantee 1,035.0 1,079.9 1,178.1for regional financialinstitutions, etc. 447.9 474.2 535.7
No. of companieswith guaranteeagreements:
189(as of Dec. 2016)
of which:
1,000
1,500
2,000
Mar. 14 Mar. 15 Mar. 16 Dec.16 Mar. 17
(JPY bn)
(mid-term plan target)723.9
730.7 742.4
205.7 210.2 225.4
400
600
800
1,000
Mar.15
Jun.15
Sep.15
Dec.15
Mar.16
Jun.16
Sep.16
Dec.16
SMBCCF non-consolidated Mobit
929.7940.9 967.8
(JPY bn)
1,035.0 1,079.9
1,178.1
300
600
900
1,200
Mar.15
Jun.15
Sep.15
Dec.15
Mar.16
Jun.16
Sep.16
Dec.16
(JPY bn)
80.6 77.6
93.2
0
25
50
75
Mar.15
Jun.15
Sep.15
Dec.15
Mar.16
Jun.16
Sep.16
Dec.16
0
10
20
Jun. Sep. Dec. Mar.
FY2011 FY2012
FY2013 FY2014
FY2015 FY2016

Overseas loan balance classified by borrower type
50
By region (Sep. 2016)*1By region (Sep. 2016)*1
Major marketing channels in Asia (Sep. 2016)*1Major marketing channels in Asia (Sep. 2016)*1
0%
25%
50%
75%
100%
Total Asia Americas EMEA
Non-Japanese corporations and othersJapanese corporations
0%
25%
50%
75%
100%
Sydney HongKong
Singapore China Indonesia Bangkok Seoul
Non-Japanese corporations and othersJapanese corporations
*1 Managerial accounting basis. Sum of SMBC, SMBC Europe and SMBC (China). Includes trade bills after Mar. 2015*2 Sum of SMBC and SMBC Indonesia
*2
Total*1Total*1
0
50
100
150
200
Mar. 12 Mar. 13 Mar. 14 Mar. 15 Mar. 16 Sep. 16
(USD bn)Non-Japanese corporations and others(product type lending)Japanese corporations
128
146
165
181
195 201
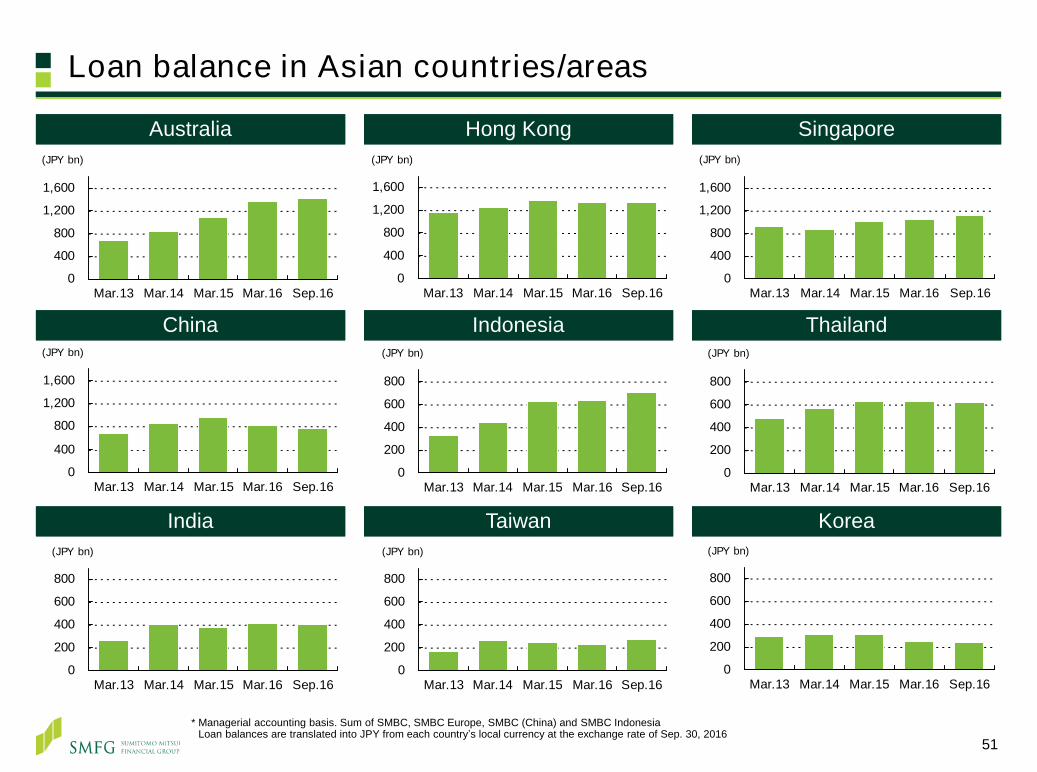
Loan balance in Asian countries/areas
51
AustraliaAustralia SingaporeSingaporeHong Kong Hong Kong
ChinaChina IndonesiaIndonesia ThailandThailand
IndiaIndia TaiwanTaiwan KoreaKorea
* Managerial accounting basis. Sum of SMBC, SMBC Europe, SMBC (China) and SMBC Indonesia* Loan balances are translated into JPY from each country’s local currency at the exchange rate of Sep. 30, 2016
0
400
800
1,200
1,600
Mar.13 Mar.14 Mar.15 Mar.16 Sep.16
(JPY bn)
0
400
800
1,200
1,600
Mar.13 Mar.14 Mar.15 Mar.16 Sep.16
(JPY bn)
0
400
800
1,200
1,600
Mar.13 Mar.14 Mar.15 Mar.16 Sep.16
(JPY bn)
0
200
400
600
800
Mar.13 Mar.14 Mar.15 Mar.16 Sep.16
(JPY bn)
0
200
400
600
800
Mar.13 Mar.14 Mar.15 Mar.16 Sep.16
(JPY bn)
0
400
800
1,200
1,600
Mar.13 Mar.14 Mar.15 Mar.16 Sep.16
(JPY bn)
0
200
400
600
800
Mar.13 Mar.14 Mar.15 Mar.16 Sep.16
(JPY bn)
0
200
400
600
800
Mar.13 Mar.14 Mar.15 Mar.16 Sep.16
(JPY bn)
0
200
400
600
800
Mar.13 Mar.14 Mar.15 Mar.16 Sep.16
(JPY bn)
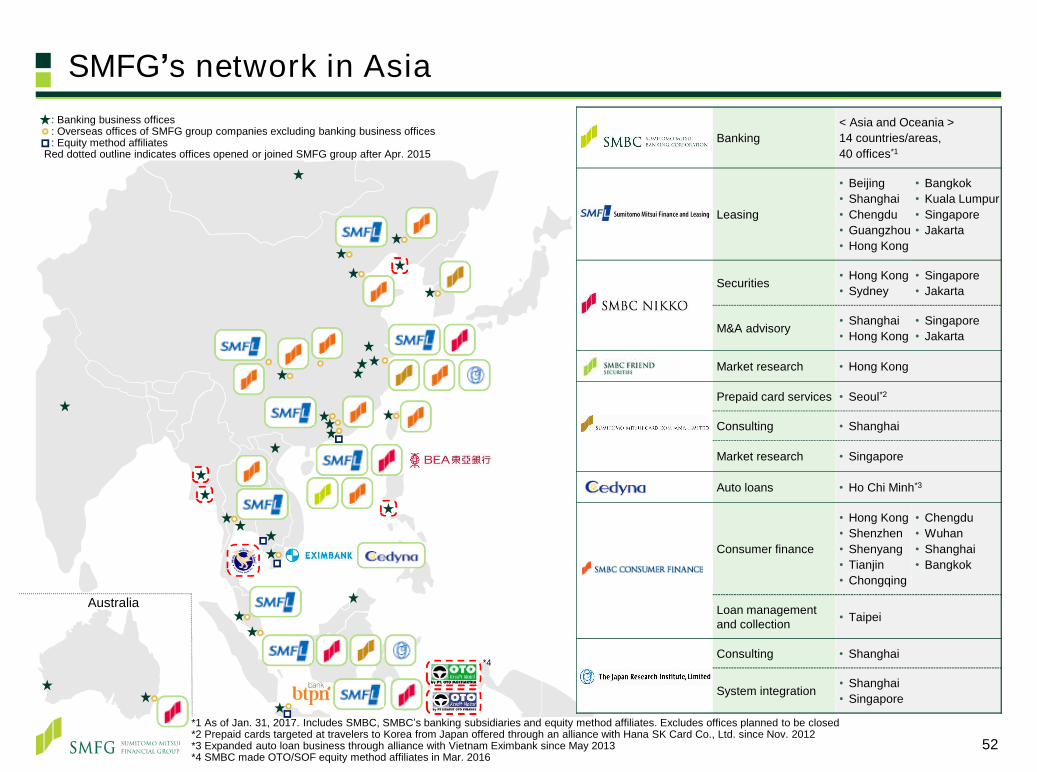
SMFG’s network in Asia
Australia
: Banking business offices: Overseas offices of SMFG group companies excluding banking business offices: Equity method affiliates
Red dotted outline indicates offices opened or joined SMFG group after Apr. 2015
52
Banking< Asia and Oceania >14 countries/areas, 40 offices*1
Leasing
• Beijing• Shanghai• Chengdu• Guangzhou• Hong Kong
• Bangkok• Kuala Lumpur• Singapore• Jakarta
Securities • Hong Kong• Sydney
• Singapore• Jakarta
M&A advisory • Shanghai• Hong Kong
• Singapore• Jakarta
Market research • Hong Kong
Prepaid card services • Seoul*2
Consulting • Shanghai
Market research • Singapore
Auto loans • Ho Chi Minh*3
Consumer finance
• Hong Kong• Shenzhen• Shenyang• Tianjin• Chongqing
• Chengdu• Wuhan• Shanghai• Bangkok
Loan management and collection • Taipei
Consulting • Shanghai
System integration • Shanghai• Singapore
*1 As of Jan. 31, 2017. Includes SMBC, SMBC’s banking subsidiaries and equity method affiliates. Excludes offices planned to be closed*2 Prepaid cards targeted at travelers to Korea from Japan offered through an alliance with Hana SK Card Co., Ltd. since Nov. 2012*3 Expanded auto loan business through alliance with Vietnam Eximbank since May 2013*4 SMBC made OTO/SOF equity method affiliates in Mar. 2016
*4
53
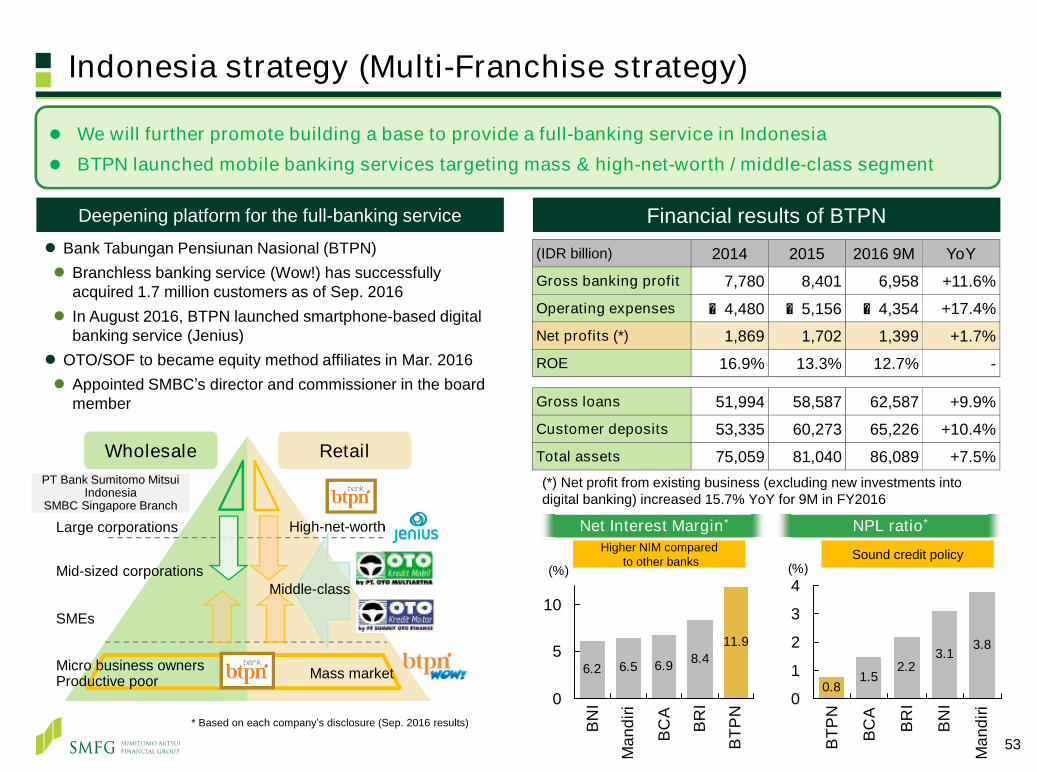
Indonesia strategy (Multi-Franchise strategy)
* Based on each company’s disclosure (Sep. 2016 results)
We will further promote building a base to provide a full-banking service in Indonesia BTPN launched mobile banking services targeting mass & high-net-worth / middle-class segment
Financial results of BTPN
Sound credit policyHigher NIM comparedto other banks
NPL ratio*Net Interest Margin*
Deepening platform for the full-banking service
Bank Tabungan Pensiunan Nasional (BTPN) Branchless banking service (Wow!) has successfully
acquired 1.7 million customers as of Sep. 2016 In August 2016, BTPN launched smartphone-based digital
banking service (Jenius) OTO/SOF to became equity method affiliates in Mar. 2016 Appointed SMBC’s director and commissioner in the board
member
6.2 6.5 6.9 8.411.9
0
5
10B
NI
Man
diri
BC
A
BR
I
BTP
N
(%)
0.81.5
2.23.1
3.8
0
1
2
3
4
BTP
N
BC
A
BR
I
BN
I
Man
diri
(%)
(IDR billion) 2014 2015 2016 9M YoYGross banking profit 7,780 8,401 6,958 +11.6%
Operating expenses ▲4,480 ▲5,156 ▲4,354 +17.4%
Net profits (*) 1,869 1,702 1,399 +1.7%
ROE 16.9% 13.3% 12.7% -
Gross loans 51,994 58,587 62,587 +9.9%
Customer deposits 53,335 60,273 65,226 +10.4%
Total assets 75,059 81,040 86,089 +7.5%(*) Net profit from existing business (excluding new investments into digital banking) increased 15.7% YoY for 9M in FY2016
PT Bank Sumitomo Mitsui Indonesia
SMBC Singapore Branch
Large corporations
SMEs
Micro business ownersProductive poor
Wholesale Retail
Mid-sized corporations
High-net-worth
Mass market
Middle-class

54
Products that we have strengths overseas
*1 As of Dec. 31, 2016 (Source: Ascend “Airline Business”) *2 Leasing revenue + gains (losses) on sales of aircraft etc. Excludes redelivery adjustment*3 Avolon acquisition of CIT Aerospace expected to close in 2017*4 Source: Thomson Reuters (Mandated Arrangers) *5 Asia Pacific for project finance, Asia excluding Japan for loan syndication
Aircraft-related business
Global Asia*5 Japan
Project Finance #3 #4
Loan Syndication #9 #9 #2
League tables (Jan.-Dec. 2016)*4
Subscription finance, Americas / EMEA middle market business
SMBC Rail Services (a wholly-owned consolidated subsidiary in the U.S.)
U.S. based mid-sized railcar leasing company, leased assets: USD 1,417 mn (as of Dec. 31, 2015)
Announced acquisition of American Railcar LeasingLLC (6th largest railcar leasing company in the US)
Railcar leasing
Aircraft leasing companies Country #owned/managed
1 GECAS USA 1,441
2 AerCap Netherlands 1,160
3 SMBC Aviation Capital Ireland 452
4 Nordic Aviation Capital Denmark 374
5 CIT Aerospace*3 USA 339
9 Avolon*3 Ireland 287
SMBC Aviation Capital results /Number of owned and managed aircraft*1
(USD mn) 1H, FY3/17 FY3/16
Total revenue*2 531 993
Net income 139 199
Aircraft asset 10,910 10,515
Net asset 1,771 1,627
SMBC Aviation Capital leading the way in providing solutions to domestic and overseas aircraft investors and offering aircraft leasing
Extending loans to funds based on commitments from investors Credit balance: approx. USD 18 bn, spread: approx. 150bp
(as of Sep. 2016)
Sponsor finance for mid-sized corporations, loan for acquisition finance Accounts for around 2% of our overseas loan balance.
Carefully select profitable transactions
Project Finance / Loan Syndication

Project finance Non-Japanesecorporates
Japanese corporates
Financial institutions
Others(Aircraft leasing, etc.)
Loan and exposure to the UK / China / Russia
55
中国向け貸出*2, 3中国向け貸出*2, 3Loan balance in China*1, 2, 3, 4Loan balance in China*1, 2, 3, 4
Exposure to Russia*6, 7Exposure to Russia*6, 7
Mar.16 Sep. 160.8 0.8
(JPY tn)
Loan balance in the UK*1, 2, 3Loan balance in the UK*1, 2, 3
Mar.16 Sep. 161.5 1.3
(JPY tn)
Offices in the UK and EU SMBC Europe
Head Office : London6 branches : Dublin, Amsterdam, Paris, Prague, Milan, Madrid
SMBC’s branches3 branches : Brussels, Dusseldorf, Frankfurt
Booking of loans Loan balance in EMEA regions: Approx. JPY 5.4 tn
- of which around 20% is booked at SMBC Europe London
Non-Japanese(corporates,project finance)
Japanese(corporates)Non-Japanese
(corporates, project finance)
Japanese(corporates)
Our operation in EMEAOur operation in EMEA
Most borrowers are classified as“1-3”*5 in our internal rating
*1 Sum of SMBC, SMBC Europe and SMBC (China) *2 Geographic classification based on borrowers’ domicile *3 Loan balance are converted into JPY from each country’s local currency at the exchange rate of Mar. 31, 2016 *4 Based on borrowers’ domicile for loan balance, booking office for classification of borrowers *5 Certainty of debt repayment is in the range of Very high - Satisfactory *6 Loans, commitment lines, guarantees, investments, etc. *7 SMFG consolidated
Mar.16 Sep. 164.3 3.2
0.3% of SMFG’s total exposure of approx. USD 1tn
(USD bn)
56
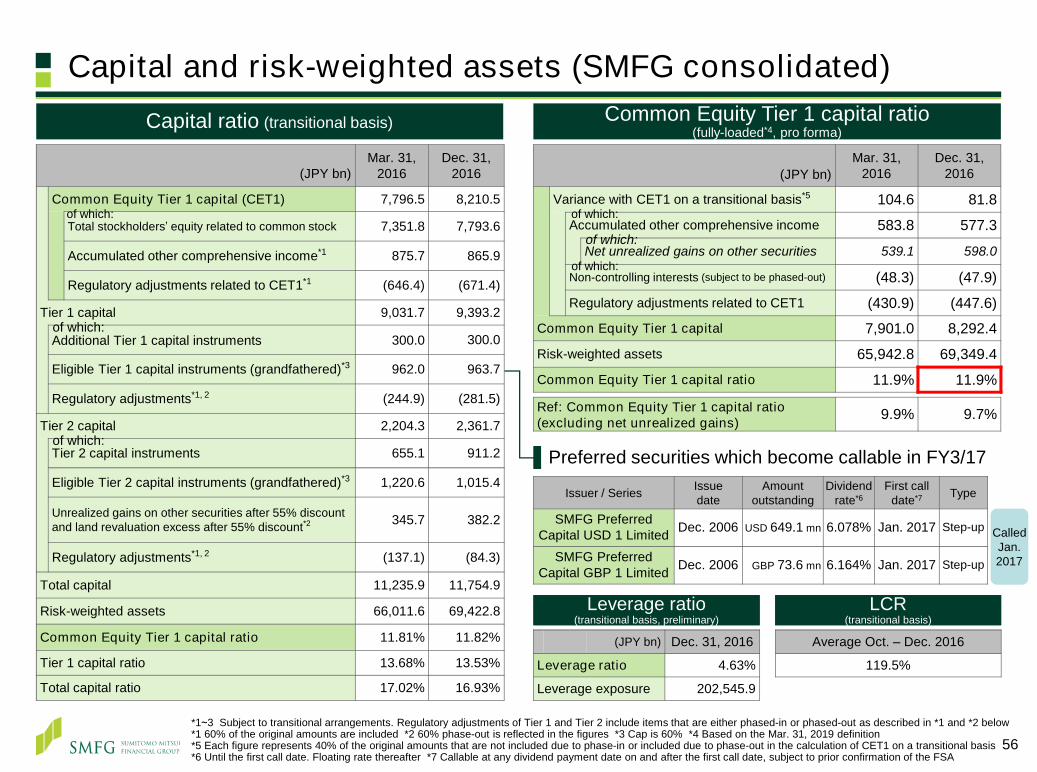
Capital and risk-weighted assets (SMFG consolidated)
(JPY bn)Mar. 31,
2016Dec. 31,
2016
Common Equity Tier 1 capital (CET1) 7,796.5 8,210.5
Total stockholders’ equity related to common stock 7,351.8 7,793.6
Accumulated other comprehensive income*1 875.7 865.9
Regulatory adjustments related to CET1*1 (646.4) (671.4)
Tier 1 capital 9,031.7 9,393.2
Additional Tier 1 capital instruments 300.0 300.0
Eligible Tier 1 capital instruments (grandfathered)*3 962.0 963.7
Regulatory adjustments*1, 2 (244.9) (281.5)
Tier 2 capital 2,204.3 2,361.7
Tier 2 capital instruments 655.1 911.2
Eligible Tier 2 capital instruments (grandfathered)*3 1,220.6 1,015.4
Unrealized gains on other securities after 55% discount and land revaluation excess after 55% discount*2 345.7 382.2
Regulatory adjustments*1, 2 (137.1) (84.3)
Total capital 11,235.9 11,754.9
Risk-weighted assets 66,011.6 69,422.8
Common Equity Tier 1 capital ratio 11.81% 11.82%
Tier 1 capital ratio 13.68% 13.53%
Total capital ratio 17.02% 16.93%
Common Equity Tier 1 capital ratio(fully-loaded*4, pro forma)
Capital ratio (transitional basis)
Issuer / Series Issuedate
Amountoutstanding
Dividendrate*6
First calldate*7 Type
SMFG Preferred Capital USD 1 Limited Dec. 2006 USD 649.1 mn 6.078% Jan. 2017 Step-up
SMFG Preferred Capital GBP 1 Limited Dec. 2006 GBP 73.6 mn 6.164% Jan. 2017 Step-up
Preferred securities which become callable in FY3/17
(JPY bn)Mar. 31,
2016Dec. 31,
2016
Variance with CET1 on a transitional basis*5 104.6 81.8
Accumulated other comprehensive income 583.8 577.3
Net unrealized gains on other securities 539.1 598.0
Non-controlling interests (subject to be phased-out) (48.3) (47.9)
Regulatory adjustments related to CET1 (430.9) (447.6)
Common Equity Tier 1 capital 7,901.0 8,292.4Risk-weighted assets 65,942.8 69,349.4
Common Equity Tier 1 capital ratio 11.9% 11.9%
Ref: Common Equity Tier 1 capital ratio(excluding net unrealized gains) 9.9% 9.7%
of which:
of which:
of which:
of which:
of which:
of which:
Leverage ratio(transitional basis, preliminary)
Leverage ratio(transitional basis, preliminary)
LCR(transitional basis)
LCR(transitional basis)
(JPY bn) Dec. 31, 2016
Leverage ratio 4.63%
Leverage exposure 202,545.9
Average Oct. – Dec. 2016
119.5%
*1~3 Subject to transitional arrangements. Regulatory adjustments of Tier 1 and Tier 2 include items that are either phased-in or phased-out as described in *1 and *2 below *1 60% of the original amounts are included *2 60% phase-out is reflected in the figures *3 Cap is 60% *4 Based on the Mar. 31, 2019 definition *5 Each figure represents 40% of the original amounts that are not included due to phase-in or included due to phase-out in the calculation of CET1 on a transitional basis*6 Until the first call date. Floating rate thereafter *7 Callable at any dividend payment date on and after the first call date, subject to prior confirmation of the FSA
CalledJan. 2017

Peer comparison - CET 1 ratio
57
CET1 ratio - Basel III fully-loaded basis (pro forma) *1CET1 ratio - Basel III fully-loaded basis (pro forma) *1
11.0%
11.9%
13.8%
11.6% 11.6%
12.5%
10.8%11.5%
11.9%
13.9%
12.2%12.5%
0.0%
3.0%
6.0%
9.0%
12.0%
15.0%
Mizuho SMFG UBS Barclays CS MUFG BAC BNP DB HSBC JPM Citi
Minimum requirement
7%*4
Minimum requirement
+G-SIB
surcharge*3
Bucket 1(1.0%)
Bucket 2(1.5%)
Bucket 3(2.0%)
Bucket 4(2.5%)
*1 Based on each company’s disclosure. As of Sep. 30, 2016 for Mizuho FG, MUFG, Barclays, and HSBC, and as of Dec. 31, 2016 for others. CET 1 ratio excluding net unrealized gains from Other securities shown in parentheses
*2 Local regulatory minimum requirement: for Japanese G-SIBs, Minimum CET1 Requirements + Capital conservation buffer + G-SIB surcharge;for Swiss G-SIBs, Minimum component + Buffer component; for UK G-SIBs, Pillar 1 + Pillar 2A + Capital conservation buffer + G-SIB surcharge;for US G-SIBs, Minimum CET1 Requirements + Capital conservation buffer + FRB’s G-SIB surcharge;for EU G-SIBs, Pillar 1 + SREP add-on + Capital conservation buffer + G-SIB surcharge
*3 The list published by the FSB in Nov. 2016 *4 Minimum requirement = Minimum CET1 Requirements (4.5%) + Capital conservation buffer (2.5%)
Local regulatory minimum
requirement*2(9.1%)
(9.7%)(10.1%)
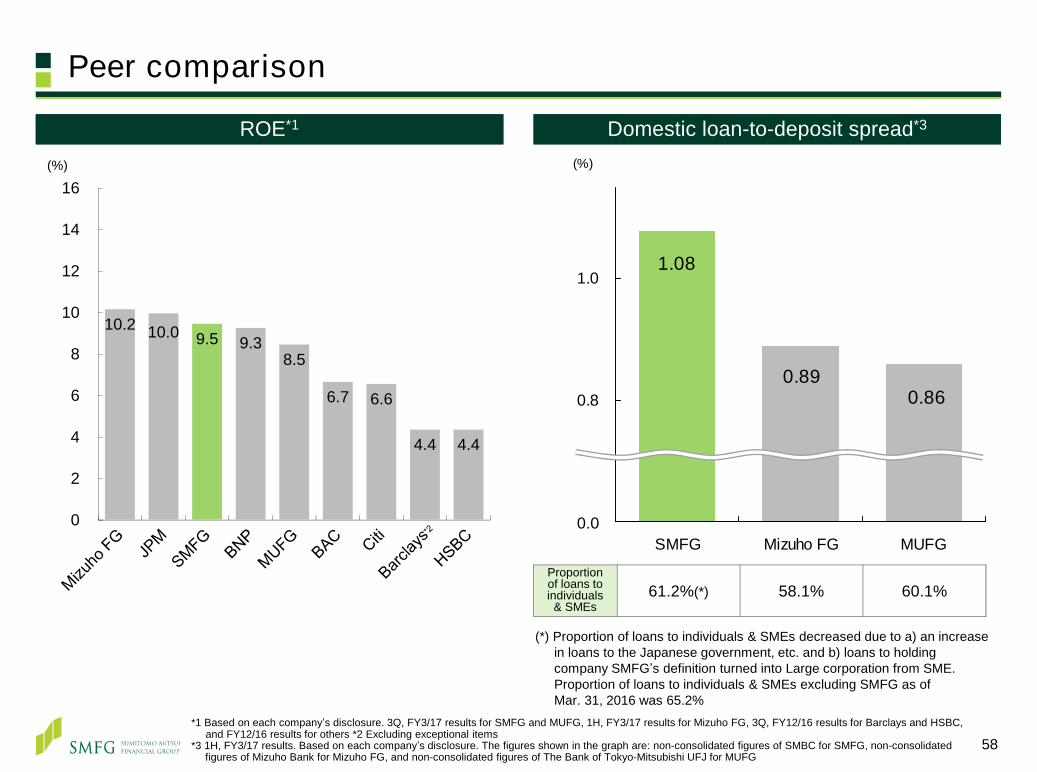
58*1 Based on each company’s disclosure. 3Q, FY3/17 results for SMFG and MUFG, 1H, FY3/17 results for Mizuho FG, 3Q, FY12/16 results for Barclays and HSBC,
and FY12/16 results for others *2 Excluding exceptional items*3 1H, FY3/17 results. Based on each company’s disclosure. The figures shown in the graph are: non-consolidated figures of SMBC for SMFG, non-consolidated
figures of Mizuho Bank for Mizuho FG, and non-consolidated figures of The Bank of Tokyo-Mitsubishi UFJ for MUFG
Peer comparison
0.860.89
1.08
0.6
0.8
1.0
SMFG Mizuho FG MUFG
(%)
Domestic loan-to-deposit spread*3Domestic loan-to-deposit spread*3
Proportion of loans toindividuals& SMEs
61.2%(*) 58.1% 60.1%
0.0
ROE*1ROE*1
(*) Proportion of loans to individuals & SMEs decreased due to a) an increase in loans to the Japanese government, etc. and b) loans to holding company SMFG’s definition turned into Large corporation from SME. Proportion of loans to individuals & SMEs excluding SMFG as of Mar. 31, 2016 was 65.2%
10.2 10.0 9.5 9.3 8.5
6.7 6.6
4.4 4.4
0
2
4
6
8
10
12
14
16(%)

59
Meeting international financial regulations
◎ Able to meet requirements easily ○ Able to meet requirements △ Impact unclear
G20
G-S
IFI r
egul
atio
n an
d su
perv
isio
n
Pru
dent
ial r
egul
atio
n
Bas
el II
I
US
EU Fina
ncia
l mar
ket /
Fi
nanc
ial s
yste
m
refo
rm
Regulations Contents of regulation Effective Current status Action taken & impact on SMFG
G-SIB surcharge Required for additional loss absorption capacity above the Basel III minimum
2016 Under phased implementation ◎ Requirement for SMFG to be 8% on a fully-loaded basis. Achieved 8% CET 1 ratio by the end of Mar. 2013
Adequacy of loss-absorbing capacity (TLAC)
Required to hold loss absorbing capacity, which consists of eligible liabilities and regulatory capital, on both a going concern and gone concern basis
2019 Finalised at FSB in Nov. 2015 ○ Currently have no issues in meeting requirements. Taking actions needed
Recovery and Resolution Plan
SMFG Group Recovery Plan Imple-mented
Submitted ○ Work in accordance with due dates, including those of overseas operations
ISDA Protocol: Stays on early termination rights following the start of resolution proceedings of derivatives counterparty
Imple-mented
Adhered ○ Adhered at each of the relevant major entities
Capital requirement Required to raise the level and quality of capital and enhance risk coverage under Basel III
2013 Under phased implementation ◎ Achieved our target of 8% CET 1 ratio by Mar. 2013, one year ahead of schedule
Fundamental review of trading book(Strengthened capital standards for market risk)
2019 Finalised at BCBS in Jan. 2016 ○ Currently have no issues in meeting requirements although paying attention to national finish
Revisions to the Standardised Approaches TBD Consultation for credit/operational risk commenced in Dec. 2015/Mar. 2016
△ To be finalized in the near future. Paying attention to discussions
Constraints on the use of internal model approaches TBD Consultation commenced inMar. 2016
△ To be finalized in the near future. Paying attention to discussions
Capital floors TBD Consultation commenced inDec. 2014
△ Details and implementation schedule of regulation remain unclear. Paying attention to discussions
Review of the Credit Valuation Adjustment (CVA) risk framework TBD Consultation commenced inJul. 2015
△ Implementation schedule remains unclear. Paying attention to discussions
Interest-rate risk in the banking book 2018 Finalised at BCBS inApr. 2016
○ Currently have no issues in meeting requirements although paying attention to national finish
Leverage ratio requirement
Non-risk-based measure based on “on-and off-accounting balance sheet items” against Tier 1 capital. Minimum requirement: 3% (on a trial basis)
2018 Consultation for revisions to the framework including additional requirements for G-SIBs
commenced in April. 2016
○ Currently have no issues in meeting Tier 1 capital minimum requirement of 3%. Paying attention to discussions about revisions to the framework
Minimum standards for liquidity(LCR/NSFR)
LCR:Required to have sufficient high-quality liquid assets to survive a significant stress scenario lasting for one month. >=100% needed
2015 Under phased implementation ○ In good position due to domestic deposit base. Intend to further strengthen foreign currency ALM
NSFR:Required to maintain a sustainable maturity structure of assets and liabilities >=100% needed
2018 Finalised at BCBS in Oct. 2014 ○ Currently have no issues in meeting requirements although paying attention to national finish
Large exposure regulation
Tightening of exposure limit to a single borrower (25% of Tier 1) and expansion of scope of applicable exposure type, etc.
Jan. 2019 Partly implemented in Dec. 2014 ○ BCBS issued frequently asked questions clarifying the application of the large exposure limit for interbank exposures. Currently, have limited impact
OTC derivatives markets reforms
Centralizing of OTC derivatives clearing Margin requirement for non-centrally cleared derivatives
Dec. 2012Sep. 2016
Scope of application being expandedUnder phased implementation
△ Taking actions needed although impact will be smaller compared to investment banks
Regulation of shadow banking system
Strengthen the oversight and regulation of the shadow banking system such as MMFs, repos and securitizations
TBD Discussion underway on five specific areas
○ FSB’s final rule to apply haircut floors on repo transactions excluded JGBs as applicable collateral (Oct. 2014)
Limitation on banking activities / Ring fencing regulation
Requirements for foreign banking organizations (FBO Rule) Jul. 2016 Final regulation published ◎ Needed actions already taken
Ring-fenced banks prohibited from providing certain services and required to be isolated from the rest of the financial group in UK and EU
TBD UK:Enacted in Dec. 2013, EU:Proposal published in Jan. 2014
◎ SMBC will be out of scope, but still paying close attention to the discussion

Ongoing major regulatory discussions
60
Regulations Contents ScheduleFinalizedat FSB or
BCBS
Domestic regulation
Cap
ital r
equi
rem
ent
Creditrisk
Revisions to the
StandardisedApproach
・Seeks to improve the standardised approach for credit risk, including reducing reliance on external credit ratings; increasing risk sensitivity; reducing national discretions; strengthening the link between the standardised approach and the internal-rating based (IRB) approach; and enhancing comparability of capital requirements across banks
・Under consultation (comment period closed in Mar. 2016) ・To be finalized in the near future
Unfinished Unfinished
Review of theCVA risk
framework
・Seeks to review the credit valuation adjustment (CVA) risk framework to capitalize the risk of future changes in CVA that is an adjustment to the fair value of derivatives to account for counterparty’s credit risk
・Under consultation (comment period closed in Oct. 2015) ・To be finalized in the near future
Unfinished Unfinished
Marketrisk
IRRBB(Interest-rate
risk in the banking book)
・Adoption of enhanced Pillar 2 approach; (i) more extensive guidance on the expectations for a bank's IRRBB management process, (ii) enhanced disclosure requirements, (iii) an updated standardized framework and (iv) a stricter threshold for identifying outlier banks
・Finalized in Apr. 2016 Finished Unfinished
Opera-tionalrisk
Revisions to the
StandardisedMeasurement
Approach
・Use of the Business Indicator (BI), a proxy of size of business, and the loss data for riskweighted assets calculation is proposed. Termination of the Advanced Measurement Approaches (AMA) is also proposed
・Under consultation (comment period closed in Jun. 2016)・To be finalized in the near future
Unfinished Unfinished
Overall
Constraints on the use of
internal model
approaches
・Constraints on the use of the internal ratings based approach to credit risk; (i) applying the standardised approach to exposures to financial institutions, large corporates and equities, (ii) applying the F-IRB approach for exposures to medium sized corporates, (iii) applying the standardized approach or the IRB supervisory slotting approach for specialized lending, or (iv) applying or raising floors to PDs/LGDs and revising the estimation methods
・Under consultation (comment period closed in Jun. 2016)・To be finalized in the near future
Unfinished Unfinished
Capital floorsbased on
standardisedapproaches
・Replacement of the Basel I-based transitional capital floor with a permanent floor based on standardised approaches・The design and calibration is now considered. The floor could be calibrated in the range of 60% to 90%
・Under consultation (comment period closed in Mar. 2015)・To be finalized in the near future
Unfinished Unfinished
Leverage ratio
requirement
Leverage ratio
・A minimum requirement of 3% to be introduced in 2018・Public disclosure requirement started in Jan. 2015 ・Additional requirements for G-SIBs and revisions including credit conversion factors for off-balance sheet items are proposed in Apr. 2016
・The additional requirements for G-SIBs to be finalized in the near future・Scheduled to be implemented in 2018
Finished in part
Finished in part
G-SIFIregulation
TLAC(total loss-absorbing capacity)
・Minimum requirement of (i) 16% of RWA (19.5% including capital buffer as for SMFG) and 6% of the Basel III Tier 1 leverage ratio denominator as from 2019, (ii) 18% of RWA (21.5% including capital buffer as for SMFG) and 6.75% of the Basel III Tier 1 leverage ratio denominator as from 2022・Should be issued and maintained by resolution entities ・An access to credible ex-ante commitments to recapitalise a G-SIB in resolution may count toward a firm’s TLAC as 2.5% RWA as from 2019 and 3.5% as from 2022
・Finalized in Nov. 2015 Finished Unfinished
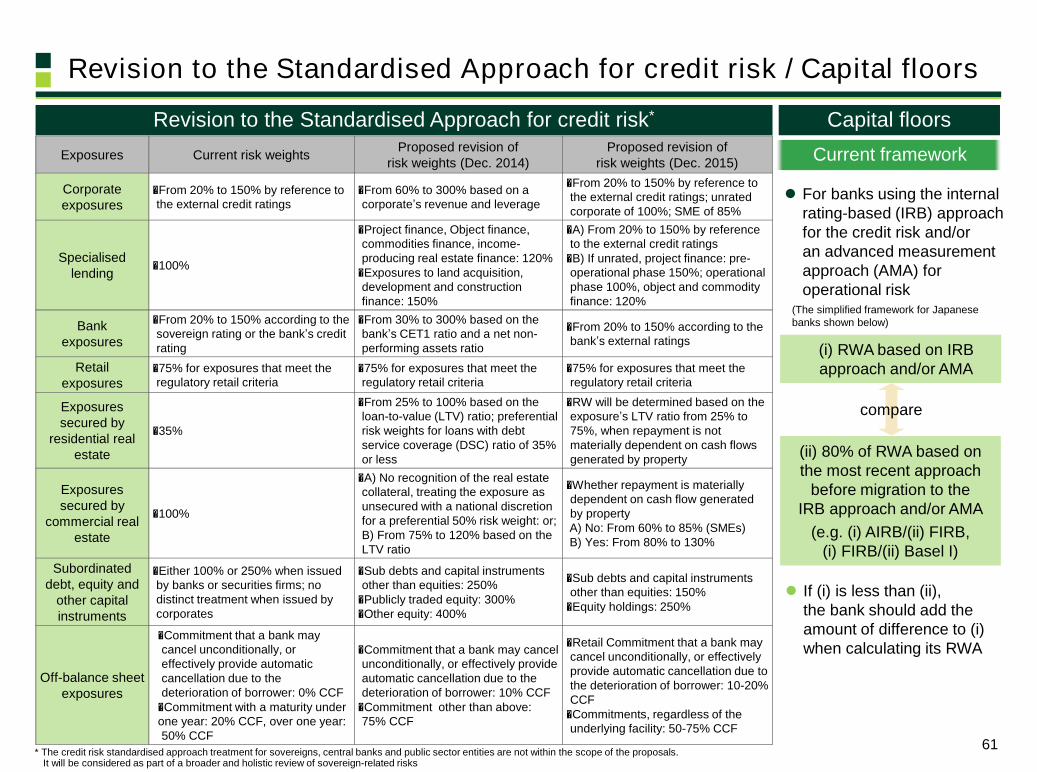
61
Revision to the Standardised Approach for credit risk / Capital floors
Revision to the Standardised Approach for credit risk*Revision to the Standardised Approach for credit risk* Capital floorsCapital floors
For banks using the internal rating-based (IRB) approach for the credit risk and/or an advanced measurement approach (AMA) for operational risk
(i) RWA based on IRBapproach and/or AMA
(ii) 80% of RWA based on the most recent approach
before migration to the IRB approach and/or AMA
(e.g. (i) AIRB/(ii) FIRB, (i) FIRB/(ii) Basel I)
compare
If (i) is less than (ii), the bank should add the amount of difference to (i) when calculating its RWA
(The simplified framework for Japanese banks shown below)
* The credit risk standardised approach treatment for sovereigns, central banks and public sector entities are not within the scope of the proposals. It will be considered as part of a broader and holistic review of sovereign-related risks
Exposures Current risk weights Proposed revision of risk weights (Dec. 2014)
Proposed revision of risk weights (Dec. 2015)
Corporate exposures
・From 20% to 150% by reference to the external credit ratings
・From 60% to 300% based on a corporate’s revenue and leverage
・From 20% to 150% by reference to the external credit ratings; unrated corporate of 100%; SME of 85%
Specialisedlending ・100%
・Project finance, Object finance, commodities finance, income-producing real estate finance: 120%・Exposures to land acquisition, development and construction finance: 150%
・A) From 20% to 150% by reference to the external credit ratings・B) If unrated, project finance: pre-operational phase 150%; operational phase 100%, object and commodity finance: 120%
Bank exposures
・From 20% to 150% according to the sovereign rating or the bank’s credit rating
・From 30% to 300% based on the bank’s CET1 ratio and a net non-performing assets ratio
・From 20% to 150% according to the bank’s external ratings
Retail exposures
・75% for exposures that meet the regulatory retail criteria
・75% for exposures that meet the regulatory retail criteria
・75% for exposures that meet the regulatory retail criteria
Exposures secured by
residential real estate
・35%
・From 25% to 100% based on the loan-to-value (LTV) ratio; preferential risk weights for loans with debt service coverage (DSC) ratio of 35% or less
・RW will be determined based on the exposure’s LTV ratio from 25% to 75%, when repayment is not materially dependent on cash flows generated by property
Exposures secured by
commercial real estate
・100%
・A) No recognition of the real estate collateral, treating the exposure as unsecured with a national discretion for a preferential 50% risk weight: or; B) From 75% to 120% based on the LTV ratio
・Whether repayment is materially dependent on cash flow generated by propertyA) No: From 60% to 85% (SMEs)B) Yes: From 80% to 130%
Subordinated debt, equity and
other capital instruments
・Either 100% or 250% when issued by banks or securities firms; no distinct treatment when issued by corporates
・Sub debts and capital instruments other than equities: 250%・Publicly traded equity: 300%・Other equity: 400%
・Sub debts and capital instruments other than equities: 150%・Equity holdings: 250%
Off-balance sheet exposures
・Commitment that a bank may cancel unconditionally, or effectively provide automatic cancellation due to the deterioration of borrower: 0% CCF・Commitment with a maturity underone year: 20% CCF, over one year: 50% CCF
・Commitment that a bank may cancel unconditionally, or effectively provide automatic cancellation due to the deterioration of borrower: 10% CCF・Commitment other than above: 75% CCF
・Retail Commitment that a bank may cancel unconditionally, or effectively provide automatic cancellation due to the deterioration of borrower: 10-20% CCF・Commitments, regardless of the underlying facility: 50-75% CCF
Current framework

Application of Basel III
Leverage ratio
Liquidity coverage ratio (LCR)
Net stable funding ratio (NSFR)
Mar. 2015:Start disclosure (minimum:3%)2015 through 1st half 2017:Final adjustments to definition and calibration*5
Jan. 2018:Migration to pillar 1
Jan. 2018:Full implementation
*2
Additional loss absorbency requirement for G-SIBs
Bucket 4 (2.5%)*1
Bucket 1 (1.0%)
Phased-in fromMar. 2015
Basel II Transition period Fully implemented
Leverage ratio and liquidity rules (Schedule based on final documents by BCBS, and domestic regulations)
Phase-in of deductions*3 - 20% 40% 60% 80% 100% 100% 100% 100% 100%
Grandfathering of capital instruments 90% 80% 70% 60% 50% 40% 30% 20% 10% -
Mar. 201560%
Jan. 201670%
Jan. 201780%
Jan. 201890%
Jan. 2019100%
Additional loss absorbency requirement for G-SIBs
(Common Equity Tier 1 capital)
Oct. 2014: Final document published
Mar. 2015 Domesticregulation finalised
Oct. 2014 Domestic regulation finalised
Oct. 2014Finalised at BCBS
*4
*1 With an empty bucket of 3.5% to discourage further systemicness*2 Countercyclical buffer (CCyB) omitted in the chart above; if applied, phased-in in the same manner as the Capital conservation buffer. In accordance with the CCyB
set by each country, Japanese banks may have to meet additional capital requirements depending on the exposures in those countries *3 Including amounts exceeding limit for deferred tax assets, mortgage servicing rights and investment in capital instruments of unconsolidated financial institutions *4 Draft on other domestic rules to be applied after 2016, such as the NSFR, will be published in due course. Timeline based on BCBS documents is in italic*5 Additional requirements for G-SIBs and revisions including credit conversion factors for off-balance sheet items are proposed in Apr. 2016
62
Capital requirements and liquidity coverage ratio have been phased-in in line with international agreements Domestic regulations on leverage ratio and net stable funding ratio are being finalized according to their
adoption schedule No additional requirements anticipated on top of minimum Basel requirement in Japan Able to pass Basel requirement easily according to provisional calculation based on current draft rules

Public sector support and point of non-viability in Japan
63*1 Including the likelihood of a suspension of payment of deposits*2 Including the likelihood of a suspension of payment or negative net worth*3 Specified in Q&A published by FSA on March 6, 2014
Specified Item 1 measuresLiquidity supportCapital injection
Act on Special Measures for Strengthening Financial Functions
Capital injection
Item 2 measuresFinancial assistance
exceeding payout cost
Suspension of payment of deposits or having negative net worth*1
Point of non-
viability
Yes*3
No
Framework ConditionsA
rticl
e 10
2 of
D
epos
it In
sura
nce
Act
(DIA
) Item 1 measuresCapital injection
Item 3 measuresNationalization
Specified Item 2 measuresSupervision or control and
Financial assistance for orderly resolution
Suspension of payment of deposits andhaving negative net worth*1
Undercapitalized
No
Suspension of payment or having negative net worth*2
Yes*3
Banksonly
Subjectentities
Financial institutionsincluding
banks and BHCs
Banks (Capital injection may be made
through BHC)
Systemicrisk
NotRequired
Required(Credit
system in Japan or
in a certain region)
Required(Financial
system such as financial market in Japan)
No suspension of payment of deposits and not having negative net worth
Exis
ting
fram
ewor
kN
ewly
es
tabl
ishe
d fra
mew
ork
Arti
cle
126-
2 of
DIA
Not having negative net worth No

TLAC requirements*1
64
Illustrative TLAC requirements (RWA basis) Highlights of TLAC requirement
Bucket 1 G-SIB buffer
Capital conservation
buffer
Tier 2
AT1
Minimum TLAC requirement
Regulatory minimum*2
Excess CET1 / AT1 /
Tier 2, Senior notes,
etc.
4.5%
2.5%
1.0%
1.5%
2%
Access to Deposit
Insurance Fund
Reserves (B)
TotalTLACplus(A)
minus(B)
3.5%*3
2019-2021: 16%2022- : 18%
CET1
CET1
Capital buffers(A)
2019-2021: 17%2022- : 18%
2019-2021: 2.5%2022- : 3.5%
Contribution of Japanese Deposit Insurance Fund Reserves
Minimum external TLAC requirements
2019 - 2021 After 2022
Minimum external TLAC requirements(RWA basis)
16% 18%
Plus capital buffers*3 19.5% 21.5%
Factoring treatment of access to Deposit Insurance Fund Reserves 17.0% 18.0%
Minimum external TLAC requirementsLeverage ratio denominator basis 6% 6.75%
Based on current calculations, expecting that the TLAC requirements based on RWA will be more constraining than requirements based on the leverage ratio denominator
The FSA plans to allow Japanese G-SIBs to count the amount equivalent to 2.5% of RWA from Mar. 2019 and 3.5% of RWA from Mar. 2022 as external TLAC
*1 Includes capital buffers. Based on the FSB’s final TLAC standards released in Nov. 2015 and the FSA’s approach to introduce the TLAC framework in Japan released in Apr. 2016 (the “FSA’s Approach”). FSA’s Approach remains subject to change based on future international discussions
*2 Under current capital requirements*3 Excludes countercyclical buffer. As for G-SIB buffer, SMFG was allocated to bucket 1 (1.0%) according to the list published by the FSB in Nov. 2016.
Capital buffers will be fully implemented in 2019

65
Credit ratings of G-SIBs (Moody’s)*
Apr. 2001 Jul. 2007 Jan. 2017
Aaa • Bank of America• Bank of New York Mellon• Citibank• JPMorgan Chase Bank
• Royal Bank of Scotland• UBS• Wells Fargo Bank
Aa1 • Bank of America• Crédit Agricole
• Wells Fargo Bank• UBS
• Banco Santander• Barclays Bank• BNP Paribas• Crédit Agricole• Credit Suisse• Deutsche Bank
• HSBC Bank• ING Bank• Nordea Bank• Société Générale• State Street Bank & Trust
Aa2 • Bank of New York Mellon• Barclays Bank• Citibank• HSBC Bank
• ING Bank• JPMorgan Chase Bank• Royal Bank of Scotland• State Street Bank & Trust
• SMBC• BPCE(Banque Populaire)• BTMU
• Mizuho Bank• UniCredit
• Bank of New York Mellon• HSBC Bank
• Wells Fargo Bank
Aa3 • Banco Santander• BNP Paribas• BPCE(Banque Populaire)
• Deutsche Bank• Société Générale• UniCredit
• Goldman Sachs Bank • Morgan Stanley Bank • JPMorgan Chase Bank• Nordea Bank
• Standard Chartered• State Street Bank &
Trust
A1 • Credit Suisse • Agricultural Bank of China• Bank of China
• ICBC • SMBC• Agricultural Bank of China• Bank of America• Bank of China• Barclays Bank• BNP Paribas• BTMU• China Construction Bank• Citibank
• Crédit Agricole• Credit Suisse• Goldman Sachs Bank• ICBC• ING Bank• Mizuho Bank• Morgan Stanley Bank• UBS
A2 • BTMU • Standard Chartered • China Construction Bank • Standard Chartered • BPCE(Banque Populaire) • Société Générale
A3 • SMBC • Mizuho Bank • Banco Santander • Royal Bank of Scotland
Baa1 • Agricultural Bank of China• Bank of China
• China Construction Bank• ICBC
• UniCredit
Baa2 • Deutsche Bank
SMBC
SMBC
SMBC
* Long-term issuer ratings (if not available, long-term deposit ratings) of operating banks

66
Credit ratings of G-SIBs (Holding companies, by Moody’s / S&P)*
* Long-term issuer ratings (if not available, Senior unsecured ratings for Moody’s) of holding companies
SMFG*3
Jan. 2017
Moody’s S&P
Aaa AAA
Aa1 AA+
Aa2 AA
Aa3 AA-
A1
•SMFG•Bank of New York Mellon•HSBC•Mizuho
•MUFG•Standard Chartered•State Street A+
A2•Wells Fargo •Bank of New York Mellon
•HSBC•MUFG
•State Street•Wells Fargo A
A3•Goldman Sachs•JPMorgan
•Morgan Stanley •SMFG•ING•JPMorgan
•Mizuho•UBS A-
Baa1•Bank of America•Citigroup
•ING•UBS
•Bank of America•Citigroup•Credit Suisse
•Goldman Sachs•Morgan Stanley•Standard Chartered
BBB+
Baa2 •Barclays •Credit Suisse •Barclays BBB
Baa3 •RBS BBB-
Ba1 •RBS BB+
SMFG
SMFG

Completed examining the rationale to hold major strategic shareholdings at the Board of Director’s meeting Profitability is verified by two measures: RARORA and RAROA
RARORA (Risk Adjusted Return on Risk-weighted Asset )Profit after excluding expense, credit cost, shareholding cost / Credit RWA + Stock book-value RWA※ Taking into account the impact of RWA due to tightening of regulation
RAROA (Risk Adjusted Return on Asset)Profit after excluding expense, credit cost, shareholding cost / Total credit exposure + Total equity investments outstanding
• Profitability is also measured against risk-weighted capital (RAROC), but currently used as a referential measurebecause it lacks stability to use as an operational indicator since risk-weighted capital may increase or decreasefrom volatility of stock price
Governance regarding strategic shareholdings
67
Deliberating the rationale for holding strategic sharesDeliberating the rationale for holding strategic shares
In principle, SMFG does not hold the shares of other listed companies. This is in order to help maintain our standards as a globally operating financial institution and respond proactively to global regulation
We determine “the rationale to hold” with comprehensive consideration based on the profitability, the objectives to hold, and other relevant factors for the medium to long term
Basic policy regarding strategic shareholdings(“Corporate governance report” announced on July 2015)
Continuously implement reduction of strategic shareholdings in order to achieve an appropriate level as one of the G-SIFIs
Examine annually the rationale for holding strategic shares of our main strategic share counterparties at the Board of Director’s meeting
Have constructive dialogue with counterparties that lack profitability in order to improve overall profitability. If there is no rationale to hold the shares such as when there is no prospect for improvement in profitability, we will sellthe shares
Begin dialogue to reduce strategic shareholdings even with counterparties that have the rationale to hold strategic shares, in order to mitigate the risk from stock price fluctuations
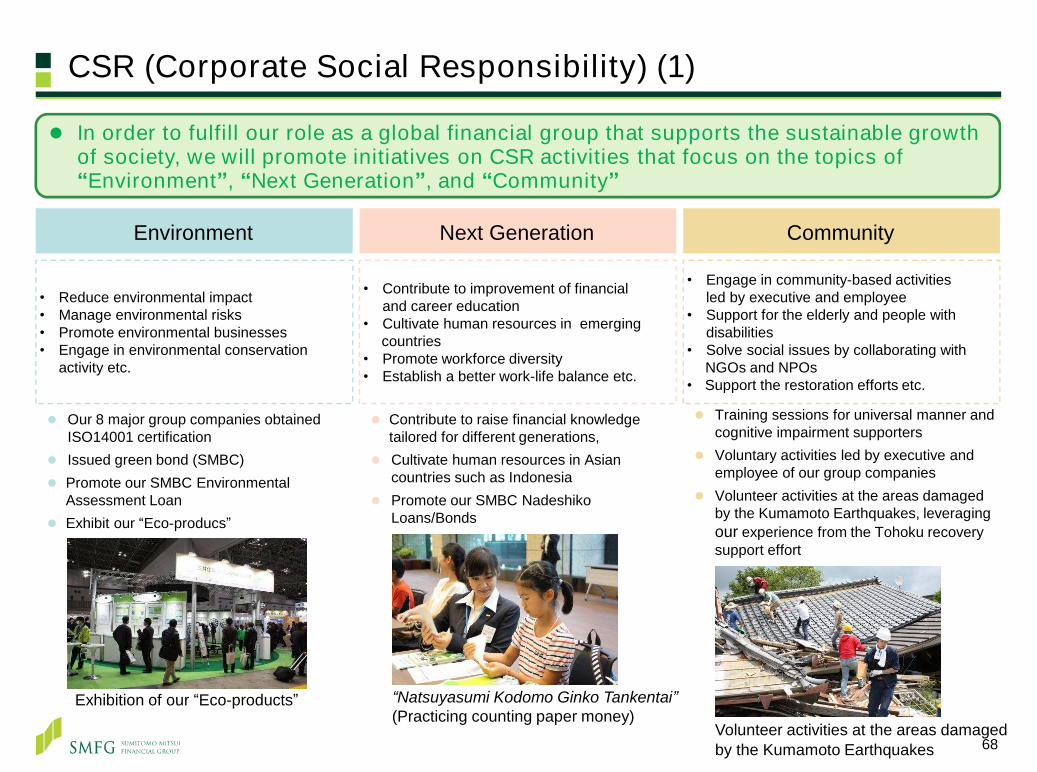
CSR (Corporate Social Responsibility) (1)
Environment Next Generation Community
• Reduce environmental impact• Manage environmental risks• Promote environmental businesses• Engage in environmental conservation
activity etc.
• Contribute to improvement of financial and career education
• Cultivate human resources in emerging countries
• Promote workforce diversity• Establish a better work-life balance etc.
• Engage in community-based activities led by executive and employee
• Support for the elderly and people with disabilities
• Solve social issues by collaborating with NGOs and NPOs
• Support the restoration efforts etc.
Our 8 major group companies obtained ISO14001 certification
Issued green bond (SMBC) Promote our SMBC Environmental
Assessment Loan Exhibit our “Eco-producs”
Contribute to raise financial knowledge tailored for different generations,
Cultivate human resources in Asian countries such as Indonesia
Promote our SMBC NadeshikoLoans/Bonds
Training sessions for universal manner and cognitive impairment supporters
Voluntary activities led by executive and employee of our group companies
Volunteer activities at the areas damaged by the Kumamoto Earthquakes, leveraging our experience from the Tohoku recovery support effort
In order to fulfill our role as a global financial group that supports the sustainable growth of society, we will promote initiatives on CSR activities that focus on the topics of “Environment”, “Next Generation”, and “Community”
Exhibition of our “Eco-products”
Volunteer activities at the areas damaged by the Kumamoto Earthquakes
“Natsuyasumi Kodomo Ginko Tankentai”(Practicing counting paper money)
68
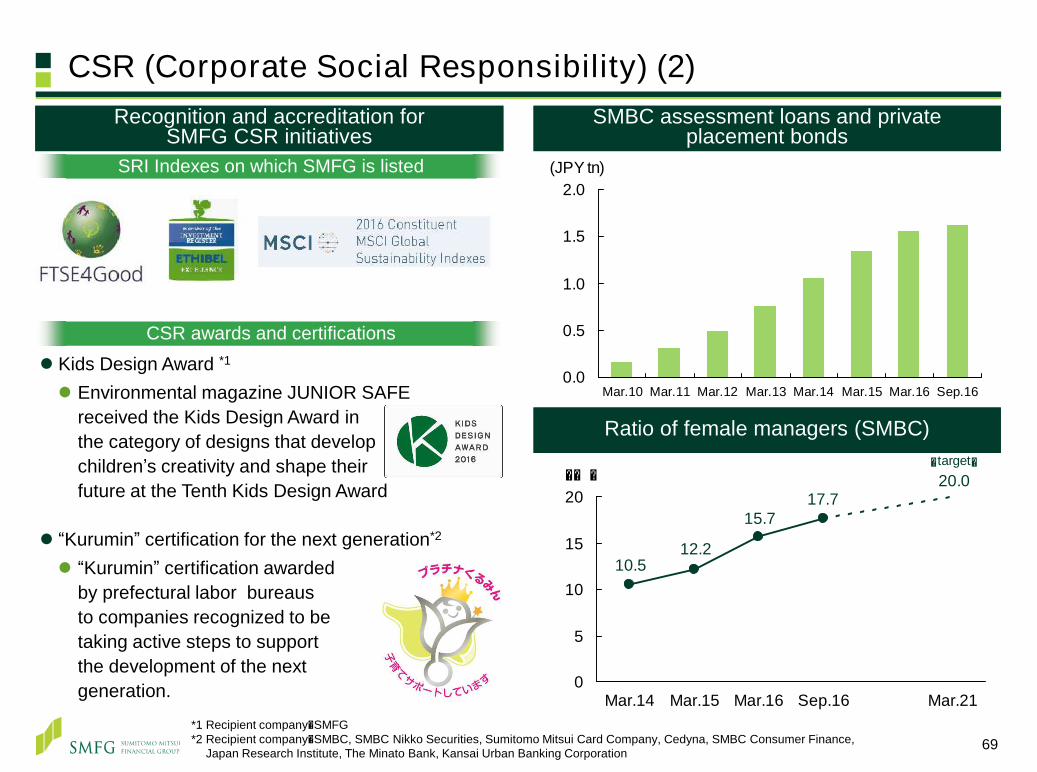
CSR (Corporate Social Responsibility) (2)Recognition and accreditation for
SMFG CSR initiativesRecognition and accreditation for
SMFG CSR initiativesSMBC assessment loans and private
placement bondsSMBC assessment loans and private
placement bonds
Ratio of female managers (SMBC)Ratio of female managers (SMBC)
CSR awards and certifications
SRI Indexes on which SMFG is listed
Kids Design Award *1
Environmental magazine JUNIOR SAFE received the Kids Design Award in the category of designs that develop children’s creativity and shape their future at the Tenth Kids Design Award
“Kurumin” certification for the next generation*2
“Kurumin” certification awarded by prefectural labor bureaus to companies recognized to be taking active steps to support the development of the next generation.
0.0
0.5
1.0
1.5
2.0
Mar.10 Mar.11 Mar.12 Mar.13 Mar.14 Mar.15 Mar.16 Sep.16
(JPY tn)
*1 Recipient company:SMFG*2 Recipient company:SMBC, SMBC Nikko Securities, Sumitomo Mitsui Card Company, Cedyna, SMBC Consumer Finance,
Japan Research Institute, The Minato Bank, Kansai Urban Banking Corporation
(target)20.0
12.210.5
15.717.7
0
5
10
15
20
Mar.14 Mar.15 Mar.16 Sep.16 Mar.21
(%)
69
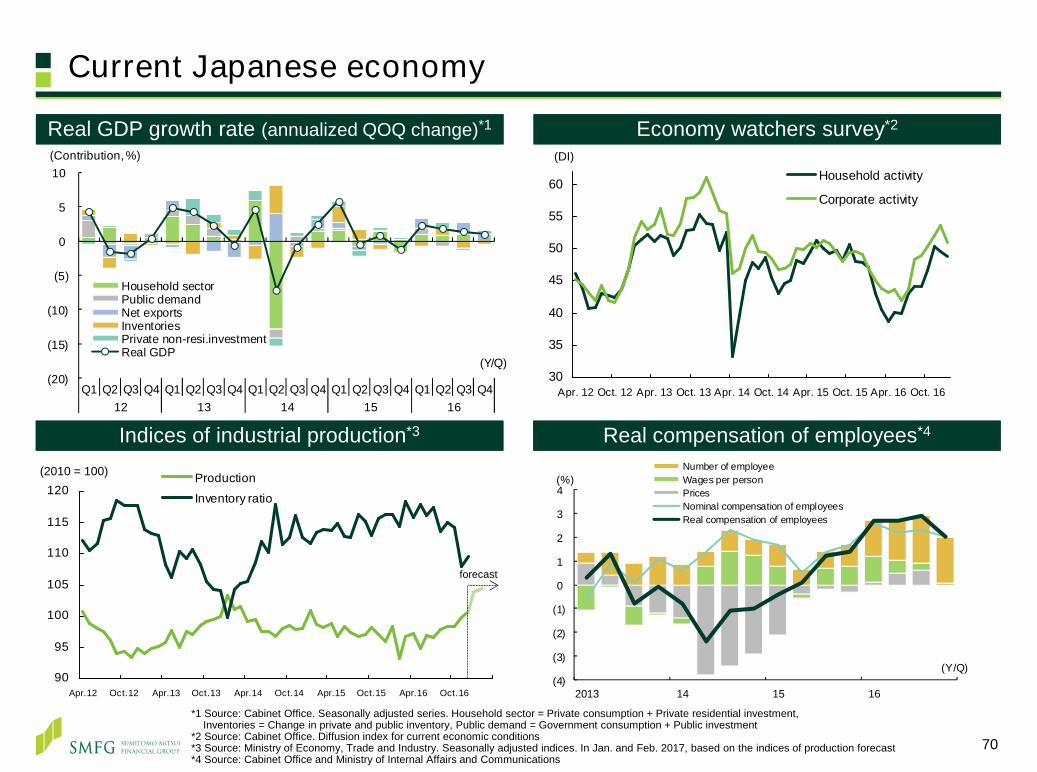
70
Current Japanese economy
Real GDP growth rate (annualized QOQ change)*1Real GDP growth rate (annualized QOQ change)*1 Economy watchers survey*2Economy watchers survey*2
(20)
(15)
(10)
(5)
0
5
10
Q1 Q2 Q3 Q4 Q1 Q2 Q3 Q4 Q1 Q2 Q3 Q4 Q1 Q2 Q3 Q4 Q1 Q2 Q3 Q412 13 14 15 16
Household sectorPublic demandNet exportsInventoriesPrivate non-resi.investmentReal GDP
(Contribution, %)
(Y/Q)
Indices of industrial production*3Indices of industrial production*3
(DI)
30
35
40
45
50
55
60
Apr. 12 Oct. 12 Apr. 13 Oct. 13 Apr. 14 Oct. 14 Apr. 15 Oct. 15 Apr. 16 Oct. 16
Household activity
Corporate activity
90
95
100
105
110
115
120
Apr.12 Oct.12 Apr.13 Oct.13 Apr.14 Oct.14 Apr.15 Oct.15 Apr.16 Oct.16
Production
Inventory ratio
forecast
(2010 = 100)
(4)
(3)
(2)
(1)
0
1
2
3
4
2013 14 15 16
Number of employeeWages per personPricesNominal compensation of employeesReal compensation of employees
(Y/Q)
(%)
Real compensation of employees*4Real compensation of employees*4
*1 Source: Cabinet Office. Seasonally adjusted series. Household sector = Private consumption + Private residential investment, Inventories = Change in private and public inventory, Public demand = Government consumption + Public investment
*2 Source: Cabinet Office. Diffusion index for current economic conditions *3 Source: Ministry of Economy, Trade and Industry. Seasonally adjusted indices. In Jan. and Feb. 2017, based on the indices of production forecast *4 Source: Cabinet Office and Ministry of Internal Affairs and Communications

This document contains “forward-looking statements” (as defined in the U.S. Private SecuritiesLitigation Reform Act of 1995), regarding the intent, belief or current expectations of us and ourmanagements with respect to our future financial condition and results of operations. In manycases but not all, these statements contain words such as “anticipate”, “estimate”, “expect”,“intend”, “may”, “plan”, “probability”, “risk”, “project”, “should”, “seek”, “target” and similarexpressions. Such forward-looking statements are not guarantees of future performance andinvolve risks and uncertainties, and actual results may differ from those expressed in or implied bysuch forward-looking statements contained or deemed to be contained herein. The risks anduncertainties which may affect future performance include: deterioration of Japanese and globaleconomic conditions and financial markets; declines in the value of our securities portfolio; ourability to successfully implement our business strategy through our subsidiaries, affiliates andalliance partners; exposure to new risks as we expand the scope of our business; and incurrenceof significant credit-related costs. Given these and other risks and uncertainties, you should notplace undue reliance on forward-looking statements, which speak only as of the date of thisdocument. We undertake no obligation to update or revise any forward-looking statements.Please refer to our most recent disclosure documents such as our annual report on Form 20-Fand other documents submitted to the U.S. Securities and Exchange Commission, as well asearnings press releases, for a more detailed description of the risks and uncertainties that mayaffect our financial conditions and results of operations, and investors’ decisions.