management summary reports with bams/dss jeff lee derrer, pe, cpm senior consultant info tech, inc....
TRANSCRIPT

Management Summary Reports with BAMS/DSS
Jeff Lee Derrer, PE, CPMSenior ConsultantInfo Tech, Inc.
Presented September 5, 2003 at the TEA Conference in Burlington, VT

Background
• Since the early 1980’s BAMS/DSS has been recognized as the premier software for bid analysis and bid collusion detection.

Background
• Some people only think of BAMS/DSS being used for “catching bidriggers” and hence overlook BAMS/DSS as valuable source of information.
• All Trns•port data is held in the BAMS/DSS database just waiting to be utilized.

Post-Award Analysis
• Quarterly Summaries
• Highway Construction Cost Index
• CY and FY Annual Summaries
• Information Request and Special Reports

Quarterly Summaries
• BAMS/DSS Award Map Model (AWDMAP)
• Stats per Month SAS ad hoc program

Highway Construction Cost Index
• Cost Index SAS ad hoc program

CY & FY Annual Summaries
• BAMS/DSS Market Shares model (MSD2)
• BAMS/DSS Histr. Stats. w/Est. (HSTATE)
• Primary Stats SAS ad hoc program
• Cost Index SAS ad hoc program
• First Time Bidders & Winners SAS ad hoc program
Information Requests & Special Reports
• Many SAS ad hoc programs

Fourth Quarter 2002 SummaryNumber of Number of Average No. of Bidders Number of Total Contract
Month Contracts Let Bids Per Contract Awarded Contracts Award AmountOct-02 23 104 4.5 21 $53,479,759.86Nov-02 3 12 4.0 3 $21,759,849.17Dec-02 7 57 8.1 7 $40,432,211.24
Totals 33 173 5.2 31 $115,671,820.27
0.0
1.0
2.0
3.0
4.0
5.0
6.0
7.0
8.0
9.0
Oct-02 Nov-02 Dec-02
Avg
. N
o.
of
Bid
s
$0.00
$10,000,000.00
$20,000,000.00
$30,000,000.00
$40,000,000.00
$50,000,000.00
$60,000,000.00
Aw
ard
ed D
oll
ars
Average No. of Bids PerContract
Total Awarded Dollars


DISTRICT AWARD MAP
TOTAL AMOUNT $27,003,436 $49,715,051 $67,294,847$71,809,907 $113,531,556
135%
215%
322%
48%
520%
CY 2002 District Awards

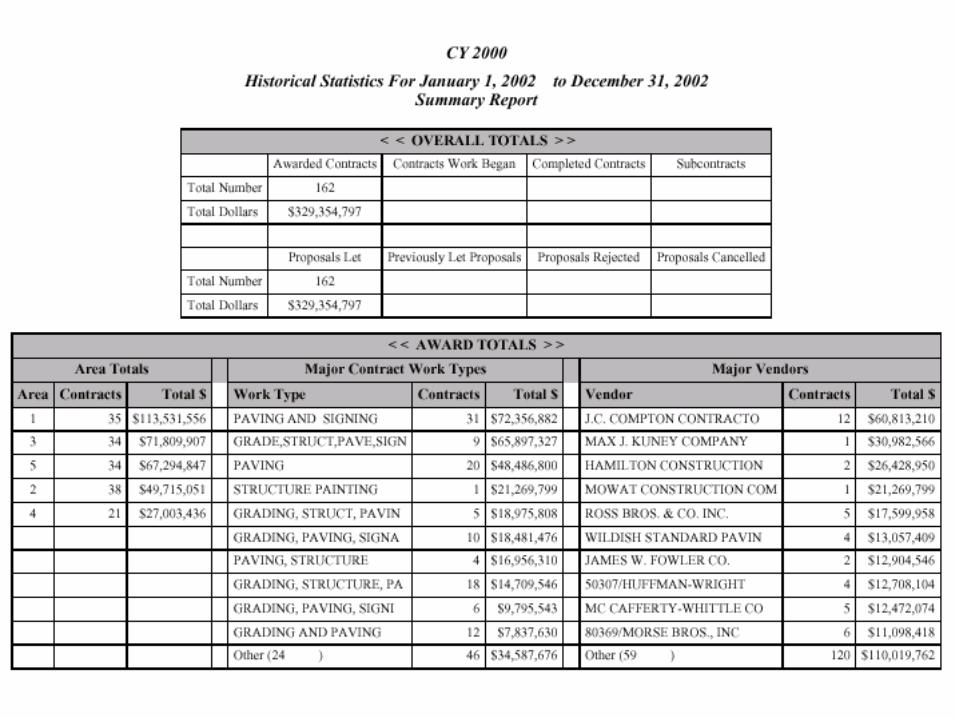
CY 2002
Historical Statistics For January 1, 2000 to December 31, 2003
Total Award Dollars : $329,354,797
Total Number Awarded: 162
Area Award Totals
Area 1 : 35 Area 2 : 38 Area 3 : 34 Area 4 : 21 Area 5 : 34
Dollars $27,003,436 $49,715,051 $67,294,847$71,809,907 $113,531,556
Vendor Award Totals
Other (59 ) Number: 120 Dollars: $110,019,762
FREQ. Dollars
4 $12,708,104
6 $11,098,418
2 $26,428,950
12 $60,813,210
2 $12,904,546
1 $30,982,566
5 $12,472,074
1 $21,269,799
5 $17,599,958
4 $13,057,409
Vendor
80369/MORSE BROS., INC
MC CAFFERTY-WHITTLE CO
50307/HUFFMAN-WRIGHT
JAMES W. FOWLER CO.
WILDISH STANDARD PAVIN
ROSS BROS. & CO. INC.
MOWAT CONSTRUCTION COM
HAMILTON CONSTRUCTION
MAX J. KUNEY COMPANY
J.C. COMPTON CONTRACTO
Dollars
$0 $50,000,000 $100,000,000
Contract Work Type Award Totals
Other (24 ) Number: 46 Dollars: $34,587,676
FREQ. Dollars
9 $65,897,327
12 $7,837,630
10 $18,481,476
6 $9,795,543
5 $18,975,808
18 $14,709,546
20 $48,486,800
31 $72,356,882
4 $16,956,310
1 $21,269,799
Work Type
GRADING AND PAVING
GRADING, PAVING, SIGNI
GRADING, STRUCTURE, PA
PAVING, STRUCTURE
GRADING, PAVING, SIGNA
GRADING, STRUCT, PAVIN
STRUCTURE PAINTING
PAVING
GRADE,STRUCT,PAVE,SIGN
PAVING AND SIGNING
Dollars
$0 $50,000,000 $100,000,000

Average No. of Bidders by Year
4.24.1
5.4
6.0
5.5
5.1
4.5
0
1
2
3
4
5
6
7
1996 1997 1998 1999 2000 2001 2002

Average % Over Estimate2.4
2.1
-6.0-6.3
-6.9
-9.4
-4.2
-10
-8
-6
-4
-2
0
2
4
1996 1997 1998 1999 2000 2001 2002
Note: Negative Numbers Indicate Bids Averaged Under the Estimate.

Avg. % Diff. 1st vs 2nd Bidders
9.2
10.8
15.8
8.8
10.1
8.59.0
0
2
4
6
8
10
12
14
16
18
1996 1997 1998 1999 2000 2001 2002
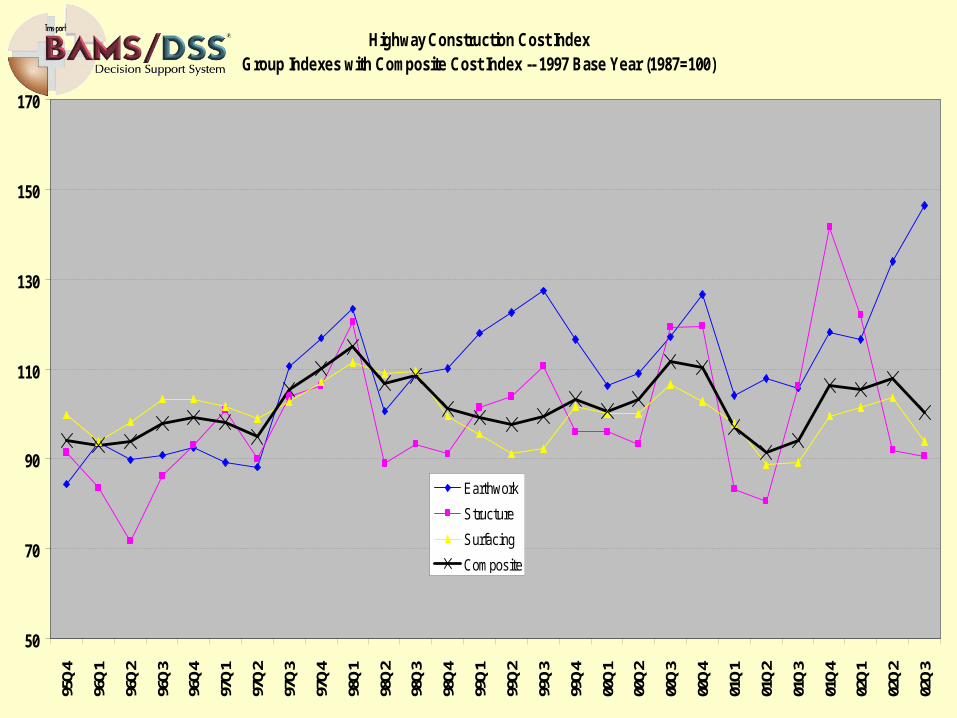
Highway Construction Cost IndexGroup Indexes with Composite Cost Index -- 1997 Base Year (1987=100)
50
70
90
110
130
150
170
95Q
4
96Q
1
96Q
2
96Q
3
96Q
4
97Q
1
97Q
2
97Q
3
97Q
4
98Q
1
98Q
2
98Q
3
98Q
4
99Q
1
99Q
2
99Q
3
99Q
4
00Q
1
00Q
2
00Q
3
00Q
4
01Q
1
01Q
2
01Q
3
01Q
4
02Q
1
02Q
2
02Q
3
Earthwork
Structure
Surfacing
Composite

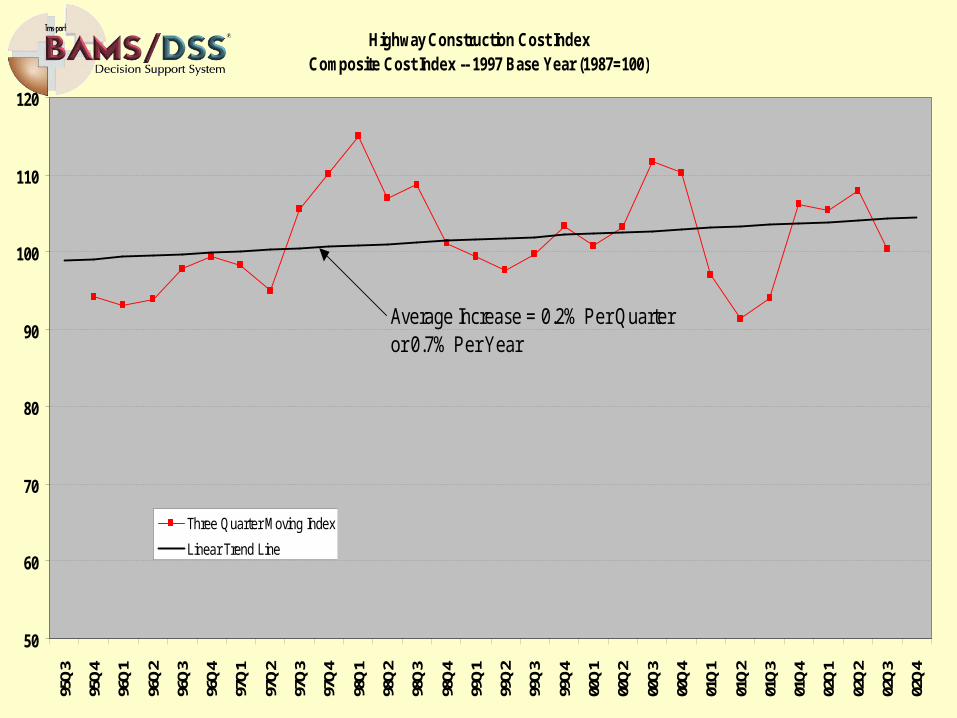
Highway Construction Cost IndexComposite Cost Index -- 1997 Base Year (1987=100)
50
60
70
80
90
100
110
120
130
95Q
3
95Q
4
96Q
1
96Q
2
96Q
3
96Q
4
97Q
1
97Q
2
97Q
3
97Q
4
98Q
1
98Q
2
98Q
3
98Q
4
99Q
1
99Q
2
99Q
3
99Q
4
00Q
1
00Q
2
00Q
3
00Q
4
01Q
1
01Q
2
01Q
3
01Q
4
02Q
1
02Q
2
02Q
3
02Q
4
One Quarter Index
Three Quarter Moving Index
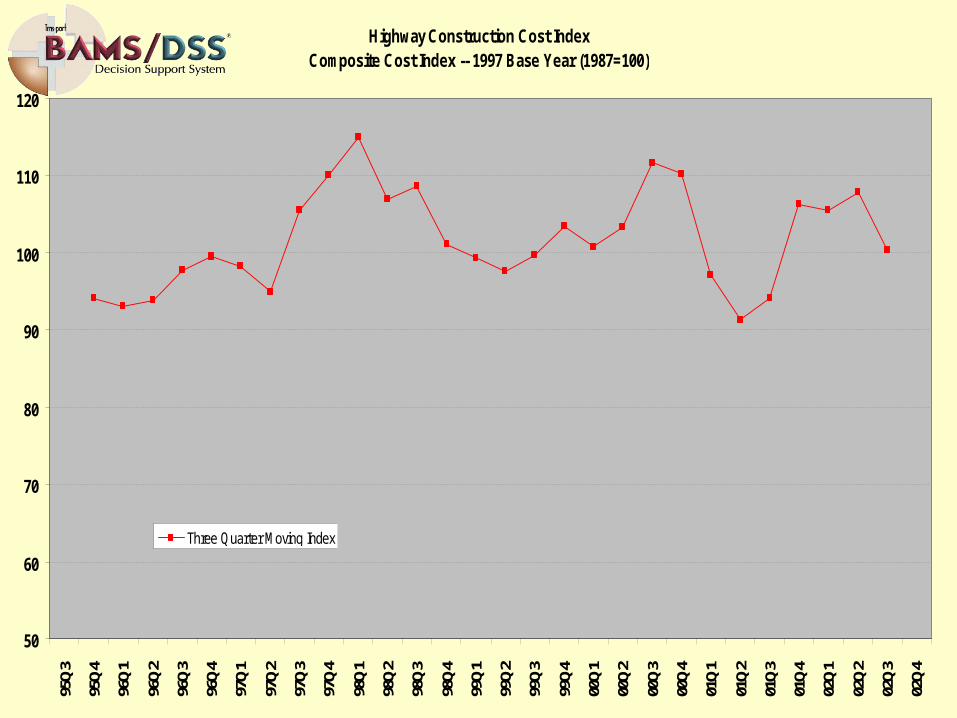
Highway Construction Cost IndexComposite Cost Index -- 1997 Base Year (1987=100)
50
60
70
80
90
100
110
120
95Q
3
95Q
4
96Q
1
96Q
2
96Q
3
96Q
4
97Q
1
97Q
2
97Q
3
97Q
4
98Q
1
98Q
2
98Q
3
98Q
4
99Q
1
99Q
2
99Q
3
99Q
4
00Q
1
00Q
2
00Q
3
00Q
4
01Q
1
01Q
2
01Q
3
01Q
4
02Q
1
02Q
2
02Q
3
02Q
4
Three Quarter Moving Index
Linear Trend Line
Average Increase = 0.2% Per Quarter or 0.7% Per Year

PRICE-QUANTITY REGRESSION RELATIONSHIPITEM NUMBER=0759.0E00100J DESCRIPTION=CONC WALKS
REGION 1 2 3 4 5
PRICE
$10.00
$20.00
$30.00
$40.00
ESTIMATED QUANTITY
0 1,000 2,000 3,000 4,000

Price History ReportsAGGR BASE
Calendar No. of Total Total Avg. Awd'd Avg. of 3Item Region Quarter Occur's Quantity Dollars Price Low Bidders0641.0B00100M 1 2002Q1 3 11,246.00 $131,666 $11.71 $13.37
2002Q2 7 13,319.00 $213,701 $16.04 $15.982002Q3 5 72,255.00 $878,505 $12.16 $12.282002Q4 4 8,340.00 $112,201 $13.45 $13.46
2 2002Q1 5 16,330.00 $207,678 $12.72 $12.922002Q2 9 54,934.00 $621,866 $11.32 $12.642002Q3 4 27,400.00 $321,555 $11.74 $12.752002Q4 3 3,433.00 $75,070 $21.87 $24.31
3 2002Q1 7 82,002.00 $909,871 $11.10 $11.102002Q2 4 21,758.00 $265,880 $12.22 $12.132002Q3 6 45,710.00 $541,713 $11.85 $11.442002Q4 3 3,940.00 $80,750 $20.49 $19.77
4 2002Q1 3 2,015.00 $34,220 $16.98 $17.782002Q2 2 5,400.00 $57,240 $10.60 $12.952002Q3 1 887 $23,062 $26.00 $29.332002Q4 2 3,700.00 $58,100 $15.70 $15.54
5 2002Q1 2 1,690.00 $6,100 $3.61 $12.092002Q2 5 35,075.00 $348,314 $9.93 $10.092002Q3 5 103,915.00 $1,002,523 $9.65 $11.132002Q4 4 25,548.00 $274,476 $10.74 $14.25
84 538,897.00 $6,164,490 $11.44 $12.17

Questions?