management tools for creating government responsiveness · management tools for creating government...
TRANSCRIPT

The Innovation Journal: The Public Sector Innovation Journal, 7(3), 2002, article 10.
______________________________________________________________________________________________________________________________________________________________________________
Management Tools For Creating
Government Responsiveness:
The Liquor Control Board of Ontario as a
Context for Creating Change
David Barrows and
Rosemary McInerney

The Innovation Journal: The Public Sector Innovation Journal, 7(3), 2002, article 10.
____________________________________________________________________________________________________________________________________________________________________________________________
1
Creating Government Responsiveness:
The Liquor Control Board of Ontario as a Context for Creating Change
David Barrows and Rosemary McInerney
Introduction
New approaches to management in the public sector are imperative as governments enter the
new millennium. Market dynamics have created challenges for public organizations, with the
emergence of the global economy, advances in technology, increased societal demands, and the
need to provide more social services with fewer resources.1 As well, a widespread desire for
increased organizational scrutiny has increased the pressure for change, given more accessible
globalized information systems and heightened media attention critical of government
inefficiencies in service delivery. Response mechanisms have emerged within the private market
to meet these recent challenges but government organizations have been slower to respond. This
is understandable, given fiscal constraints and the bureaucratic process axiomatic to
governments. However, a new approach, which incorporates modern strategic management
tools, is necessary for the public sector to achieve improved performance and overall service
quality.
While current public policy models have certainly started to reflect a shift away from traditional
thinking about organizational design and public management, a systematic process for creating
and sustaining improved performance that reflects changes in the environment is clearly absent.
Evidence does exist to suggest change is affecting the public sector, and this change is manifest
in the metamorphosing structures and processes of many public organizations. It is within this
context that this case study is presented.
The guiding principles in any strategic management process, whether in the public or private
sector, are about understanding what changes are needed, how to implement and manage these
changes, and how to create a roadmap for sustaining improvements that lead to better
performance. The difficulty in strategic management is the challenge of laying a foundation for
success in the future while meeting today’s challenges.2 The primary tools available to
organizations - for understanding, implementing, delivering and managing services and change –
are outlined in Diagram 1. This diagram is a brief overview of a common public sector strategic
management model3 (with the addition of change management tools) used in the strategic
planning process. This provides a dynamic method - not just a planning model - for evaluating
the success of public sector organizations in meeting customer demands in the new public
management.
1 K. Kernaghan & D. Siegel, Public Administration in Canada. ITP Nelson: Canada, 1999. P. 3
2 Liam Fahey & Robert Randall, The Portable MBA in Strategy. John Wiley & Sons: U.S., 1994. P. vi.
3 Sections of the diagram taken from Bryson, John M. Strategic Planning for Public and Nonprofit Organizations.
San Francisco: Jossey-Bass Publishers, 1988.

The Innovation Journal: The Public Sector Innovation Journal, 7(3), 2002, article 10.
____________________________________________________________________________________________________________________________________________________________________________________________
2
Diagram 1:
The application of this model helps to identify the components for success and the capabilities of
an organization in its strategic management planning. As illustrated, the first step is information
gathering, which identifies key market, industry and internal organizational trends and
opportunities that will impact the organization. Where “market”, in the public sector contexts,
refers to all relevant stakeholders. The organization’s ability to respond to these critical strategic
issues and challenges is manifest in their vision and the mission statement describing what they
do, with/for whom they do it, their distinctive competence and why they do it.4 The strategic
goals and specific strategies for achieving these goals should be formulated in an operational
plan that also addresses change management issues. From this point, a review of this process
and performance should be ongoing.
In the overall context of these new issues and challenges, this paper presents a case study of the
Liquor Control Board of Ontario (LCBO) as an example of a government service organization
that has been relatively successful in utilizing this managerial approach to assist with the
achievement of stated organizational vision, mission and goals. The LCBO is a crown
corporation established to control the sale of liquor and to promote responsible drinking within
the province of Ontario. The LCBO is an excellent case study for several reasons. First, it has
incorporated many of the policy objectives in the new public sector model and new market
dynamics into its strategic management processes leading to improved performance levels and
customer service. Secondly, the LCBO is recognized as the largest buyer of alcoholic beverages
in the world, with 1999 sales totaling approximately $2.5 Billion. Thirdly, the LCBO’s
operations have drawn attention in both the public and private sector. The LCBO exemplifies
the possibilities for change in the public sector. The private sector Retail Council of Canada
named the LCBO Innovative Retailer of the Year in 1997 and 1998. The case study examines
best practice benchmarks, and four related areas - industry analysis, stakeholders, service
performance, and change management – to determine overall value creation in the LCBO’s
performance.
4 Centre for Public Skills Training Report, p. 4.
Strategic Management Model for
Public Sector Organizations
Information
Gathering
Identify Critical Issues
Vision
Mission
Development of Strategic Goals
Formulation of Strategies for each Goal
Operational Plan based
on Strategic Plan
Must Develop Annual Objectives
•External Assessment
•Internal Assessment
•Market AssessmentReview Performance
& Renew Process
Must
incorporate
change
management
issues

The Innovation Journal: The Public Sector Innovation Journal, 7(3), 2002, article 10.
____________________________________________________________________________________________________________________________________________________________________________________________
3
PUBLIC SECTOR STRATEGIC BENCHMARKING
To evaluate the LCBO’s processes, activities and performance, it is useful to benchmark the
practices of competitors (both within and outside of their sector of commerce) that have become
leaders in their businesses. Examining a range of other benchmarks provides a basis for
evaluation and also helps to create a method for tapping into potentially transferable
organizational learning strategies. Of course, there are additional factors to consider (i.e.
purpose, stakeholders, etc.) since the LCBO is a government organization. The LCBO regulates
the pricing and distribution of alcoholic beverages in Ontario, together with the Ontario Alcohol
and Gaming Commission. Most provinces within Canada have this type of regulating
organization, with the recent exception of Alberta. Diagram 2 is a continuum that illustrates a
three-dimensional range of best practice possibilities for benchmarking the LCBO.
Diagram 2:
The LCBO’s position in the diagram illustrates the derivation of their organizational
benchmarks:
The LCBO looks beyond the government public sector to incorporate private sector
benchmarks;
The scope of their benchmarks extend somewhat beyond their industry (alcohol beverage
industry) to include the larger retail industry; and,
The geographical focus of their benchmarks tends to be more domestic than global.
The significance of these findings is twofold: the LCBO is targeting best practices that are not
limited to the government sector and their immediate industry, and this increases it’s potential to
learn from other organizational strategies. This study does not suggest that success lies in setting
targets stemming from the private sector; instead, it suggests that much can be gained by moving
beyond traditional boundaries for learning. While there are numerous barriers and impediments
to any organizational change, a greater scope of consideration when setting benchmarks could
help the LCBO to become more successful.
Organizational Benchmarking Continuum
Global
Domestic
Regional
Public sector Private Sector
Industry Competitors
Other Industries
LCBO
Geographical Emphasis
Sector Emphasis of Benchmarks
Scope of Industry Benchmarks
Other Retail Industry Competitors
The Innovation Journal: The Public Sector Innovation Journal, 7(3), 2002, article 10.
____________________________________________________________________________________________________________________________________________________________________________________________
4
Key Success Factors
The LCBO is uniquely positioned because it acts as a regulator and a retailer in the alcohol
beverage industry. While competing for customers and market share against other wineries,
breweries and distillers, it also functions in two other capacities: working with industry
associations to help retailers forge access and growth in export markets, and collecting taxes
from alcohol sales. As a wholesaler, the LCBO participates in secondary customer segments,
collecting license fees and regulating the activities of Brewers Retail (beer distribution), Agency
Stores, Duty Free Operations (i.e. border crossings), Private Stock and Classics Private Stock,
and Classic Catalogue shoppers.
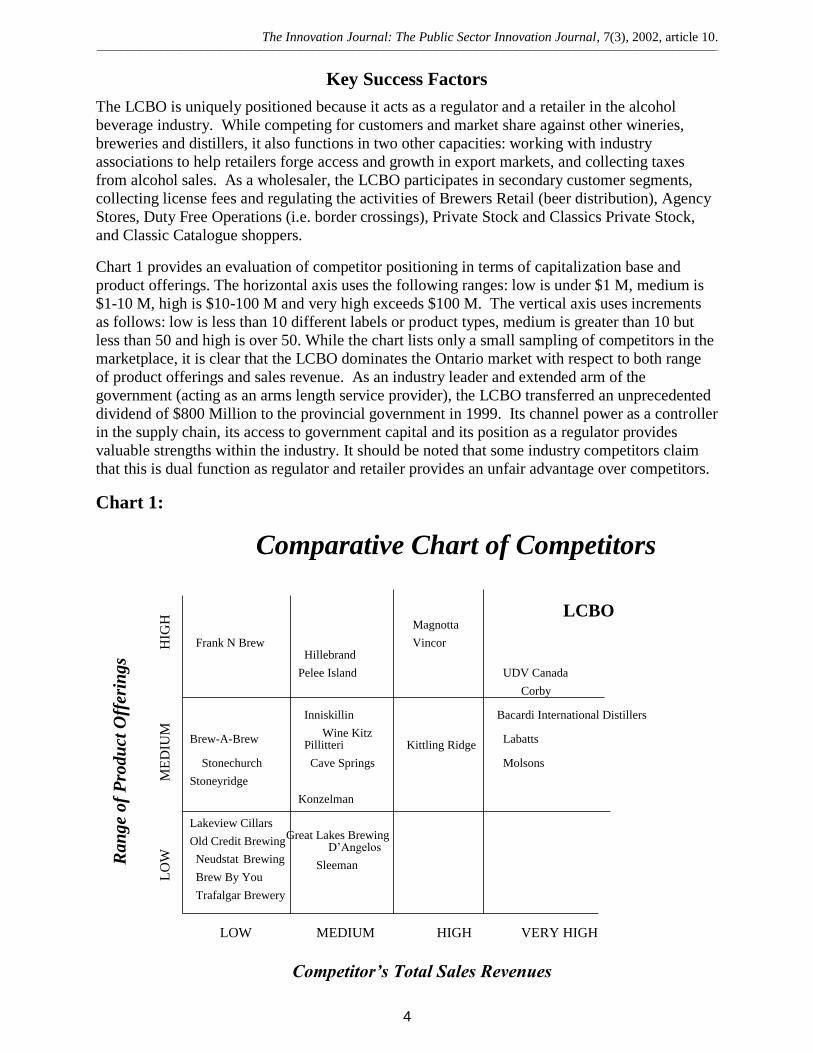
Chart 1 provides an evaluation of competitor positioning in terms of capitalization base and
product offerings. The horizontal axis uses the following ranges: low is under $1 M, medium is
$1-10 M, high is $10-100 M and very high exceeds $100 M. The vertical axis uses increments
as follows: low is less than 10 different labels or product types, medium is greater than 10 but
less than 50 and high is over 50. While the chart lists only a small sampling of competitors in the
marketplace, it is clear that the LCBO dominates the Ontario market with respect to both range
of product offerings and sales revenue. As an industry leader and extended arm of the
government (acting as an arms length service provider), the LCBO transferred an unprecedented
dividend of $800 Million to the provincial government in 1999. Its channel power as a controller
in the supply chain, its access to government capital and its position as a regulator provides
valuable strengths within the industry. It should be noted that some industry competitors claim
that this is dual function as regulator and retailer provides an unfair advantage over competitors.
Chart 1:
Comparative Chart of Competitors
Ran
ge
of
Pro
du
ct O
ffer
ings
Competitor’s Total Sales Revenues
LOW
LO
W
MEDIUM
ME
DIU
M
HIGH
HIG
H
LCBO
Vincor
VERY HIGH
UDV Canada
Labatts
Sleeman
Great Lakes Brewing
Magnotta
Brew-A-Brew
Frank N Brew
Pillitteri
Pelee Island
Neudstat Brewing
Hillebrand
Kittling Ridge
Inniskillin
Wine Kitz
Cave Springs
D’Angelos
Konzelman
Stonechurch
Stoneyridge
Lakeview Cillars
Trafalgar Brewery
Molsons
Corby
Bacardi International Distillers
Old Credit Brewing
Brew By You
The Innovation Journal: The Public Sector Innovation Journal, 7(3), 2002, article 10.
____________________________________________________________________________________________________________________________________________________________________________________________
5
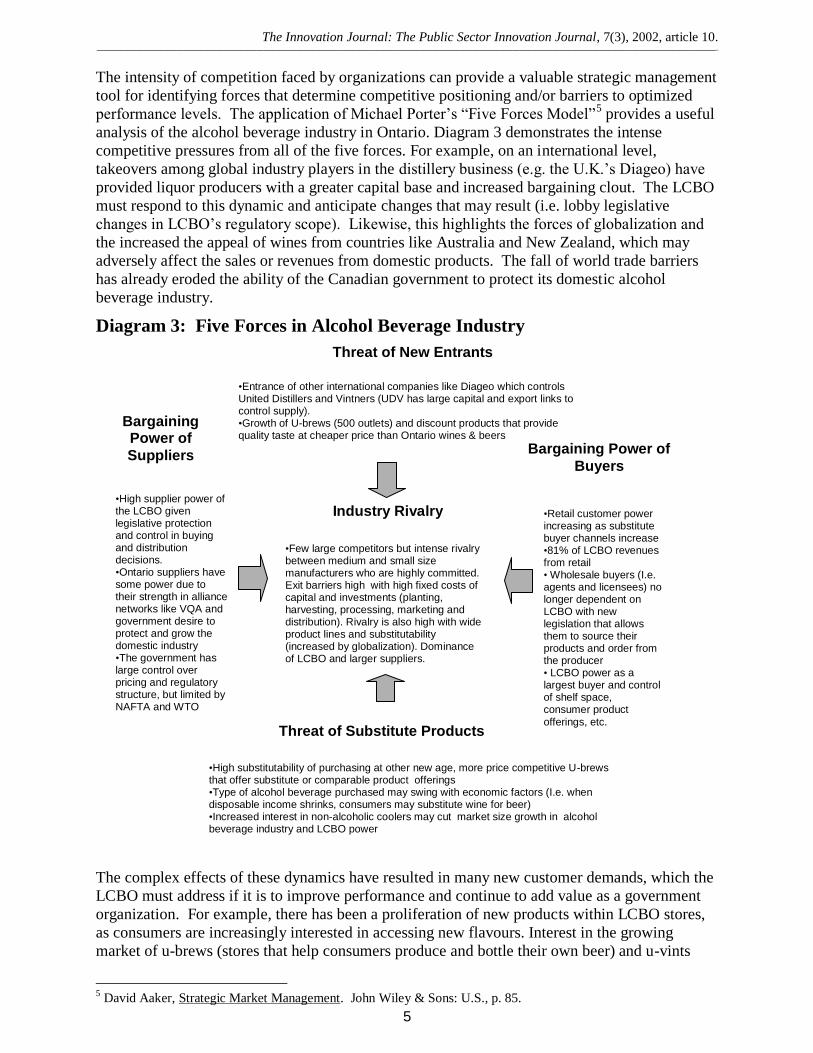
The intensity of competition faced by organizations can provide a valuable strategic management
tool for identifying forces that determine competitive positioning and/or barriers to optimized
performance levels. The application of Michael Porter’s “Five Forces Model”5 provides a useful
analysis of the alcohol beverage industry in Ontario. Diagram 3 demonstrates the intense
competitive pressures from all of the five forces. For example, on an international level,
takeovers among global industry players in the distillery business (e.g. the U.K.’s Diageo) have
provided liquor producers with a greater capital base and increased bargaining clout. The LCBO
must respond to this dynamic and anticipate changes that may result (i.e. lobby legislative
changes in LCBO’s regulatory scope). Likewise, this highlights the forces of globalization and
the increased the appeal of wines from countries like Australia and New Zealand, which may
adversely affect the sales or revenues from domestic products. The fall of world trade barriers
has already eroded the ability of the Canadian government to protect its domestic alcohol
beverage industry.
Diagram 3: Five Forces in Alcohol Beverage Industry
The complex effects of these dynamics have resulted in many new customer demands, which the
LCBO must address if it is to improve performance and continue to add value as a government
organization. For example, there has been a proliferation of new products within LCBO stores,
as consumers are increasingly interested in accessing new flavours. Interest in the growing
market of u-brews (stores that help consumers produce and bottle their own beer) and u-vints
5 David Aaker, Strategic Market Management. John Wiley & Sons: U.S., p. 85.
Threat of New Entrants
Threat of Substitute Products
Bargaining Power of
Buyers
Bargaining Power of
Suppliers
Industry Rivalry
•Few large competitors but intense rivalry between medium and small size manufacturers who are highly committed. Exit barriers high with high fixed costs of capital and investments (planting, harvesting, processing, marketing and distribution). Rivalry is also high with wide product lines and substitutability (increased by globalization). Dominance of LCBO and larger suppliers.
•High supplier power of the LCBO given legislative protection and control in buying and distribution decisions. •Ontario suppliers have some power due to their strength in alliance networks like VQA and government desire to protect and grow the domestic industry •The government has large control over pricing and regulatory structure, but limited by NAFTA and WTO
•High substitutability of purchasing at other new age, more price competitive U-brews that offer substitute or comparable product offerings •Type of alcohol beverage purchased may swing with economic factors (I.e. when disposable income shrinks, consumers may substitute wine for beer) •Increased interest in non-alcoholic coolers may cut market size growth in alcohol beverage industry and LCBO power
•Entrance of other international companies like Diageo which controls United Distillers and Vintners (UDV has large capital and export links to control supply). •Growth of U-brews (500 outlets) and discount products that provide quality taste at cheaper price than Ontario wines & beers
•Retail customer power increasing as substitute buyer channels increase •81% of LCBO revenues from retail • Wholesale buyers (I.e. agents and licensees) no longer dependent on LCBO with new legislation that allows them to source their products and order from the producer • LCBO power as a largest buyer and control of shelf space, consumer product
offerings, etc.
The Innovation Journal: The Public Sector Innovation Journal, 7(3), 2002, article 10.
____________________________________________________________________________________________________________________________________________________________________________________________
6
(consumers produce and bottle their own wine) has increased, as these outlets provide new
flavours of discount wine and beer and threaten the traditional supply channel control of the
LCBO.
The LCBO has tried to incorporate an analysis of these dynamic forces into their strategic
planning process on both a short and long-term basis. The LCBO uses a long-term planning
process with a five-year time horizon and annual strategic reviews. Weekly “roll out” meetings
among senior management staff are used to check quantitative and qualitative performance
measurements against organizational targets.6 In addition, private sector practices such as the
outsourcing of market research have been used to continually gather and reassess industry
information about retail consumers and competitors.
The LCBO has included in its strategic plan:
A customer-focussed approach – how to provide higher customer value;
A branding vision and whole branding strategy;
An explicit identification of the LCBO’s strategic competitive advantage through knowledge
acquisition; and,
Quantifiable performance measurements as a “retailer” (this is a very progressive
accountability measurement and perspective for servicing in the public sector).
Despite its progressiveness, however, the LCBO largely uses industry-specific and internally-
driven benchmarks from what it calls a “Strategic Scorecard”.7 The scorecard measures four key
information sources: financial, customer research, competitive analysis and employee research.
The performance measurements from information gathering sources (i.e. Customer Service
Survey and Employee Survey) have set performance benchmarks at ratings from 8 to 10 (out of a
total of 10). While the best external benchmark is the competitive analysis that looks at other
industry competitors, other industries (with the exception of the retail industry) and global
retailers are not considered.
The benchmarks set by the LCBO are high but it would be beneficial to look at best practice
benchmarks by giants such as Walmart or Chapters (the Canadian chain of retail bookstores),
who strive for 100% satisfaction in the retailing industry. If a customer is not satisfied with a
product or service, refunds are issued and these companies try to understand and learn what can
be done to prevent this in the future. While this benchmark appears at first to be too costly, the
relationship building and customer retention rate may translate into huge dividends in customer
loyalty and future sales growth.8
While the LCBO does not appear to have any organizational benchmarks for measuring
communication and information flows across organizational departments, communication
systems have been computerized much more than most other government organizations (with the
exception of the Ontario Lottery Corporation).9 In 1990 and 1991, stores and warehouses were
linked by computer to head office and a computerized network of inventory and sales was added;
as of 1999, approximately $80 million has been spent on IT systems. An Intranet linking head
office departments and bigger stores is operational and future plans to extend this to all stores
and to wholesalers is underway.
6 Unfortunately, these measurements were not made available.
7 Based on interviews with senior management at the LCBO head office.
8 Joiner, Fourth Generation Management. RR Donnelly & Sons: U.S., P. 80-81.
9 Based on interviews with management and discussion with government sector employees.

The Innovation Journal: The Public Sector Innovation Journal, 7(3), 2002, article 10.
____________________________________________________________________________________________________________________________________________________________________________________________
7
Notwithstanding the benefits of these technological communication systems, overall
communications are somewhat weakened by the limited use of cross-functional teams. Cross-
functional teams help to improve communication flows by building in layers of redundancy that
are important to prevent a real or perceived lack of information sharing. For example, there is a
recognized need to include the Social Responsibility Department in most activities and programs
and the department’s prestige is growing (evidenced by its increasing budget and reporting
directly to the CEO). However, the department’s size is surprisingly small relative both to other
departments (i.e. fewer personnel, smaller budget, etc.), and the large role it plays in fulfilling the
LCBO’s mandate to promote the responsible use of beverage alcohol. Systemic policies or
processes have not been established to ensure growth in this area.
Benchmarking practices to stimulate growth through cross-functional team efforts (i.e. measure
number of teams, percentage of employee participation, percentage of employee driven
initiatives, etc.) would certainly help to further organizational learning practices, build
innovation and foster a greater shared culture. By allowing for new systems to grow outside the
formal organizational architecture (i.e. committees or task forces developed in response to a need
or issue), communications will increase and emerging strategies will germinate.
STAKEHOLDER ASSESSMENT
Understanding the interests of stakeholders is extremely critical in public sector management.
Government responsiveness to these interests and the interests of society as a whole are
fundamental to service delivery and performance. Information gathering is crucial and must be
ongoing. Diagram 4 illustrates the various LCBO stakeholders, and their proximity to the centre
depicts their relative importance to the LCBO’s success. The key drivers for positioning
stakeholders in this chart were their importance to the LCBO’s growth, their threat if interests
were not met, and their importance given the LCBO’s rationale/mandate for existence.
Diagram 4:
The five most important stakeholders identified are retail customers, taxpayers, industry
associations, the provincial government and unions. Summary findings for these stakeholders
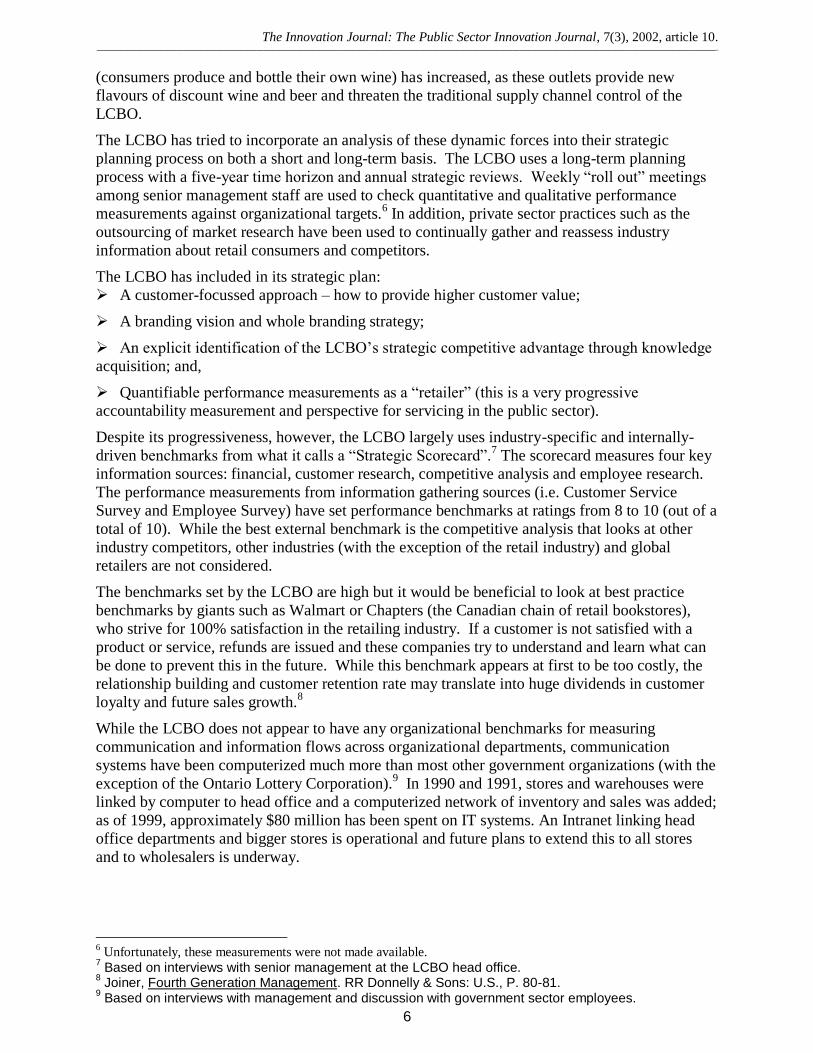
are presented in Chart 2, and additional comments about areas of concern for the LCBO follow.
LCBO
Stakeholder Chart
Taxpayers
Interest Groups
Media
Local Gov’t
Prov'l Gov’t
Other Gov’t Ministries
Fed’l Gov’t
Domestic
Suppliers
Brewers Retail
Distillers
Agents
Licensees
Import SuppliersSocial Responsibility
Interest Groups
Industry Assns
and Councils
UnionRetail
Consumers
Employees
The Innovation Journal: The Public Sector Innovation Journal, 7(3), 2002, article 10.
____________________________________________________________________________________________________________________________________________________________________________________________
8
Chart 2: Summary Findings of Stakeholder Assessment
Stakeholder
Importance to
LCBO Growth
Threat to LCBO
if Interest Not
Met
Importance to
LCBO’s
Mandate
Overall Success
Retail
Customer
Retail customers
represent 81% of
the LCBO’s
revenue and are
their primary
marketing target.
If customers are
dissatisfied, they
will buy from other
competitors, and
this will weaken
the ability of the
LCBO to control
issues associated
with the sale of
alcohol (i.e. sale to
minors).
The people of
Ontario are the
LCBO’s mandate
- to set fair prices,
and regulate the
sale of and
distribution of
alcohol.
Customer surveys
indicate overall
satisfaction rates
that are improving
annually, and the
LCBO’s new
branding strategy
(segmenting
customers into 5
categories) has
helped to identify
more specific
needs.
Taxpayer
Taxpayers fund
the capital
investments
through taxation
and their political
voice.
If taxpayer interests
are not met,
increased media
attention may be
critical of the
organization, which
could lead to
reduced funding or
the threat of
privatization.
Taxpayers must
believe that the
LCBO adds
value, and that the
sale of liquor
should be
government
regulated.
Taxpayers
concerns -
affordable quality
products, quality
service, and
regulated
responsible use of
alcohol - are
satisfied since they
still favour
government
control.
Industry
Assn.
The LCBO’s
product offering
and availability is
related to
networks
established by the
Associations, who
act as alliance
groups to meet
suppliers’
interests.
Suppliers have a
direct influence
over product
quality and are key
to maintaining
supply chain
management and
regulating health &
safety issues.
Associations
represent industry
interests to ensure
fair competition
and marketing
practices.
This contributes
to the success of
the LCBO in its
regulatory role.
Industry
associations have
not been
particularly happy
with LCBO’s role
as retailer and
regulator. They are
concerned over
LCBO expansion
into beer sales and
control over many issues such as shelf
space allotment.
Provincial
Gov’t
Since the LCBO
is directly
responsible to the
Ministry of
Consumer and
Commercial
If the LCBO is not
successful in
meeting the needs
of the provincial
government, the
organization may
The LCBO’s
mandate is to act
on behalf of the
province.
Government
interests are
The LCBO’s
success in ensuring
the protection of
society’s interests
is demonstrated on
many levels. Retail
The Innovation Journal: The Public Sector Innovation Journal, 7(3), 2002, article 10.
____________________________________________________________________________________________________________________________________________________________________________________________
9
Relations, its
work with this
office and other
Ministries affects
its scope of
power, funding,
organization, etc.
which all affect
growth.
be privatized or its
powers and
functions reduced.
paramount, and
the Premier (who
acts on the
influence of the
people and
industry
associations) sets
these interests.
initiatives (i.e.
challenge and
refusal to serve
minors programs)
and LCBO
partnering with
over 2000
government,
corporate, and
nonprofit agencies
(i.e. Ministry of
Transportation,
Red Cross) have
resulted in success
and cost sharing
programs.
Union
There are 5,000
LCBO
employees, 85%
of who are
unionized. Their
interests and
cooperation are
necessary to
provide the
services and
delivery of
products that
affect the
LCBO’s growth.
If union interests
are not met, the
quality of service is
weakened. The
extreme case of a
strike would
prevent the LCBO
from carrying out
its mandate.
As in many retail
organizations, the
workers are key
in the delivery
process.
Employees must
be vigilant in
following
guidelines for
regulating the sale
and distribution
of alcohol.
LCBO
commitment to
employee
satisfaction is
manifest in
continuous
education
improvement
programs (i.e.
computer training),
but despite these
training
opportunities,
employee surveys
indicate that salary
levels are
unsatisfactory.
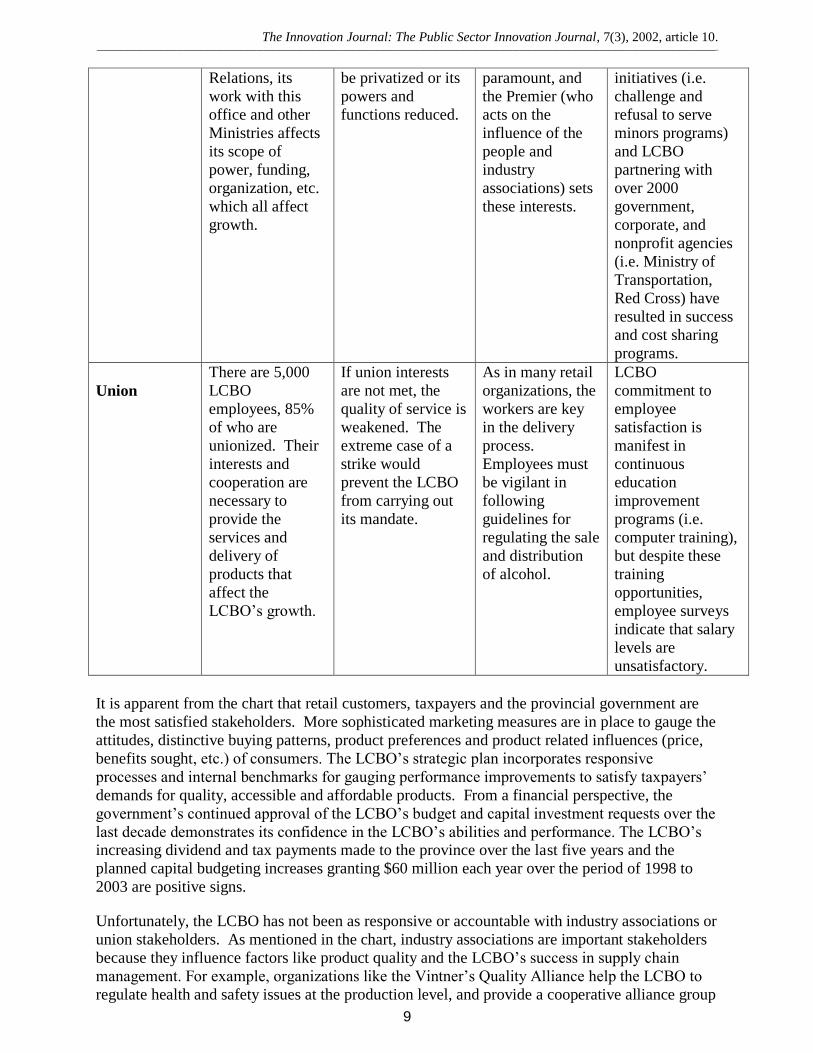
It is apparent from the chart that retail customers, taxpayers and the provincial government are
the most satisfied stakeholders. More sophisticated marketing measures are in place to gauge the
attitudes, distinctive buying patterns, product preferences and product related influences (price,
benefits sought, etc.) of consumers. The LCBO’s strategic plan incorporates responsive
processes and internal benchmarks for gauging performance improvements to satisfy taxpayers’
demands for quality, accessible and affordable products. From a financial perspective, the
government’s continued approval of the LCBO’s budget and capital investment requests over the
last decade demonstrates its confidence in the LCBO’s abilities and performance. The LCBO’s increasing dividend and tax payments made to the province over the last five years and the
planned capital budgeting increases granting $60 million each year over the period of 1998 to
2003 are positive signs.
Unfortunately, the LCBO has not been as responsive or accountable with industry associations or
union stakeholders. As mentioned in the chart, industry associations are important stakeholders
because they influence factors like product quality and the LCBO’s success in supply chain
management. For example, organizations like the Vintner’s Quality Alliance help the LCBO to
regulate health and safety issues at the production level, and provide a cooperative alliance group
The Innovation Journal: The Public Sector Innovation Journal, 7(3), 2002, article 10.
____________________________________________________________________________________________________________________________________________________________________________________________
10
for networking with wineries. The Association for Canadian Distillers, the Wine Council of
Ontario, and the Imported Wine and Beer Association, are all industry association groups that
network with the LCBO. A formalized policy process (established committee or task force) for
incorporating their interests and establishing benchmarks to evaluate the LCBO’s responsiveness
to these organizations does not yet exist. In contrast, the Australian Wine and Brandy
Corporation has many committees devoted to protecting the interests of associations, one of
which includes a framework for incorporating them into the strategic planning process.10
While these associations all agree that the LCBO has done a much better job retailing alcohol
beverages, they believe the LCBO is not responsive enough to their interests mainly because it
still operates much like a monopoly.11
The establishment of a formal joint LCBO-Industry
committee or policy process to incorporate the ongoing interests and concerns of associations
(i.e. to ensure that fair marketing and competition for listing beer, wine and spirits products)
would be advantageous from two perspectives. It would provide a formal basis for measuring
the LCBO’s responsiveness to industry needs, and it would also improve external perceptions of
their inclusiveness.
Unlike the industry associations, the interests of the LCBO employees are directly incorporated
into the LCBO in several ways. Employees are protected in their bargaining process and the
LCBO’s strategic planning process but concerns over job security and salary have been at issue
over the last decade. The potential for a strike in June 2000 was averted despite anger over salary
increases of between 1 to 1 ½ percent (while management increases have averaged between 31-
34% this past year12
). To manage the discrepancy in pay increases and prevent the erosion of
morale (and fall out repercussions such as lower productivity, strike threats, etc.) created from
this inequity, the LCBO needs to identify creative solutions. The union structure does not permit
salary bonuses but other rewards and incentives (i.e. job promotions with perks) may present
viable solutions.
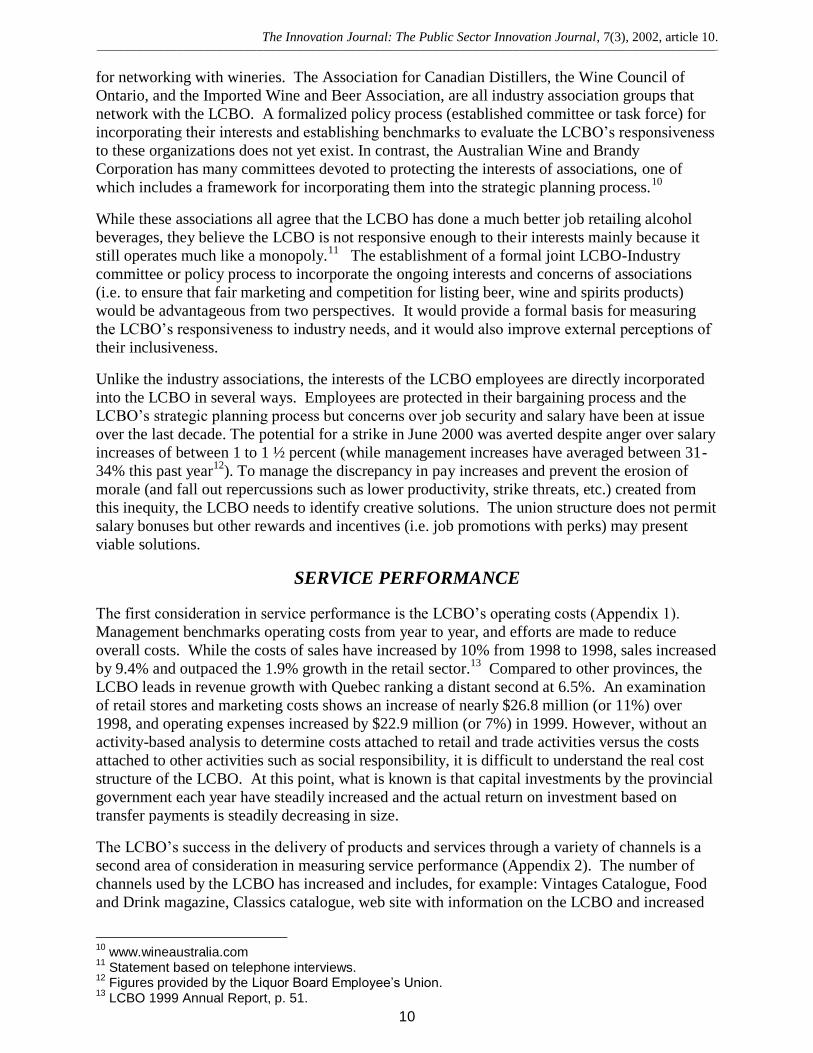
SERVICE PERFORMANCE
The first consideration in service performance is the LCBO’s operating costs (Appendix 1).
Management benchmarks operating costs from year to year, and efforts are made to reduce
overall costs. While the costs of sales have increased by 10% from 1998 to 1998, sales increased
by 9.4% and outpaced the 1.9% growth in the retail sector.13
Compared to other provinces, the
LCBO leads in revenue growth with Quebec ranking a distant second at 6.5%. An examination
of retail stores and marketing costs shows an increase of nearly $26.8 million (or 11%) over
1998, and operating expenses increased by $22.9 million (or 7%) in 1999. However, without an
activity-based analysis to determine costs attached to retail and trade activities versus the costs
attached to other activities such as social responsibility, it is difficult to understand the real cost
structure of the LCBO. At this point, what is known is that capital investments by the provincial
government each year have steadily increased and the actual return on investment based on
transfer payments is steadily decreasing in size.
The LCBO’s success in the delivery of products and services through a variety of channels is a
second area of consideration in measuring service performance (Appendix 2). The number of
channels used by the LCBO has increased and includes, for example: Vintages Catalogue, Food
and Drink magazine, Classics catalogue, web site with information on the LCBO and increased
10
www.wineaustralia.com 11
Statement based on telephone interviews. 12
Figures provided by the Liquor Board Employee’s Union. 13
LCBO 1999 Annual Report, p. 51.
The Innovation Journal: The Public Sector Innovation Journal, 7(3), 2002, article 10.
____________________________________________________________________________________________________________________________________________________________________________________________
11
opportunities for more transaction methods (i.e. telephone or fax catalogue orders to be picked
up in person). These publications and channels are impressive but from a global perspective, the
absence of on-line shopping is sharply noticeable. The LCBO’s decision to move slowly into
this area recognizes the need to balance consumer demands with the interests of social
responsibility (i.e. concern for sales to minors or intoxicated persons). Future performance
improvements might include an LCBO web site advertising a full range of product selections and
supplementary information to educate the consumer (LCBO surveys indicate that this demand is
growing). For Internet sales, the LCBO could consider the recommendations of the Wine
Institute, which favours creative approaches to direct shipping to protect minors while allowing
adult consumers the choices they demand.14
Many U.S. states have legalized the direct shipments
of limited amounts of wine to adult consumers from out-of-state, and even more states permit
direct shipments from retailers within the state. Packaging and labeling regulations could be
introduced, and web-sites like those of Australia or the United Kingdom provide ordering,
pricing and delivery.15
Australia also offers The Business Channel16
, designed to enable the
business community to transact business over the Internet. The LCBO has started to implement
business to business transactions (limited to larger suppliers with compatible software) but a
networked system could be established for licencees or agents to improve service ordering and
delivery.
A final consideration in service performance is innovation. The LCBO has become more
innovative, and shares one very important commonality with private sector innovators like Visa
and General Electric: it is a learning organization.17
The existence of a Knowledge Resource
Group and the creation of its own training centre for understanding market trends and finance,
are just two examples of the innovative processes established at the LCBO. The LCBO’s efforts
to continually improve programs and processes in employee training (i.e. new teaching videos),
marketing strategies (expanding into the gift market), IT, R&D (product testing), and knowledge
management will certainly continue to foster innovation.
CHANGE MANAGEMENT
A discussion of strategic management would not be complete without addressing the role of
change management as a key enabler for innovation. Change management recognizes that a
“multiplicity of factors influence an organization’s ability to change”18
. In this regard, a
definitive strategy and structure are not enough when considering the implementation of a
customer-focused approach.
This is one area in particular where senior management at the LCBO have done an excellent job
in meeting the challenges of transforming this, previously slow and bureaucratic, agency of
government into a more dynamic and responsive organization. The diagram below identifies the
7-S model that can be used to explain why this change was so successful. By aligning the seven
factors, victories in strategic management were possible. Summary highlights within each area
are provided.
14
www.wineinstitute.org/communications/general/salesminors.htm 15
See www.winetitles.com.au/gwrds and www.wsa.org.uk 16
See www.businesschannel.sa.gov.au 17
The definition of a learning organization is found in: Gareth Morgan, Images of Organization. Sage Publ.: U.S., 1997, p. 86. The definition stresses the continuous process of information exchange between systems and environments. 18
R. Waterman, T. Peters and J. Phillips, “Structure is not Organization”, in Business Horizons. June 1980, p. 59.

The Innovation Journal: The Public Sector Innovation Journal, 7(3), 2002, article 10.
____________________________________________________________________________________________________________________________________________________________________________________________
12
Diagram 4:
The leadership of senior management staff was critical for change management, and fostered
change agents that worked for a common benefit. These factors, together with continuity in
management (not always possible in government) provided stability. The LCBO had time to
develop and implement changes despite a change in the provincial party leadership within this
decade. (The Progressive Conservatives replaced the New Democratic Party in 1994.) Over
time, the President of the Employees’ Union and LCBO management were able to break down
historic barriers of mistrust and work toward achieving common goals.19
An informal agreement
between the CEO and the union President to keep communication lines open created new
attitudes and trust.
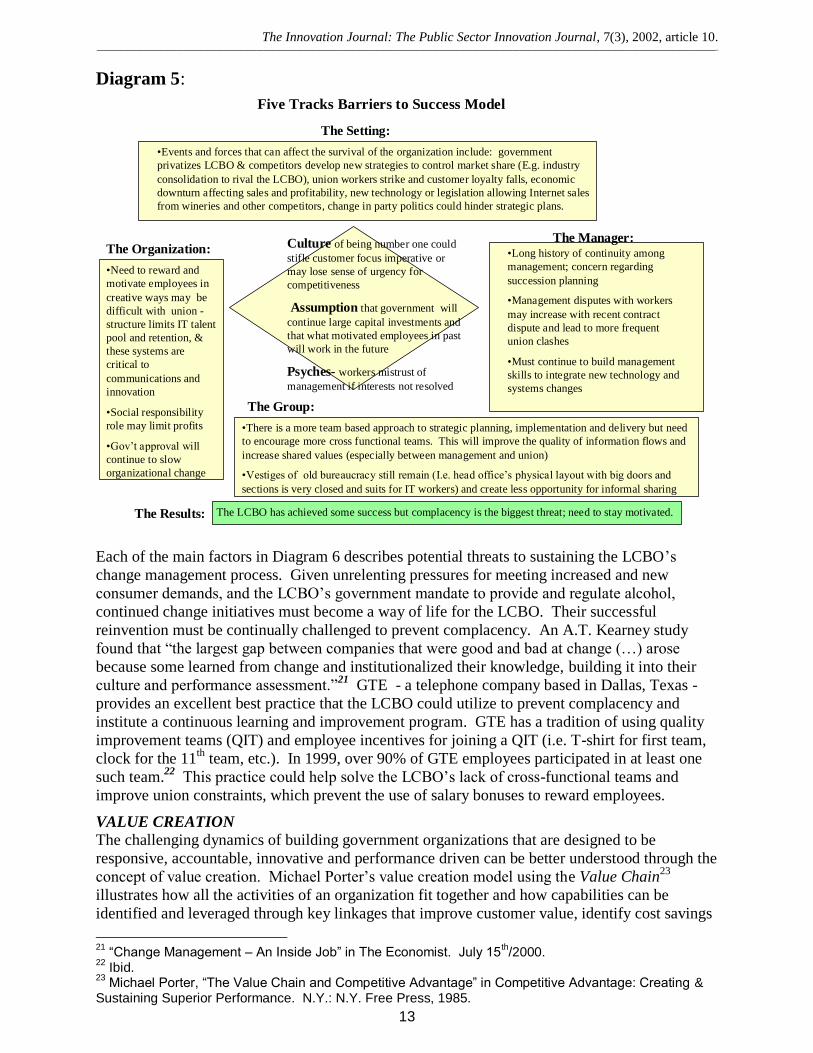
The LCBO’s remaining barriers to change are illustrated using Ralph Kilman’s Five Tracks
Barriers to Success Model20
. Diagram 5 provides a summary of uncontrollable forces (the
setting, human psyches and assumptions) and controllable forces (culture, managers’ skills,
group approaches to decision making and problem solving, strategic choices and structural
arrangements and the purpose and design of the reward system) that will affect future change
management initiatives.
19
John Coones, President of the Employees’ Liquor Control Board since Jan. 2000, was interviewed June 2000. 20
Ralph Kilman, Beyond the Quick Fix. U.S.: Jossey-Bass, 1986. P. 31-58.
McKinsey’s Seven S Framework
Structure:
Strategic Planning is
bottom up and top
downStrategy:
New strategy to focus on
customers and service
created common vision
that was communicated
Shared Values:
Achieved consensus in
valuing customers and
social responsibility
role
Systems:
Increased flow of
information, capital
budgeting, quality
control and
performance standards
Skills:
Knowledge, encourage
innovation, staff
training, IT support,
Staff:
Provided incentives
and rewards, clear
understanding, and
reduced tension
between management
and employees
Style:
Collaborative team
building, balanced
stakeholder interests,
try to build trust and
stress competition
(created a crisis)
The Innovation Journal: The Public Sector Innovation Journal, 7(3), 2002, article 10.
____________________________________________________________________________________________________________________________________________________________________________________________
13
Diagram 5:
Each of the main factors in Diagram 6 describes potential threats to sustaining the LCBO’s
change management process. Given unrelenting pressures for meeting increased and new
consumer demands, and the LCBO’s government mandate to provide and regulate alcohol,
continued change initiatives must become a way of life for the LCBO. Their successful
reinvention must be continually challenged to prevent complacency. An A.T. Kearney study
found that “the largest gap between companies that were good and bad at change (…) arose
because some learned from change and institutionalized their knowledge, building it into their
culture and performance assessment.”21
GTE - a telephone company based in Dallas, Texas -
provides an excellent best practice that the LCBO could utilize to prevent complacency and
institute a continuous learning and improvement program. GTE has a tradition of using quality
improvement teams (QIT) and employee incentives for joining a QIT (i.e. T-shirt for first team,
clock for the 11th
team, etc.). In 1999, over 90% of GTE employees participated in at least one
such team.22
This practice could help solve the LCBO’s lack of cross-functional teams and
improve union constraints, which prevent the use of salary bonuses to reward employees.
VALUE CREATION
The challenging dynamics of building government organizations that are designed to be
responsive, accountable, innovative and performance driven can be better understood through the
concept of value creation. Michael Porter’s value creation model using the Value Chain23
illustrates how all the activities of an organization fit together and how capabilities can be
identified and leveraged through key linkages that improve customer value, identify cost savings
21
“Change Management – An Inside Job” in The Economist. July 15th/2000.
22 Ibid.
23 Michael Porter, “The Value Chain and Competitive Advantage” in Competitive Advantage: Creating &
Sustaining Superior Performance. N.Y.: N.Y. Free Press, 1985.
Five Tracks Barriers to Success Model
The Setting:
The Manager:Culture of being number one could
stifle customer focus imperative or
may lose sense of urgency for
competitiveness
Assumption that government will
continue large capital investments and
that what motivated employees in past
will work in the future
Psyches- workers mistrust of
management if interests not resolved
The Group:
The Results:
The Organization:
•Events and forces that can affect the survival of the organization include: government
privatizes LCBO & competitors develop new strategies to control market share (E.g. industry
consolidation to rival the LCBO), union workers strike and customer loyalty falls, economic
downturn affecting sales and profitability, new technology or legislation allowing Internet sales
from wineries and other competitors, change in party politics could hinder strategic plans.
•Need to reward and
motivate employees in
creative ways may be
difficult with union -
structure limits IT talent
pool and retention, &
these systems are
critical to
communications and
innovation
•Social responsibility
role may limit profits
•Gov’t approval will
continue to slow
organizational change
•Long history of continuity among
management; concern regarding
succession planning
•Management disputes with workers
may increase with recent contract
dispute and lead to more frequent
union clashes
•Must continue to build management
skills to integrate new technology and
systems changes
•There is a more team based approach to strategic planning, implementation and delivery but need
to encourage more cross functional teams. This will improve the quality of information flows and
increase shared values (especially between management and union)
•Vestiges of old bureaucracy still remain (I.e. head office’s physical layout with big doors and
sections is very closed and suits for IT workers) and create less opportunity for informal sharing
The LCBO has achieved some success but complacency is the biggest threat; need to stay motivated.
The Innovation Journal: The Public Sector Innovation Journal, 7(3), 2002, article 10.
____________________________________________________________________________________________________________________________________________________________________________________________
14
and provide long-term success. Thus, Porter’s model is a roadmap to compliment Kilman’s
model, which illustrates the LCBO’s potential future barriers to success.
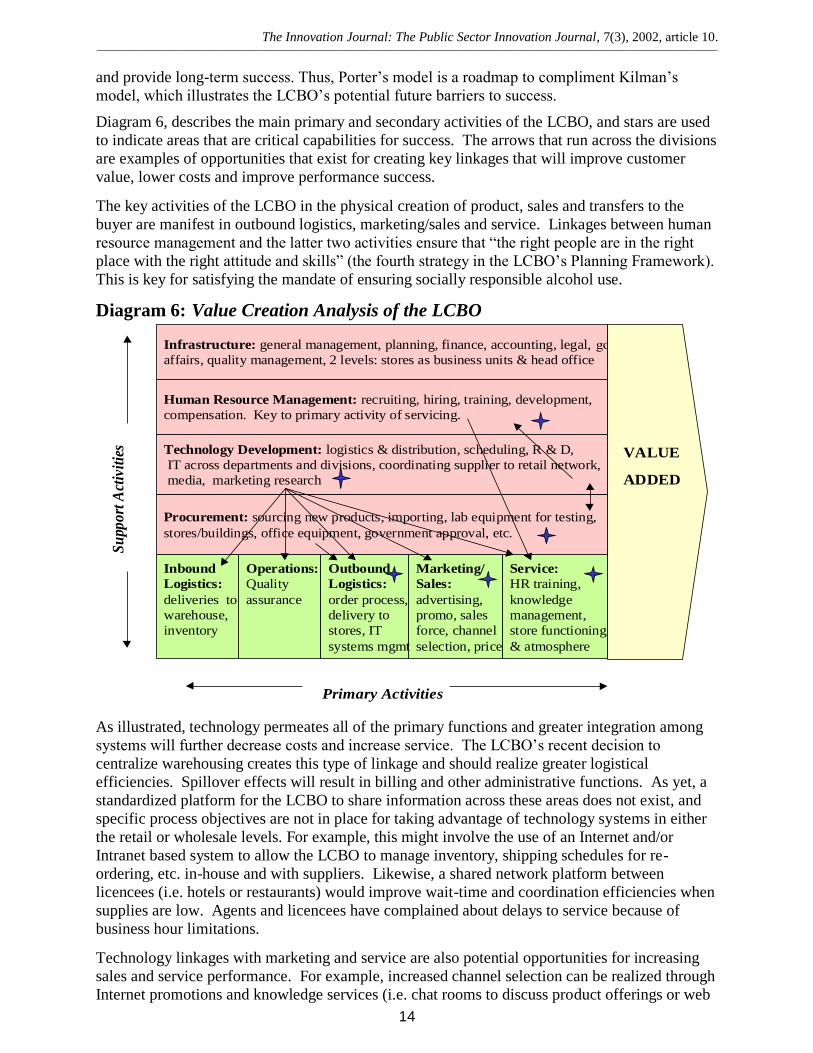
Diagram 6, describes the main primary and secondary activities of the LCBO, and stars are used
to indicate areas that are critical capabilities for success. The arrows that run across the divisions
are examples of opportunities that exist for creating key linkages that will improve customer
value, lower costs and improve performance success.
The key activities of the LCBO in the physical creation of product, sales and transfers to the
buyer are manifest in outbound logistics, marketing/sales and service. Linkages between human
resource management and the latter two activities ensure that “the right people are in the right
place with the right attitude and skills” (the fourth strategy in the LCBO’s Planning Framework).
This is key for satisfying the mandate of ensuring socially responsible alcohol use.
Diagram 6: Value Creation Analysis of the LCBO
As illustrated, technology permeates all of the primary functions and greater integration among
systems will further decrease costs and increase service. The LCBO’s recent decision to
centralize warehousing creates this type of linkage and should realize greater logistical
efficiencies. Spillover effects will result in billing and other administrative functions. As yet, a
standardized platform for the LCBO to share information across these areas does not exist, and
specific process objectives are not in place for taking advantage of technology systems in either
the retail or wholesale levels. For example, this might involve the use of an Internet and/or
Intranet based system to allow the LCBO to manage inventory, shipping schedules for re-
ordering, etc. in-house and with suppliers. Likewise, a shared network platform between
licencees (i.e. hotels or restaurants) would improve wait-time and coordination efficiencies when
supplies are low. Agents and licencees have complained about delays to service because of
business hour limitations.
Technology linkages with marketing and service are also potential opportunities for increasing
sales and service performance. For example, increased channel selection can be realized through
Internet promotions and knowledge services (i.e. chat rooms to discuss product offerings or web
Service:
HR training,
knowledge
management,
store functioning
& atmosphere
Procurement: sourcing new products, importing, lab equipment for testing,
stores/buildings, office equipment, government approval, etc.
Technology Development: logistics & distribution, scheduling, R & D,
IT across departments and divisions, coordinating supplier to retail network,
media, marketing research
Human Resource Management: recruiting, hiring, training, development,
compensation. Key to primary activity of servicing.
Infrastructure: general management, planning, finance, accounting, legal, gov’t
affairs, quality management, 2 levels: stores as business units & head office
Inbound
Logistics:
deliveries to
warehouse,
inventory
Operations:
Quality
assurance
Marketing/
Sales:
advertising,
promo, sales
force, channel
selection, price
Outbound
Logistics:
order process,
delivery to
stores, IT
systems mgmt
VALUE
ADDED
Su
ppo
rt A
ctiv
itie
s
Primary Activities
The Innovation Journal: The Public Sector Innovation Journal, 7(3), 2002, article 10.
____________________________________________________________________________________________________________________________________________________________________________________________
15
base product advice column). With the appropriate safeguards and infrastructure, product sales
and services (i.e. offering wine consulting services) could be added.
Technology is already being linked with other supporting activities in areas such as human
resource management. The LCBO currently uses tracking systems to evaluate store sales,
employee performance, etc. It is interesting to note that many LCBO strategies recognize these
linkages, and have provided capabilities in human resource management, marketing, product
innovations, and R & D. Targeting end users and realizing competencies in marketing and
service will ensure that the LCBO continues to focus on those downstream activities that are
critical in the retailing supply stage.24
Conclusion
As more government organizations are forced to justify their existence and their ability to service
citizens, pressure for government responsiveness can be seen across many service sectors. In
Ontario alone, huge changes to fundamental services have occurred with unprecedented speed.
Massive budget cuts to hospitals, amalgamations of city districts and school boards with huge
cuts to administrative overhead, and the downsizing of many federal government organizations
such as the Canadian Broadcasting Corporation (CBC) illustrate this urgency for change. In a
recent Report to Taxpayers, the Ontario government spent $780,000 in its marketing literature to
justify its welfare reforms to taxpayers.25
The new message communicated by governments is
about how it can maximize services, exercise greater fiscal responsibility and improve customer
value.
Amidst these changes, it is important to remember that “nothing happens in a predictable,
sustained way unless you build mechanisms that cause it to happen in a predictable, sustained
way.”26
As seen in this report, the LCBO is a unique example of how government organizations
can utilize strategic management tools to create more customer-focussed services, despite
inherent complexities within the public sector. The Ontario government established the LCBO as
a monopoly provider of alcoholic beverages and enacted regulatory entry barriers to prevent
competition, however, the threat of privatization has injected elements of competition. Baumol,
Pangar and Willig argue that imperfectly competitive markets can exhibit competitive
characteristics if these markets are deemed to be “contestable”.27
The threat of privatization has
made this market contestable, even in the presence of regulatory barriers.
The challenge for government is to build customer focussed strategies that are well designed,
satisfy customer needs and provide superior levels in product and service performance. While
opportunities for improvement exist, the LCBO’s strategic management design and processes are
an excellent example of the potential for all of government organizations to become more
responsive and more accountable. A modern context for change must therefore emphasize value
creation through strategic management. It is both necessary and possible for public sector
organizations to become dynamic learning organizations like the LCBO – competent to identify
changes in customer needs and capable of meeting these changes through the delivery of
innovative service mechanisms.
24
Jay Galbraith, “Strategy and Organizational Planning” in Human Resource Management. Spring/Summer 1983 Vol. 22 #1/2. P. 65. 25
Canadian Press, “Tory Welfare Brochure to Cost $780,000.” Toronto Star, July 15/00. P. 26
Brian L. Joiner, Fourth Generation Management: The New Business Consciousness. R.R. Donnelly & Sons: U.S., 1994. P. 79. 27
Baumol, Panger and Willig, Contestable Markets and the Theory of Industry Structure. Harcourt Brace Jovanovich: U.S., 1982.
The Innovation Journal: The Public Sector Innovation Journal, 7(3), 2002, article 10.
____________________________________________________________________________________________________________________________________________________________________________________________
16
Bibliography
Books:
Aaker, D. 1998. Strategic Market Management (5th
ed.), U.S. John Wiley & Sons.
Adams Wine Book 1999. New York: Adams Business Media.
1998 Annual Statistical Report. Association of Canadian Distillers.
Baumol, Panger and Willig, 1982. Contestable Markets and the Theory of Industry Structure.
Harcourt Brace Jovanovich.
Bens, C. K. 1998. Public Sector Performance Measurement: Successful Strategies and Tools.
Sarasota: Best Practice Consulting.
Bryson, J. M. 1988. Strategic Planning for Public and Nonprofit Organizations. San
Francisco: Jossey-Bass Publishers.
Charih, M. & A. Daniels (ed). 1997. New Public Management and Public Administration in
Canada. Toronto: The Institute of Public Administration.
Cohen, S. and W. Eimicke. 1995. The New Effective Public Manager: Achieving Success in a
Changing Government. San Francisco: Jossey-Bass Publishers.
Jorner, B. 1994. Fourth Generation Management: The New Business Conscious. U.S.: R.R.
Donelly & Sons.
Fahey, L. and R. Randall. 1994. The Portable MBA in Strategy. U.S.: John Wiley & Sons.
Kernaghan, K. and D. Siegel (4th
ed.), 1999. Public Administration in Canada). Canada: ITP
Nelson Publishing.
Kilman, R. 1986. Beyond the Quick Fix. U.S.: Jossey-Bass Publishers.
Porter, M. 1985. Competitive Advantage: Creating and Sustaining Superior Performance.
N.Y.: New York Free Press.
Scott’s Directories (27th
ed.), 2000. Ontario Manufacturers Directory 2000. Don Mills:
Southam Information Products.
Articles:
Borins, S. 1995. “The New Public Management is Here to Stay.” Canadian Public
Administration. Spring, Vol. 38 No. 1, p. 112-21.
Cohen, S. and N. Cardinal. 1999. “Style and drinks… turning Ontario’s liquor stores into
adult entertainment centres.” Marketing, Sept, p. 30-1.
“Change Management: An Inside Job,” 2000. The Economist, July.
The Innovation Journal: The Public Sector Innovation Journal, 7(3), 2002, article 10.
____________________________________________________________________________________________________________________________________________________________________________________________
17
Fife, S. 1999. “Street Smart” in The Financial Post Magazine, April.
Fishman, C. 1998. “Change,” in Fast Company. Issue 8, August.
Hartung, G. C. 1996. “Institutionalized Excellence: Not Just More Pop Government Jargon?”
Public Management, July, Vol. 78, No 7, p. 25-27.
Israel, C. 1992 “Privatization Dues and Don’ts: What the LCBO Union Fears in the Monopoly
Going Private.” Toronto Life, June, Vol. 26, No. 9, p. E5-7.
“Liquor Control Board of Ontario – Privatization of a National Industry.” 1996. ARF Journal
Jan-Feb, Vol. 25 no. 1, p. 5.
Meckbach, G. 1998. “Drinking from the warehouse: IT managers at the LCBO expect a solid
return on investment…” Computing Canada, Feb, p. 19-20.
Menzies, D. 1998. “Beer Bully.” Canadian Business, Feb, p. 15.
Stuart, P. 1996. “Greater controls proposed for “brew-your-own” shops.” ARF Journal,
Nov/Dec. Vol. 25, No, 6, p.1-2.
Waterman, R., T. Peters, and J. Phillips. 1980. “Structure is not Organization,” in Business
Horizons, June.
Willis, A. 1995. “Liquid assets: will Ontario join Alberta in privatizing liquor sales?”
Macleans, July, p. 30-2.
Newspaper Articles:
Financial Post:
Frum, David. “Cushy Contracts for Liquor Workers are Intolerable”. Dec. 2/94.
Frum, David. “Ontario’s Long Journey Toward the Rational Sale of Alcohol”. Dec. 20/97.
Scotland, Randall. “Liquor stores try new tack: Catering to their customers”. Apr. 30/94
Schreiner, John. “Wineries find investors have a taste for public offerings”. Oct. 7/95
Ward, Joseph. “Time is ripe for Ontario to get out of the wine business”. Sept. 9/95.
Globe & Mail:
Canadian Press. “Liquor Board cuts.” Aug. 19/92. B2.
Canadian Press. “LCBO says inquiry not needed”. Aug. 29/92. B8.
Deogun, Nikhil. “General Mills to acquire Diageo’s Pillsbury Unit”. July 17/00. B5.
Moon, Peter. “LCBO managers cited for lavishness”. July 2/92. A1-2.
Moon, Peter. “LCBO director advised expense details found lacking.” July 2/92. A6.
National Post:
Damsell, Keith. “Ontario vintners say problems are more than just sour grapes”. Oct. 30/98.
The Innovation Journal: The Public Sector Innovation Journal, 7(3), 2002, article 10.
____________________________________________________________________________________________________________________________________________________________________________________________
18
LCBO Publications
LCBO Exchange March/April 2000 Vol. 16, No.228
Food & Drink Early Summer edition 2000.29
Vintages Classics Catalogue Spring/Summer 2000 Edition30
LCBO Annual Business Reports from 1997 to 1999.
“These are the days” Video Promotion. May 1997.
“Bayview Village LCBO” Video Promotion. 1999
“A Conversation with Larry Gee” Video Promotion. April 2000.
Websites:
General:
www.abs.gov.au
www.adelaide.edu.au/CIES
www.australiawine.com
http://deming.eng.clemson.edu/pub/psa/
www.fao.org
www.germanwine.de/english/
www.lcbo.com/about/business_info/licensees/
www.mlcc.mb.ca
www.nzwine.com
www.strategis.ic.gc.ca
www.smartwine.com
www.vinhos.online.pt/
www.wineaustralia.com.
www.wineinstitute.org
www.wineit/
www.winetitles.com.au/gwrdc
www.winetech.com
www.wineToday.com
www.worldwine.com
www.wsa.org.uk
28 This is a bi-monthly newsletter that provides employees with management news and circulates information about recent LCBO changes, courses, awards, training plans, etc.
29
This is a glossy seasonal magazine that features articles about vintners, food recipes, entertaining ideas (i.e. summer barbecue sauces and décor ideas). Advertisements are sponsored by wineries, tourist offices, DeBoer’s furniture stores, MADD, and Fiesta barbecues.
30
This is a publication dedicated to fine wine and premium spirits available for purchase. It educates consumers about fine wine selections from Canada and abroad, and orders can be made by fax or telephone. Orders are shipped directly to the Vintages LCBO of your choice fee of charge.

The Innovation Journal: The Public Sector Innovation Journal, 7(3), 2002, article 10.
____________________________________________________________________________________________________________________________________________________________________________________________
19
Competitor Sites:
Breweries
www.netaccess.on.ca/~bitter
www.sarnia.com/franknbrew/
www.greatlakes.com
www.kingstonbrewing.com
www.labatt.com
www.magnotta.com
www.molson.com
www.crivellerbrew.com
www.northern-breweries.com
Wineries
www.wineroute.com/andres
www.chateaudescharmes.com
www.colio.net
www.henryofpelham.com
www.hernder.com
www.hillebrand.com
www.inniskillin.com
www.kingstonbrewing.com
www.kittlingridge.com
www.lakeviewcellars.on.ca
www.simcom.on.ca/~newine
www.peleeisland.com
www.pillitteri.com
www.execulink.com/~quai/
www.reifwinery.com
www.stonechurch.com
www.diageo.com
Distilleries
www.bacardi.com
www.corbydistilleries.com
www.killtingridge.com
The Innovation Journal: The Public Sector Innovation Journal, 7(3), 2002, article 10.
____________________________________________________________________________________________________________________________________________________________________________________________
20
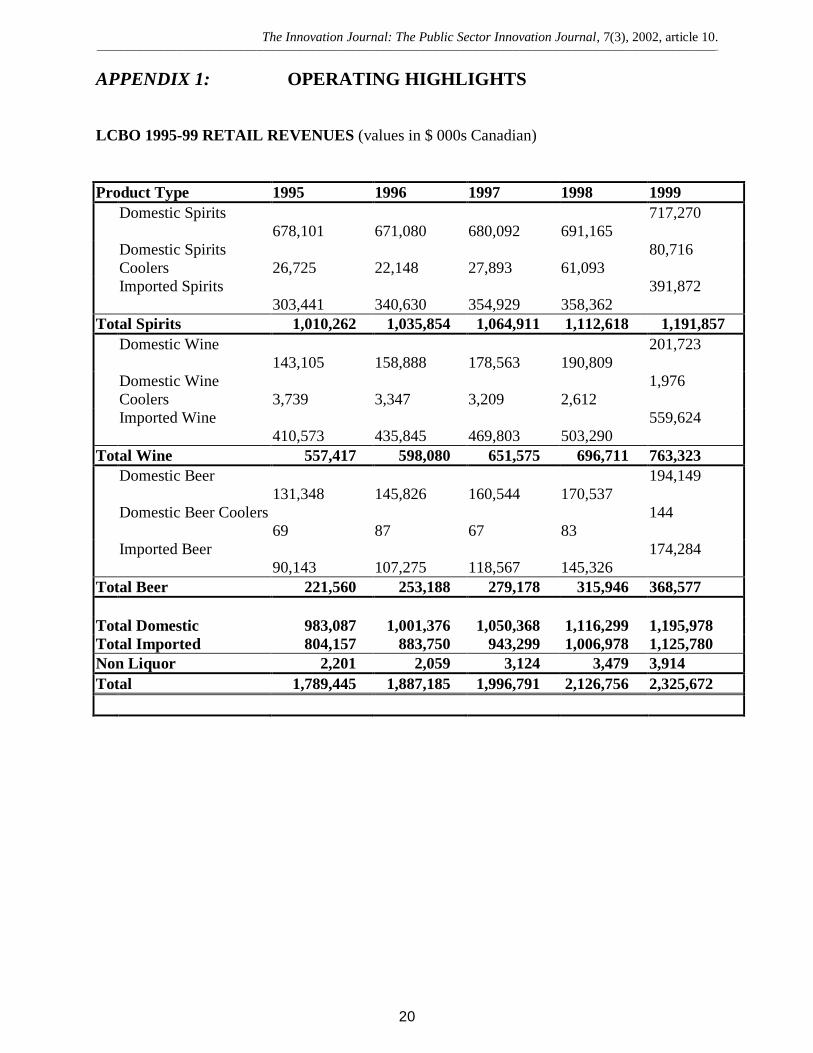
APPENDIX 1: OPERATING HIGHLIGHTS
LCBO 1995-99 RETAIL REVENUES (values in $ 000s Canadian)
Product Type 1995 1996 1997 1998 1999
Domestic Spirits
678,101
671,080
680,092
691,165
717,270
Domestic Spirits
Coolers
26,725
22,148
27,893
61,093
80,716
Imported Spirits
303,441
340,630
354,929
358,362
391,872
Total Spirits 1,010,262 1,035,854 1,064,911 1,112,618 1,191,857
Domestic Wine
143,105
158,888
178,563
190,809
201,723
Domestic Wine
Coolers
3,739
3,347
3,209
2,612
1,976
Imported Wine
410,573
435,845
469,803
503,290
559,624
Total Wine 557,417 598,080 651,575 696,711 763,323
Domestic Beer
131,348
145,826
160,544
170,537
194,149
Domestic Beer Coolers
69
87
67
83
144
Imported Beer
90,143
107,275
118,567
145,326
174,284
Total Beer 221,560 253,188 279,178 315,946 368,577
Total Domestic 983,087 1,001,376 1,050,368 1,116,299 1,195,978
Total Imported 804,157 883,750 943,299 1,006,978 1,125,780
Non Liquor 2,201 2,059 3,124 3,479 3,914
Total 1,789,445 1,887,185 1,996,791 2,126,756 2,325,672
The Innovation Journal: The Public Sector Innovation Journal, 7(3), 2002, article 10.
____________________________________________________________________________________________________________________________________________________________________________________________
21
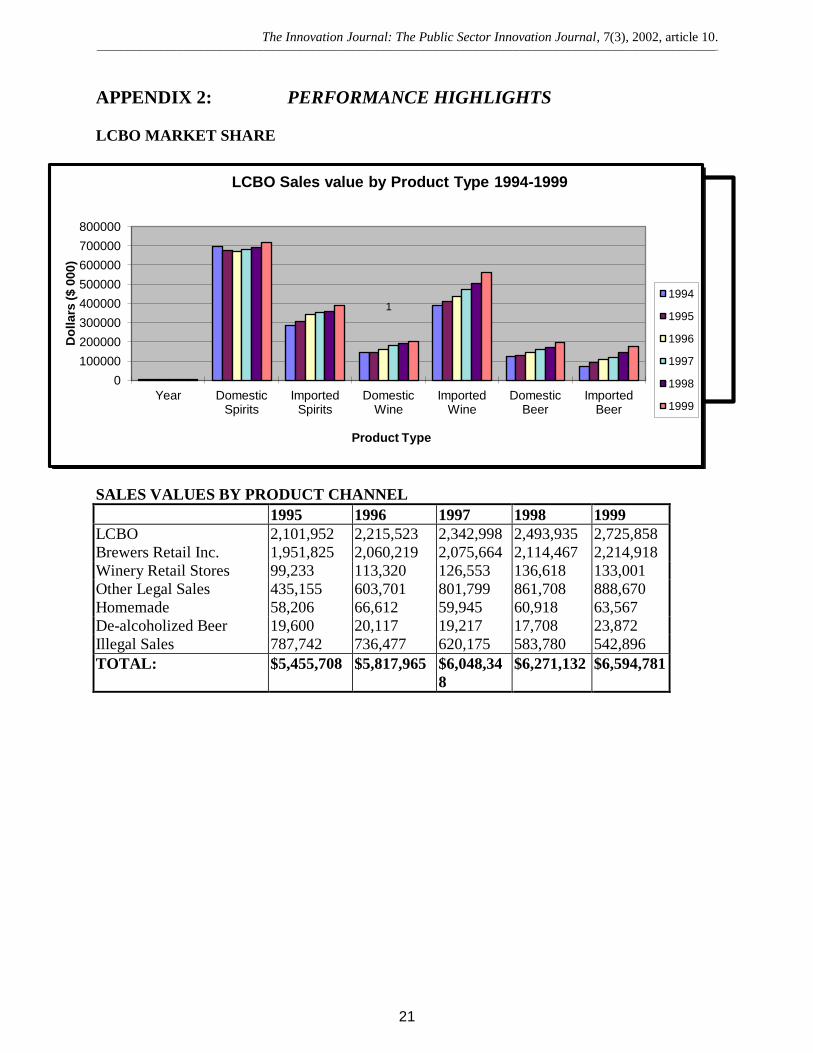
APPENDIX 2: PERFORMANCE HIGHLIGHTS
LCBO MARKET SHARE
SALES VALUES BY PRODUCT CHANNEL
1995 1996 1997 1998 1999
LCBO 2,101,952 2,215,523 2,342,998 2,493,935 2,725,858
Brewers Retail Inc. 1,951,825 2,060,219 2,075,664 2,114,467 2,214,918
Winery Retail Stores 99,233 113,320 126,553 136,618 133,001
Other Legal Sales 435,155 603,701 801,799 861,708 888,670
Homemade 58,206 66,612 59,945 60,918 63,567
De-alcoholized Beer 19,600 20,117 19,217 17,708 23,872
Illegal Sales 787,742 736,477 620,175 583,780 542,896
TOTAL: $5,455,708 $5,817,965 $6,048,34
8
$6,271,132 $6,594,781
Spirits 48%
Wine 33%
Beer 16%
Coolers 3%
1999 Share of Dollar Sales
Spirits 18%
Wine 30%
Beer 45%
Cooler 7%
Share of Volume Sale
0
100000
200000
300000
400000
500000
600000
700000
800000
Year Domestic Spirits
Imported Spirits
Domestic Wine
Imported Wine
Domestic Beer
Imported Beer
Do
llars
($
000
)
Product Type
LCBO Sales value by Product Type 1994-1999
1994
1995
1996
1997
1998
1999
1
The Innovation Journal: The Public Sector Innovation Journal, 7(3), 2002, article 10.
____________________________________________________________________________________________________________________________________________________________________________________________
22
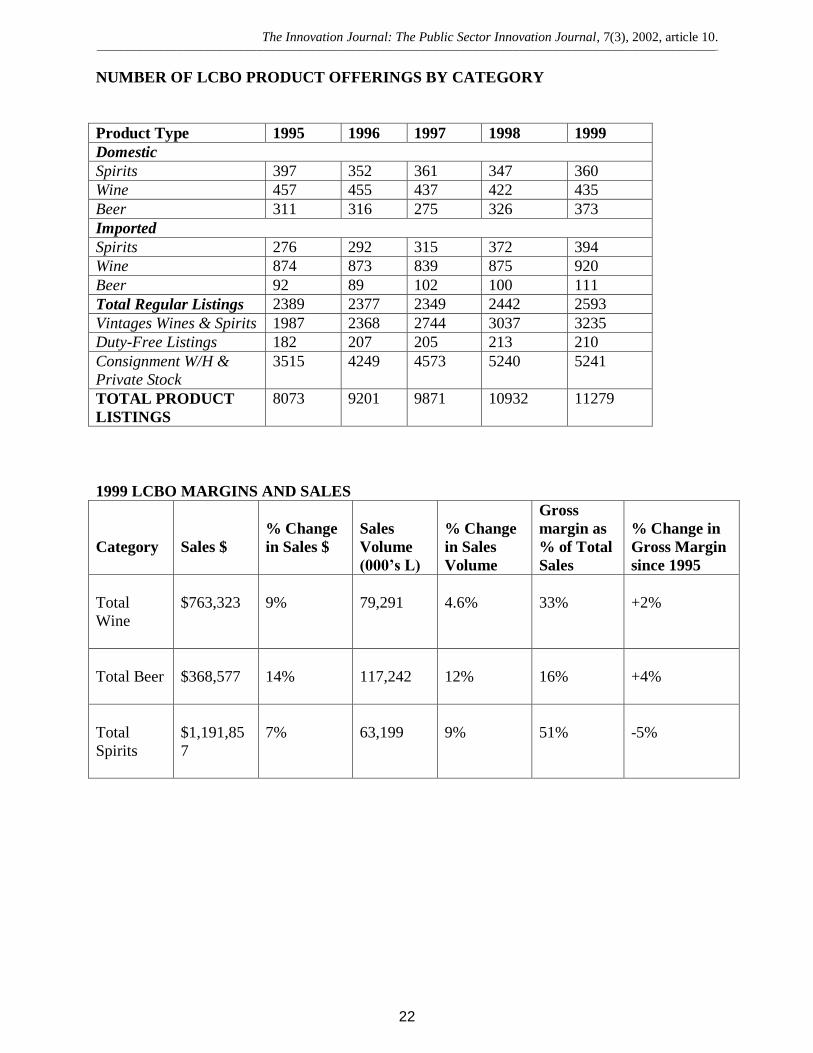
NUMBER OF LCBO PRODUCT OFFERINGS BY CATEGORY
Product Type 1995 1996 1997 1998 1999
Domestic
Spirits 397 352 361 347 360
Wine 457 455 437 422 435
Beer 311 316 275 326 373
Imported
Spirits 276 292 315 372 394
Wine 874 873 839 875 920
Beer 92 89 102 100 111
Total Regular Listings 2389 2377 2349 2442 2593
Vintages Wines & Spirits 1987 2368 2744 3037 3235
Duty-Free Listings 182 207 205 213 210
Consignment W/H &
Private Stock
3515 4249 4573 5240 5241
TOTAL PRODUCT
LISTINGS
8073 9201 9871 10932 11279
1999 LCBO MARGINS AND SALES
Category
Sales $
% Change
in Sales $
Sales
Volume
(000’s L)
% Change
in Sales
Volume
Gross
margin as
% of Total
Sales
% Change in
Gross Margin
since 1995
Total
Wine
$763,323
9%
79,291
4.6%
33%
+2%
Total Beer
$368,577
14%
117,242
12%
16%
+4%
Total
Spirits
$1,191,85
7
7%
63,199
9%
51%
-5%
The Innovation Journal: The Public Sector Innovation Journal, 7(3), 2002, article 10.
____________________________________________________________________________________________________________________________________________________________________________________________
23
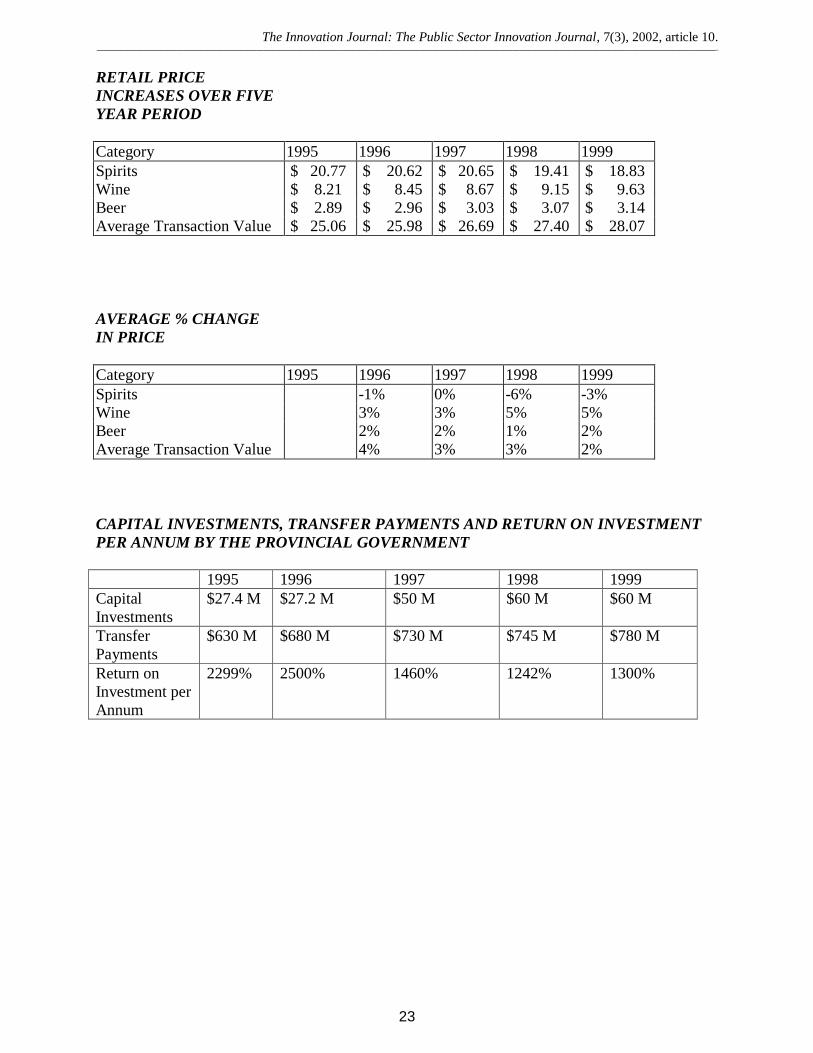
RETAIL PRICE
INCREASES OVER FIVE
YEAR PERIOD
Category 1995 1996 1997 1998 1999
Spirits $ 20.77 $ 20.62 $ 20.65 $ 19.41 $ 18.83
Wine $ 8.21 $ 8.45 $ 8.67 $ 9.15 $ 9.63
Beer $ 2.89 $ 2.96 $ 3.03 $ 3.07 $ 3.14
Average Transaction Value $ 25.06 $ 25.98 $ 26.69 $ 27.40 $ 28.07
AVERAGE % CHANGE
IN PRICE
Category 1995 1996 1997 1998 1999
Spirits -1% 0% -6% -3%
Wine 3% 3% 5% 5%
Beer 2% 2% 1% 2%
Average Transaction Value 4% 3% 3% 2%
CAPITAL INVESTMENTS, TRANSFER PAYMENTS AND RETURN ON INVESTMENT
PER ANNUM BY THE PROVINCIAL GOVERNMENT
1995 1996 1997 1998 1999
Capital
Investments
$27.4 M $27.2 M $50 M $60 M $60 M
Transfer
Payments
$630 M $680 M $730 M $745 M $780 M
Return on
Investment per
Annum
2299% 2500% 1460% 1242% 1300%