management’s discussion and analysis fiera …€™s discussion and analysis fiera capital...
TRANSCRIPT

Management’s Discussion and Analysis FIERA CAPITAL CORPORATION For the Three and Nine-month Periods Ended September 30, 2015

Table of Contents
Basis of Presentation .................................................................................................................................................. 1
Forward-Looking Statements ................................................................................................................................... 2
Company Overview ................................................................................................................................................... 3
Significant Events ...................................................................................................................................................... 4
Market Overview ....................................................................................................................................................... 4
Summary of Portfolio Performance ........................................................................................................................ 6
Trend Highlights ........................................................................................................................................................ 8
Highlights for the Three-month period Ended September 30, 2015 ................................................................ 10
Summary of Quarterly Results .............................................................................................................................. 13
Results from Operations and Overall Performance ............................................................................................ 16
Summary of Quarterly Results .............................................................................................................................. 30
Liquidity and Capital Resources ............................................................................................................................. 34
Control and Procedures .......................................................................................................................................... 42
Financial Instruments .............................................................................................................................................. 42
Capital Management ............................................................................................................................................... 42
Significant Accounting Judgments and Estimation Uncertainties ..................................................................... 43
New Accounting Policies ........................................................................................................................................ 43
Non-IFRS Measures ................................................................................................................................................. 45
Risks of the Business ............................................................................................................................................... 45

This page was intentionally left blank.
Management’s Discussion and Analysis For the Three and Nine-month Periods Ended September 30, 2015
1| Fiera Capital Corporation
The following management’s discussion and analysis (“MD&A”) dated November 10, 2015 presents an analysis of the financial condition and results of the consolidated operations of Fiera Capital Corporation (“the Company” or “Fiera Capital” or “we” or “Firm”) for the three and nine-month periods ended September 30, 2015. The following MD&A should be read in conjunction with the unaudited interim condensed consolidated financial statements including the notes thereto, as at and for the nine-month period ended September 30, 2015. The unaudited interim condensed consolidated financial statements include the accounts of Fiera Capital Corporation and its wholly owned subsidiaries: Fiera Capital Funds Inc. (“FCFI”) (previously Fiera Sceptre Funds Inc.) which is registered with various provincial securities commissions as a mutual fund dealer and maintains its membership with the Mutual Fund Dealer Association (MFDA), Fiera US Holding Inc. (which owns Bel Air Investment Advisors LLC, Bel Air Management LLC, Bel Air Securities LLC, and Wilkinson O’Grady & Co. Inc.), Fiera Quantum GP Inc. and 9276-5072 Québec Inc. (which collectively owns a controlling 55% interest in Fiera Quantum Limited Partnership (“Fiera Quantum L.P.”) which owns FQ ABCP GP Inc. and FQ GenPar LLC), and 8645230 Canada Inc. (which owns Gestion Fiera Capital S.a.r.l.). All intercompany transactions and balances have been eliminated on consolidation. Axium Infrastructure Inc. (“Axium”) (previously Fiera Axium Inc.) is an entity specialized in infrastructure investments, and Fiera Properties Limited (“Fiera Properties”) is an entity specialized in real estate investments, over which the Company has joint control. The financial results of the Company’s joint venture investments are included in the Company’s results using the equity method of accounting. Unless otherwise stated, figures are presented in Canadian dollars. Certain totals, subtotals and percentages may not reconcile due to rounding. Certain comparative figures have been reclassified to conform with the current period’s presentation. BBBBASIS ASIS ASIS ASIS OOOOFFFF PPPPRESENTATION RESENTATION RESENTATION RESENTATION The Company prepares its interim condensed consolidated financial statements in accordance with International Accounting Standard (“IAS”) 34, Interim Financial Reporting, as issued by the International Accounting Standard Board (“IASB”) and accordingly, do not include all disclosures required under International Financial Reporting Standards (“IFRS”) for annual consolidated financial statements. The accounting policies and methods of computation applied in these interim condensed consolidated financial statements are the same as those applied by the Company in its financial statements as at and for the year ended December 31, 2014, except for the impact of the adoption of the standards, interpretations and amendment described in Note 3. These interim condensed consolidated financial statements should be read in conjunction with the audited consolidated financial statements for the year ended December 31, 2014. The following MD&A should be read in conjunction with the Company’s 2014 annual audited consolidated financial statements, which contain a description of the accounting policies used in the preparation of these financial statements. The Company presents adjusted earnings before interest, taxes, depreciation and amortization (“Adjusted EBITDA”), adjusted net earnings and cash earnings as key non-IFRS performance measures. These non-IFRS measures are defined on page 45.
Management’s Discussion and Analysis For the Three and Nine-month Periods Ended September 30, 2015
2| Fiera Capital Corporation
FFFFORWARDORWARDORWARDORWARD----LLLLOOKING OOKING OOKING OOKING SSSSTATEMENTS TATEMENTS TATEMENTS TATEMENTS Forward-looking statements, by their very nature, involve numerous assumptions, inherent risks and uncertainties, both general and specific, and the risk that predictions and other forward-looking statements will prove to be inaccurate. As a result, the Company does not guarantee that any forward-looking statement will materialize and readers are cautioned not to place undue reliance on these forward-looking statements. A number of important factors, many of which are beyond Fiera Capital’s control, could cause actual events or results to differ materially from the estimates and intentions expressed in such forward-looking statements. These factors include, but are not limited to: Fiera Capital’s ability to retain its existing clients and to attract new clients, Fiera Capital’s investment performance, Fiera Capital’s reliance on major customers, Fiera Capital’s ability to attract and retain key employees, Fiera Capital’s ability to successfully integrate the businesses it acquires, industry competition, Fiera Capital’s ability to manage conflicts of interest, adverse economic conditions in Canada or globally, including among other things, declines in financial markets, fluctuations in interest rates and currency values, regulatory sanctions or reputational harm due to employee errors or misconduct, regulatory and litigation risks, Fiera Capital’s ability to manage risks, the failure of third parties to comply with their obligations to Fiera Capital and its affiliates, the impact of acts of God or other force majeure events; legislative and regulatory developments in Canada and elsewhere, including changes in tax laws, the impact and consequences of Fiera Capital’s indebtedness, potential share ownership dilution and other factors described under “Risk Factors” in this MD&A or discussed in other documents filed by the Company with applicable securities regulatory authorities from time to time. These forward-looking statements are made as at the date of this MD&A and the Company assumes no obligation to update or revise them to reflect new events or circumstances, except as may be required pursuant to securities laws.

Management’s Discussion and Analysis For the Three and Nine-month Periods Ended September 30, 2015
3| Fiera Capital Corporation
CCCCOMPANY OMPANY OMPANY OMPANY OOOOVERVIEWVERVIEWVERVIEWVERVIEW
Fiera Capital Corporation (“Fiera Capital” or the “Company”) was incorporated as Fry Investment Management Limited in 1955 and is incorporated under the laws of the Province of Ontario. The Company is a North American asset management firm which offers a wide range of traditional and alternative investment solutions, including depth and expertise in asset allocation. The company provides investment advisory and related services to institutional investors, private wealth clients and retail investors. In the U.S., investment advisory services are provided by the Company’s U.S. affiliates, which are investment advisors registered with the U.S. Securities and Exchange Commission. Its head office is located at 1501 Avenue McGill College, office 800, Montreal, Quebec, Canada. The Company is listed on the Toronto Stock Exchange (“TSX”) under the symbol “FSZ”.

Management’s Discussion and Analysis For the Three and Nine-month Periods Ended September 30, 2015
4| Fiera Capital Corporation
SSSSIGNIFICANT IGNIFICANT IGNIFICANT IGNIFICANT EEEEVENTS VENTS VENTS VENTS
Acquisition in the US
On October 30, 2015, the Firm announced that it had completed its previously announced acquisition of New York based Samson Capital Advisors LLC, a prominent U.S. fixed income investment management firm. With this acquisition, total AUM amounts to $98.4 billion on a pro forma basis as at September 30, 2015.
The combination of Samson, Wilkinson O’Grady and the US institutional business operations form the backbone of the Firm’s asset management platform in the US. This wholly-owned subsidiary will serve as the foundation for the Firm’s proprietary strategies in both the institutional and private wealth sectors.
New Mandates and Sub-Advisory Partnerships
On November 9, 2015, Fiera Capital and Nissay Asset Management, the investment arm of global insurance company Nippon Life, announced a sub-advisory partnership, thereby expanding Fiera Capital’s distribution capabilities into the Japanese pension market, and more broadly, in the Asia Pacific region. The partnership commenced with the launch of a long-only global equity ex-Japan strategy offshore vehicle.
The Firm was awarded a new sub-advisory mandate with a prominent European asset manager expected to fund beginning of 2016. This will serve as a springboard for future growth in Europe. The Firm also won a new US$770 million global equity mandate with one of the world’s largest financial services companies, which will be reflected in fourth quarter 2015 results. Finally, with the addition of two new favourable ratings from leading global consultants, the Firm’s total number of consultant approvals now stands at eight. Normal Course Issuer Bid On October 15, 2015, Fiera Capital announced that it received TSX approval to commence a normal course issuer bid (NCIB) for a 12-month period. Under the terms of the NCIB, the Firm may purchase up to a maximum of 3,509,288 Class A subordinate voting shares, representing approximately 10% of the public float of Class A subordinate shares as at September 30, 2015. The board of directors of Fiera Capital believes that the repurchase of Class A Shares is a sound use of Fiera Capital's funds and the NCIB will provide the Firm with the flexibility to purchase Class A Shares from time to time as it considers advisable. Purchases may commence as of October 19, 2015 and will terminate no later than October 18, 2016.

Management’s Discussion and Analysis For the Three and Nine-month Periods Ended September 30, 2015
5| Fiera Capital Corporation
Executive Appointments
On September 14, 2015, Fiera Capital announced several executive appointments.
John Valentini joined the Fiera Capital global team as Executive Vice-President and Chief Financial Officer. In this role, he leads the global finance, operations and information technology, legal and compliance, and enterprise risk management functions.
Sylvain Roy was appointed President and Chief Operating Officer of the Firm’s Canadian division. Most recently chief investment officer, Mr. Roy is responsible in this new role for the Canadian operating division and related activities, including the Canadian chief investment officer function.
Fiera Capital also confirmed the appointment of David Stréliski to the newly created positon of Senior Vice-President and Chief Risk Officer, responsible for company-wide risk management.

Management’s Discussion and Analysis For the Three and Nine-month Periods Ended September 30, 2015
6| Fiera Capital Corporation
MMMMARKET ARKET ARKET ARKET OOOOVERVIEWVERVIEWVERVIEWVERVIEW
In what was an extremely volatile quarter in fixed income markets, bond yields swung wildly, struggling to find direction amid uncertainty pertaining to the direction of interest rate policy in the US and emerging market growth uncertainties, which came up against an improving economic backdrop in North America. In the end, bond yields declined and bond prices rose during the third quarter. The collapse in bond yields came on the back of the disinflationary impulse stemming from the retreat in oil prices and growth concerns in China, which ignited heightened levels of investor angst and sent investors flocking to the safety of fixed income.
Global equity markets experienced a precipitous decline during the third quarter, producing the worst quarterly performance since Q3-2011. Just as market turbulence related to the debt crisis in Europe was put to rest, risk aversion resurfaced amid China-related growth uncertainties and speculation around the potential for higher interest rates in the US, sparking some financial market volatility during the third quarter. Unsurprisingly, emerging market equities experienced the brunt of the collapse, followed by international (Europe and Japan) equity markets. North American equity markets were also caught in the crossfire, with US equities taking a much-needed breather after a strong run-up, while Canadian equity markets came under pressure on the back of the retreat in oil prices and renewed concerns regarding the emerging markets growth trajectory.
Currency market performance was mixed during the third quarter. While US dollar strength prevailed against commodity-oriented currencies (such as the Canadian dollar and other emerging market currencies), the greenback weakened slightly versus both the euro and the yen on the back of expectations for a cautious Federal Reserve and the potential for a delay to fed funds liftoff. Meanwhile, commodity markets receded across the board during the third quarter. Declines were led by oil prices, which continued to come up against uncertainty regarding market imbalances between (over) supply and deteriorating global demand, while copper prices collapsed on the back of renewed concerns over the deterioration in the growth backdrop in China. Finally, gold prices also fell in the third quarter, but declines were more moderate as investors sought out a safe haven in a highly volatile environment and as it became increasingly likely that interest rates would stay lower for longer in the US.
We have witnessed a resurgence in the US economy, however, one that hasn’t been immune to the international headwinds at bay, as reflected in the divergence between the fortunes in the domestically-driven and externally-focussed sectors of the economy. Specifically, the consumer-based economy remains robust, with a stellar employment backdrop, low interest rates, and cheap gasoline prices fuelling consumer confidence and spending. Conversely, we’ve witnessed a moderation in the manufacturing sector, which has been weighed down by a strengthening US dollar and some growth uncertainties stemming from abroad. However, we believe that economic tailwinds emanating from the solid consumer backdrop should trump any China-related headwinds, with consumption making up a healthy 70% of the US economy.
In Canada, after declining modestly for two consecutive quarters, growth appears to have resumed in the third quarter, making way for a solid recovery in the second half. Despite the retrenching resource sector, the remainder of the economy remains firmly in expansion-mode. The trade deficit has narrowed substantially, largely as a result of an advance in non-energy exports, while factory (auto) sales kicked off the third quarter on a stronger note, adding credence to our view that the resurgence in US activity and the weaker canadian dollar are finally translating into increased demand for Canadian-made goods. Meanwhile, the consumer should also remain a reliable source of growth for the Canadian economy going forward, supported by stronger than expected gains in employment, a resilient housing market, and the ongoing environment of low interest rates.

Management’s Discussion and Analysis For the Three and Nine-month Periods Ended September 30, 2015
7| Fiera Capital Corporation
Meanwhile, the economic backdrop for international economies remains mixed, with the Euro area on the path to recovery while economic activity in Japan remains volatile. The good news is that policymakers remain committed to backstopping their respective economies, maintaining their pledges to prop up growth.
Finally, in China, fears of a hard landing resurfaced in August, following some deterioration in the economic backdrop and the decision by the Chinese authorities to devalue the yuan. Policymakers continue the difficult task of transitioning the economy away from debt-fuelled investment towards a more sustainable consumption-based economy, which has fuelled a deterioration in growth prospects. Encouragingly, inflationary pressures remain muted, allowing policymakers the flexibility to unleash the monetary and fiscal tools at their disposal in order to avoid a hard landing in China.

Management’s Discussion and Analysis For the Three and Nine-month Periods Ended September 30, 2015
8| Fiera Capital Corporation
SSSSUMMARY OF UMMARY OF UMMARY OF UMMARY OF PPPPORTFOLIO ORTFOLIO ORTFOLIO ORTFOLIO PPPPERFORMANCEERFORMANCEERFORMANCEERFORMANCE Annualized Rates of Return
5 yrs or Since Inception (SI)*
(SI if inception < 5 yrs)
Strategy
return
Added
valueQuartile
Strategy
return
Added
value Quartile
Fixed Income Investment Strategies 51.6
Active Fixed Income Universe 4.60 -0.69 4 4.67 0.22 2 01/01/1997 FTSE TMX Universe
Tactical Fixed Income Universe 5.06 -0.22 3 4.91 0.46 1 01/01/2000 FTSE TMX Universe
Integrated Fixed Income Universe 5.32 0.03 2 4.76 0.31 2 01/01/1993 FTSE TMX Universe
Active Fixed Income Long-Term 6.56 -0.93 4 6.87 0.18 2 01/07/1998 FTSE TMX Long Term
High Yield Bonds -3.74 -0.49 4 6.36 -0.05 2 01/02/2002 High Yield Blended 1
Preferred Shares Relative Value -16.35 3.29 N/A 0.61 1.82 N/A 01/02/2004 S&P/TSX Preferred Share
Infrastructure Bonds 8.11 0.48 N/A 8.2* 1.61* N/A 01/08/2011 FTSE TMX Provincials Long Term
Balanced Investment Strategies 3.7
Balanced Core 6.14 2.92 1 9.27 1.96 1 01/09/1984 Balanced Core Blended 2
Balanced Integrated 6.00 3.76 2 10.1* 2.45* 1 01/04/2013 Balanced Integrated Blended 3
Balanced Fund 4.46 1.50 3 8.72 1.61 2 01/03/1973 Balanced Blended Benchmark 4
Equity Investment Strategies 28.6
Canadian Equity Value -8.28 0.11 2 5.36 0.89 3 01/01/2002 S&P/TSX Composite
Canadian Equity Growth -0.68 7.70 1 5.94 1.48 3 01/01/2007 S&P/TSX Composite Capped
Canadian Equity Core -4.00 4.38 3 6.37 1.91 3 01/01/1992 S&P/TSX Composite
High Income Equity -14.06 2.72 4 7.38 2.35 3 01/10/2009 S&P/TSX Composite High Dividend
Canadian Equity Small Cap Core -8.76 12.99 2 10.12 12.86 2 01/01/1989 S&P/TSX Small Cap
Canadian Equity Small Cap -10.50 11.25 2 8.03 10.77 2 01/01/1989 S&P/TSX Small Cap
US Equity 26.97 7.74 1 22.88 3.31 1 01/04/2009 S&P 500 CAD
International Equity 14.16 4.58 2 13.54 3.85 1 01/01/2010 MSCI EAFE Net CAD
Global Equity 20.62 6.76 1 18.89 4.65 1 01/10/2009 MSCI World Net CAD
Alternative Investment Strategies 4.9
North American Market Neutral Fund 13.95 13.18 N/A 4.44 3.50 N/A 01/10/2007 FTSE TMX T-Bill 91 day
Long / Short Equity Fund 27.18 26.41 N/A 16.65 15.71 N/A 01/08/2010 FTSE TMX T-Bill 91 day
Absolute Bond Yield Fund -2.27 -3.04 N/A -0.27* -1.21* N/A 01/12/2010 FTSE TMX T-Bill 91 day
Diversified Lending Fund 5.83 5.05 N/A 7.29 6.35 N/A 01/04/2008 FTSE TMX T-Bill 91 day
Multi-Strategy Income Fund -1.11 -4.15 N/A 3.94 1.28 N/A 01/11/2009 FTSE TMX Short Term
Infrastructure Fund 7.82 N/A N/A 5.79 N/A N/A 01/03/2010 No Benchmark
Real Estate Fund 4.55 N/A N/A 4.42* N/A N/A 01/07/2013 No Benchmark
Total 88.8
Notes:
1. The High Yield Blended Index is composed of 85% Merrill Lynch US High Yield Cash Pay BB-B Hedged in CAD, 15% Merrill Lynch US High Yield Cash Pay C Hedged in CAD.
2. Balanced Core Blended Benchmark is composed of 5% FTSE TMX T-Bill 91 Day / 35% FTSE TMX Universe / 32.5% S&P TSX Composite / 27.5% MSCI World Ex-Canada Net.
3. Balanced Integrated Blended Benchmark is composed of 2% FTSE TMX T-Bill 91 Day / 36% FTSE TMX Universe / 35% S&P/TSX Composite / 27% MSCI ACWI Net.
4. Balanced Blended Benchmark is composed of 5% FTSE TMX T-Bill 91 Day / 35% FTSE TMX Universe / 32.5% S&P TSX Composite / 27.5% MSCI World NET CAD.
5. All returns, including those of the High Yield Bonds, US Equities, International Equities, and Global Equities, are expressed in Canadian dollars.
6. All performance returns presented above are annualized.
7. All returns, except alternative strategies and Balanced Fund are presented gross of management and custodial fees and without taxes but net of all trading expenses.
8. Alternative Investment Strategies and Balanced Fund are presented net of management fees, custodial fees, performance fees and withholding taxes.
9. The performance returns above assume reinvestment of all dividends.
10. Besides for the alternative strategies, the returns presented for any one line above represent the returns of a composite of discretionary portfolios.
11. Each strategy listed above represents a single discretionary portfolio or group of discretionary portfolios that collectively represent a unique investment strategy or composite.
12. The since inception date represents the earliest date at which a discretionary portfolio was in operation within the strategy.
13. The above composites and pooled funds were selected from the Firm's major investment strategies while the AUM represent the total amounts managed by asset class.
14. Quartile rank ings are provided by eVestment.
Strategies Inception date Benchmark name Notes
1 yrAUM
($Billion)
Management’s Discussion and Analysis For the Three and Nine-month Periods Ended September 30, 2015
9| Fiera Capital Corporation
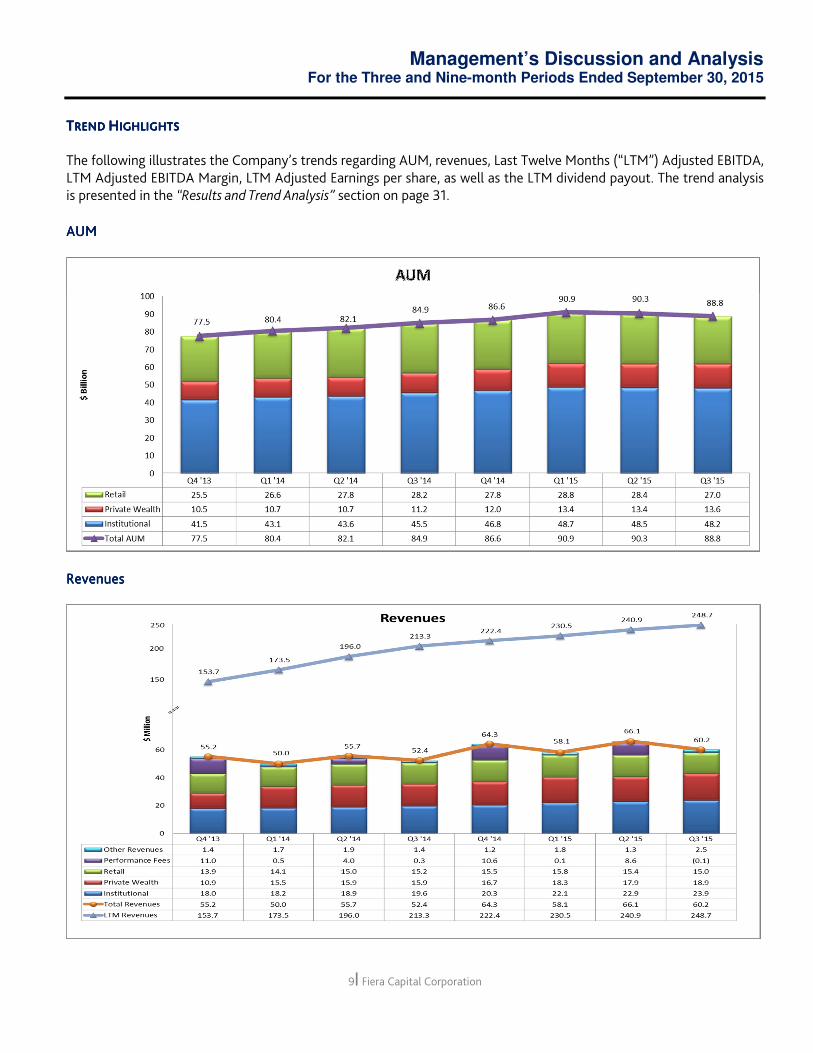
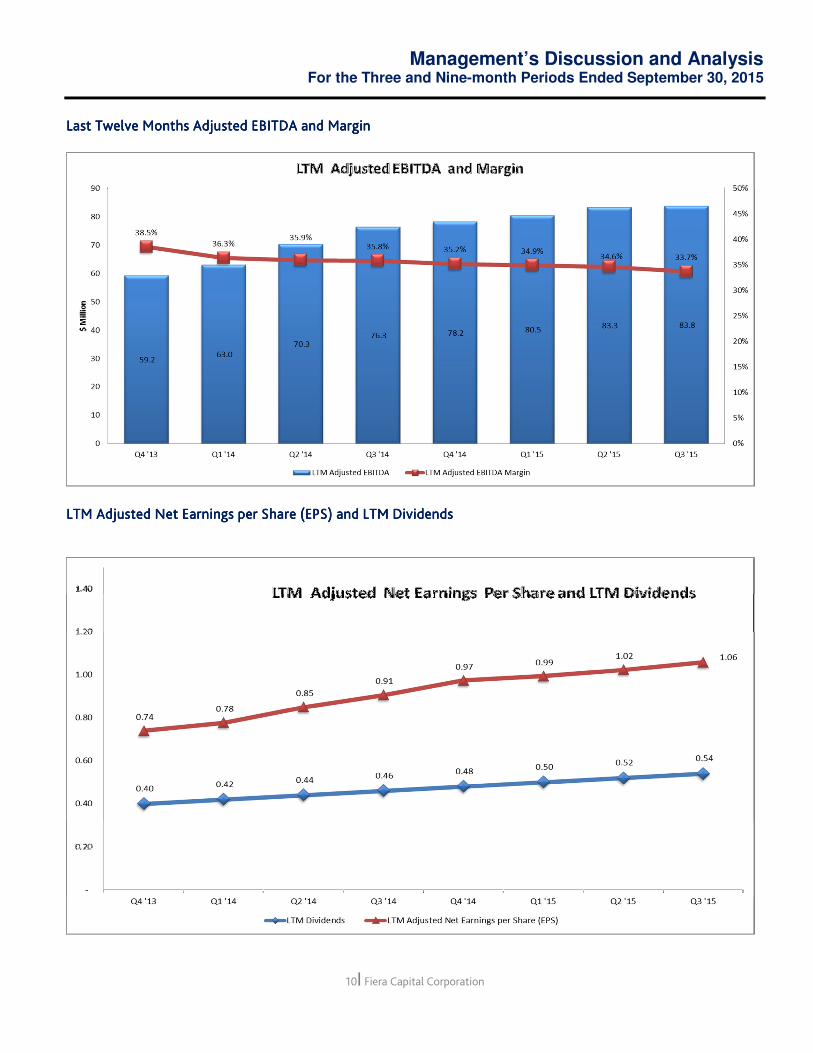
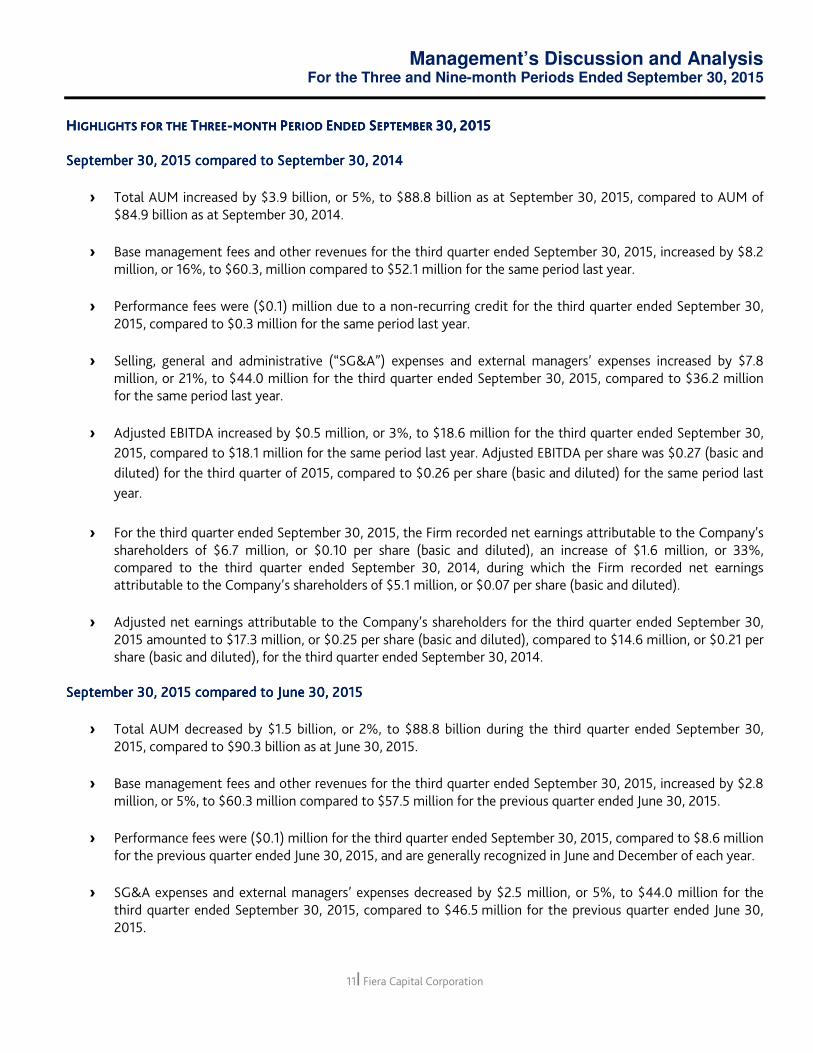
TTTTREND REND REND REND HHHHIGHLIGHTS IGHLIGHTS IGHLIGHTS IGHLIGHTS The following illustrates the Company’s trends regarding AUM, revenues, Last Twelve Months (“LTM”) Adjusted EBITDA, LTM Adjusted EBITDA Margin, LTM Adjusted Earnings per share, as well as the LTM dividend payout. The trend analysis is presented in the “Results and Trend Analysis” section on page 31. AUMAUMAUMAUM
RevenueRevenueRevenueRevenuessss
Management’s Discussion and Analysis For the Three and Nine-month Periods Ended September 30, 2015
10| Fiera Capital Corporation
Last Twelve Months Adjusted EBITDALast Twelve Months Adjusted EBITDALast Twelve Months Adjusted EBITDALast Twelve Months Adjusted EBITDA and Marginand Marginand Marginand Margin
LTM LTM LTM LTM AdjustedAdjustedAdjustedAdjusted NetNetNetNet Earnings per Earnings per Earnings per Earnings per Share (EPS)Share (EPS)Share (EPS)Share (EPS) and LTM and LTM and LTM and LTM DividendDividendDividendDividendssss
Management’s Discussion and Analysis For the Three and Nine-month Periods Ended September 30, 2015
11| Fiera Capital Corporation
HHHHIGHLIGHTS FOR THE IGHLIGHTS FOR THE IGHLIGHTS FOR THE IGHLIGHTS FOR THE TTTTHREEHREEHREEHREE----MONTHMONTHMONTHMONTH PPPPERIODERIODERIODERIOD EEEENDED NDED NDED NDED SSSSEPTEMBER EPTEMBER EPTEMBER EPTEMBER 30,30,30,30, 2015201520152015 September 30, 2015September 30, 2015September 30, 2015September 30, 2015 compared tocompared tocompared tocompared to September 30, 2014September 30, 2014September 30, 2014September 30, 2014
› Total AUM increased by $3.9 billion, or 5%, to $88.8 billion as at September 30, 2015, compared to AUM of $84.9 billion as at September 30, 2014.
› Base management fees and other revenues for the third quarter ended September 30, 2015, increased by $8.2 million, or 16%, to $60.3, million compared to $52.1 million for the same period last year.
› Performance fees were ($0.1) million due to a non-recurring credit for the third quarter ended September 30, 2015, compared to $0.3 million for the same period last year.
› Selling, general and administrative (“SG&A”) expenses and external managers’ expenses increased by $7.8 million, or 21%, to $44.0 million for the third quarter ended September 30, 2015, compared to $36.2 million for the same period last year.
› Adjusted EBITDA increased by $0.5 million, or 3%, to $18.6 million for the third quarter ended September 30,
2015, compared to $18.1 million for the same period last year. Adjusted EBITDA per share was $0.27 (basic and
diluted) for the third quarter of 2015, compared to $0.26 per share (basic and diluted) for the same period last
year.
› For the third quarter ended September 30, 2015, the Firm recorded net earnings attributable to the Company’s shareholders of $6.7 million, or $0.10 per share (basic and diluted), an increase of $1.6 million, or 33%, compared to the third quarter ended September 30, 2014, during which the Firm recorded net earnings attributable to the Company’s shareholders of $5.1 million, or $0.07 per share (basic and diluted).
› Adjusted net earnings attributable to the Company’s shareholders for the third quarter ended September 30, 2015 amounted to $17.3 million, or $0.25 per share (basic and diluted), compared to $14.6 million, or $0.21 per share (basic and diluted), for the third quarter ended September 30, 2014.
September 30, 2015September 30, 2015September 30, 2015September 30, 2015 compared tocompared tocompared tocompared to June 30, 2015June 30, 2015June 30, 2015June 30, 2015
› Total AUM decreased by $1.5 billion, or 2%, to $88.8 billion during the third quarter ended September 30, 2015, compared to $90.3 billion as at June 30, 2015.
› Base management fees and other revenues for the third quarter ended September 30, 2015, increased by $2.8 million, or 5%, to $60.3 million compared to $57.5 million for the previous quarter ended June 30, 2015.
› Performance fees were ($0.1) million for the third quarter ended September 30, 2015, compared to $8.6 million for the previous quarter ended June 30, 2015, and are generally recognized in June and December of each year.
› SG&A expenses and external managers’ expenses decreased by $2.5 million, or 5%, to $44.0 million for the third quarter ended September 30, 2015, compared to $46.5 million for the previous quarter ended June 30, 2015.

Management’s Discussion and Analysis For the Three and Nine-month Periods Ended September 30, 2015
12| Fiera Capital Corporation
› Adjusted EBITDA decreased by $4.5 million, or 19%, to $18.6 million for the third quarter ended September 30,
2015, compared to $23.1 million for the previous quarter ended June 30, 2015. Adjusted EBITDA per share was
$0.27 (basic and diluted) for the third quarter ended September 30, 2015, compared to $0.33 per share (basic
and diluted) for the previous quarter ended June 30, 2015.
› For the third quarter ended September 30, 2015, the Firm recorded net earnings attributable to the Company’s shareholders of $6.7 million, or $0.10 per share (basic and diluted), a decrease of $0.8 million, or 11%, compared to the previous quarter ended June 30, 2015, during which the Firm recorded net earnings attributable to the Company’s shareholders of $7.5 million, or $0.11 per share (basic and diluted).
› Adjusted net earnings attributable to the Company’s shareholders for the third quarter ended September 30, 2015 amounted to $17.3 million, or $0.25 per share (basic and diluted), compared to $18.1 million, or $0.26 per share (basic and diluted), for the previous quarter ended June 30, 2015.
Highlights for the Highlights for the Highlights for the Highlights for the ninenineninenine----monthmonthmonthmonth period ended period ended period ended period ended September 30, 2015September 30, 2015September 30, 2015September 30, 2015 were as follows:were as follows:were as follows:were as follows:
› Base management fees and other revenues for the nine-month period ended September 30, 2015, increased by $22.6 million, or 15%, to $175.8 million compared to $153.2 million for the same period last year.
› Performance fees were $8.6 million for the nine-month period ended September 30, 2015, compared to $4.8 million for the same period last year.
› SG&A expenses and external managers’ expenses rose by $23.2 million, or 21%, to $132.6 million for the nine-month period ended September 30, 2015, compared to $109.4 million for the nine-month period ended September 30, 2014.
› Adjusted EBITDA rose by $5.6 million, or 10%, to $59.0 million for the nine-month period ended September 30,
2015, compared to $53.4 million for the same period last year. Adjusted EBITDA per share was $0.85 (basic)
and $0.84 (diluted) for the nine-month period ended September 30, 2015, compared to $0.78 per share (basic)
and $0.77 (diluted) for the same period last year.
› For the nine-month period ended September 30, 2015, the Firm recorded net earnings attributable to the Company’s shareholders of $18.0 million, or $0.26 per share (basic and diluted), an increase of $2.6 million, or 17%, compared to the same period last year, during which the Firm recorded net earnings attributable to the Company’s shareholders of $15.4 million, or $0.23 per share (basic) and $0.22 (diluted).
› Adjusted net earnings attributable to the Company’s shareholders for the nine-month period ended September 30, 2015 were $49.9 million, or $0.71 per share (basic and diluted), compared to $43.2 million, or $0.63 per share (basic) and $0.62 (diluted), for the same period last year.
Management’s Discussion and Analysis For the Three and Nine-month Periods Ended September 30, 2015
13| Fiera Capital Corporation
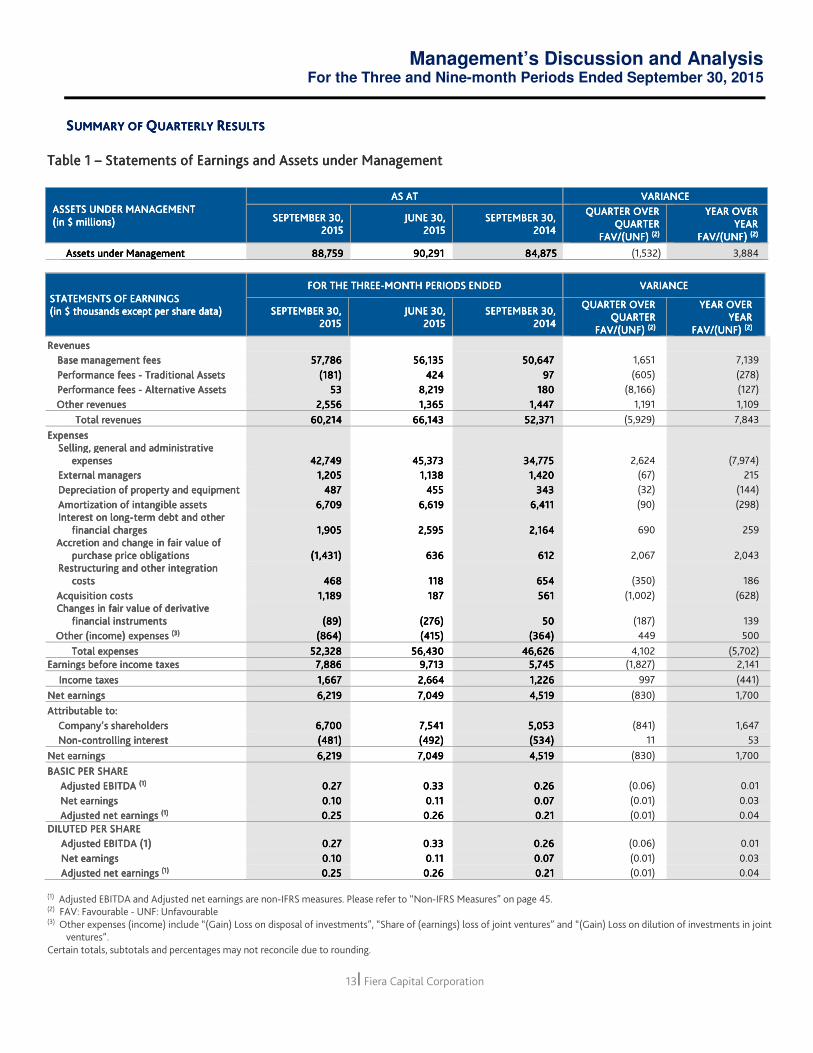
SSSSUMMUMMUMMUMMARY OF ARY OF ARY OF ARY OF QQQQUARTERLYUARTERLYUARTERLYUARTERLY RRRRESULTSESULTSESULTSESULTS Table Table Table Table 1111 –––– Statements of Statements of Statements of Statements of EEEEarningsarningsarningsarnings andandandand Assets Assets Assets Assets underunderunderunder MMMManagementanagementanagementanagement
ASSETS UNDER MANAGEMENT ASSETS UNDER MANAGEMENT ASSETS UNDER MANAGEMENT ASSETS UNDER MANAGEMENT ((((in $ millionsin $ millionsin $ millionsin $ millions))))
AS ATAS ATAS ATAS AT VARIANCEVARIANCEVARIANCEVARIANCE
SEPTEMBER 30SEPTEMBER 30SEPTEMBER 30SEPTEMBER 30, , , , 2012012012015555
JUNE 30JUNE 30JUNE 30JUNE 30, , , , 2012012012015555
SEPTEMBER 30SEPTEMBER 30SEPTEMBER 30SEPTEMBER 30, , , , 2012012012014444
QUARTER OVER QUARTER OVER QUARTER OVER QUARTER OVER QUARTERQUARTERQUARTERQUARTER
FAV/(UNF)FAV/(UNF)FAV/(UNF)FAV/(UNF) (2)(2)(2)(2)
YEAR OVERYEAR OVERYEAR OVERYEAR OVER YEARYEARYEARYEAR
FAV/(UNF)FAV/(UNF)FAV/(UNF)FAV/(UNF) (2)(2)(2)(2)
Assets under ManagementAssets under ManagementAssets under ManagementAssets under Management 88,75988,75988,75988,759 90,290,290,290,291919191 84,87584,87584,87584,875 (1,532) 3,884
STATEMENTS OF EARNINGS STATEMENTS OF EARNINGS STATEMENTS OF EARNINGS STATEMENTS OF EARNINGS ((((in $ in $ in $ in $ thousands except per share datathousands except per share datathousands except per share datathousands except per share data))))
FOR THE FOR THE FOR THE FOR THE THREETHREETHREETHREE----MONTH PERIODSMONTH PERIODSMONTH PERIODSMONTH PERIODS ENDEDENDEDENDEDENDED VARIANCEVARIANCEVARIANCEVARIANCE
SEPTEMBER 30SEPTEMBER 30SEPTEMBER 30SEPTEMBER 30, , , , 2012012012015555
JUNE 30JUNE 30JUNE 30JUNE 30, , , , 2012012012015555
SEPTEMBER 30SEPTEMBER 30SEPTEMBER 30SEPTEMBER 30, , , , 2012012012014444
QUARTER OVER QUARTER OVER QUARTER OVER QUARTER OVER QUARTERQUARTERQUARTERQUARTER
FAV/(UNF)FAV/(UNF)FAV/(UNF)FAV/(UNF) (2)(2)(2)(2)
YEAR OVERYEAR OVERYEAR OVERYEAR OVER YEARYEARYEARYEAR
FAV/(UNF)FAV/(UNF)FAV/(UNF)FAV/(UNF) (2)(2)(2)(2)
RevenueRevenueRevenueRevenues s s s
Base management fees Base management fees Base management fees Base management fees 57,78657,78657,78657,786 56,13556,13556,13556,135 50,64750,64750,64750,647 1,651 7,139
Performance feesPerformance feesPerformance feesPerformance fees ---- Traditional Assets Traditional Assets Traditional Assets Traditional Assets (181)(181)(181)(181) 424424424424 97979797 (605) (278)
Performance fees Performance fees Performance fees Performance fees ---- Alternative AssetsAlternative AssetsAlternative AssetsAlternative Assets 53535353 8,2198,2198,2198,219 180180180180 (8,166) (127)
Other revenuesOther revenuesOther revenuesOther revenues 2,5562,5562,5562,556 1,3651,3651,3651,365 1,4471,4471,4471,447 1,191 1,109
Total revenueTotal revenueTotal revenueTotal revenuessss 60,21460,21460,21460,214 66,14366,14366,14366,143 52,37152,37152,37152,371 (5,929) 7,843
ExpensesExpensesExpensesExpenses
Selling, general and administratiSelling, general and administratiSelling, general and administratiSelling, general and administrative ve ve ve expenses expenses expenses expenses 44442222,,,,747474749999 45,37345,37345,37345,373 34,77534,77534,77534,775 2,624 (7,974)
External managersExternal managersExternal managersExternal managers 1,2051,2051,2051,205 1,1381,1381,1381,138 1,4201,4201,4201,420 (67) 215
Depreciation of property Depreciation of property Depreciation of property Depreciation of property andandandand equipmentequipmentequipmentequipment 487487487487 455455455455 343343343343 (32) (144)
Amortization of intangible assetsAmortization of intangible assetsAmortization of intangible assetsAmortization of intangible assets 6,7096,7096,7096,709 6,6196,6196,6196,619 6,4116,4116,4116,411 (90) (298)
Interest on longInterest on longInterest on longInterest on long----term debt and other term debt and other term debt and other term debt and other
financial chargesfinancial chargesfinancial chargesfinancial charges 1,9051,9051,9051,905 2,5952,5952,5952,595 2,1642,1642,1642,164 690 259
AccretionAccretionAccretionAccretion and and and and change in fair valuechange in fair valuechange in fair valuechange in fair value ofofofof
purchase price obligationspurchase price obligationspurchase price obligationspurchase price obligations (1,431)(1,431)(1,431)(1,431) 636636636636 612612612612 2,067 2,043
Restructuring and otherRestructuring and otherRestructuring and otherRestructuring and other integrationintegrationintegrationintegration
costscostscostscosts 468468468468 118118118118 654654654654 (350) 186
Acquisition costsAcquisition costsAcquisition costsAcquisition costs 1,11,11,11,189898989 187187187187 561561561561 (1,002) (628)
ChangeChangeChangeChangessss in fair value of in fair value of in fair value of in fair value of derivative derivative derivative derivative
financial instrumentsfinancial instrumentsfinancial instrumentsfinancial instruments (89)(89)(89)(89) (276)(276)(276)(276) 50505050 (187) 139
Other (income) expenses Other (income) expenses Other (income) expenses Other (income) expenses (3)(3)(3)(3) (864)(864)(864)(864) (415)(415)(415)(415) (364)(364)(364)(364) 449 500
Total expensesTotal expensesTotal expensesTotal expenses 52,52,52,52,328328328328 56,43056,43056,43056,430 46,62646,62646,62646,626 4,102 (5,702) Earnings before income taxesEarnings before income taxesEarnings before income taxesEarnings before income taxes 7,7,7,7,886886886886 9,7139,7139,7139,713 5,7455,7455,7455,745 (1,827) 2,141
Income taxesIncome taxesIncome taxesIncome taxes 1,1,1,1,667667667667 2,6642,6642,6642,664 1,2261,2261,2261,226 997 (441)
Net earningsNet earningsNet earningsNet earnings 6,6,6,6,219219219219 7,0497,0497,0497,049 4,5194,5194,5194,519 (830) 1,700
Attributable to: Attributable to: Attributable to: Attributable to:
Company’s shareholders Company’s shareholders Company’s shareholders Company’s shareholders 6,6,6,6,700700700700 7,5417,5417,5417,541 5,0535,0535,0535,053 (841) 1,647
NonNonNonNon----controlling interestcontrolling interestcontrolling interestcontrolling interest (481)(481)(481)(481) (492)(492)(492)(492) (534)(534)(534)(534) 11 53
Net earningsNet earningsNet earningsNet earnings 6,26,26,26,219191919 7,0497,0497,0497,049 4,5194,5194,5194,519 (830) 1,700
BASIC PER SHAREBASIC PER SHAREBASIC PER SHAREBASIC PER SHARE
Adjusted EBITDAAdjusted EBITDAAdjusted EBITDAAdjusted EBITDA (1)(1)(1)(1)
Net earnings Net earnings Net earnings Net earnings
Adjusted net earnings Adjusted net earnings Adjusted net earnings Adjusted net earnings (1)(1)(1)(1)
0.20.20.20.27777 0.330.330.330.33 0.260.260.260.26 (0.06) 0.01
0.0.0.0.10101010 0.110.110.110.11 0.070.070.070.07 (0.01) 0.03
0.20.20.20.25555 0.260.260.260.26 0.210.210.210.21 (0.01) 0.04 DILUTED PER SHAREDILUTED PER SHAREDILUTED PER SHAREDILUTED PER SHARE
Adjusted EBITDAAdjusted EBITDAAdjusted EBITDAAdjusted EBITDA (1)(1)(1)(1) 0.20.20.20.27777 0.330.330.330.33 0.260.260.260.26 (0.06) 0.01
Net earnings Net earnings Net earnings Net earnings 0.0.0.0.10101010 0.110.110.110.11 0.070.070.070.07 (0.01) 0.03
Adjusted net earnings Adjusted net earnings Adjusted net earnings Adjusted net earnings (1)(1)(1)(1) 0.20.20.20.25555 0.260.260.260.26 0.210.210.210.21 (0.01) 0.04 (1) Adjusted EBITDA and Adjusted net earnings are non-IFRS measures. Please refer to “Non-IFRS Measures” on page 45. (2) FAV: Favourable - UNF: Unfavourable (3) Other expenses (income) include “(Gain) Loss on disposal of investments”, “Share of (earnings) loss of joint ventures” and “(Gain) Loss on dilution of investments in joint
ventures”. Certain totals, subtotals and percentages may not reconcile due to rounding.
Management’s Discussion and Analysis For the Three and Nine-month Periods Ended September 30, 2015
14| Fiera Capital Corporation
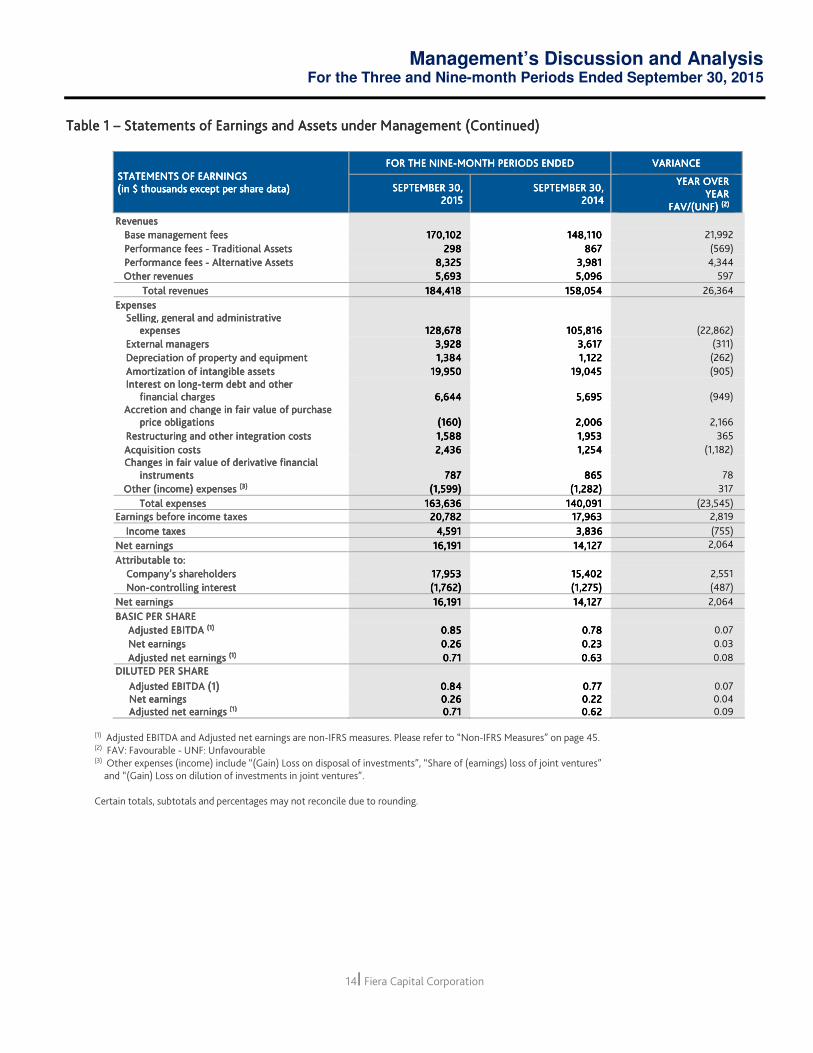
Table 1 Table 1 Table 1 Table 1 –––– Statements of Earnings and Assets under ManagementStatements of Earnings and Assets under ManagementStatements of Earnings and Assets under ManagementStatements of Earnings and Assets under Management (Continued)(Continued)(Continued)(Continued)
STATEMENTS OF EARNINGS STATEMENTS OF EARNINGS STATEMENTS OF EARNINGS STATEMENTS OF EARNINGS ((((in $ thousands except per share datain $ thousands except per share datain $ thousands except per share datain $ thousands except per share data))))
FOR THE FOR THE FOR THE FOR THE NINENINENINENINE----MONTHMONTHMONTHMONTH PERIODPERIODPERIODPERIODSSSS ENDEDENDEDENDEDENDED VARIANCEVARIANCEVARIANCEVARIANCE
SEPTEMBERSEPTEMBERSEPTEMBERSEPTEMBER 30303030, , , , 2012012012015555
SEPTEMBERSEPTEMBERSEPTEMBERSEPTEMBER 30303030, , , , 2012012012014444
YEAR OVERYEAR OVERYEAR OVERYEAR OVER YEARYEARYEARYEAR
FAV/(UNF)FAV/(UNF)FAV/(UNF)FAV/(UNF) (2)(2)(2)(2)
RevenueRevenueRevenueRevenues s s s
Base management fees Base management fees Base management fees Base management fees 170,102170,102170,102170,102 148,110148,110148,110148,110 21,992
Performance feesPerformance feesPerformance feesPerformance fees ---- Traditional Assets Traditional Assets Traditional Assets Traditional Assets 298298298298 867867867867 (569)
Performance fees Performance fees Performance fees Performance fees ---- Alternative AssetsAlternative AssetsAlternative AssetsAlternative Assets 8,3258,3258,3258,325 3,9813,9813,9813,981 4,344
Other revenuesOther revenuesOther revenuesOther revenues 5,6935,6935,6935,693 5,0965,0965,0965,096 597
Total revenueTotal revenueTotal revenueTotal revenuessss 184,418184,418184,418184,418 158,054158,054158,054158,054 26,364
ExpensesExpensesExpensesExpenses
Selling, general and administratiSelling, general and administratiSelling, general and administratiSelling, general and administrative ve ve ve expenses expenses expenses expenses 121212128888,,,,678678678678 105,816105,816105,816105,816 (22,862)
External managersExternal managersExternal managersExternal managers 3,9283,9283,9283,928 3,6173,6173,6173,617 (311)
Depreciation of property Depreciation of property Depreciation of property Depreciation of property andandandand equipmentequipmentequipmentequipment 1,3841,3841,3841,384 1,1221,1221,1221,122 (262)
Amortization of intangible Amortization of intangible Amortization of intangible Amortization of intangible assetsassetsassetsassets 19,95019,95019,95019,950 19,04519,04519,04519,045 (905)
Interest on longInterest on longInterest on longInterest on long----term debt and other term debt and other term debt and other term debt and other
financial chargesfinancial chargesfinancial chargesfinancial charges 6,6446,6446,6446,644 5,6955,6955,6955,695 (949)
AccretionAccretionAccretionAccretion and and and and change in fair valuechange in fair valuechange in fair valuechange in fair value ofofofof purchase purchase purchase purchase
price obligationsprice obligationsprice obligationsprice obligations (160)(160)(160)(160) 2,0062,0062,0062,006 2,166
Restructuring and otherRestructuring and otherRestructuring and otherRestructuring and other integrationintegrationintegrationintegration costscostscostscosts 1,1,1,1,588588588588 1,9531,9531,9531,953 365
Acquisition costsAcquisition costsAcquisition costsAcquisition costs 2,2,2,2,444436363636 1,2541,2541,2541,254 (1,182)
ChangeChangeChangeChangessss in fair value of in fair value of in fair value of in fair value of derivative derivative derivative derivative financial financial financial financial
instrumentsinstrumentsinstrumentsinstruments 787787787787 865865865865 78
Other (income) expenses Other (income) expenses Other (income) expenses Other (income) expenses (3)(3)(3)(3) (1,599)(1,599)(1,599)(1,599) (1,282)(1,282)(1,282)(1,282) 317
Total expensesTotal expensesTotal expensesTotal expenses 161616163333,6,6,6,636363636 140,091140,091140,091140,091 (23,545) Earnings before income taxesEarnings before income taxesEarnings before income taxesEarnings before income taxes 20,20,20,20,787878782222 17,96317,96317,96317,963 2,819
Income taxesIncome taxesIncome taxesIncome taxes 4,4,4,4,591591591591 3,8363,8363,8363,836 (755)
Net earningsNet earningsNet earningsNet earnings 16,16,16,16,191191191191 14,12714,12714,12714,127 2,064
Attributable to: Attributable to: Attributable to: Attributable to:
Company’s shareholders Company’s shareholders Company’s shareholders Company’s shareholders 17,17,17,17,953953953953 15,40215,40215,40215,402 2,551
NonNonNonNon----controlling interestcontrolling interestcontrolling interestcontrolling interest (1,762)(1,762)(1,762)(1,762) (1,275)(1,275)(1,275)(1,275) (487)
Net earningsNet earningsNet earningsNet earnings 16,16,16,16,191191191191 14,12714,12714,12714,127 2,064
BASIC PER SHAREBASIC PER SHAREBASIC PER SHAREBASIC PER SHARE
Adjusted EBITDAAdjusted EBITDAAdjusted EBITDAAdjusted EBITDA (1)(1)(1)(1)
Net earnings Net earnings Net earnings Net earnings
Adjusted net earnings Adjusted net earnings Adjusted net earnings Adjusted net earnings (1)(1)(1)(1)
0.80.80.80.85555 0.780.780.780.78 0.07
0.260.260.260.26 0.230.230.230.23 0.03
0.710.710.710.71 0.630.630.630.63 0.08 DILUTED PER SHAREDILUTED PER SHAREDILUTED PER SHAREDILUTED PER SHARE
Adjusted EBITDAAdjusted EBITDAAdjusted EBITDAAdjusted EBITDA (1)(1)(1)(1) 0.80.80.80.84444 0.770.770.770.77 0.07 Net earnings Net earnings Net earnings Net earnings 0.20.20.20.26666 0.220.220.220.22 0.04 Adjusted net earnings Adjusted net earnings Adjusted net earnings Adjusted net earnings (1)(1)(1)(1) 0.710.710.710.71 0.620.620.620.62 0.09
(1) Adjusted EBITDA and Adjusted net earnings are non-IFRS measures. Please refer to “Non-IFRS Measures” on page 45. (2) FAV: Favourable - UNF: Unfavourable (3) Other expenses (income) include “(Gain) Loss on disposal of investments”, “Share of (earnings) loss of joint ventures” and “(Gain) Loss on dilution of investments in joint ventures”. Certain totals, subtotals and percentages may not reconcile due to rounding.

Management’s Discussion and Analysis For the Three and Nine-month Periods Ended September 30, 2015
15| Fiera Capital Corporation
Table Table Table Table 2222 ---- Selected Selected Selected Selected Statements of Financial PositionStatements of Financial PositionStatements of Financial PositionStatements of Financial Position Information Information Information Information ((((in $ thousandsin $ thousandsin $ thousandsin $ thousands))))
SEPTEMBER 30, 2015SEPTEMBER 30, 2015SEPTEMBER 30, 2015SEPTEMBER 30, 2015
DECEMBERDECEMBERDECEMBERDECEMBER 31, 20131, 20131, 20131, 2014444
Cash, restricted cash and investmentsCash, restricted cash and investmentsCash, restricted cash and investmentsCash, restricted cash and investments 22,87822,87822,87822,878 25,44525,44525,44525,445
Accounts receivable Accounts receivable Accounts receivable Accounts receivable 53,80653,80653,80653,806 59,96059,96059,96059,960
Other current assetsOther current assetsOther current assetsOther current assets 5,8675,8675,8675,867 4,6544,6544,6544,654
Intangible assetsIntangible assetsIntangible assetsIntangible assets 286,412286,412286,412286,412 292,835292,835292,835292,835
GoodwillGoodwillGoodwillGoodwill 383,068383,068383,068383,068 370,161370,161370,161370,161
Investment in joint venturesInvestment in joint venturesInvestment in joint venturesInvestment in joint ventures 10,96610,96610,96610,966 9,6359,6359,6359,635
Other longOther longOther longOther long----term assetsterm assetsterm assetsterm assets 12,26612,26612,26612,266 9,4909,4909,4909,490
Total assetsTotal assetsTotal assetsTotal assets 775,263775,263775,263775,263 772,180772,180772,180772,180
Current liabilitiesCurrent liabilitiesCurrent liabilitiesCurrent liabilities 44,89344,89344,89344,893 53,68053,68053,68053,680
Deferred income taxesDeferred income taxesDeferred income taxesDeferred income taxes 16,33016,33016,33016,330 20,09120,09120,09120,091
LongLongLongLong----term debtterm debtterm debtterm debt 230,339230,339230,339230,339 222,081222,081222,081222,081
Purchase price obligationsPurchase price obligationsPurchase price obligationsPurchase price obligations 36,00836,00836,00836,008 36,16836,16836,16836,168
Derivative financial instrumentsDerivative financial instrumentsDerivative financial instrumentsDerivative financial instruments 1,7321,7321,7321,732 945945945945
Other longOther longOther longOther long----term liabilitiesterm liabilitiesterm liabilitiesterm liabilities 4,1244,1244,1244,124 5,0045,0045,0045,004
Total liabilitiesTotal liabilitiesTotal liabilitiesTotal liabilities 333,426333,426333,426333,426 337,969337,969337,969337,969
EquityEquityEquityEquity
Attributable to Company’s shareholdersAttributable to Company’s shareholdersAttributable to Company’s shareholdersAttributable to Company’s shareholders 446,542446,542446,542446,542 437,154437,154437,154437,154
Attributable to NonAttributable to NonAttributable to NonAttributable to Non----controlling interestcontrolling interestcontrolling interestcontrolling interest (4,705)(4,705)(4,705)(4,705) (2,943)(2,943)(2,943)(2,943)
441,837441,837441,837441,837 434,211434,211434,211434,211 Total liabilities and equityTotal liabilities and equityTotal liabilities and equityTotal liabilities and equity 775,263775,263775,263775,263 772,180772,180772,180772,180
Management’s Discussion and Analysis For the Three and Nine-month Periods Ended September 30, 2015
16| Fiera Capital Corporation
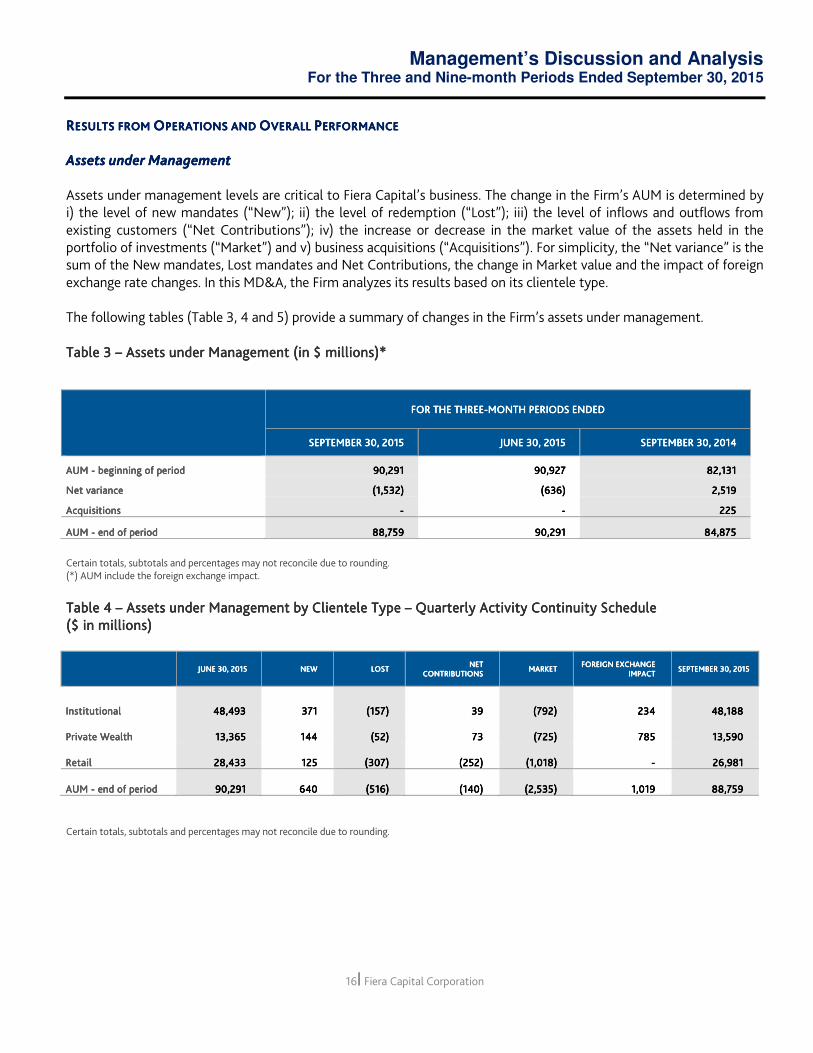
RRRRESULTS FROM ESULTS FROM ESULTS FROM ESULTS FROM OOOOPERATIONS AND PERATIONS AND PERATIONS AND PERATIONS AND OOOOVERALL VERALL VERALL VERALL PPPPERFORMANCEERFORMANCEERFORMANCEERFORMANCE Assets Assets Assets Assets underunderunderunder ManagementManagementManagementManagement Assets under management levels are critical to Fiera Capital’s business. The change in the Firm’s AUM is determined by i) the level of new mandates (“New”); ii) the level of redemption (“Lost”); iii) the level of inflows and outflows from existing customers (“Net Contributions”); iv) the increase or decrease in the market value of the assets held in the portfolio of investments (“Market”) and v) business acquisitions (“Acquisitions”). For simplicity, the “Net variance” is the sum of the New mandates, Lost mandates and Net Contributions, the change in Market value and the impact of foreign exchange rate changes. In this MD&A, the Firm analyzes its results based on its clientele type. The following tables (Table 3, 4 and 5) provide a summary of changes in the Firm’s assets under management. Table Table Table Table 3333 –––– Assets Assets Assets Assets underunderunderunder Management Management Management Management ((((in $ millionsin $ millionsin $ millionsin $ millions))))****
Certain totals, subtotals and percentages may not reconcile due to rounding. (*) AUM include the foreign exchange impact.
Table 4Table 4Table 4Table 4 –––– Assets under ManagementAssets under ManagementAssets under ManagementAssets under Management by by by by ClientClientClientClienteleeleeleele TypeTypeTypeType –––– Quarterly Activity Continuity ScheduleQuarterly Activity Continuity ScheduleQuarterly Activity Continuity ScheduleQuarterly Activity Continuity Schedule ($ in millions) ($ in millions) ($ in millions) ($ in millions)
Certain totals, subtotals and percentages may not reconcile due to rounding.
FOR THE FOR THE FOR THE FOR THE THREETHREETHREETHREE----MONTH PERIODSMONTH PERIODSMONTH PERIODSMONTH PERIODS ENDEDENDEDENDEDENDED
SEPTEMBER 30, 2015SEPTEMBER 30, 2015SEPTEMBER 30, 2015SEPTEMBER 30, 2015 JUNE 30, 2015JUNE 30, 2015JUNE 30, 2015JUNE 30, 2015 SEPTEMBER 30, 2014SEPTEMBER 30, 2014SEPTEMBER 30, 2014SEPTEMBER 30, 2014
AUM AUM AUM AUM ---- beginning of periodbeginning of periodbeginning of periodbeginning of period 90,29190,29190,29190,291 90,92790,92790,92790,927 82,13182,13182,13182,131
Net varianceNet varianceNet varianceNet variance (1,532)(1,532)(1,532)(1,532) (636)(636)(636)(636) 2,5192,5192,5192,519
AcquisitionsAcquisitionsAcquisitionsAcquisitions ---- ---- 225225225225
AUM AUM AUM AUM ---- end of periodend of periodend of periodend of period 88,75988,75988,75988,759 90,290,290,290,291919191 84,87584,87584,87584,875
JUNE 30, 2015JUNE 30, 2015JUNE 30, 2015JUNE 30, 2015 NEWNEWNEWNEW LOSTLOSTLOSTLOST
NET NET NET NET CONTRIBUTIONSCONTRIBUTIONSCONTRIBUTIONSCONTRIBUTIONS
MARKETMARKETMARKETMARKET FOREIGN EXCHANGE FOREIGN EXCHANGE FOREIGN EXCHANGE FOREIGN EXCHANGE
IMPACTIMPACTIMPACTIMPACT SEPTEMBER 30, 2015SEPTEMBER 30, 2015SEPTEMBER 30, 2015SEPTEMBER 30, 2015
InstitutionalInstitutionalInstitutionalInstitutional 48,49348,49348,49348,493 371371371371 (157)(157)(157)(157) 39393939 (792)(792)(792)(792) 234234234234 48,18848,18848,18848,188
Private WealthPrivate WealthPrivate WealthPrivate Wealth 13,36513,36513,36513,365 144144144144 (52)(52)(52)(52) 73737373 (725)(725)(725)(725) 785785785785 13,59013,59013,59013,590
RetailRetailRetailRetail 28,43328,43328,43328,433 125125125125 (307)(307)(307)(307) ((((252252252252)))) ((((1,0181,0181,0181,018)))) ---- 26,98126,98126,98126,981
AUM AUM AUM AUM ---- end ofend ofend ofend of periodperiodperiodperiod 90,29190,29190,29190,291 640640640640 (516)(516)(516)(516) ((((140140140140)))) ((((2,5352,5352,5352,535)))) 1,0191,0191,0191,019 88,75988,75988,75988,759

Management’s Discussion and Analysis For the Three and Nine-month Periods Ended September 30, 2015
17| Fiera Capital Corporation
Quarterly ActivitiesQuarterly ActivitiesQuarterly ActivitiesQuarterly Activities Total AUM decreased by $1.5 billion, or 2%, to $88.8 billion during the third quarter ended September 30, 2015, compared to $90.3 billion as at June 30, 2015. The decrease is due primarily to market depreciation of $2.5 billion, combined with lost mandates of $0.5 billion and negative net contribution of $0.1 billion, partially offset by new mandates of $0.6 billion. Lastly, the US dollars exchange rate fluctuations positively impacted AUM during the third quarter by approximately $1.0 billion. The Institutional AUM decreased by $0.3 billion or less than 1%, to $48.2 billion during the third quarter ended September 30, 2015, compared to $48.5 billion from the previous quarter ended June 30, 2015. The decrease can be explained by market depreciation of $0.8 billion combined with $0.2 billion of client losses which were driven primarily by clients that had liquidity needs. These clients decided to consolidate investment management providers, that implemented advanced de-risking strategies as well as some that brought the management of assets in-house. This decrease in AUM was partially offset by $0.4 billion of new mandates won during the quarter, primarily in Balanced, Global Equity, Canadian Small Cap Equity, as well as Traditional and Alternative Fixed Income strategies. Lastly, the US dollar exchange rate fluctuations positively impacted AUM during the third quarter by approximately $0.2 billion. The AUM related to the Private Wealth clientele increased by $0.2 billion, or 2%, to $13.6 billion during the third quarter ended September 30, 2015, compared to $13.4 billion from the previous quarter ended June 30, 2015. The increase is mainly due to new clients and positive net contribution, while the market depreciation during the period was offset by the positive impact of the foreign exchange rate fluctuations. The AUM related to the Retail clientele decreased by $1.4 billion, or 5%, to $27.0 billion during the third quarter ended September 30, 2015, compared to $28.4 billion from the previous quarter ended June 30, 2015. The decrease is mainly due to market depreciation combined with lost mandates (mostly from one major mandate resulting from repatriation of assets) and negative net contribution during the period. Table 5Table 5Table 5Table 5 –––– Assets under ManagementAssets under ManagementAssets under ManagementAssets under Management by Clientele Type by Clientele Type by Clientele Type by Clientele Type –––– YearYearYearYear----totototo----Date Activity Continuity ScheduleDate Activity Continuity ScheduleDate Activity Continuity ScheduleDate Activity Continuity Schedule (in $ millions) (in $ millions) (in $ millions) (in $ millions)
Certain totals, subtotals and percentages may not reconcile due to rounding. (*) The net contribution includes a negative $0.5 billion to adjust the valuation of a specific mandate to its unlevered value.
Year-to-Date Activity Total AUM increased by $2.1 billion, or 2.5%, to $88.8 billion during the nine-month period ended September 30, 2015, compared to $86.6 billion as at December 31, 2014. The increase is due primarily to new mandates of $2.4 billion, mostly from the Institutional and Private Wealth clientele, combined with a positive net contribution of $0.6 billion, partially offset by lost mandates of $2.1 billion and market depreciation of $0.6 million. Finally, the US dollar exchange rate fluctuation positively impacted AUM during the nine-month period ended September 30, 2015 by approximately $1.9 billion.
DECEMBERDECEMBERDECEMBERDECEMBER 31, 31, 31, 31, 2222010101014444 NEWNEWNEWNEW LOSTLOSTLOSTLOST
NET NET NET NET CONTRIBUTIONSCONTRIBUTIONSCONTRIBUTIONSCONTRIBUTIONS
MARKETMARKETMARKETMARKET FOREIGN EXCHANGE FOREIGN EXCHANGE FOREIGN EXCHANGE FOREIGN EXCHANGE
IMPACTIMPACTIMPACTIMPACT SEPTEMBER 30, 2015SEPTEMBER 30, 2015SEPTEMBER 30, 2015SEPTEMBER 30, 2015
InstitutionalInstitutionalInstitutionalInstitutional 46,77446,77446,77446,774 1,5251,5251,5251,525 (972)(972)(972)(972) ----**** 473473473473 388388388388 48,48,48,48,188188188188
Private WealthPrivate WealthPrivate WealthPrivate Wealth 11,99811,99811,99811,998 566566566566 (212)(212)(212)(212) 218218218218 (509)(509)(509)(509) 1,5291,5291,5291,529 13,59013,59013,59013,590
RetailRetailRetailRetail 27,84027,84027,84027,840 295295295295 (914)(914)(914)(914) 363636368888 ((((608608608608)))) ---- 26,98126,98126,98126,981
AUM AUM AUM AUM ---- end ofend ofend ofend of periodperiodperiodperiod 86,61286,61286,61286,612 2,3862,3862,3862,386 (2,098)(2,098)(2,098)(2,098) 586586586586 ((((644644644644)))) 1,9171,9171,9171,917 88,75988,75988,75988,759

Management’s Discussion and Analysis For the Three and Nine-month Periods Ended September 30, 2015
18| Fiera Capital Corporation
The following graphs illustrate the breakdown of the Firm’s AUM by clientele type and by asset class as at September 30, 2014 and September 30, 2015, respectively.
RevenueRevenueRevenueRevenuessss The Firm’s revenues consist of (i) management fees, (ii) performance fees, and (iii) other revenues. Management fees are AUM-based and, for each clientele type, revenues are primarily earned on the AUM average closing value at the end of each day, month or calendar quarter in accordance with contractual agreements. For certain mandates, the Firm is also entitled to performance fees. The Firm categorizes performance fees in two groups: those associated with traditional asset classes or strategies and those associated with alternative asset classes or strategies. Other revenues are primarily derived from brokerage and consulting fees which are not AUM driven. The following revenue analysis refers to average assets for each clientele type.

Management’s Discussion and Analysis For the Three and Nine-month Periods Ended September 30, 2015
19| Fiera Capital Corporation
Table Table Table Table 6666 –––– RevenueRevenueRevenueRevenuessss: Quarterly Activity (: Quarterly Activity (: Quarterly Activity (: Quarterly Activity (in $ thousandsin $ thousandsin $ thousandsin $ thousands))))
FOR THE FOR THE FOR THE FOR THE THREETHREETHREETHREE----MONTH PERIODMONTH PERIODMONTH PERIODMONTH PERIODSSSS ENDEDENDEDENDEDENDED VVVVARIANCEARIANCEARIANCEARIANCE
SEPTEMBERSEPTEMBERSEPTEMBERSEPTEMBER 33330000, , , ,
2012012012015555 JUNEJUNEJUNEJUNE 33330000, , , ,
2015201520152015 SEPTEMBERSEPTEMBERSEPTEMBERSEPTEMBER 33330000,,,,
2012012012014444 QUARTER OVER QUARTER OVER QUARTER OVER QUARTER OVER
QUARTERQUARTERQUARTERQUARTER YEAR OVERYEAR OVERYEAR OVERYEAR OVER
YEARYEARYEARYEAR
InstitutionalInstitutionalInstitutionalInstitutional 23,87623,87623,87623,876 22,88122,88122,88122,881 19,60319,60319,60319,603 995 4,273
Private WealthPrivate WealthPrivate WealthPrivate Wealth 18,85718,85718,85718,857 17,88317,88317,88317,883 15,87615,87615,87615,876 974 2,981
RetailRetailRetailRetail 15,05315,05315,05315,053 15,37115,37115,37115,371 15,16815,16815,16815,168 (318) (115)
Total management fees Total management fees Total management fees Total management fees 57,78657,78657,78657,786 56,13556,13556,13556,135 50,64750,64750,64750,647 1,651 7,139 Performance fees Performance fees Performance fees Performance fees –––– Traditional Traditional Traditional Traditional
asset classasset classasset classasset class (181)(181)(181)(181) 424424424424 97979797 (605) (278) Performance fees Performance fees Performance fees Performance fees ––––
Alternative asset classAlternative asset classAlternative asset classAlternative asset class 53535353 8,2198,2198,2198,219 180180180180 (8,166) (127)
Total performance fees Total performance fees Total performance fees Total performance fees (128)(128)(128)(128) 8,6438,6438,6438,643 277277277277 (8,771) (405)
Other revenuesOther revenuesOther revenuesOther revenues 2,5562,5562,5562,556 1,3651,3651,3651,365 1,4471,4471,4471,447 1,191 1,109
Total rTotal rTotal rTotal revenueevenueevenueevenuessss 60,21460,21460,21460,214 66,14366,14366,14366,143 52,37152,37152,37152,371 (5,929) 7,843
Certain totals, subtotals and percentages may not reconcile due to rounding.
Current Quarter versus Prior-Year Quarter Revenues for the third quarter ended September 30, 2015 increased by $7.8 million, or 15%, to $60.2 million compared to $52.4 million for the same period last year. The increase in revenues is due mainly to the higher AUM base driving a $7.1 million improvement in management fees, combined with higher other revenues, partially offset by lower performance fees. Management Fees Management fees increased by $7.2 million, or 14%, to $57.8 million for the third quarter ended September 30, 2015, compared to $50.6 million for the same period last year. The overall increase in revenues and the increase by clientele type are as follows:
› Revenues from the Institutional clientele improved by $4.3 million, or 22%, to $23.9 million for the third quarter ended September 30, 2015, compared to $19.6 million for the same quarter last year. The improvement is primarily due to the increase in net AUM, resulting from new mandates namely from the U.S., market appreciation and the positive impact of foreign exchange rate fluctuations, compared to the same period last year.
› Revenues from the Private Wealth clientele increased by $3.0 million, or 19%, to $18.9 million for the third quarter ended September 30, 2015, compared to $15.9 million for the same period last year. The increase is primarily due to the increase in net AUM namely from Bel Air compared to the same period last year, combined with the positive impact of changes in foreign exchange rates.
› Revenues from the Retail clientele decreased by $0.1 million, or 1%, to $15.1 million for the third quarter ended September 30, 2015, compared to $15.2 million for the same quarter last year. The decrease is mainly due to lower revenues from alternative strategies, partially offset by additional revenue from the acquisition of Propel (three months of revenue in the third quarter of 2015 compared to one month of revenue for the corresponding quarter of 2014).
Management’s Discussion and Analysis For the Three and Nine-month Periods Ended September 30, 2015
20| Fiera Capital Corporation
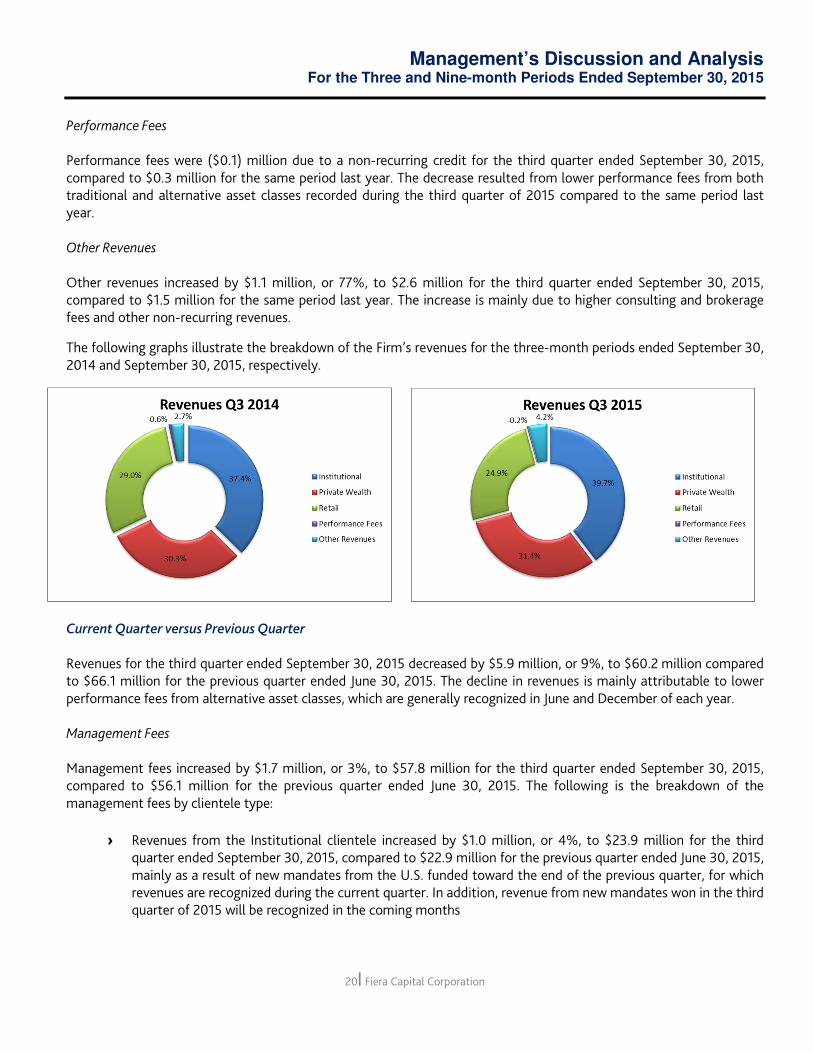
Performance Fees Performance fees were ($0.1) million due to a non-recurring credit for the third quarter ended September 30, 2015, compared to $0.3 million for the same period last year. The decrease resulted from lower performance fees from both traditional and alternative asset classes recorded during the third quarter of 2015 compared to the same period last year. Other Revenues Other revenues increased by $1.1 million, or 77%, to $2.6 million for the third quarter ended September 30, 2015, compared to $1.5 million for the same period last year. The increase is mainly due to higher consulting and brokerage fees and other non-recurring revenues.
The following graphs illustrate the breakdown of the Firm’s revenues for the three-month periods ended September 30, 2014 and September 30, 2015, respectively.
Current Quarter versus Previous Quarter Revenues for the third quarter ended September 30, 2015 decreased by $5.9 million, or 9%, to $60.2 million compared to $66.1 million for the previous quarter ended June 30, 2015. The decline in revenues is mainly attributable to lower performance fees from alternative asset classes, which are generally recognized in June and December of each year. Management Fees Management fees increased by $1.7 million, or 3%, to $57.8 million for the third quarter ended September 30, 2015, compared to $56.1 million for the previous quarter ended June 30, 2015. The following is the breakdown of the management fees by clientele type:
› Revenues from the Institutional clientele increased by $1.0 million, or 4%, to $23.9 million for the third quarter ended September 30, 2015, compared to $22.9 million for the previous quarter ended June 30, 2015, mainly as a result of new mandates from the U.S. funded toward the end of the previous quarter, for which revenues are recognized during the current quarter. In addition, revenue from new mandates won in the third quarter of 2015 will be recognized in the coming months

Management’s Discussion and Analysis For the Three and Nine-month Periods Ended September 30, 2015
21| Fiera Capital Corporation
› Revenues from the Private Wealth clientele increased by $1.0 million, or 5%, to $18.9 million for the third quarter ended September 30, 2015, compared to $17.9 million for the previous quarter ended June 30, 2015. This increase in revenue is mainly attributable to higher management fees from Bel Air and Wilkinson.
› Revenues from the Retail clientele decreased by $0.3 million, or 2%, to $15.1 million for the third quarter ended September 30, 2015, compared to $15.4 million for the previous quarter ended June 30, 2015, mainly due to a lower AUM base.
Performance Fees Total performance fees, which are generally recorded in June and December of each year, were ($0.1) million due to a non-recurring credit for the third quarter ended September 30, 2015, compared to $8.6 million for the previous quarter ended June 30, 2015, resulting from strong fund performance from the alternative asset class. Other Revenues Other revenues increased by $1.2 million, or 87%, to $2.6 million for the third quarter ended September 30, 2015, compared to $1.4 million for the previous quarter ended June 30, 2015. The increase in other revenues is mainly due to higher consulting and brokerage fees and other non-recurring revenues. Table Table Table Table 7777 –––– RevenueRevenueRevenueRevenuessss: : : : YearYearYearYear----totototo----DateDateDateDate Activity (Activity (Activity (Activity (in $ thousandsin $ thousandsin $ thousandsin $ thousands))))
FOR THE FOR THE FOR THE FOR THE NINENINENINENINE----MONTHMONTHMONTHMONTH PERIODSPERIODSPERIODSPERIODS ENDEDENDEDENDEDENDED VARIANCEVARIANCEVARIANCEVARIANCE
SEPTEMBER 30, 2015SEPTEMBER 30, 2015SEPTEMBER 30, 2015SEPTEMBER 30, 2015 SEPTEMBER 30, 2014SEPTEMBER 30, 2014SEPTEMBER 30, 2014SEPTEMBER 30, 2014 YEAR OVER YEARYEAR OVER YEARYEAR OVER YEARYEAR OVER YEAR
InstitutionalInstitutionalInstitutionalInstitutional 68,84668,84668,84668,846 56,62356,62356,62356,623 12,223
Private WealthPrivate WealthPrivate WealthPrivate Wealth 55,06355,06355,06355,063 47,23547,23547,23547,235 7,828
RetailRetailRetailRetail 46,19346,19346,19346,193 44,25244,25244,25244,252 1,941
Total management fees Total management fees Total management fees Total management fees 170,102170,102170,102170,102 148,110148,110148,110148,110 21,992
Performance fees Performance fees Performance fees Performance fees –––– Traditional asset classTraditional asset classTraditional asset classTraditional asset class 298298298298 867867867867 (569)
Performance fees Performance fees Performance fees Performance fees –––– Alternative asset classAlternative asset classAlternative asset classAlternative asset class 8,3258,3258,3258,325 3,9813,9813,9813,981 4,344
Total performance fees Total performance fees Total performance fees Total performance fees 8,6238,6238,6238,623 4,8484,8484,8484,848 3,775
Other revenuesOther revenuesOther revenuesOther revenues 5,6935,6935,6935,693 5,0965,0965,0965,096 597
Total Total Total Total rrrrevenueevenueevenueevenuessss 184,184,184,184,418418418418 158,054158,054158,054158,054 26,364
Certain totals, subtotals and percentages may not reconcile due to rounding.
Year-to-Date September 30, 2015 versus Year-to-Date September 30, 2014 Revenues for the nine-month period ended September 30, 2015 increased by $26.4 million, or 17%, to $184.4 million, compared to $158.1 million for the same period last year. The increase in revenues is mainly due to the higher AUM base, driving a $22.0 million improvement in management fees, resulting from market appreciation, new mandates, the acquisition of assets from Propel and the positive impact of foreign exchange rate fluctuations, combined with an increase of $4.3 million in performance fees.

Management’s Discussion and Analysis For the Three and Nine-month Periods Ended September 30, 2015
22| Fiera Capital Corporation
Management Fees Management fees increased by $22.0 million, or 15%, to $170.1 million for the nine-month period ended September 30, 2015, compared to $148.1 million for the same period last year. The overall increase in management fees and the increase by clientele type are as follows:
› Revenues from the Institutional clientele increased by $12.2 million, or 22%, to $68.8 million for the nine-month period ended September 30, 2015, compared to $56.6 million for the same period last year. The improvement is mainly due to additional net AUM, mostly from new mandates in the U.S., combined with the positive impact of foreign exchange rate fluctuations, as well as market appreciation during the period.
› Revenues from the Private Wealth clientele increased by $7.8 million, or 17%, to $55.0 million for the nine-month period ended September 30, 2015, compared to $47.2 million for the same period last year. This increase in revenue is mainly attributable to higher average AUM, due to the positive impact of foreign exchange rate fluctuations, as well as market appreciation during the period.
› Revenues from the Retail clientele increased by $1.9 million, or 4%, to $46.2 million for the nine-month period ended September 30, 2015, compared to $44.3 million for the same period last year. The increase is mainly attributable to three full quarters of revenues from Propel during the nine-month period ended September 30, 2015.
Performance Fees Total performance fees amounted to $8.6 million for the nine-month period ended September 30, 2015, compared to $4.8 million for the same period last year. This improvement is due to a $4.3 million increase in alternative asset class performance fees resulting from strong fund performance whereas the level of AUM remained fairly stable, partially offset by a $0.6 million decrease in traditional asset class performance fees due to non-recurring credits. Other Revenues Other revenues increased by $0.6 million, or 12%, to $5.7 million for the nine-month period ended September 30, 2015, compared to $5.1 million for the same period last year. The increase in other revenues is mainly due to higher consulting and brokerage fees during the first nine months of 2015. Selling, Selling, Selling, Selling, GGGGeneral and eneral and eneral and eneral and AAAAdministrative Expensesdministrative Expensesdministrative Expensesdministrative Expenses Current Quarter versus Prior-Year Quarter SG&A expenses rose by $8.0 million, or 23%, to $42.8 million for the three-month period ended September 30, 2015, compared to $34.8 million for the same period last year. The increase is mainly due to the impact of foreign exchange rate fluctuations on U.S. operations, higher compensation, combined with the inclusion of costs following the Propel acquisition.
Management’s Discussion and Analysis For the Three and Nine-month Periods Ended September 30, 2015
23| Fiera Capital Corporation
Current Quarter versus Previous Quarter SG&A expenses decreased by $2.6 million, or 6%, to $42.8 million for the three-month period ended September 30, 2015, compared to $45.4 million for the previous quarter ended June 30, 2015. The decrease is mainly attributable to lower compensation which is related to lower revenue from performance fees of the alternative asset class. Year-to-Date September 30, 2015 versus Year-to-Date September 30, 2014 SG&A expenses increased by $22.9 million, or 22%, to $128.7 million for the nine-month period ended September 30, 2015, compared to $105.8 million for the same period last year. The increase is mainly due to the inclusion of costs related to the Propel acquisition and performance fees incentive costs, combined with the impact of foreign exchange rate changes on U.S. operations. External External External External MMMManagersanagersanagersanagers Current Quarter versus Prior-Year Quarter External managers’ expenses decreased by $0.2 million, or 15%, to $1.2 million for the third quarter ended September 30, 2015, compared to $1.4 million for the same quarter last year. The decrease in external managers’ expenses is mainly due to lower external managers’ expenses from Bel Air resulting from the change in revenue presentation, partially offset by higher expenses following the acquisition of Propel. Current Quarter versus Previous Quarter External managers’ expenses remained fairly stable at $1.2 million for the third quarter ended September 30, 2015, compared to $1.1 million for the previous quarter ended June 30, 2015. Year-to-Date September 30, 2015 versus Year-to-Date September 30, 2014 External managers’ expenses rose by $0.3 million, or 9%, to $3.9 million for the nine-month period ended September 30, 2015, compared to $3.6 million for the same period last year. The increase is mainly due to the Propel acquisition, partially offset by a decrease in external managers’ expenses from Bel Air. Depreciation and Depreciation and Depreciation and Depreciation and Amortization Amortization Amortization Amortization Current Quarter versus Prior-Year Quarter Depreciation of property and equipment increased by $0.2 million to $0.5 million for the third quarter ended September 30, 2015, compared to $0.3 million for the corresponding quarter last year. Amortization of intangible assets increased by $0.3 million, or 5%, to $6.7 million for the third quarter ended September 30, 2015, compared to $6.4 million for the same period last year, following the acquisition of intangible assets from Propel.
Management’s Discussion and Analysis For the Three and Nine-month Periods Ended September 30, 2015
24| Fiera Capital Corporation
Current Quarter versus Previous Quarter Depreciation of property and equipment remained unchanged at $0.5 million for the third quarter ended September 30, 2015, compared to the previous quarter ended June 30, 2015. Amortization of intangible assets remained unchanged at $6.7 million for the third quarter ended September 30, 2015, compared to the previous quarter ended June 30, 2015. Year-to-Date September 30, 2015 versus Year-to-Date September 30, 2014 Depreciation of property and equipment increased by $0.3 million, or 23%, to $1.4 million for the nine-month period ended September 30, 2015, compared to $1.1 million for the same period last year. Amortization of intangible assets increased by $0.9 million, or 5%, to $19.9 million for the nine-month period ended September 30, 2015, compared to $19.0 million for the same period last year, following the acquisition of intangible assets from Propel. InterestInterestInterestInterest on on on on LLLLongongongong----TTTTerm erm erm erm DDDDebt and ebt and ebt and ebt and OOOOther ther ther ther FFFFinancial inancial inancial inancial CCCChargeshargeshargesharges Current Quarter versus Prior-Year Quarter The interest on long-term debt and other financial charges decreased by $0.3 million, or 12%, to $1.9 million for the third quarter ended September 30, 2015, compared to $2.2 million for the same quarter last year, due to lower financing costs under the new credit facility starting from June 26, 2015. Current Quarter versus Previous Quarter The interest on long-term debt and other financial charges decreased by $0.7 million, or 27%, to $1.9 million for the third quarter ended September 30, 2015, compared to $2.6 million for the previous quarter ended June 30, 2015, due to one-time financing costs recorded in June 2015. Year-to-Date September 30, 2015 versus Year-to-Date September 30, 2014 The interest on long-term debt and other financial charges increased by $0.9 million, or 17%, to $6.6 million for the nine-month period ended September 30, 2015, compared to $5.7 million for the same period last year, following the acquisition of Propel and the recognition of one-time financing costs. AccretionAccretionAccretionAccretion and and and and Change in Fair ValueChange in Fair ValueChange in Fair ValueChange in Fair Value ofofofof PPPPurchase urchase urchase urchase PPPPrice rice rice rice OOOObligationsbligationsbligationsbligations Current Quarter versus Prior-Year Quarter The accretion and change in fair value of purchase price obligations represented a gain of $1.4 million for the third quarter ended September 30, 2015, compared to a charge of $0.6 million for the same quarter last year. This is due to a revaluation of purchase price obligations of $2 million as the Company reviewed its estimate with regards to the performance conditions required to make the contingent payment of $2 million. As a result of this review and mostly due to the challenging market conditions currently present within the closed-end fund industry, the Company concluded that the required performance conditions would not be met by December 31, 2015, and that no payment would be made.

Management’s Discussion and Analysis For the Three and Nine-month Periods Ended September 30, 2015
25| Fiera Capital Corporation
Current Quarter versus Previous Quarter The accretion and change in fair value of purchase price obligations represented a gain of $1.4 million for the third quarter ended September 30, 2015, compared to a charge of $0.6 million for second quarter ended June 30, 2015. This is due to a revaluation of purchase price obligations of $2 million recorded in September 2015 related to closed-end funds from Propel. Year-to-Date September 30, 2015 versus Year-to-Date September 30, 2014 The accretion and change in fair value of purchase price obligations represented a gain of $0.2 million for the nine-month period ended September 30, 2015, compared to a charge of $2.0 million for the comparable period ended September 30, 2014. This is due to a revaluation of purchase price obligation of $2 million recorded in September 2015 related to closed-end funds from Propel. Acquisition and RestructuringAcquisition and RestructuringAcquisition and RestructuringAcquisition and Restructuring and Other Integrationand Other Integrationand Other Integrationand Other Integration CCCCostsostsostsosts Current Quarter versus Prior-Year Quarter Acquisition and restructuring and other integration costs increased by $0.5 million, or 36%, to $1.7 million for the third quarter ended September 30, 2015, compared to $1.2 million for the same period last year. The increase in acquisition and restructuring costs is mainly due to more activities in setting up the U.S. platform during the third quarter ended September 30, 2015, compared to the same period last year. Current Quarter versus Previous Quarter Acquisition and restructuring and other integration costs increased by $1.4 million, or over 100%, to $1.7 million for the third quarter ended September 30, 2015, compared to $0.3 million for the previous quarter ended June 30, 2015. The increase is mainly due to the costs related to various new initiatives during the third quarter of 2015. Year-to-Date September 30, 2015 versus Year-to-Date September 30, 2014 Acquisition and restructuring and other integration costs increased by $0.8 million, or 25%, to $4.0 million for the nine-month period ended September 30, 2015, compared to $3.2 million for the same period last year. The increase is mainly attributable to higher acquisitions costs resulting from various initiatives during the nine-month period ended September 30, 2015, compared to the same period last year, partially offset by lower restructuring and other integration costs. ChangeChangeChangeChangessss in Fair Value of in Fair Value of in Fair Value of in Fair Value of Derivative Derivative Derivative Derivative Financial InstrumentsFinancial InstrumentsFinancial InstrumentsFinancial Instruments The Company recorded a gain of $0.1 million related to changes in the fair value of derivative financial instruments for the third quarter ended September 30, 2015, compared to a gain of $0.3 million for the previous quarter ended June 30, 2015, and compared to a charge of $0.1 million for the third quarter ended September 30, 2014. Adjusted EBITDAAdjusted EBITDAAdjusted EBITDAAdjusted EBITDA Adjusted EBITDA is calculated as the difference between total revenues and SG&A expenses (excluding non-cash compensation) and external managers’ expenses. We believe that adjusted EBITDA is a meaningful measure as it allows for the evaluation of our operating performance before the impact of non-operating items.

Management’s Discussion and Analysis For the Three and Nine-month Periods Ended September 30, 2015
26| Fiera Capital Corporation
Table Table Table Table 8888 ---- Adjusted EBITDAAdjusted EBITDAAdjusted EBITDAAdjusted EBITDA**** ((((in $ thousandsin $ thousandsin $ thousandsin $ thousands except per share dataexcept per share dataexcept per share dataexcept per share data))))
FOR THE FOR THE FOR THE FOR THE THREETHREETHREETHREE----MONTH PERIODSMONTH PERIODSMONTH PERIODSMONTH PERIODS ENDEDENDEDENDEDENDED FOR THE FOR THE FOR THE FOR THE NINENINENINENINE----MONTHMONTHMONTHMONTH PERIODS ENDEDPERIODS ENDEDPERIODS ENDEDPERIODS ENDED
SEPTEMBERSEPTEMBERSEPTEMBERSEPTEMBER 30,30,30,30, 2015201520152015
JUNE 30, JUNE 30, JUNE 30, JUNE 30, 2015201520152015
SEPTEMBERSEPTEMBERSEPTEMBERSEPTEMBER 30, 30, 30, 30, 2014201420142014
SEPTEMBER 30, SEPTEMBER 30, SEPTEMBER 30, SEPTEMBER 30, 2015201520152015
SEPTEMBER 30, SEPTEMBER 30, SEPTEMBER 30, SEPTEMBER 30, 2014201420142014
RevenueRevenueRevenueRevenuessss
Base management fees Base management fees Base management fees Base management fees 57,78657,78657,78657,786 56,13556,13556,13556,135 50,64750,64750,64750,647 170,102170,102170,102170,102 148,110148,110148,110148,110
Performance feesPerformance feesPerformance feesPerformance fees (128)(128)(128)(128) 8,6438,6438,6438,643 277277277277 8,6238,6238,6238,623 4,8484,8484,8484,848
Other revenuesOther revenuesOther revenuesOther revenues 2,5562,5562,5562,556 1,3651,3651,3651,365 1,4471,4471,4471,447 5,6935,6935,6935,693 5,0965,0965,0965,096
Total revenueTotal revenueTotal revenueTotal revenuessss 60,21460,21460,21460,214 66,14366,14366,14366,143 52,37152,37152,37152,371 184,418184,418184,418184,418 158,054158,054158,054158,054
ExpensesExpensesExpensesExpenses
Selling, general and administratiSelling, general and administratiSelling, general and administratiSelling, general and administrativeveveve 44442222,,,,747474749999 45,37345,37345,37345,373 34,77534,77534,77534,775 121212128888,,,,678678678678 105,816105,816105,816105,816
External managersExternal managersExternal managersExternal managers 1,2051,2051,2051,205 1,1381,1381,1381,138 1,4201,4201,4201,420 3,9283,9283,9283,928 3,6173,6173,6173,617
Total expensesTotal expensesTotal expensesTotal expenses 44443333,,,,999954545454 46,51146,51146,51146,511 36,19536,19536,19536,195 131313132222,,,,666606060606 109,433109,433109,433109,433
EBITDAEBITDAEBITDAEBITDA 11116666,,,,222260606060 19,63219,63219,63219,632 16,17616,17616,17616,176 55551111,,,,812812812812 48,62148,62148,62148,621
Add back: NonAdd back: NonAdd back: NonAdd back: Non----cash compensationcash compensationcash compensationcash compensation 2,3482,3482,3482,348 3,4183,4183,4183,418 1,9091,9091,9091,909 7,2127,2127,2127,212 4,7824,7824,7824,782
Adjusted EBITDAAdjusted EBITDAAdjusted EBITDAAdjusted EBITDA 11118888,,,,608608608608 23,05023,05023,05023,050 18,08518,08518,08518,085 55559999,,,,024024024024 53,40353,40353,40353,403
Per share basicPer share basicPer share basicPer share basic (**)(**)(**)(**) 0.20.20.20.27777 0.330.330.330.33 0.260.260.260.26 0.80.80.80.85555 0.780.780.780.78
Per share dilutedPer share dilutedPer share dilutedPer share diluted (**)(**)(**)(**) 0.20.20.20.27777 0.330.330.330.33 0.260.260.260.26 0.80.80.80.84444 0.770.770.770.77 * Adjusted EBITDA is a non-IFRS measure. Please refer to “Non-IFRS Measures” on page 45. ** Adjusted EBITDA include EBITDA attributable to the Company’s shareholders and non-controlling interest. Certain totals, subtotals and percentages may not reconcile due to rounding.
Current Quarter versus Prior-Year Quarter For the third quarter ended September 30, 2015, adjusted EBITDA increased by $0.5 million, or 3%, to $18.6 million, or $0.27 per share (basic and diluted), compared to $18.1 million, or $0.26 per share (basic and diluted), for the same period last year. Adjusted EBITDA for the third quarter ended September 30, 2015, was driven by an increase in base management fees compared to the same period last year, mainly due to positive market appreciation and additional sales and positive impact of foreign exchange fluctuations in the U.S. activities as well as the acquisition of Propel assets, combined with higher other revenues. These items were partially offset by an overall increase in operating expenses, including SG&A and external managers’ expenses due to the inclusion of the acquired Propel operations and the impact of changes in foreign exchange. Current Quarter versus Previous Quarter For the third quarter ended September 30, 2015, adjusted EBITDA decreased by $4.5 million, or 19%, to $18.6 million, or $0.27 per share (basic and diluted), compared to $23.1 million, or $0.33 per share (basic and diluted), from the previous quarter ended June 30, 2015. The decrease is mainly due to lower performance fees, namely in alternative asset classes which are generally recorded in June and December of each year. Excluding performance fees, the adjusted EBITDA margin for the third quarter ended September 30, 2015, stood at 31%, compared to 30% from the previous quarter ended June 30, 2015.

Management’s Discussion and Analysis For the Three and Nine-month Periods Ended September 30, 2015
27| Fiera Capital Corporation
Year-to-Date September 30, 2015 versus Year-to-Date September 30, 2014 For the nine-month period ended September 30, 2015, adjusted EBITDA increased by $5.6 million, or 10%, to $59.0 million, or $0.85 per share (basic) and $0.84 (diluted), compared to $53.4 million, or $0.78 per share (basic) and $0.77 (diluted), for the same period last year. The increase in adjusted EBITDA for the nine-month period ended September 30, 2015, is mainly attributable to an increase in base management fees resulting from higher average AUM mainly due to the market appreciation and positive change in foreign exchange rates, combined with higher other revenues during the period. These items were partially offset by an overall rise in operating expenses, including SG&A and external managers’ expenses, mainly due to the negative impact of the change in foreign exchange rates and the inclusion of the acquired Propel operation. Net Net Net Net Earnings Earnings Earnings Earnings Table Table Table Table 9999 ---- Net ENet ENet ENet Earnings and Aarnings and Aarnings and Aarnings and Adjusted djusted djusted djusted NNNNet et et et EEEEarningsarningsarningsarnings**** ((((in $ thousandsin $ thousandsin $ thousandsin $ thousands except per share dataexcept per share dataexcept per share dataexcept per share data))))
FOR THE FOR THE FOR THE FOR THE THREETHREETHREETHREE----MONTH PERIODSMONTH PERIODSMONTH PERIODSMONTH PERIODS ENDEDENDEDENDEDENDED FOR THE FOR THE FOR THE FOR THE NINENINENINENINE----MONTHMONTHMONTHMONTH PERIODSPERIODSPERIODSPERIODS ENDEDENDEDENDEDENDED
SEPTEMBER 30, SEPTEMBER 30, SEPTEMBER 30, SEPTEMBER 30, 2015201520152015
JUNE 30, JUNE 30, JUNE 30, JUNE 30, 2015201520152015
SEPTEMBER 30, SEPTEMBER 30, SEPTEMBER 30, SEPTEMBER 30, 2014201420142014
SEPTEMBER 30, SEPTEMBER 30, SEPTEMBER 30, SEPTEMBER 30, 2015201520152015
SEPTEMBER 30, SEPTEMBER 30, SEPTEMBER 30, SEPTEMBER 30, 2014201420142014
Net earnings attributable Net earnings attributable Net earnings attributable Net earnings attributable to the Company’s shareholdersto the Company’s shareholdersto the Company’s shareholdersto the Company’s shareholders 6,6,6,6,700700700700 7,5417,5417,5417,541 5,0535,0535,0535,053 17,17,17,17,953953953953 15,40215,40215,40215,402
Depreciation of property Depreciation of property Depreciation of property Depreciation of property andandandand equipmentequipmentequipmentequipment 487 455 343 1,384 1,122
Amortization of intangible assetsAmortization of intangible assetsAmortization of intangible assetsAmortization of intangible assets 6,709 6,619 6,411 19,950 19,045
NonNonNonNon----cash compensation itemscash compensation itemscash compensation itemscash compensation items 2,348 3,418 1,909 7,212 4,782 ChangeChangeChangeChangessss in fair value ofin fair value ofin fair value ofin fair value of derivativederivativederivativederivative financial financial financial financial
instrumentsinstrumentsinstrumentsinstruments(1)(1)(1)(1) (89) (276) 50 787 865
NonNonNonNon----cash itemscash itemscash itemscash items 9,4559,4559,4559,455 10,21610,21610,21610,216 8,7138,7138,7138,713 29,33329,33329,33329,333 25,81425,81425,81425,814
RestructuringRestructuringRestructuringRestructuring and other integrationand other integrationand other integrationand other integration costscostscostscosts(1)(1)(1)(1) 468 118 654 1,588 1,953
Acquisition costsAcquisition costsAcquisition costsAcquisition costs(1)(1)(1)(1) 1,189 187 561 2,436 1,254 Acquisition and restructuringAcquisition and restructuringAcquisition and restructuringAcquisition and restructuring and other and other and other and other integrationintegrationintegrationintegration costs costs costs costs 1,1,1,1,666657575757 305305305305 1,2151,2151,2151,215 4444,,,,024024024024 3,2073,2073,2073,207
Adjusted net earnings before incomeAdjusted net earnings before incomeAdjusted net earnings before incomeAdjusted net earnings before income taxes on abovetaxes on abovetaxes on abovetaxes on above----mentioned mentioned mentioned mentioned items items items items (1)(1)(1)(1) 17,17,17,17,812812812812 18,06218,06218,06218,062 14,98114,98114,98114,981 55551111,,,,310310310310 44,42344,42344,42344,423
Income taxes on aboveIncome taxes on aboveIncome taxes on aboveIncome taxes on above----mentionedmentionedmentionedmentioned items items items items (1)(1)(1)(1) 470
9 380 1,443 1,222 Adjusted net earnings attributable to the Adjusted net earnings attributable to the Adjusted net earnings attributable to the Adjusted net earnings attributable to the Company’s shareholdersCompany’s shareholdersCompany’s shareholdersCompany’s shareholders 11117777,,,,333342424242 18,05318,05318,05318,053 14,60114,60114,60114,601 49,86749,86749,86749,867 43,20143,20143,20143,201
Per sharePer sharePer sharePer share –––– basicbasicbasicbasic
Net earnings Net earnings Net earnings Net earnings 0.0.0.0.10101010 0.110.110.110.11 0.070.070.070.07 0.260.260.260.26 0.230.230.230.23
Adjusted net earningsAdjusted net earningsAdjusted net earningsAdjusted net earnings**** 0.20.20.20.25555 0.260.260.260.26 0.210.210.210.21 0.710.710.710.71 0.630.630.630.63
Per share Per share Per share Per share –––– diluteddiluteddiluteddiluted
Net Net Net Net eeeearningsarningsarningsarnings 0.0.0.0.10101010 0.110.110.110.11 0.070.070.070.07 0.20.20.20.26666 0.220.220.220.22
Adjusted Adjusted Adjusted Adjusted nnnnet et et et eeeearningsarningsarningsarnings 0.20.20.20.25555 0.260.260.260.26 0.210.210.210.21 0.710.710.710.71 0.620.620.620.62 *Adjusted net earnings are a non-IFRS measure. Please refer to “Non-IFRS Measures” on page 45. 1 Income tax on changes in fair value of derivative financial instruments, acquisitions and restructuring and other integration costs is estimated by using a tax rate of 30% Certain totals, subtotals and percentages may not reconcile due to rounding.
Management’s Discussion and Analysis For the Three and Nine-month Periods Ended September 30, 2015
28| Fiera Capital Corporation
Current Quarter versus Prior-Year Quarter The Firm’s net earnings attributable to the Company’s shareholders increased by 1.6 million to $6.7 million, or $0.10 per share (basic and diluted), during the third quarter ended September 30, 2015, compared to $5.1 million, or $0.07 per share (basic and diluted) for the same quarter last year. The increase in net earnings attributable to the Company’s shareholders is mainly due to the increase of $7.8 million in revenues, combined with the accretion and change in fair value of purchase price obligations of $2 million during the period, which were partially offset by increases of $8.0 million in SG&A, $0.4 million in depreciation and amortization expenses and $0.4 million in acquisition and restructuring costs. Current Quarter versus Previous Quarter For the third quarter ended September 30, 2015, the Firm recorded net earnings attributable to the Company’s shareholders of $6.7 million, or $0.10 per share (basic and diluted), compared to $7.5 million, or $0.11 per share (basic and diluted), for the previous quarter ended June 30, 2015. The decrease in net earnings attributable to the Company’s shareholders is mainly due to lower revenue resulting from lower performance fees from the alternative asset class, which are generally recorded in June and December of each year. The decrease in performance fees was partially offset by higher base management fees and other revenues, combined with a decrease in SG&A due to lower variable compensations during the period. Year-to-Date September 30, 2015 versus Year-to-Date September 30, 2014
For the nine-month period ended September 30, 2015, the Firm recorded net earnings attributable to the Company’s shareholders of $18.0 million, or $0.26 per share (basic and diluted), compared to $15.4 million, or $0.23 per share (basic) and $0.22 (diluted) for the same period last year. The increase in net earnings attributable to the Company’s shareholders is mainly due to a $22.0 million increase in base management fees and a $3.8 million increase in performance fees, combined with a $2.2 million decrease in accretion and change in fair value of purchase price obligation. These elements were partially offset by increases of $23.2 million, $1.2 million, 0.9 million and $0.8 million in SG&A and external managers’ expenses, depreciation and amortization costs, and interest on long-term debt and restructuring and other integration costs, respectively. Also, the needed costs related to the set-up of the U.S. platform will generate benefits in the upcoming quarters. Adjusted Net EarningsAdjusted Net EarningsAdjusted Net EarningsAdjusted Net Earnings The Firm selects adjusted net earnings as one of the key non-IFRS performance measures as it is a good indicator of the Firm’s ability to generate cash flows. Adjusted net earnings are calculated as the sum of net earnings (loss) attributable to the Company’s shareholders, non-cash items, including depreciation of property and equipment, amortization of intangible assets, after-tax changes in fair value of derivative financial instruments, after-tax impairment of non-financial assets, after-tax acquisition and restructuring and other integration costs and non-cash compensation items. Current Quarter versus Prior-Year Quarter During the third quarter ended September 30, 2015, $9.5 million of non-cash items, net of income taxes on the changes in fair value of derivative financial instruments ($9.5 million before taxes), or $0.13 per share (basic and diluted), as well as $1.2 million, or $0.02 per share (basic and diluted), of acquisition and restructuring and other integration costs, net of income taxes ($1.7 million before taxes) had an unfavourable impact on the net earnings attributable to the Company’s shareholders. Excluding these items, adjusted net earnings attributable to the Company’s shareholders amounted to $17.3 million, or $0.25 per share (basic and diluted) for the third quarter ended September 30, 2015.

Management’s Discussion and Analysis For the Three and Nine-month Periods Ended September 30, 2015
29| Fiera Capital Corporation
During the third quarter ended September 30, 2014, $8.7 million of non-cash items, net of income taxes on the changes in fair value of derivative financial instruments ($8.7 million before taxes), or $0.13 per share (basic and diluted), as well as $0.8 million, or $0.01 per share (basic and diluted), of acquisition and restructuring and other integration costs, net of income taxes ($1.2 million before taxes) had an unfavourable impact on the net earnings attributable to the Company’s shareholders. Excluding these items, adjusted net earnings attributable to the Company’s shareholders amounted to $14.6 million, or $0.21 per share (basic and diluted) for the third quarter ended September 30, 2014. Current Quarter versus Previous Quarter During the previous quarter ended June 30, 2015, $10.3 million of non-cash items, net of income taxes on the changes in fair value of derivative financial instruments ($10.2 million before taxes), or $0.15 per share (basic and diluted), as well as $0.2 million, or nil per share (basic and diluted), of acquisition and restructuring and other integration costs, net of income taxes ($0.3 million before taxes) had an unfavourable impact on the net earnings attributable to the Company’s shareholders. Excluding these items, adjusted net earnings attributable to the Company’s shareholders amounted to $18.1 million, or $0.26 per share (basic and diluted) for the second quarter ended June 30, 2015, compared to adjusted net earnings attributable to the Company’s shareholders of $17.3 million or $0.25 per share (basic and diluted) for the third quarter ended September 30, 2015. Year-to-Date September 30, 2015 versus Year-to-Date September 30, 2014 For the nine-month period ended September 30, 2015, $27.5 million of non-cash items, net of income taxes on the changes in fair value of derivative financial instruments and impairment of non-financial assets ($29.3 million before taxes), or $0.39 per share (basic and diluted), as well as $2.8 million, or $0.04 per share (basic and diluted), of acquisition and restructuring and other integration costs, net of income taxes ($4.0 million before taxes) had an unfavourable impact on the net earnings attributable to the Company’s shareholders. Excluding these items, adjusted net earnings attributable to the Company’s shareholders amounted to $48.2 million, or $0.69 per share (basic and diluted) for the nine-month period ended September 30, 2015, compared to $43.2 million or $0.63 per share (basic) and $0.62 (diluted) for the same period last year.

Management’s Discussion and Analysis For the Three and Nine-month Periods Ended September 30, 2015
30| Fiera Capital Corporation
SSSSUMMARY OF UMMARY OF UMMARY OF UMMARY OF QQQQUARTERLY UARTERLY UARTERLY UARTERLY RRRRESULTSESULTSESULTSESULTS The Firm’s AUM, total revenues, adjusted EBITDA and net earnings, on a consolidated basis and including per share amounts, for each of the Firm’s most recently completed eight quarterly periods and the last twelve months are as follows: Table Table Table Table 10101010 –––– Quarterly Results (Quarterly Results (Quarterly Results (Quarterly Results (in $ thousandsin $ thousandsin $ thousandsin $ thousands except AUM except AUM except AUM except AUM in $ in $ in $ in $ millionsmillionsmillionsmillions and per share dataand per share dataand per share dataand per share data))))
Last Last Last Last
Twelve Twelve Twelve Twelve Months Months Months Months (3)(3)(3)(3)
Q3Q3Q3Q3 SepSepSepSep. 3. 3. 3. 30000
Q2Q2Q2Q2 JunJunJunJun. 3. 3. 3. 30000
Q1Q1Q1Q1 MarMarMarMar. 3. 3. 3. 31111
Q4Q4Q4Q4 DecDecDecDec. 3. 3. 3. 31111
Q3Q3Q3Q3 SepSepSepSep. 3. 3. 3. 30000
Q2Q2Q2Q2 JunJunJunJun. 3. 3. 3. 30000
Q1Q1Q1Q1 MarMarMarMar. 3. 3. 3. 31111
Q4Q4Q4Q4 DecDecDecDec. 3. 3. 3. 31111
2012012012015555 2012012012015555 2012012012015555 2012012012014444 2012012012014444 2012012012014444 2012012012014444 2013201320132013
AUMAUMAUMAUM 89,14789,14789,14789,147 88,75988,75988,75988,759 90,290,290,290,291919191 90,92790,92790,92790,927 86,61286,61286,61286,612 84,87584,87584,87584,875 82,82,82,82,131131131131 80,41280,41280,41280,412 77,48577,48577,48577,485
Total Total Total Total rrrrevenueevenueevenueevenuessss 248,722248,722248,722248,722 60,21460,21460,21460,214 66,14366,14366,14366,143 58,06158,06158,06158,061 64,30464,30464,30464,304 52,37152,37152,37152,371 55,72055,72055,72055,720 49,49,49,49,963963963963 55,22255,22255,22255,222
Adjusted EBITDA Adjusted EBITDA Adjusted EBITDA Adjusted EBITDA (1)(1)(1)(1) 88883333,8,8,8,884848484 11118888,,,,608608608608 23,05023,05023,05023,050 17,36617,36617,36617,366 24,82024,82024,82024,820 18,08518,08518,08518,085 20,19120,19120,19120,191 15,12715,12715,12715,127 22,94122,94122,94122,941
Adjusted EBITDA Adjusted EBITDA Adjusted EBITDA Adjusted EBITDA mmmmarginarginarginargin 33.33.33.33.7777%%%% 33330.0.0.0.9999%%%% 34.8%34.8%34.8%34.8% 29.9%29.9%29.9%29.9% 38.6%38.6%38.6%38.6% 34.5%34.5%34.5%34.5% 36.2%36.2%36.2%36.2% 30.3%30.3%30.3%30.3% 41.5%41.5%41.5%41.5% Net Net Net Net eeeearnings arnings arnings arnings attributable to attributable to attributable to attributable to
Company’s shareholdersCompany’s shareholdersCompany’s shareholdersCompany’s shareholders 30303030,,,,043043043043 6,6,6,6,700700700700 7,5417,5417,5417,541 3,7123,7123,7123,712 12,09012,09012,09012,090 5,0535,0535,0535,053 7,7,7,7,671671671671 2,6782,6782,6782,678 8,4818,4818,4818,481
PER SHAREPER SHAREPER SHAREPER SHARE –––– BASICBASICBASICBASIC
Adjusted EBITDAAdjusted EBITDAAdjusted EBITDAAdjusted EBITDA (2)(2)(2)(2) 1.1.1.1.21212121 0.20.20.20.27777 0.330.330.330.33 0.250.250.250.25 0.360.360.360.36 0.260.260.260.26 0.0.0.0.30303030 0.20.20.20.22222 0.360.360.360.36
NNNNet et et et eeeearnings arnings arnings arnings attributable to attributable to attributable to attributable to the Company’s the Company’s the Company’s the Company’s shareholdersshareholdersshareholdersshareholders 0.40.40.40.44444 0.0.0.0.10101010 0.110.110.110.11 0.050.050.050.05 0.180.180.180.18 0.070.070.070.07 0.110.110.110.11 0.040.040.040.04 0.130.130.130.13
Adjusted Adjusted Adjusted Adjusted nnnnet et et et eeeearningsarningsarningsarnings attributable to the attributable to the attributable to the attributable to the Company’s shareholders Company’s shareholders Company’s shareholders Company’s shareholders (1)(1)(1)(1) 1.01.01.01.06666 0.20.20.20.25555 0.260.260.260.26 0.210.210.210.21 0.340.340.340.34 0.210.210.210.21 0.230.230.230.23 0.10.10.10.18888 0.280.280.280.28
PER SHAREPER SHAREPER SHAREPER SHARE –––– DILUTEDDILUTEDDILUTEDDILUTED
Adjusted EBITDAAdjusted EBITDAAdjusted EBITDAAdjusted EBITDA (2)(2)(2)(2) 1.1.1.1.20202020 0.20.20.20.27777 0.330.330.330.33 0.250.250.250.25 0.350.350.350.35 0.260.260.260.26 0.290.290.290.29 0.20.20.20.22222 0.350.350.350.35
NNNNet et et et eeeearnings arnings arnings arnings attributable to attributable to attributable to attributable to the Company’s shareholdersthe Company’s shareholdersthe Company’s shareholdersthe Company’s shareholders 0.40.40.40.44444 0.0.0.0.10101010 0.110.110.110.11 0.050.050.050.05 0.180.180.180.18 0.070.070.070.07 0.110.110.110.11 0.040.040.040.04 0.130.130.130.13
Adjusted Adjusted Adjusted Adjusted nnnnet et et et eeeearningsarningsarningsarnings attributable to the attributable to the attributable to the attributable to the Company’s shareholders Company’s shareholders Company’s shareholders Company’s shareholders (1)(1)(1)(1) 1.01.01.01.06666 0.20.20.20.25555 0.260.260.260.26 0.210.210.210.21 0.340.340.340.34 0.210.210.210.21 0.230.230.230.23 0.180.180.180.18 0.270.270.270.27
PER SHAREPER SHAREPER SHAREPER SHARE –––– DILUTED DILUTED DILUTED DILUTED
(Including non(Including non(Including non(Including non----cash cash cash cash compensation and options compensation and options compensation and options compensation and options granted)granted)granted)granted) ((((2222))))
Adjusted EBITDAAdjusted EBITDAAdjusted EBITDAAdjusted EBITDA (1)(1)(1)(1) 1.11.11.11.11111 0.20.20.20.25555 0.300.300.300.30 0.230.230.230.23 0.330.330.330.33 0.240.240.240.24 0.20.20.20.28888 0.20.20.20.20000 0.330.330.330.33
NNNNet et et et eeeearningsarningsarningsarnings attributable to attributable to attributable to attributable to the Company’s shareholdersthe Company’s shareholdersthe Company’s shareholdersthe Company’s shareholders 0.0.0.0.40404040 0.090.090.090.09 0.100.100.100.10 0.050.050.050.05 0.160.160.160.16 0.070.070.070.07 0.100.100.100.10 0.040.040.040.04 0.120.120.120.12
Adjusted Adjusted Adjusted Adjusted nnnnet et et et eeeearningsarningsarningsarnings attributable to the attributable to the attributable to the attributable to the Company’s shareholders Company’s shareholders Company’s shareholders Company’s shareholders (1)(1)(1)(1) 0.90.90.90.97777 0.20.20.20.23333 0.240.240.240.24 0.190.190.190.19 0.310.310.310.31 0.200.200.200.20 0.220.220.220.22 0.10.10.10.17777 0.260.260.260.26
(1) Adjusted EBITDA and Adjusted net earnings are non-IFRS measures. Please refer to “Non-IFRS Measures” on page 45. (2) This analysis assumes that all outstanding stock-based awards will vest and will be settled with shares of the Company (including 2,989,475 share options; 1,709,378 PSUs and 680,503 RSUs as at September 30, 2015. Per share measures as at September 30, 2013 and before were restated for calculation consistency.
(3) Last Twelve Months (“LTM’’) represents the sum of the last four quarters, except for AUM, which are average of last four quarters.
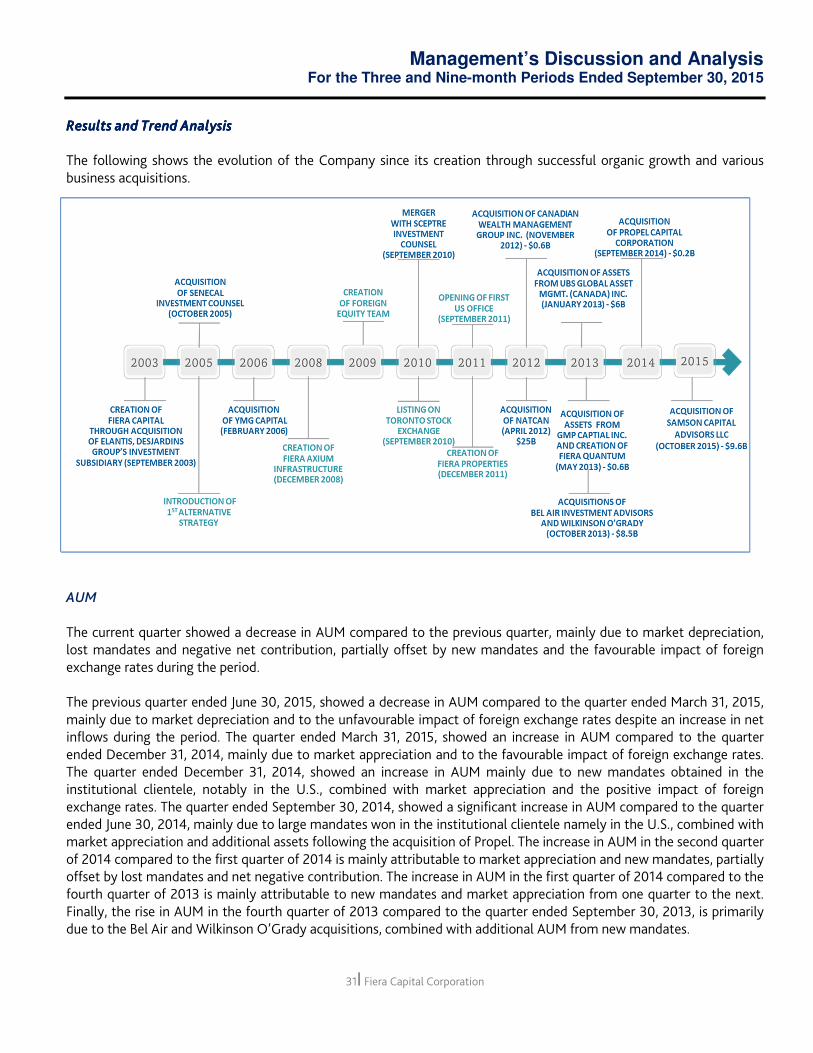
Management’s Discussion and Analysis For the Three and Nine-month Periods Ended September 30, 2015
31| Fiera Capital Corporation
Results and Results and Results and Results and TTTTrend rend rend rend AAAAnalysisnalysisnalysisnalysis The following shows the evolution of the Company since its creation through successful organic growth and various business acquisitions.
AUM The current quarter showed a decrease in AUM compared to the previous quarter, mainly due to market depreciation, lost mandates and negative net contribution, partially offset by new mandates and the favourable impact of foreign exchange rates during the period. The previous quarter ended June 30, 2015, showed a decrease in AUM compared to the quarter ended March 31, 2015, mainly due to market depreciation and to the unfavourable impact of foreign exchange rates despite an increase in net inflows during the period. The quarter ended March 31, 2015, showed an increase in AUM compared to the quarter ended December 31, 2014, mainly due to market appreciation and to the favourable impact of foreign exchange rates. The quarter ended December 31, 2014, showed an increase in AUM mainly due to new mandates obtained in the institutional clientele, notably in the U.S., combined with market appreciation and the positive impact of foreign exchange rates. The quarter ended September 30, 2014, showed a significant increase in AUM compared to the quarter ended June 30, 2014, mainly due to large mandates won in the institutional clientele namely in the U.S., combined with market appreciation and additional assets following the acquisition of Propel. The increase in AUM in the second quarter of 2014 compared to the first quarter of 2014 is mainly attributable to market appreciation and new mandates, partially offset by lost mandates and net negative contribution. The increase in AUM in the first quarter of 2014 compared to the fourth quarter of 2013 is mainly attributable to new mandates and market appreciation from one quarter to the next. Finally, the rise in AUM in the fourth quarter of 2013 compared to the quarter ended September 30, 2013, is primarily due to the Bel Air and Wilkinson O’Grady acquisitions, combined with additional AUM from new mandates.
Management’s Discussion and Analysis For the Three and Nine-month Periods Ended September 30, 2015
32| Fiera Capital Corporation
Revenues Since the acquisition of Bel Air and Wilkinson O’Grady in late 2013, the Firm’s revenue stream is balanced between the institutional, retail and private wealth clientele and has been constantly progressing. Also, revenue from the U.S. Institutional segment is positively increasing, fueled by new mandates. The current quarter showed an increase in base management fees compared to the previous quarter mainly as a result of new mandates from the U.S. funded toward the end of the previous quarter, for which revenues are recognized during the current quarter, while performance fees were lower due to the fact that they are generally recorded in June and December of each year. The previous quarter ended June 30, 2015, showed an increase in performance fees from the alternative asset class, which are generally recorded in June and December of each year. The quarter ended March 31, 2015, showed an increase in base management fees compared to the fourth quarter of 2014 as a result of higher AUM base. The previous quarter ended December 31, 2014, showed a significant increase in revenues mainly due to the inclusion of performance fees from both traditional and alternative asset classes which are generally recorded in June and December of each year. Also, revenue from base management fees in the fourth quarter of 2014 were higher than those in the third quarter of 2014, this was mainly attributable to a higher AUM base resulting from new mandates won during the period. The third quarter ended September 30, 2014, showed an increase in base management fees compared to the quarter ended June 30, 2014. Performance fees were lower in the third quarter of 2014 compared to the second quarter of 2014 due to the fact that they are generally recorded in June and December of each year. The increase in revenues in the second quarter of 2014 compared to the first quarter of 2014 is mainly attributable to the increase in base management and performance fees in the alternative asset class. The previous quarter ended March 31, 2014, was characterized by an increase in base management fees and other revenue resulting from a full quarter of Bel Air and Wilkinson O’Grady operations and net additional AUM, combined with market appreciation. Finally, during the quarter ended December 31, 2013, revenues increased due to the inclusion of Bel Air and Wilkinson O’Grady operations, combined with higher performance fees in both traditional and alternative asset classes, which are generally earned in the fourth quarter of each year. Adjusted EBITDA Adjusted EBITDA has been on an increasing trend over the last eight quarters. Adjusted EBITDA decreased in the third quarter of 2015 compared to the second quarter of 2015, mainly due to lower performance fees in the alternative asset class, which are generally recorded in June and December of each year. Adjusted EBITDA increased in the second quarter of 2015 compared to the first quarter of 2015, mainly due to higher performance fees from the alternative asset class, which are generally recorded in June and December of each year, partially offset by higher SG&A expenses namely related to variable compensation. Adjusted EBITDA decreased in the first quarter of 2015 compared to the fourth quarter of 2014, mainly due to lower performance fees which are generally recorded in June and December of each year, despite the fact that base management fees were higher and SG&A stayed at the same level compared to those from the fourth quarter of 2014. Adjusted EBITDA increased in the fourth quarter of 2014 compared to those in the third quarter of 2014, mainly due to higher performance fees which are generally recorded in December of each year, combined with higher base management fee revenues, partially offset by higher SG&A expenses. Adjusted EBITDA decreased in the third quarter of 2014 compared to the second quarter of 2014, mainly due to lower performance fees in the alternative asset class, which are generally recorded in June and December of each year.

Management’s Discussion and Analysis For the Three and Nine-month Periods Ended September 30, 2015
33| Fiera Capital Corporation
Adjusted EBITDA increased in the second quarter of 2014 compared to the first quarter of 2014, mainly due to higher base management and performance fees, combined with lower SG&A expenses, particularly relating to variable compensation. The first quarter ended March 31, 2014, showed a decrease in adjusted EBITDA compared to the previous quarter, mainly due to lower performance fees and higher SG&A expenses. The increase in SG&A is mainly due to the inclusion of a full quarter of Bel Air and Wilkinson O’Grady operations, combined with higher performance-based investment manager compensation. The previous quarter ended December 31, 2013, was positively impacted by additional AUM base revenues resulting from the Bel Air and Wilkinson O’Grady acquisitions, as well as by higher performance fees which are generally recognized in the quarter ending in December of each year. Adjusted EBITDA Margin Adjusted EBITDA margin relates adjusted EBITDA to revenues. It is an important measure of overall operating performance because it measures Company profitability from operations. Adjusted EBITDA margin has fluctuated from a low of 29.9% to a high of 41.5% during the most recent eight quarters. The quarters following the Natcan Investment Management Inc. (“Natcan”) acquisition in 2012 have shown an adjusted EBITDA margin ranging from 36.8% to 41.1% due to higher revenues and cost savings from post-acquisition synergies. The quarters ended December 31, 2012 and 2013, had a high adjusted EBITDA margin, approximately 41%, due to high performance fees which are generally earned in the fourth quarter of each year. The quarter ended June 30, 2014, had an adjusted EBITDA margin of 36.2% mainly due to higher base management fees, higher performance fees in the alternative asset class, combined with lower SG&A expenses, particularly related to variable compensation, compared to those from the quarter ended March 31, 2014. The third quarter ended September 30, 2014, had an adjusted EBITDA margin of 34.5%, a lower level compared to the previous quarter, mainly due to lower performance fees in the alternative asset class, which are generally recorded in June and December of each year. The quarter ended December 31, 2014, had an adjusted EBITDA margin of 38.6%, a higher level compared to the previous quarter, mainly attributable to higher performance fees which are generally recorded in December of each year, combined with higher base management fees as a result of higher base AUM. The quarter ended March 31, 2015, showed an adjusted EBITDA margin of 29.9% mainly due to lower performance fees compared to the fourth quarter ended December 31, 2014. The previous quarter ended June 30, 2015, showed an adjusted EBITDA margin of 34.8% mainly due to higher performance fees from the alternative asset class compared to the first quarter of 2015. The current quarter showed an adjusted EBITDA margin of 30.3% mainly due to lower performance fees compared to the previous quarter. Excluding performance fees, Adjusted EBITDA margin for the third quarter ended September 30, 2015, stood at 31.3%, compared to 30.2% from the second quarter ended June 30, 2015, and to 34.5% for the third quarter ended September 30, 2014. Also, the upfront set-up costs of the U.S. platform initiative and other costs associated with building scale will generate benefits in the upcoming quarters. On a twelve-month basis, the current LTM adjusted EBITDA margin was at 33.7%, which compares to the LTM adjusted EBITDA margin of 34.6% and 34.9% reported as at June 30, 2015, and March 31, 2015, respectively. The LTM adjusted EBITDA margin neutralizes the impact of the timing of performance fees which are generally recorded in the second and the fourth quarter of each year, as well as the rise in SG&A expenses in recent quarters resulting from various acquisitions and provides a better measure of the Firm’s overall performance. Net Earnings Attributable to the Company’s Shareholders Net earnings attributable to the Company’s shareholders have fluctuated from a low of $2.7 million to a high of $12.1 million over the last eight quarters. Net earnings attributable to the Company’s shareholders were impacted by various initiatives resulting in higher SG&A expenses, acquisitions and restructuring and other integration costs. Also,
Management’s Discussion and Analysis For the Three and Nine-month Periods Ended September 30, 2015
34| Fiera Capital Corporation
performance fees generally recorded in the second quarter and the fourth quarter of each year contributed to the fluctuation of the net earnings attributable to the Company’s shareholders. The current quarter’s net earnings attributable to the Company’s shareholders were lower than those of the previous quarter ended June 30, 2015, mainly due to lower performance fees from the alternative asset class. Adjusted Net Earnings Attributable to the Company’s Shareholders Adjusted net earnings attributable to the Company’s shareholders per share are a good performance indicator of the Company’s ability to generate cash flows. Adjusted net earnings attributable to the Company’s shareholders have fluctuated from a low of $0.18 per share (basic and diluted) to a high of $0.34 per share (basic and diluted) over the last eight quarters. The quarter ended December 31, 2013, closed with adjusted net earnings attributable to the Company’s shareholders of $0.28 per share (basic) and $0.27 per share (diluted), mainly due to higher base management fees combined with higher performance fees in the traditional and alternative asset classes recorded in the fourth quarter of 2013, compared to those from the quarter ended September 30, 2013. During the first quarter of 2014 and the second quarter ended June 30, 2014, the Company recorded adjusted net earnings attributable to the Company’s shareholders of $0.18 and $0.23 per share (basic and diluted), respectively. The fourth quarter of 2014 showed a high level of adjusted net earnings attributable to the Company’s shareholders of $0.34 per share (basic and diluted), mainly due to higher performance fees recorded during the quarter. For the first quarter of 2015, the Firm recorded net earnings attributable to the Company’s shareholders of $0.21 per share (basic and diluted), a level lower than that of the fourth quarter of 2014, mainly due to lower performance fees, partially offset by higher base management fees recorded during the quarter. For the current quarter ended September 30, 2015, adjusted net earnings attributable to the Company’s shareholders were $0.25 per share (basic and diluted), representing a slight decrease from the previous quarter resulting mainly from lower performance fees from the alternative asset class, compared to $0.26 per share (basic and diluted) recorded for the second quarter ended June 30, 2015. LLLLIQUIDITYIQUIDITYIQUIDITYIQUIDITY AND AND AND AND CCCCAPITAL APITAL APITAL APITAL RRRRESOURCESESOURCESESOURCESESOURCES Cash FCash FCash FCash Flowslowslowslows The ability to consistently generate free cash flows from operations in excess of dividend payments, share repurchases, capital expenditures, and ongoing operating expenses remains one of the Company’s fundamental financial goals. The Firm’s principal uses of cash, other than for operating expenses, include (but are not limited to) dividend payments, debt repayments, capital expenditures, business acquisitions and stock buy-backs. The following table provides additional cash flows information for Fiera Capital.
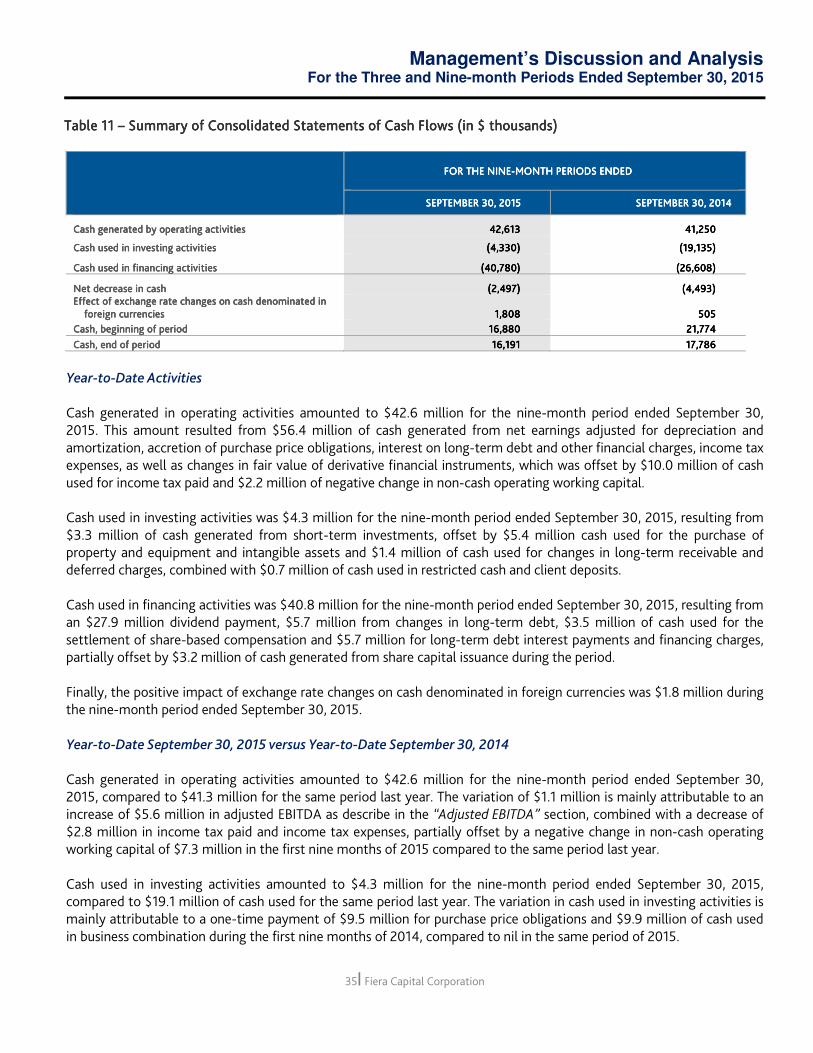
Management’s Discussion and Analysis For the Three and Nine-month Periods Ended September 30, 2015
35| Fiera Capital Corporation
Table Table Table Table 11111111 –––– Summary of Consolidated Statements of Cash FlowsSummary of Consolidated Statements of Cash FlowsSummary of Consolidated Statements of Cash FlowsSummary of Consolidated Statements of Cash Flows ((((in $ thousandsin $ thousandsin $ thousandsin $ thousands))))
FOR THEFOR THEFOR THEFOR THE NINENINENINENINE----MONTHMONTHMONTHMONTH PERIODSPERIODSPERIODSPERIODS ENDEDENDEDENDEDENDED
SEPTEMBER 30, 2015SEPTEMBER 30, 2015SEPTEMBER 30, 2015SEPTEMBER 30, 2015 SEPTEMBER 30, 2014SEPTEMBER 30, 2014SEPTEMBER 30, 2014SEPTEMBER 30, 2014
Cash Cash Cash Cash generated bygenerated bygenerated bygenerated by operating activitiesoperating activitiesoperating activitiesoperating activities 42,61342,61342,61342,613 41,25041,25041,25041,250
Cash used in investing activities Cash used in investing activities Cash used in investing activities Cash used in investing activities (4,330)(4,330)(4,330)(4,330) (19,135)(19,135)(19,135)(19,135)
Cash Cash Cash Cash used inused inused inused in financing activitiesfinancing activitiesfinancing activitiesfinancing activities (40,780)(40,780)(40,780)(40,780) (26,608)(26,608)(26,608)(26,608)
Net dNet dNet dNet decreaseecreaseecreaseecrease in cash in cash in cash in cash (2,497)(2,497)(2,497)(2,497) (4,493)(4,493)(4,493)(4,493) Effect of exchange rate changes on cash denominatedEffect of exchange rate changes on cash denominatedEffect of exchange rate changes on cash denominatedEffect of exchange rate changes on cash denominated in in in in
foreign currenciesforeign currenciesforeign currenciesforeign currencies 1,8081,8081,8081,808 505505505505
Cash, beginning of periodCash, beginning of periodCash, beginning of periodCash, beginning of period 16,88016,88016,88016,880 21,77421,77421,77421,774
Cash, end of periodCash, end of periodCash, end of periodCash, end of period 16,19116,19116,19116,191 17,78617,78617,78617,786
Year-to-Date Activities Cash generated in operating activities amounted to $42.6 million for the nine-month period ended September 30, 2015. This amount resulted from $56.4 million of cash generated from net earnings adjusted for depreciation and amortization, accretion of purchase price obligations, interest on long-term debt and other financial charges, income tax expenses, as well as changes in fair value of derivative financial instruments, which was offset by $10.0 million of cash used for income tax paid and $2.2 million of negative change in non-cash operating working capital. Cash used in investing activities was $4.3 million for the nine-month period ended September 30, 2015, resulting from $3.3 million of cash generated from short-term investments, offset by $5.4 million cash used for the purchase of property and equipment and intangible assets and $1.4 million of cash used for changes in long-term receivable and deferred charges, combined with $0.7 million of cash used in restricted cash and client deposits. Cash used in financing activities was $40.8 million for the nine-month period ended September 30, 2015, resulting from an $27.9 million dividend payment, $5.7 million from changes in long-term debt, $3.5 million of cash used for the settlement of share-based compensation and $5.7 million for long-term debt interest payments and financing charges, partially offset by $3.2 million of cash generated from share capital issuance during the period. Finally, the positive impact of exchange rate changes on cash denominated in foreign currencies was $1.8 million during the nine-month period ended September 30, 2015. Year-to-Date September 30, 2015 versus Year-to-Date September 30, 2014 Cash generated in operating activities amounted to $42.6 million for the nine-month period ended September 30, 2015, compared to $41.3 million for the same period last year. The variation of $1.1 million is mainly attributable to an increase of $5.6 million in adjusted EBITDA as describe in the “Adjusted EBITDA” section, combined with a decrease of $2.8 million in income tax paid and income tax expenses, partially offset by a negative change in non-cash operating working capital of $7.3 million in the first nine months of 2015 compared to the same period last year. Cash used in investing activities amounted to $4.3 million for the nine-month period ended September 30, 2015, compared to $19.1 million of cash used for the same period last year. The variation in cash used in investing activities is mainly attributable to a one-time payment of $9.5 million for purchase price obligations and $9.9 million of cash used in business combination during the first nine months of 2014, compared to nil in the same period of 2015.

Management’s Discussion and Analysis For the Three and Nine-month Periods Ended September 30, 2015
36| Fiera Capital Corporation
Cash used in financing activities was $40.8 million for the nine-month period ended September 30, 2015, compared to $26.6 million of cash used in financing activities for the same period last year. The year-over-year variation is mainly attributable to higher cash used of $3.5 million for settlement of share based compensation, higher long-term debt of $5.7 million, combined with higher dividend paid of $4.8 million and higher financing charges of $1.1 million. This increase in cash used in financing activities was partially offset by an increase of $0.8 million of cash generated from the issuance of share capital. Cash EarningsCash EarningsCash EarningsCash Earnings (*)(*)(*)(*) The Company defines cash earnings as net earnings attributable to the Company’s shareholders, adjusted for depreciation and amortization, changes in fair value of derivative financial instruments and non-cash compensation items. Cash earnings are an indicator of our ability to pay out dividends, to continue operations, and to invest in new businesses. We believe that cash earnings are an important measure used to assess our core operating performance. The following table provides details of the Firm’s cash earnings and cash earnings per share for the nine-month periods ended September 30, 2015 and 2014, respectively.
Table Table Table Table 12121212 –––– Cash Earnings and Cash Earnings per Share Cash Earnings and Cash Earnings per Share Cash Earnings and Cash Earnings per Share Cash Earnings and Cash Earnings per Share ((((in $ thousandsin $ thousandsin $ thousandsin $ thousands))))
FOR THE FOR THE FOR THE FOR THE NINENINENINENINE----MONTHMONTHMONTHMONTH PERIODSPERIODSPERIODSPERIODS ENDEDENDEDENDEDENDED
SEPTEMBER 30, 2015SEPTEMBER 30, 2015SEPTEMBER 30, 2015SEPTEMBER 30, 2015 SEPTEMBER SEPTEMBER SEPTEMBER SEPTEMBER 30, 201430, 201430, 201430, 2014
Net earnings attributable to the Company’s shareholdersNet earnings attributable to the Company’s shareholdersNet earnings attributable to the Company’s shareholdersNet earnings attributable to the Company’s shareholders 17,17,17,17,953953953953 15,40215,40215,40215,402
Adjusted for the following items:Adjusted for the following items:Adjusted for the following items:Adjusted for the following items:
Depreciation of property Depreciation of property Depreciation of property Depreciation of property andandandand equipmentequipmentequipmentequipment 1,3841,3841,3841,384 1,1221,1221,1221,122
Amortization of intangible assetsAmortization of intangible assetsAmortization of intangible assetsAmortization of intangible assets 19,95019,95019,95019,950 19,04519,04519,04519,045
NonNonNonNon----cash compensation cash compensation cash compensation cash compensation 7,2127,2127,2127,212 4,7824,7824,7824,782
ChangeChangeChangeChangessss in fair value of derivative financial instrumentsin fair value of derivative financial instrumentsin fair value of derivative financial instrumentsin fair value of derivative financial instruments 787787787787 865865865865
Cash earningsCash earningsCash earningsCash earnings attributable to the Company’s shareholdersattributable to the Company’s shareholdersattributable to the Company’s shareholdersattributable to the Company’s shareholders 47,47,47,47,286286286286 41,21641,21641,21641,216
Cash earnings per share (basic)Cash earnings per share (basic)Cash earnings per share (basic)Cash earnings per share (basic) 0.680.680.680.68 0.600.600.600.60
Cash earnings per share (diluted)Cash earnings per share (diluted)Cash earnings per share (diluted)Cash earnings per share (diluted) 0.670.670.670.67 0.590.590.590.59
(*) Cash earnings and cash earnings per share are non-IFRS measures. Please refer to “Non-IFRS Measures” on page 45. Certain totals, subtotals and percentages may not reconcile due to rounding.
For the nine-month period ended September 30, 2015, $21.3 million of depreciation of property and equipment, and amortization of intangible assets, as well as $8.0 million of non-cash compensation, impairment of non-financial assets and change in fair value of derivative financial instruments had an unfavourable impact on the cash earnings of the Company, compared to $20.2 million and $5.6 million for the same period last year, respectively. When added back to the Firm’s net earnings attributable to the Company’s shareholders of $18.0 million, or $0.26 per share (basic and diluted), cash earnings attributable to the Company’s shareholders amounted to $47.3 million, or $0.68 per share (basic) and $0.67 (diluted) for the nine-month period ended September 30, 2015, compared to $41.2 million or $0.60 per share (basic) and $0.59 (diluted) for the same period last year.
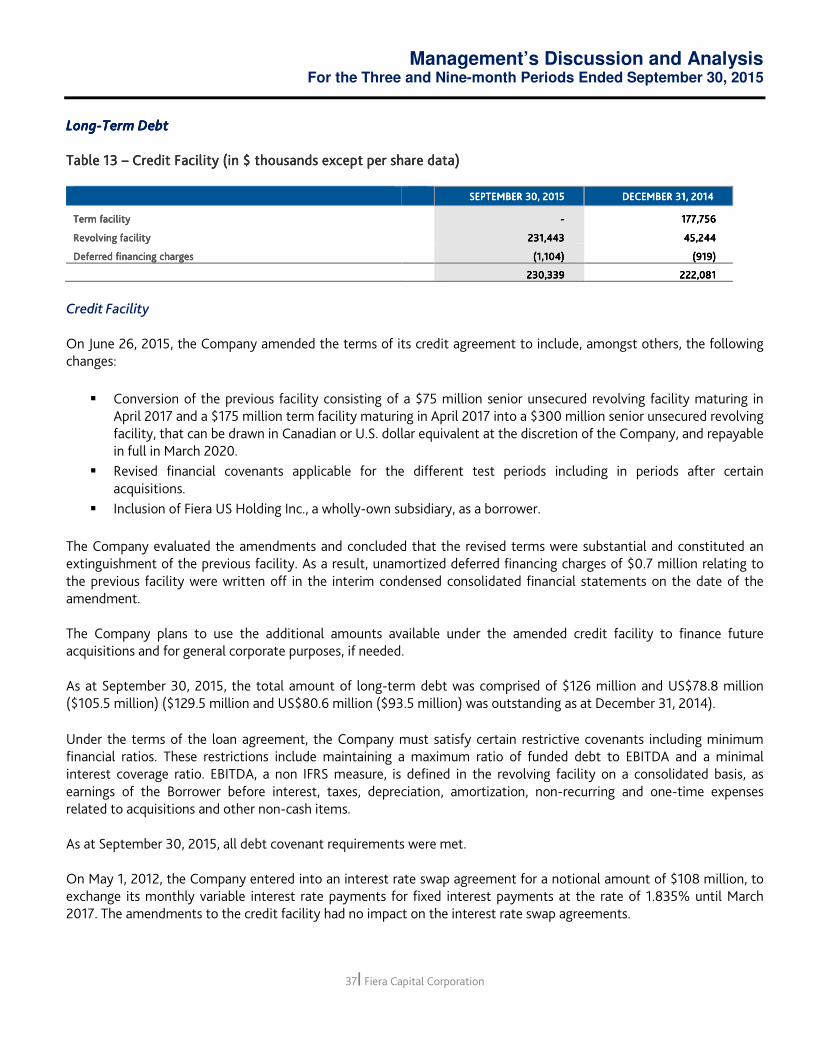
Management’s Discussion and Analysis For the Three and Nine-month Periods Ended September 30, 2015
37| Fiera Capital Corporation
LongLongLongLong----TTTTerm Debterm Debterm Debterm Debt Table 1Table 1Table 1Table 13333 –––– CCCCredit Facilitredit Facilitredit Facilitredit Facilityyyy ((((in $ thousands except per share datain $ thousands except per share datain $ thousands except per share datain $ thousands except per share data))))
SEPTEMBER 30, 2015SEPTEMBER 30, 2015SEPTEMBER 30, 2015SEPTEMBER 30, 2015 DECEMBERDECEMBERDECEMBERDECEMBER 31, 20131, 20131, 20131, 2014444
Term facilityTerm facilityTerm facilityTerm facility ---- 177,756177,756177,756177,756
Revolving facility Revolving facility Revolving facility Revolving facility 231,443231,443231,443231,443 45,24445,24445,24445,244
Deferred financing chargesDeferred financing chargesDeferred financing chargesDeferred financing charges (1,104)(1,104)(1,104)(1,104) (919)(919)(919)(919)
230,339230,339230,339230,339 222,081222,081222,081222,081
Credit Facility On June 26, 2015, the Company amended the terms of its credit agreement to include, amongst others, the following changes:
� Conversion of the previous facility consisting of a $75 million senior unsecured revolving facility maturing in April 2017 and a $175 million term facility maturing in April 2017 into a $300 million senior unsecured revolving facility, that can be drawn in Canadian or U.S. dollar equivalent at the discretion of the Company, and repayable in full in March 2020.
� Revised financial covenants applicable for the different test periods including in periods after certain acquisitions.
� Inclusion of Fiera US Holding Inc., a wholly-own subsidiary, as a borrower.
The Company evaluated the amendments and concluded that the revised terms were substantial and constituted an extinguishment of the previous facility. As a result, unamortized deferred financing charges of $0.7 million relating to the previous facility were written off in the interim condensed consolidated financial statements on the date of the amendment. The Company plans to use the additional amounts available under the amended credit facility to finance future acquisitions and for general corporate purposes, if needed. As at September 30, 2015, the total amount of long-term debt was comprised of $126 million and US$78.8 million ($105.5 million) ($129.5 million and US$80.6 million ($93.5 million) was outstanding as at December 31, 2014). Under the terms of the loan agreement, the Company must satisfy certain restrictive covenants including minimum financial ratios. These restrictions include maintaining a maximum ratio of funded debt to EBITDA and a minimal interest coverage ratio. EBITDA, a non IFRS measure, is defined in the revolving facility on a consolidated basis, as earnings of the Borrower before interest, taxes, depreciation, amortization, non-recurring and one-time expenses related to acquisitions and other non-cash items. As at September 30, 2015, all debt covenant requirements were met. On May 1, 2012, the Company entered into an interest rate swap agreement for a notional amount of $108 million, to exchange its monthly variable interest rate payments for fixed interest payments at the rate of 1.835% until March 2017. The amendments to the credit facility had no impact on the interest rate swap agreements.

Management’s Discussion and Analysis For the Three and Nine-month Periods Ended September 30, 2015
38| Fiera Capital Corporation
CoCoCoContractual Obligations andntractual Obligations andntractual Obligations andntractual Obligations and CCCContingentontingentontingentontingent LLLLiabilitiesiabilitiesiabilitiesiabilities Contractual Obligations
As at September 30, 2015, the Company had no material contractual obligation other than those described in the Company’s 2014 Annual MD&A in the section entitled “Contractual Obligations”. Commitments
During the nine-month period ended September 30, 2015, the Company entered into new or amended non-cancellable operating leases for office space in New York City and Los Angeles. The estimated future lease payments for the new leases total $55.5 million over the duration of the leases. The new or amended non-cancellable operating leases expire in 2026. Contingent Liabilities
In the normal course of business, the Company is party to business and employee-related claims. The potential outcomes related to existing matters faced by the Company are not determinable at this time. The Company intends to defend these actions, and management believes that the resolution of these matters will not have a material adverse effect on the Company’s financial condition. OffOffOffOff----Balance Sheet ArrangementsBalance Sheet ArrangementsBalance Sheet ArrangementsBalance Sheet Arrangements At September 30, 2015, Fiera Capital was not party to any off-balance sheet arrangements, including guarantees, derivatives, except for the above-mentioned floating-to-fixed interest rate swap agreement, and variable-interest entities. We do not expect to enter into such agreements. Share Share Share Share CCCCapitalapitalapitalapital As at September 30, 2015, the Company had 49,500,575 Class A subordinate voting shares and 19,899,018 Class B special voting shares for a total of 69,399,593 outstanding shares compared to 47,927,183 Class A subordinate voting shares and 20,039,750 Class B special voting shares for a total of 67,966,933 outstanding shares as at September 30, 2014. SSSSharehareharehare----Based Based Based Based PaymentPaymentPaymentPaymentssss Stock Option Plan The following table presents transactions that occurred during the nine-month period ended September 30, 2015, under the terms of the Company’s stock option plan:
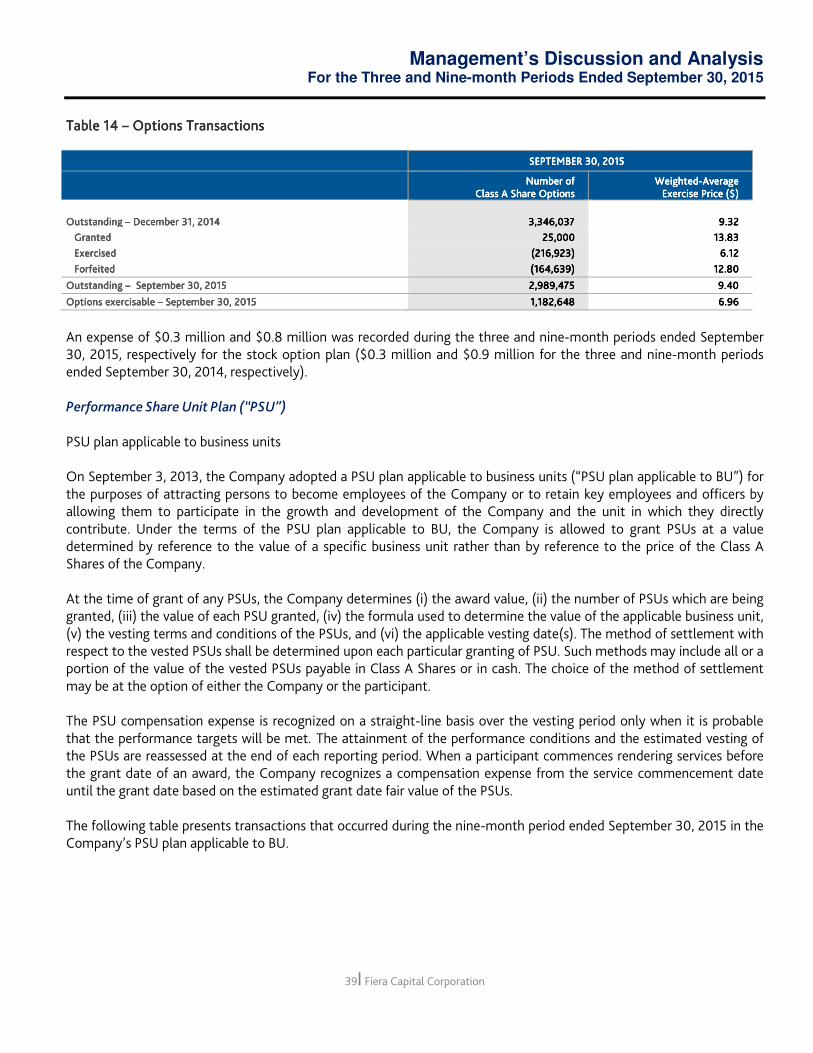
Management’s Discussion and Analysis For the Three and Nine-month Periods Ended September 30, 2015
39| Fiera Capital Corporation
Table 1Table 1Table 1Table 14444 –––– OptionsOptionsOptionsOptions TransactionsTransactionsTransactionsTransactions
SEPTEMBER 30, 2015SEPTEMBER 30, 2015SEPTEMBER 30, 2015SEPTEMBER 30, 2015
Number of Number of Number of Number of Class A Class A Class A Class A SSSSharehareharehare OptionsOptionsOptionsOptions
WeightedWeightedWeightedWeighted----AAAAverage verage verage verage EEEExercise xercise xercise xercise PPPPrice ($)rice ($)rice ($)rice ($)
OuOuOuOutstanding tstanding tstanding tstanding –––– DecemberDecemberDecemberDecember 31, 20131, 20131, 20131, 2014444 3,346,0373,346,0373,346,0373,346,037 9.329.329.329.32
GrantedGrantedGrantedGranted 25,00025,00025,00025,000 13.8313.8313.8313.83
EEEExercisedxercisedxercisedxercised ((((216,923216,923216,923216,923)))) 6.126.126.126.12
ForfeitedForfeitedForfeitedForfeited (164,639)(164,639)(164,639)(164,639) 12.8012.8012.8012.80
Outstanding Outstanding Outstanding Outstanding –––– September 30, 2015September 30, 2015September 30, 2015September 30, 2015 2,989,4752,989,4752,989,4752,989,475 9.409.409.409.40
Options exerOptions exerOptions exerOptions exercisable cisable cisable cisable –––– September 30, 2015September 30, 2015September 30, 2015September 30, 2015 1,182,6481,182,6481,182,6481,182,648 6.966.966.966.96
An expense of $0.3 million and $0.8 million was recorded during the three and nine-month periods ended September 30, 2015, respectively for the stock option plan ($0.3 million and $0.9 million for the three and nine-month periods ended September 30, 2014, respectively). Performance Share Unit Plan (“PSU”) PSU plan applicable to business units On September 3, 2013, the Company adopted a PSU plan applicable to business units (“PSU plan applicable to BU”) for the purposes of attracting persons to become employees of the Company or to retain key employees and officers by allowing them to participate in the growth and development of the Company and the unit in which they directly contribute. Under the terms of the PSU plan applicable to BU, the Company is allowed to grant PSUs at a value determined by reference to the value of a specific business unit rather than by reference to the price of the Class A Shares of the Company. At the time of grant of any PSUs, the Company determines (i) the award value, (ii) the number of PSUs which are being granted, (iii) the value of each PSU granted, (iv) the formula used to determine the value of the applicable business unit, (v) the vesting terms and conditions of the PSUs, and (vi) the applicable vesting date(s). The method of settlement with respect to the vested PSUs shall be determined upon each particular granting of PSU. Such methods may include all or a portion of the value of the vested PSUs payable in Class A Shares or in cash. The choice of the method of settlement may be at the option of either the Company or the participant. The PSU compensation expense is recognized on a straight-line basis over the vesting period only when it is probable that the performance targets will be met. The attainment of the performance conditions and the estimated vesting of the PSUs are reassessed at the end of each reporting period. When a participant commences rendering services before the grant date of an award, the Company recognizes a compensation expense from the service commencement date until the grant date based on the estimated grant date fair value of the PSUs. The following table presents transactions that occurred during the nine-month period ended September 30, 2015 in the Company’s PSU plan applicable to BU.

Management’s Discussion and Analysis For the Three and Nine-month Periods Ended September 30, 2015
40| Fiera Capital Corporation
Table 1Table 1Table 1Table 15555 –––– PSU TransactionsPSU TransactionsPSU TransactionsPSU Transactions
SEPTEMBER 30, 2015SEPTEMBER 30, 2015SEPTEMBER 30, 2015SEPTEMBER 30, 2015
Number of PSUs Number of PSUs Number of PSUs Number of PSUs
outstandingoutstandingoutstandingoutstanding Weighted Average Weighted Average Weighted Average Weighted Average
Value of PSUValue of PSUValue of PSUValue of PSU
Outstanding Outstanding Outstanding Outstanding –––– DecemberDecemberDecemberDecember 31, 20131, 20131, 20131, 2014444 1111,735,705,735,705,735,705,735,705 11.4311.4311.4311.43
GrantedGrantedGrantedGranted 268,256268,256268,256268,256 12.5212.5212.5212.52
SettledSettledSettledSettled (234,583)(234,583)(234,583)(234,583) 12.0012.0012.0012.00
ForfeitedForfeitedForfeitedForfeited (60,000)(60,000)(60,000)(60,000) 12.0012.0012.0012.00
Outstanding Outstanding Outstanding Outstanding –––– September 30, 2015September 30, 2015September 30, 2015September 30, 2015 1,709,3781,709,3781,709,3781,709,378 11.5111.5111.5111.51
During the nine-month period ended September 30, 2015, the Company granted 258,940 PSUs which will vest in equal tranches in either the next 4 or 5 years and 9,316 PSUs which are cliff vesting on December 31, 2018. The formula to determine the value of the PSUs upon vesting is based on a multiple of the revenues applicable to the business unit while the performance condition is based on a revenue growth objective. The PSUs granted are anticipated to be equity-settled.
The weighted-average grant date fair value of the PSUs awarded is $9.71 per share. The fair value of the PSUs granted was determined at inception using a discounted cash flow model which values the underlying PSUs using different long-term projections such as the expected revenue growth rate, client retention rate and discount rate. The Company determined that it is currently probable that only the first two years of the awards granted during the period will vest.
During the nine-month period ended September 30, 2015, 234,583 PSUs vested and were settled. The Company settled the vested PSUs by paying $3.5 million in cash in lieu of issuing Class A Shares. The Company treated the transaction as a repurchase of an equity interest and recorded a deduction in the amount of $3.5 million in contributed surplus. The settling of these PSUs in cash was due to unique circumstances. The Company still has the intention to settle the remaining tranches by issuing shares.
An expense of $1.2 million and $3.8 million was recorded during the three and nine-month periods ended September 30, 2015, respectively for the PSU plan applicable to BU ($1.1 million and $2.6 million for the three and nine-month periods ended September 30, 2014, respectively). For the three-month period ended September 30, 2015, the expense is attributable to equity-settled grants and to cash-settled grants for an amount of $1.2 million and nil, respectively ($1.1 million and nil for the three-month period ended September 30, 2014). For the nine-month period ended September 30, 2015, the expense is attributable to equity-settled grants and to cash-settled grants for an amount of $3.9 million and ($0.043 million), respectively ($2.6 million and nil for the nine-month period ended September 30, 2014).
PSU plan On May 23, 2013, the Company adopted a PSU plan (“PSU plan”) for the purposes of retaining key employees and officers by allowing them to participate in the growth and development of the Company. Under the terms of the PSU plan, the Company is allowed to grant PSUs based on the price of the Class A Shares of the Company on the date of the award.
PSUs awarded to participants vest on the third anniversary of the date of the grant or as determined by the Board of Directors at the time of the grant, provided that the PSU participants have satisfied the performance conditions determined at the time of the grant. These performance conditions are expressed as performance criteria objectives and may be set at different aggregate levels: from individual to corporate level. PSU participants have the right to receive up
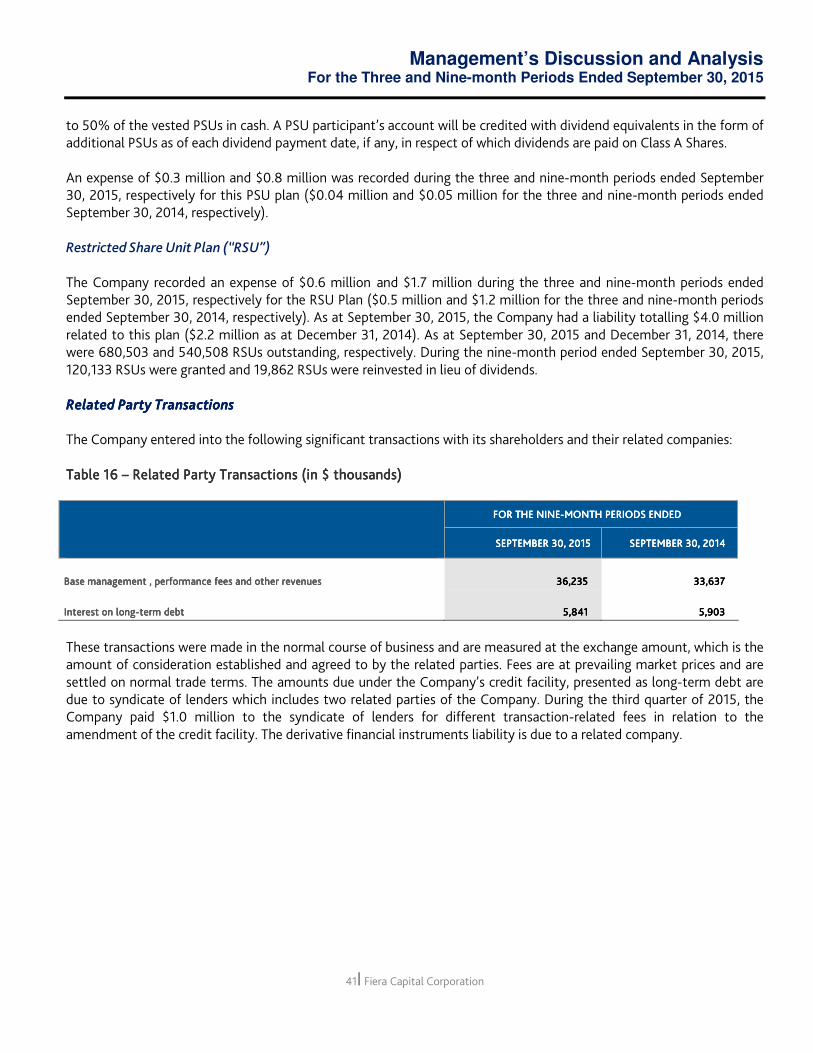
Management’s Discussion and Analysis For the Three and Nine-month Periods Ended September 30, 2015
41| Fiera Capital Corporation
to 50% of the vested PSUs in cash. A PSU participant’s account will be credited with dividend equivalents in the form of additional PSUs as of each dividend payment date, if any, in respect of which dividends are paid on Class A Shares. An expense of $0.3 million and $0.8 million was recorded during the three and nine-month periods ended September 30, 2015, respectively for this PSU plan ($0.04 million and $0.05 million for the three and nine-month periods ended September 30, 2014, respectively). Restricted Share Unit Plan (“RSU”) The Company recorded an expense of $0.6 million and $1.7 million during the three and nine-month periods ended September 30, 2015, respectively for the RSU Plan ($0.5 million and $1.2 million for the three and nine-month periods ended September 30, 2014, respectively). As at September 30, 2015, the Company had a liability totalling $4.0 million related to this plan ($2.2 million as at December 31, 2014). As at September 30, 2015 and December 31, 2014, there were 680,503 and 540,508 RSUs outstanding, respectively. During the nine-month period ended September 30, 2015, 120,133 RSUs were granted and 19,862 RSUs were reinvested in lieu of dividends. Related Party TRelated Party TRelated Party TRelated Party Transactionsransactionsransactionsransactions The Company entered into the following significant transactions with its shareholders and their related companies: Table 1Table 1Table 1Table 16666 –––– RelatedRelatedRelatedRelated PPPParty arty arty arty TTTTransactionsransactionsransactionsransactions ((((in $ thousandsin $ thousandsin $ thousandsin $ thousands))))
FOR THE FOR THE FOR THE FOR THE NINENINENINENINE----MONTHMONTHMONTHMONTH PERIODSPERIODSPERIODSPERIODS ENDEDENDEDENDEDENDED
SEPTEMBER 30, 2015SEPTEMBER 30, 2015SEPTEMBER 30, 2015SEPTEMBER 30, 2015 SEPTEMBER 30,SEPTEMBER 30,SEPTEMBER 30,SEPTEMBER 30, 2014201420142014
Base management Base management Base management Base management ,,,, performance feesperformance feesperformance feesperformance fees and other revenuesand other revenuesand other revenuesand other revenues 36,2336,2336,2336,235555 33,63733,63733,63733,637
Interest on longInterest on longInterest on longInterest on long----term debtterm debtterm debtterm debt 5,8415,8415,8415,841 5,9035,9035,9035,903
These transactions were made in the normal course of business and are measured at the exchange amount, which is the amount of consideration established and agreed to by the related parties. Fees are at prevailing market prices and are settled on normal trade terms. The amounts due under the Company’s credit facility, presented as long-term debt are due to syndicate of lenders which includes two related parties of the Company. During the third quarter of 2015, the Company paid $1.0 million to the syndicate of lenders for different transaction-related fees in relation to the amendment of the credit facility. The derivative financial instruments liability is due to a related company.
Management’s Discussion and Analysis For the Three and Nine-month Periods Ended September 30, 2015
42| Fiera Capital Corporation
CCCCONTROL ONTROL ONTROL ONTROL AND AND AND AND PPPPROCEDURESROCEDURESROCEDURESROCEDURES The Chairman and Chief Executive Officer (“CEO”) and the Executive Vice President and Chief Financial Officer (“CFO”), together with Management, are responsible for establishing and maintaining adequate disclosure controls and procedures (“DC&P”) and internal controls over financial reporting (“ICFR”), as defined in National Instrument 52-109. Fiera Capital Corporation’s internal control framework is based on the criteria published in the Internal Control-Integrated Framework (COSO framework 2013) report issued by the Committee of Sponsoring Organizations of the Treadway Commission (COSO) and is designed to provide reasonable assurance regarding the reliability of financial reporting and the preparation of financial statements for external purposes in accordance with IFRS. The CEO and CFO, supported by Management, evaluated the design of the Company’s DC&P and ICFR as at September 30, 2015, and have concluded that they were effective. Furthermore, no significant changes to the internal controls over financial reporting occurred during the quarter ended September 30, 2015. FFFFINANCIAL INANCIAL INANCIAL INANCIAL IIIINSTRUMENTS NSTRUMENTS NSTRUMENTS NSTRUMENTS
The Company, through its financial assets and financial liabilities, has exposure to the following risks from its use of financial instruments: market risk, equity market fluctuation risk, credit risk, interest rate risk, currency risk and liquidity risk. These risks and the management of these risks are described in the Company’s 2014 Annual MD&A in the section entitled “Financial Instruments”. The Company has not identified any material changes to the risk factors affecting its business or in the management of these risks. CCCCAPITAL APITAL APITAL APITAL MMMMANAGEMENTANAGEMENTANAGEMENTANAGEMENT The Company’s capital comprises share capital including hold back shares, (deficit) retained earnings and long-term debt, including the current portion thereof, less cash. The Company manages its capital to ensure adequate capital resources while maximizing return to shareholders through optimization of the debt and equity mix and to maintain compliance with regulatory requirements and certain restrictive debt covenants. To maintain its capital structure, the Company may issue additional shares, incur additional debt, repay existing debt and acquire or sell assets to improve its financial performance and flexibility. To comply with Canadian Securities Administrators’ regulations, the Company is required to maintain minimum capital of $100,000 as defined in Regulation 31-103 respecting Registration Requirements, Exemptions and Ongoing Registrant Obligations. As at September 30, 2015, all regulatory requirements and exemptions were met.
Management’s Discussion and Analysis For the Three and Nine-month Periods Ended September 30, 2015
43| Fiera Capital Corporation
SSSSIGNIFIGNIFIGNIFIGNIFICANT ICANT ICANT ICANT AAAACCOUNTING CCOUNTING CCOUNTING CCOUNTING JJJJUDGUDGUDGUDGMENTS AND MENTS AND MENTS AND MENTS AND EEEESTIMATION STIMATION STIMATION STIMATION UUUUNCERTAINTIESNCERTAINTIESNCERTAINTIESNCERTAINTIES This interim MD&A is prepared with reference to the unaudited interim condensed consolidated financial statements for the three and nine-month periods ended September 30, 2015. A summary of the Company’s significant accounting judgements and estimation uncertainties are presented in Note 3 to the Company’s audited consolidated financial statements for the year ended December 31, 2014. Some of the Company’s accounting policies, as required under IFRS, require the Management to make subjective, complex judgements and estimates to matters that are inherent to uncertainties. Accounting policies that require Management’s judgement and estimates are described in the “Significant Accounting Judgement and Estimation Uncertainties” section of the Company’s annual MD&A for the year ended December 31, 2014. NNNNEW EW EW EW AAAACCOUNTING CCOUNTING CCOUNTING CCOUNTING PPPPOLICIESOLICIESOLICIESOLICIES AdAdAdAdooooption of New IFRSption of New IFRSption of New IFRSption of New IFRS The following revised standards are effective for annual periods beginning on January 1, 2015 and their adoption has not had any impact on the amounts reported or disclosures made in these financial statements but may affect the accounting for future transactions, arrangements, or disclosures in the Company’s 2015 annual financial statements. Annual Improvements to IFRS (2010-2012) and (2011-2013) Cycles In December 2013, the IASB published annual improvements on the 2010-2012 and the 2011-2013 cycles which included narrow-scope amendments to a total of nine standards. Modifications of standards that may be relevant to the Company include amendments made to clarify items including the definition of vesting conditions in IFRS 2 – Share-Based payment, disclosure on the aggregation of operating segments in IFRS 8 – Operating segments, measurement of short-term receivables and payables under IFRS 13 – Fair value measurement, definition of related party in IAS 24 – Related party disclosures, and other amendments. Most of the amendments were effective for annual periods beginning on or after July 1, 2014. IFRSIFRSIFRSIFRS Issued butIssued butIssued butIssued but Not Yet AdoptedNot Yet AdoptedNot Yet AdoptedNot Yet Adopted The Company has not applied the following new and revised IFRS that have been issued but are not yet effective: IFRS 9 – Financial Instruments In July 2014, the IASB finalized IFRS 9, bringing together the financial asset and financial liability classification and measurement, impairment of financial assets and hedge accounting phases of the IASB project. IFRS 9 provides a single model for financial asset classification and measurement that is based on contractual cash flow characteristics and on the business model for holding financial assets. IFRS 9 also introduces a new impairment model for financial assets not measured at fair value through profit or loss. This version adds a new expected loss impairment model and limited amendments to classification and measurement of financial assets and liabilities. IFRS 9 replaces IAS 39 – Financial Instruments: Recognition and Measurement and is mandatorily effective for annual periods beginning on or after January 1, 2018, and is to be applied retrospectively. Early adoption permitted. IFRS 15 – Revenue from Contracts with Customers In May 2014, the IASB issued IFRS 15 – Revenue from Contracts with Customers. The new standard provides a comprehensive framework for recognition, measurement and disclosure of revenue from contracts with customers,

Management’s Discussion and Analysis For the Three and Nine-month Periods Ended September 30, 2015
44| Fiera Capital Corporation
excluding contracts within the scope of the standards on leases, insurance contracts and financial instruments. In July 2015, the IASB affirmed its proposal to defer the effective date by one year. Application of IFRS 15 is currently mandatory for annual periods beginning on or after January 1, 2018, and is to be applied retrospectively. Early adoption is permitted. Amendments to IFRS 11 – Joint Arrangements In May 2014, the IASB issued an amendment to this standard requiring business combination accounting to be applied to acquisitions of interests in a joint operation that constitute a business. The amendment is effective for annual periods beginning on or after January 1, 2016. Amendments to IAS 38 - Intangible Assets and IAS 16 - Property, Plant and Equipment In May 2014, the IASB issued amendments to these standards to introduce a rebuttable presumption that the use of revenue-based amortization methods for intangible assets is inappropriate. The amendment is effective for annual periods beginning on or after January 1, 2016 with early adoption permitted. Amendments to IFRS 10 – Consolidated Financial Statements and IAS 28 – Investments in Associates and Joint Ventures In September 2014, the IASB issued amendments to these standards to clarify the treatment of the sale or contribution of assets from an investor to its associate or joint venture. The extent of gains and losses arising on the sale or contribution of assets depends on whether the assets sold or contributed constitute a business. In August 2015, the IASB published an exposure draft proposing an indefinite deferral of the effective date for these amendments. Application of the amendments to IFRS 10 and IAS 28 are currently mandatory for annual periods beginning on or after January 1, 2016 and is to be applied prospectively. Early adoption is permitted. Annual Improvements to IFRS (2012-2014) Cycle In September 2014, the IASB published annual improvements on the 2012-2014 cycle which included narrow-scope amendments to a total of four standards. Modifications of standards that may be relevant to the Company include amendments made to provide: (1) specific guidance for cases when an entity reclassifies an asset from held-for-sale to held-for-distribution and vice versa in IFRS 5 – Non-current assets held for sale, (2) additional guidance on whether a servicing contract is continuing involvement in a transferred asset and clarification on offsetting disclosures in condensed interim financial statements in IFRS 7 – Financial Instruments: Disclosures, (3) clarification that the high quality bonds used in estimating the discount rate for post-employment benefits should be denominated in the same currency as the benefits paid under IAS 9 – Employee Benefits, (4) clarification of the term “elsewhere in the interim report” in IAS 34 – Interim Financial Reporting. Most of the amendments are effective for annual periods beginning on or after July 1, 2016. Early adoption is permitted. Amendments to IAS 1 – Presentation of Financial Statements In December 2014, the IASB issued amendments to this standard with the aim to improve presentation and disclosures in financial reporting. The narrow scope amendments place an emphasis on materiality and include clarification on line items to be presented in the statements. The amendments apply prospectively for annual periods beginning on or after January 1, 2016. Early adoption is permitted. The Company is still evaluating the impact of these standards on its consolidated financial statements.

Management’s Discussion and Analysis For the Three and Nine-month Periods Ended September 30, 2015
45| Fiera Capital Corporation
NNNNONONONON----IFRSIFRSIFRSIFRS MMMMEASURESEASURESEASURESEASURES Adjusted EBITDA is calculated as the difference between total revenues and SG&A expenses (excluding non-cash compensation) and external managers’ expenses. Adjusted net earnings are calculated as the sum of net earnings (loss) attributable to the Company’s shareholders, non-cash items, including depreciation of property and equipment, amortization of intangible assets, after-tax changes in fair value of derivative financial instruments, after-tax impairment of non-financial assets, after-tax acquisition and restructuring and other integration costs and non-cash compensation items. Cash earnings are calculated as the sum of net earnings (loss) attributable to the Company’s shareholders, non-cash items, including depreciation of property and equipment, amortization of intangible assets, changes in fair value of derivative financial instruments, impairment of non-financial assets and non-cash compensation items. We have included non-IFRS measures to provide investors with supplemental measures of our operating and financial performance. We believe non-IFRS measures are important supplemental metrics of operating and financial performance because they eliminate items that have less bearing on our operating and financial performance and thus highlight trends in our core business that may not otherwise be apparent when one relies solely on IFRS measures. We also believe that securities analysts, investors and other interested parties frequently use non-IFRS measures in the evaluation of issuers, many of which present non-IFRS measures when reporting their results. Management also uses non-IFRS measures in order to facilitate operating and financial performance comparisons from period to period, to prepare annual budgets and to assess our ability to meet our future debt service, capital expenditure and working capital requirements. Non-IFRS measures are not recognized measures under IFRS. For example, some or all of the non-IFRS measures do not reflect: (a) our cash expenditures, or future requirements for capital expenditures or contractual commitments; (b) changes in, or cash requirements for, our working capital needs; (c) the significant interest expense, or the cash requirements necessary to service interest or principal payments on our debt; and (d) income tax payments that represent a reduction in cash available to us. Although we consider the items excluded from the calculation of non-IFRS measures to be non-recurring and less relevant to evaluate our performance, some of these items may be recurring and, accordingly, may reduce available cash. We believe that the presentation of the non-IFRS measures described above is appropriate. However, these non-IFRS measures have important limitations as analytical tools, and the reader should not consider them in isolation, or as substitutes in the analysis of our results as reported under IFRS. Because of these limitations, we rely primarily on our results as reported in accordance with IFRS and use non-IFRS measures only as a supplement. In addition, because other companies may calculate non-IFRS measures differently than we do, these measures may not be comparable to similarly titled measures reported by other companies. RRRRISKS OF THEISKS OF THEISKS OF THEISKS OF THE BBBBUSINESSUSINESSUSINESSUSINESS Fiera Capital’s business is subject to a number of risk factors that may impact the Company’s operating and financial performance. These risks and the management of these risks are detailed in the Company’s 2014 Annual MD&A in the section entitled “Risks of the Business”. The Company has not identified any material changes to the risk factors affecting its business or in the management of these risks.

This page was intentionally left blank.