management’s discussion and analysis for the six and · pdf filemanagement's...
TRANSCRIPT
Page 1
Management’s Discussion and Analysis For the six and three-month periods ended May 31, 2017
General
Management's Discussion and Analysis of the financial position and results of operations ("MD&A") of MTY Food Group Inc. ("MTY”) is supplementary information and should be read in conjunction with the Company’s consolidated financial statements and accompanying notes for the fiscal year ended November 30, 2016. In the MD&A, MTY Food Group Inc., MTY, or the Company, designates, as the case may be, MTY Food Group Inc. and its Subsidiaries, or MTY Food Group Inc., or one of its subsidiaries. The condensed interim consolidated financial statements contained in this report have not been reviewed by MTY’s external auditors. The disclosures and values in this MD&A were prepared in accordance with International Financial Reporting Standards (IFRS) and with current issued and adopted interpretations applied to fiscal years beginning on or after December 1, 2016. This MD&A was prepared as at July 7, 2017. Supplementary information about MTY, including its latest annual and quarterly reports, and press releases, is available on SEDAR’s website at www.sedar.com. Forward looking statements and use of estimates
This MD&A and, in particular, but without limitation, the sections of this MD&A entitled Outlook, Same-Store Sales, Contingent Liabilities and Subsequent Event, contain forward-looking statements. These forward-looking statements include, but are not limited to, statements relating to certain aspects of the business outlook of the Company during the course of 2017. Forward-looking statements also include any other statements that do not refer to independently verifiable historical facts. A statement made is forward-looking when it uses what is known and expected today to make a statement about the future. Forward-looking statements may include words such as aim, anticipate, assumption, believe, could, expect, goal, guidance, intend, may, objective, outlook, plan, project, seek, should, strategy, strive, target and will. All such forward-looking statements are made pursuant to the ‘safe harbour’ provisions of applicable Canadian securities laws. Unless otherwise indicated, forward-looking statements in this MD&A describe the Company’s expectations at July 7, 2017 and, accordingly, are subject to change after such date. Except as may be required by Canadian securities laws, the Company does not undertake any obligation to update or revise any forward-looking statements, whether as a result of new information, future events or otherwise.
Page 2
Forward-looking statements, by their very nature, are subject to inherent risks and uncertainties and are based on several assumptions which give rise to the possibility that actual results or events could differ materially from the expectations expressed in or implied by such forward-looking statements and that the business outlook, objectives, plans and strategic priorities may not be achieved. As a result, the Company cannot guarantee that any forward-looking statement will materialize and readers are cautioned not to place undue reliance on these forward-looking statements. Forward-looking statements are provided in this MD&A for the purpose of giving information about management’s current strategic priorities, expectations and plans and allowing investors and others to get a better understanding of the business outlook and operating environment. Readers are cautioned, however, that such information may not be appropriate for other purposes. Forward-looking statements made in this MD&A are based on a number of assumptions that are believed to be reasonable on July 7, 2017. Refer, in particular, to the section of this MD&A entitled Risks and Uncertainties for a description of certain key economic, market and operational assumptions the Company has used in making forward-looking statements contained in this MD&A. If the assumptions turn out to be inaccurate, the actual results could be materially different from what is expected. In preparing the condensed interim consolidated financial statements in accordance with IFRS and the MD&A, management must exercise judgment when applying accounting policies and use assumptions and estimates that have an impact on the amounts of assets, liabilities, sales and expenses reported and on contingent liabilities and contingent assets information provided. Unless otherwise indicated in this MD&A, the strategic priorities, business outlooks and assumptions described in the previous MD&A remain substantially unchanged. Important risk factors that could cause actual results or events to differ materially from those expressed in or implied by the above-mentioned forward-looking statements and other forward-looking statements included in this MD&A include, but are not limited to: the intensity of competitive activity, and the resulting impact on the ability to attract customers’ disposable income; the Company’s ability to secure advantageous locations and renew existing leases at sustainable rates; the arrival of foreign concepts, the ability to attract new franchisees; changes in government regulation; changes in customer tastes, demographic trends and in the attractiveness of concepts, traffic patterns, occupancy cost and occupancy level of malls and office towers; general economic and financial market conditions, the level of consumer confidence and spending, and the demand for, and prices of, the products; the ability to implement strategies and plans in order to produce the expected benefits; events affecting the ability of first-party suppliers to provide essential products and services; labour availability and cost; stock market volatility; volatility in foreign exchange rates or borrowing rates; foodborne illness; operational constraints and the event of the occurrence of epidemics, pandemics and other health risks. These and other risk factors that could cause actual results or events to differ materially from the expectations expressed in or implied by these forward-looking statements are discussed in this MD&A. Readers are cautioned that the risks described above are not the only ones that could impact the Company. Additional risks and uncertainties not currently known or that are currently deemed to be immaterial may also have a material adverse effect on the business, financial condition or results of operations. Except as otherwise indicated by the Company, forward-looking statements do not reflect the potential impact of any non-recurring or other special items or of any dispositions, monetizations, mergers, acquisitions, other business combinations or other transactions that may be announced or that may occur after July 7, 2017. The financial impact of these transactions and non-recurring and other special items can be complex and depends

Page 3
on the facts particular to each of them. The Company therefore cannot describe the expected impact in a meaningful way or in the same way that present known risks affecting our business. Compliance with International Financial Reporting Standards
Unless otherwise indicated, the financial information presented below, including tabular amounts, is expressed in Canadian dollars and prepared in accordance with International Financial Reporting Standards (“IFRS”). MTY uses earnings before interest, taxes, depreciation and amortization (“EBITDA”), because this measure enables management to assess the Company’s operational performance. The Company also discloses same-store sales growth, which are defined as comparative sales generated by stores that have been open for at least thirteen months or that have been acquired more than thirteen months ago. Similarly, the Company uses system sales to evaluate the size and performance of MTY’s network, as well as to indicate its income-generation potential. These measures are widely accepted financial indicators but are not a measurement determined in accordance with GAAP and may not be comparable to those presented by other companies. These non-GAAP measures are intended to provide additional information about the performance of MTY, and should not be considered in isolation or as a substitute for measure of performance prepared in accordance with GAAP. The Company uses these measures to evaluate the performance of the business as they reflect its ongoing operations. Management believes that certain investors and analysts use EBITDA to measure a company’s ability to meet payment obligations or as a common measurement to value companies in the industry. Similarly, same-store sales growth and system sales provide additional information to investors about the performance of the network that is not available under GAAP. Both measures are components in the determination of short-term incentive compensation for some employees. Highlights of significant events during the six-month period
On May 8, 2017, the Company announced that it had completed the acquisition of the assets of Steak Frites St-Paul and Giorgio Ristorante for an amount of $0.4 million, of which $0.3 million was paid from cash on hand. At closing, six Giorgio Ristorante and nine Steak Frites were in operation. All locations are located in Canada.
On April 19, 2017, the Company acquired the remaining non-controlling shareholder interest in 7687567 Canada Inc. (Lucky 8) for a non-material cash consideration.
On February 1, 2017, the Company sold the exclusive Canadian master franchise rights of Yogen Früz for an amount of $0.8 million.
On December 9, 2016, the Company announced that it had completed the acquisition of 60% of the assets of La Diperie for a purchase price of $0.8 million, satisfied by the payment of $0.8 million cash. At closing, La Diperie operated 5 stores in Canada. The purpose of the transaction was to diversify the Company’s range of offering as well as to complement existing MTY brands. Core business
MTY franchises and operates quick-service restaurants under the following banners: Tiki-Ming, Sukiyaki, La Crémière, Au Vieux Duluth Express, Carrefour Oriental, Panini Pizza Pasta, Franx Supreme, Croissant Plus, Villa Madina, Cultures, Thaï Express, Vanellis, Kim Chi, “TCBY”, Sushi Shop, Koya Japan, Vie & Nam, Tandori, O’Burger, Tutti Frutti, Taco Time, Country Style, Buns Master, Valentine, Jugo Juice, Mr. Sub, Koryo Korean Barbeque, Mr. Souvlaki, Sushi Go, Mucho Burrito, Extreme Pita, PurBlendz, ThaïZone, Madisons New York Grill & Bar, Café Dépôt, Muffin Plus, Sushi-Man, Fabrika, Van Houtte, Manchu Wok, Wasabi Grill & Noodle and SenseAsian, Tosto, Big Smoke Burger, Cold Stone Creamery, Blimpie, Surf City

Page 4
Squeeze, The Great Steak & Potato Company, NrGize Lifestyle Café, Samurai Sam’s Teriyaki Grill, Frullati Café & Bakery, Rollerz, Johnnie`s New York Pizzeria, Ranch One, America’s Taco Shop, Cereality, Tasti D-Lite, Planet Smoothie, Maui Wowi, Pinkberry, Baja Fresh Mexican Grill, La Salsa Fresh Mexican Grill, La Diperie, Steak Frites St-Paul and Giorgio Ristorante. As at May 31, 2017, MTY had 5,494 locations in operation, of which 5,428 were franchised or under operator agreements and the remaining 66 locations were operated by MTY. MTY’s locations can be found in: i) food courts and shopping malls; ii) street front; and, iii) non-traditional format within petroleum retailers, convenience stores, cinemas, amusement parks, in other venues or retailers shared sites, hospitals, universities, airports and food-truck carts. The non-traditional locations are typically smaller in size, require a lower investment and generate lower revenues than the locations found in shopping malls, food courts or street front locations. The street front locations are mostly made up of the Country Style, La Crémière, Sushi Shop, Taco Time, Tutti Frutti, Valentine, Mr. Sub, ThaïZone, Extreme Pita, Mucho Burrito, Madisons, Blimpie, Cold Stone Creamery banners, Baja Fresh Mexican Grill, Steak Frites St-Paul and Giorgio Ristorante banners. La Crémière, “TCBY” and La Diperie operate primarily from April to September and the others banners operate year round. MTY has developed several quick service restaurant concepts: Tiki-Ming (Chinese cuisine), was its first banner, followed by Sukiyaki (a Japanese delight), Franx Supreme (hot dog/hamburger), Panini Pizza Pasta, Chick’n’Chick, Caferama, Carrefour Oriental, Villa Madina, Kim Chi, Vie & Nam, Tandori, O’Burger and Tosto. Other banners added through acquisitions include:
Brand Acquisition
year%
ownership # of franchised
locations # of corporate
locationsFontaine Santé/Veggirama 1999 100% 18 — La Crémière 2001 100% 71 3 Croissant Plus 2002 100% 18 2 Cultures 2003 100% 24 — Thaï Express May 2004 100% 6 — Mrs. Vanelli’s June 2004 100% 103 — TCBY – Canadian master franchise right September 2005 100% 91 — Sushi Shop September 2006 100% 42 5 Koya Japan October 2006 100% 24 — Sushi Shop – existing franchise locations September 2007 100% — 15
Tutti Frutti September 2008 100% 29 — Taco Time – Canadian master franchise rights
October 2008 100% 117 —
Country Style Food Services Holdings Inc.
May 2009 100% 475 5
Groupe Valentine inc. September 2010 100% 86 9 Jugo Juice August 2011 100% 134 2 Mr. Submarine November 2011 100% 338 — Koryo Korean BBQ November 2011 100% 19 1 Mr. Souvlaki September 2012 100% 14 — SushiGo June 2013 100% 3 2

Page 5
Extreme Pita, PurBlendz and Mucho Burrito ("Extreme Brandz")
September 2013 100% 300 - 34 of which in the United
States
5
Brand Acquisition
year %
ownership # of franchised
locations # of corporate
locationsThaïZone September 2013
March 2015 80% + 20%
25 and 3 mobile restaurants
—
Madisons July 2014 90% 14 — Café Dépôt, Muffin Plus, Sushi-Man and Fabrika
October 2014 100% 88 13
Van Houtte Café Bistros – perpetual franchising license
November 2014 100% 51 1
Manchu Wok, Wasabi Grill & Noodle and SenseAsian
December 2014 100% 115 17
Big Smoke Burger September 2015 September 2016
60% + 40%
13 4
Kahala Brands Ltd - Cold Stone Creamery, Blimpie, Taco Time, Surf City Squeeze, The Great Steak & Potato Company, NrGize, Lifestyle Café, Samurai Sam’s Teriyaki Grill, Frullati Café & Bakery, Rollerz, Johnnie`s New York Pizzeria, Ranch One, America’s Taco Shop, Cereality, Tasti D-Lite, Planet Smoothie, Maui Wowi and Pinkberry
July 2016 100% 2,839 40
BF Acquisition Holdings, LLC – Baja Fresh Mexican Grill and La Salsa Fresh Mexican Grill
October 2016 100% 167 16
La Diperie December 2016 60% 5 — Steak Frites St-Paul and Giorgio Ristorante
May 2017 83.25% 15 —
MTY also has an exclusive area development agreement with Restaurant Au Vieux Duluth to develop and sub-franchise Au Vieux Duluth Express quick-service restaurants in the Provinces of Ontario and Quebec. Revenues from franchise locations are generated from royalty fees, franchise fees, sales of turn key projects, rent, sign rental, supplier contributions, gift card program fees and breakage and sales of other goods and services to franchisees. Revenues from corporate owned locations include sales generated from corporate owned locations. Operating expenses related to franchising include salaries, general and administrative costs associated with existing and new franchisees, expenses in the development of new markets, costs of setting up turn key projects, rent, supplies and equipment sold to franchisees. Corporate owned location expenses include the costs incurred to operate corporate owned locations. MTY generates revenues from the food processing business discussed herein. The plant produces various products that range from ingredients and ready to eat food sold to restaurants or other food processing plants to prepared food sold in retail stores. The plant generates most of its revenues selling its products to distributors and retailers. The Company also generates revenues from its distribution center located on the south shore of Montreal. The distribution center mainly serves the Valentine and Franx Supreme franchisees with a broad range of products required in the day-to-day operations of the restaurants.

Page 6
Description of recent acquisitions
On May 8, 2017, the Company announced that it had completed the acquisition of the assets of Steak Frites St-Paul and Giorgio Ristorante for an amount of $0.4 million, of which $0.3 million was paid from cash on hand. At closing, six Giorgio Ristorante and nine Steak Frites were in operation. All locations are located in Canada.
On April 19, 2017, the Company acquired the remaining non-controlling shareholder interest in 7687567 Canada Inc. (Lucky 8) for a non-material cash consideration.
On December 9, 2016, the Company announced that it had completed the acquisition of 60% of the assets of La Diperie for a purchase price of $0.8 million, satisfied by the payment of $0.8 million cash. At closing, La Diperie operated 5 stores in Canada. The purpose of the transaction was to diversify the Company’s range of offering as well as to complement existing MTY brands.
On October 5, 2016, the Company completed the acquisition of BF Acquisition Holdings, LLC (BFAH), for a purchase price of approximately $35.4 million. At closing, there were 183 stores in operation in the United States, 16 of which were corporately-owned.
On September 30, 2016, the Company acquired the interest of the non-controlling shareholders of one of its subsidiaries (9410198 Canada Inc., doing business as Big Smoke Burger) for $1.2 million. Following this transaction, the Company has 100% ownership of this subsidiary.
On July 26, 2016, the Company acquired all of the shares of Kahala Brands Ltd. for a total consideration of $393.4 million. Of this amount, $212.7 million was paid in cash. The purchase price allocation is still subject to post-closing adjustments which will be made over the course of the year. Financing for the acquisition was composed of the issuance of 2,253,930 shares, $33.0 million of MTY’s cash on hand and the remainder was paid by MTY’s new $325.0 million credit facility. As at closing, Kahala Brands Ltd. operated 18 brands in 27 countries and had 2,879 locations in operation. Summary of quarterly financial information
Segment note disclosure Prior to the third quarter of 2016, the Company had four operating segments, consisting of Franchise operations, Corporate store operations, Distribution operations and Food Processing operations. These reportable operating segments were established based on the differences in the types of products or services
Quarters ended in thousands of $
August 2015
November 2015
February 2016
May 2016
August 2016
November 2016
February 2017
May 2017
Revenue $35,003 $39,481 $35,320 $35,362 $52,886 $72,814 $68,232 $72,063
EBITDA $13,340 $13,475 $12,106 $12,820 $17,953 $27,853 $20,451 $26,601
Net income attributable to owners $8,176 $3,119 $7,927 $8,335 $16,519 $24,614 $4,517 $17,130
Total comprehensive income attributable to owners $8,336 $3,156 $8,414 $8,266 $13,256 $30,185 $1,310 $21,881
Per share $0.43 $0.16 $0.41 $0.44 $0.82 $1.15 $0.21 $0.80
Per diluted share $0.43 $0.16 $0.41 $0.44 $0.82 $1.15 $0.21 $0.80

Page 7
offered by each division. With the acquisition of Kahala Brands and the expansion of MTY into the USA, it was determined that these operating segments no longer reflected how management monitored and evaluated the results. The Company concluded that based on information provided to senior management, that two primary geographical segments exist, that being Canada and USA/International. This conclusion was based on how the brands in each geographical area are managed by their respective Chief Operating Officers (COO) and how brand leaders report to each of their respective COO’s to account for the results of their operations. It was also determined that the Distribution operations no longer comprised a material segment to MTY. The results were absorbed into the Franchising operations as its revenues are closely tied to the success of this segment. The 2016 results were restated to reflect the change in these segments.
Results of operations for the six-month period ended May 31, 2017 Revenue During the first six months of the 2017 fiscal year, the Company’s total revenue increased by 98% to reach $140.3 million. Revenues for the two segments of business are broken down as follows:
Segment Sub-division May 31, 2017 ($ million)
May 31, 2016 ($ million) Variation
Canada Franchise operation 49.8 51.5 (3%) Corporate stores 9.8 10.0 (3%) Food processing 7.1 6.4 11% Intercompany transactions (1.1) (1.0) N/A Total Canada 65.6 66.9 (2%) USA & International
Franchise operation 59.7 2.2 2,556% Corporate stores 15.2 1.6 873%
Intercompany transactions (0.2) — N/A Total USA/International 74.7 3.8 1,864% Total operating revenues 140.3 70.7 98%
Canada revenue analysis: As is shown in the table above, revenue from franchise locations in Canada decreased compared to prior year. Several factors contributed to the variation, as listed below:
$ million
Revenues, first six months of 2016 51.5 Increase in recurring revenue steams 0.0 Decrease in initial franchise fees, renewal fees and transfer fees (0.7) Decrease in turn key, sales of material to franchisees and rent revenues (1.3) Other non-material variations 0.3
Revenues, first six months of 2017 49.8 Revenue from corporate owned locations decreased by 3%, to $9.8 million during the six-month period. The decrease is mainly due to the sale and closure of some corporate stores. At the end of the period, the company had 33 corporate stores in Canada, compared to 39 a year earlier. Food processing revenues increased by 11% during the first six-months of 2017, mainly due to the addition of new product lines added during the last year.
Page 8
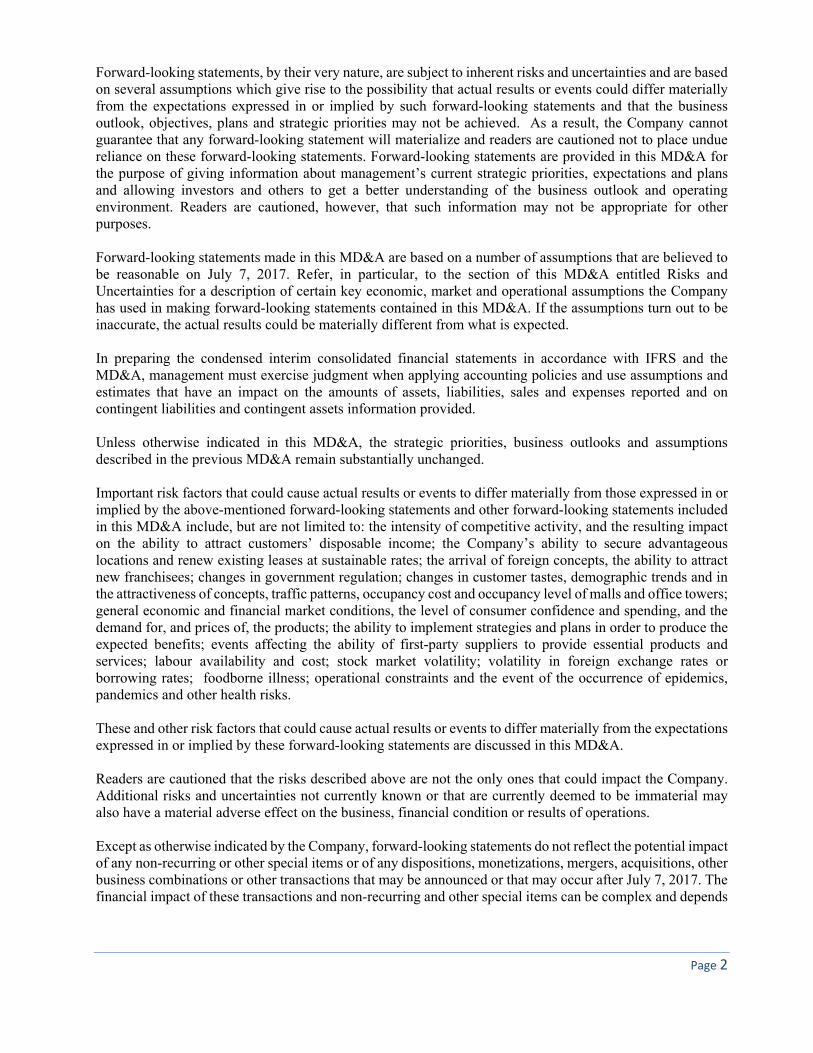
USA/International revenue analysis: During the first six months of 2017, the Company benefitted from the impact of the acquisitions of Kahala Brands Ltd. and BF Acquisition Holdings, LLC, which were realised in the third and fourth quarter of 2016 respectively; these transactions account for most of the increase in all revenue streams. Cost of sales and other operating expenses During the first six months of 2017, operating expenses increased by 104%. Operating expenses for the two business segments were incurred as follows:
Segment Sub-division May 31, 2017 ($ million)
May 31, 2016 ($ million) Variation
Canada Franchise operation 26.9 27.4 (2%) Corporate stores 10.2 11.1 (8%) Food processing 6.6 5.9 12% Intercompany transactions (1.3) (1.0) N/A Total Canada 42.4 43.4 (2%) USA & International
Franchise operation 32.7 1.1 2,873% Corporate stores 18.1 1.3 1,333%
Intercompany transactions — — N/A Total USA/International 50.8 2.4 2,050% Total cost of sales and other operating
expenses 93.2 45.8 104% Canada cost of sales and other operating expenses analysis: Expenses from franchise operations decreased by $0.5 million during the first six months of 2017 compared to the same period last year. The decrease is mostly attributable to a decrease in turnkey which fluctuated in line with revenues as well as a decrease in rent expense. This was partially offset by an increase in the provisions for litigations, disputes and lease termination costs. Expenses from corporate owned location decreased by 8%. The decrease is mainly due to the sale and closure of some corporate stores, as explained in the revenue section. A portion of the decrease is also attributable to the closure of less profitable locations. Expenses from Food processing increased by $0.7 million during the first six months of 2017 compared to the same period last year. The increase is predominantly explained by the new product lines as explained in the Revenue section. USA/International cost of sales and other operating expenses analysis: During the six-month period, the Company incurred additional operational costs for this segment as a result of the acquisition of Kahala Brands Ltd. And BF Acquisition Holdings, LLC. which accounts for most of the variance in costs.

Page 9
Earnings before interest, taxes, depreciation and amortization (EBITDA)
Six months ended May 31, 2016 (In millions $) Canada USA & International Total
Revenues 66.9 3.8 70.7 Expenses 43.4 2.4 45.8 EBITDA(1) 23.5 1.4 24.9 EBITDA as a % of Revenue 35% 38% 35% Below is a summary of performance segmented by product/service: Six months ended May 31, 2017
(In millions $) Franchise Corporate Processing Intercompany transactions Total
Revenues 109.5 25.0 7.1 (1.3) 140.3 Expenses 59.6 28.3 6.6 (1.3) 93.2 EBITDA(1) 49.9 (3.3) 0.5 — 47.1 EBITDA as a % of Revenue 46% N/A 6% N/A 34%
Six months ended May 31, 2016
(In millions $) Franchise Corporate Processing Intercompany transactions Total
Revenues 53.7 11.6 6.4 (1.0) 70.7 Expenses 28.5 12.4 5.9 (1.0) 45.8 EBITDA(1) 25.2 (0.8) 0.5 — 24.9 EBITDA as a % of Revenue 47% N/A 8% N/A 35%
(1)EBITDA (income before income taxes, interest, depreciation and amortization) is not an earnings measure recognized by IFRS and therefore may not be comparable to similar measures presented by other companies. EBITDA is defined as operating revenues less operating expenses. See reconciliation of EBITDA to Income before taxes on page 10. Total EBITDA for the six-month period ended May 31, 2017 was $47.1 million, an increase of 89% compared to the same period last year. The USA/International operations contributed all of the total increase. The increase in USA/International EBITDA is due to the acquisition of Kahala Brands LTD. and BF Acquisition Holdings, LLC. In Canada, EBITDA for the first six months of 2017 decreased by 1% compared to the same period last year mostly due to the franchising operations which saw a $1.2 million decrease in EBITDA. This is partly a result of lower franchise fees and transfer fees realized during the period and higher litigation and closed store provisions, offset by lower net rent expense. The EBITDA of the corporate stores has decreased significantly during the first and second quarter of 2017; this is mainly the result of 24 highly seasonal Cold Stone Creamery and Pinkberry locations in the United
Six months ended May 31, 2017 (In millions $) Canada USA & International Total
Revenues 65.6 74.7 140.3 Expenses 42.4 50.8 93.2 EBITDA(1) 23.2 23.9 47.1 EBITDA as a % of Revenue 35% 32% 34%
Page 10
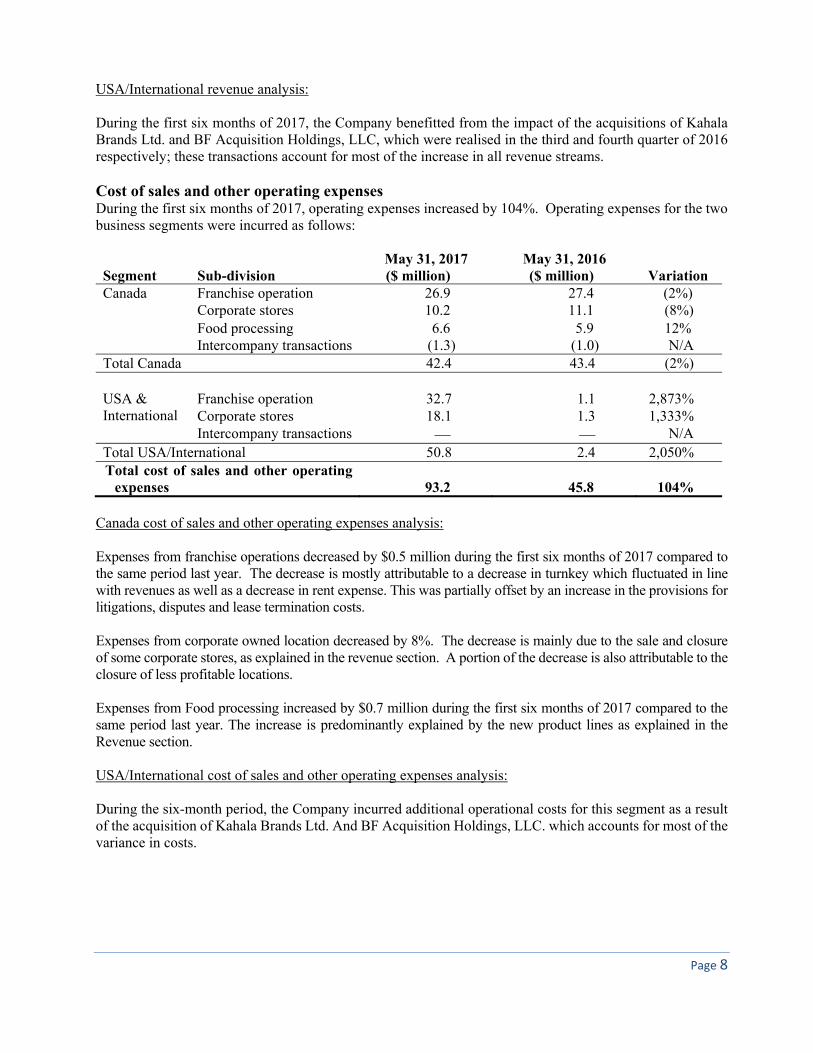
States. The months of December through April are typically weaker for ice cream and frozen yogurt street front locations. Those restaurants are expected to contribute positive EBITDA over a twelve-month period. Net income For the six-month period ended May 31, 2017, net income attributable to owners increased by 33%, to $21.6 million or $1.01 per share ($1.01 per diluted share) compared to $16.3 million or $0.85 per share ($0.85 per diluted share) for the same period last year. The increase is mainly due to acquisition of Kahala Brands Ltd. And BF Acquisition Holdings, LLC. In addition, the Company recorded a non-recurring foreign exchange gain of $1.2 million on the revaluation of a loan with one of the Company’s foreign subsidiaries which is revalued at the end of each reporting period. On a normalized basis, net income attributable to owners would have been $20.4 million ($0.96 per share and $0.96 per diluted share). Calculation of Earnings Before Interest, Taxes, Depreciation and Amortization (EBITDA)
(in thousands of dollars)Period endedMay 31, 2017
Period endedMay 31, 2016
Income before taxes 30,665 22,533 Depreciation – property, plant and equipment 1,557 729 Amortization – intangible assets 11,267 3,235 Interest on long-term debt 5,145 103 Foreign exchange loss (gain) (619) 42 Interest income (219) (131)Gain on disposal of property, plant and equipment and
intangibles (744) (1,585)EBITDA 47,052 24,926
Other income and charges Interest on long-term debt increased to $5.1 million from $0.1 million during the six-month period as a result of the interest on the new credit facilities related to the acquisition of Kahala Brands Ltd. and BF Acquisition Holdings, LLC. Income taxes The provision for income taxes as a percentage of income before taxes has increased to 29.0% of income before taxes. The slightly higher rate mainly resulted from some adjustments made to previous years’ provision and differences between foreign statutory rates, which were partially offset by permanent differences.
Page 11
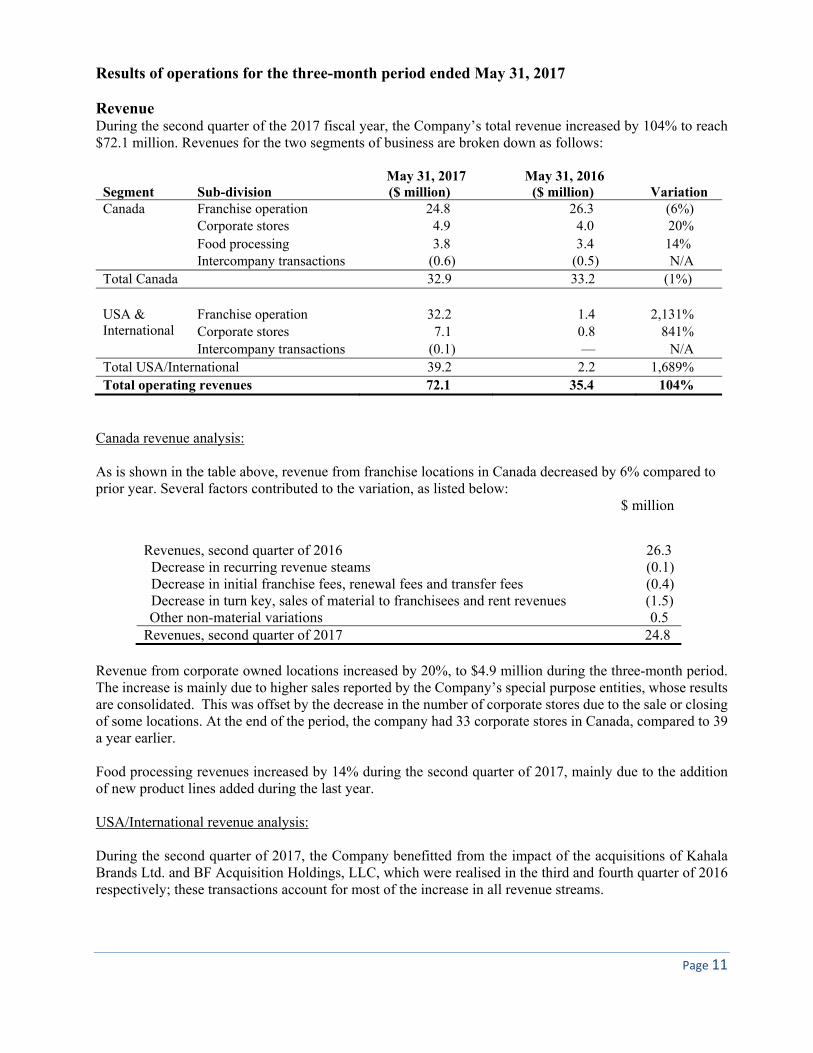
Results of operations for the three-month period ended May 31, 2017 Revenue During the second quarter of the 2017 fiscal year, the Company’s total revenue increased by 104% to reach $72.1 million. Revenues for the two segments of business are broken down as follows:
Segment Sub-division May 31, 2017 ($ million)
May 31, 2016 ($ million) Variation
Canada Franchise operation 24.8 26.3 (6%) Corporate stores 4.9 4.0 20% Food processing 3.8 3.4 14% Intercompany transactions (0.6) (0.5) N/A Total Canada 32.9 33.2 (1%) USA & International
Franchise operation 32.2 1.4 2,131% Corporate stores 7.1 0.8 841%
Intercompany transactions (0.1) — N/A Total USA/International 39.2 2.2 1,689% Total operating revenues 72.1 35.4 104%
Canada revenue analysis: As is shown in the table above, revenue from franchise locations in Canada decreased by 6% compared to prior year. Several factors contributed to the variation, as listed below:
$ million
Revenues, second quarter of 2016 26.3 Decrease in recurring revenue steams (0.1) Decrease in initial franchise fees, renewal fees and transfer fees (0.4) Decrease in turn key, sales of material to franchisees and rent revenues (1.5) Other non-material variations 0.5 Revenues, second quarter of 2017 24.8
Revenue from corporate owned locations increased by 20%, to $4.9 million during the three-month period. The increase is mainly due to higher sales reported by the Company’s special purpose entities, whose results are consolidated. This was offset by the decrease in the number of corporate stores due to the sale or closing of some locations. At the end of the period, the company had 33 corporate stores in Canada, compared to 39 a year earlier. Food processing revenues increased by 14% during the second quarter of 2017, mainly due to the addition of new product lines added during the last year. USA/International revenue analysis: During the second quarter of 2017, the Company benefitted from the impact of the acquisitions of Kahala Brands Ltd. and BF Acquisition Holdings, LLC, which were realised in the third and fourth quarter of 2016 respectively; these transactions account for most of the increase in all revenue streams.
Page 12
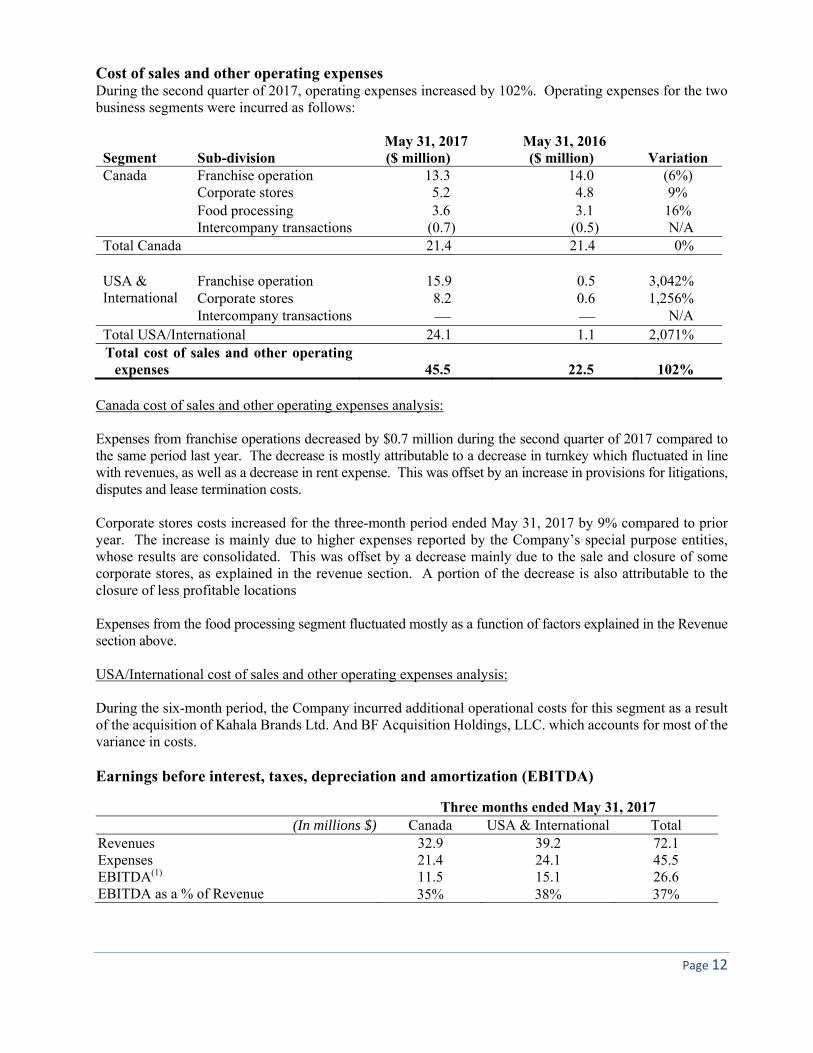
Cost of sales and other operating expenses During the second quarter of 2017, operating expenses increased by 102%. Operating expenses for the two business segments were incurred as follows:
Segment Sub-division May 31, 2017 ($ million)
May 31, 2016 ($ million) Variation
Canada Franchise operation 13.3 14.0 (6%) Corporate stores 5.2 4.8 9% Food processing 3.6 3.1 16% Intercompany transactions (0.7) (0.5) N/A Total Canada 21.4 21.4 0% USA & International
Franchise operation 15.9 0.5 3,042% Corporate stores 8.2 0.6 1,256%
Intercompany transactions — — N/A Total USA/International 24.1 1.1 2,071% Total cost of sales and other operating
expenses 45.5 22.5 102% Canada cost of sales and other operating expenses analysis: Expenses from franchise operations decreased by $0.7 million during the second quarter of 2017 compared to the same period last year. The decrease is mostly attributable to a decrease in turnkey which fluctuated in line with revenues, as well as a decrease in rent expense. This was offset by an increase in provisions for litigations, disputes and lease termination costs. Corporate stores costs increased for the three-month period ended May 31, 2017 by 9% compared to prior year. The increase is mainly due to higher expenses reported by the Company’s special purpose entities, whose results are consolidated. This was offset by a decrease mainly due to the sale and closure of some corporate stores, as explained in the revenue section. A portion of the decrease is also attributable to the closure of less profitable locations Expenses from the food processing segment fluctuated mostly as a function of factors explained in the Revenue section above. USA/International cost of sales and other operating expenses analysis: During the six-month period, the Company incurred additional operational costs for this segment as a result of the acquisition of Kahala Brands Ltd. And BF Acquisition Holdings, LLC. which accounts for most of the variance in costs. Earnings before interest, taxes, depreciation and amortization (EBITDA)
Three months ended May 31, 2017 (In millions $) Canada USA & International Total
Revenues 32.9 39.2 72.1 Expenses 21.4 24.1 45.5 EBITDA(1) 11.5 15.1 26.6 EBITDA as a % of Revenue 35% 38% 37%
Page 13
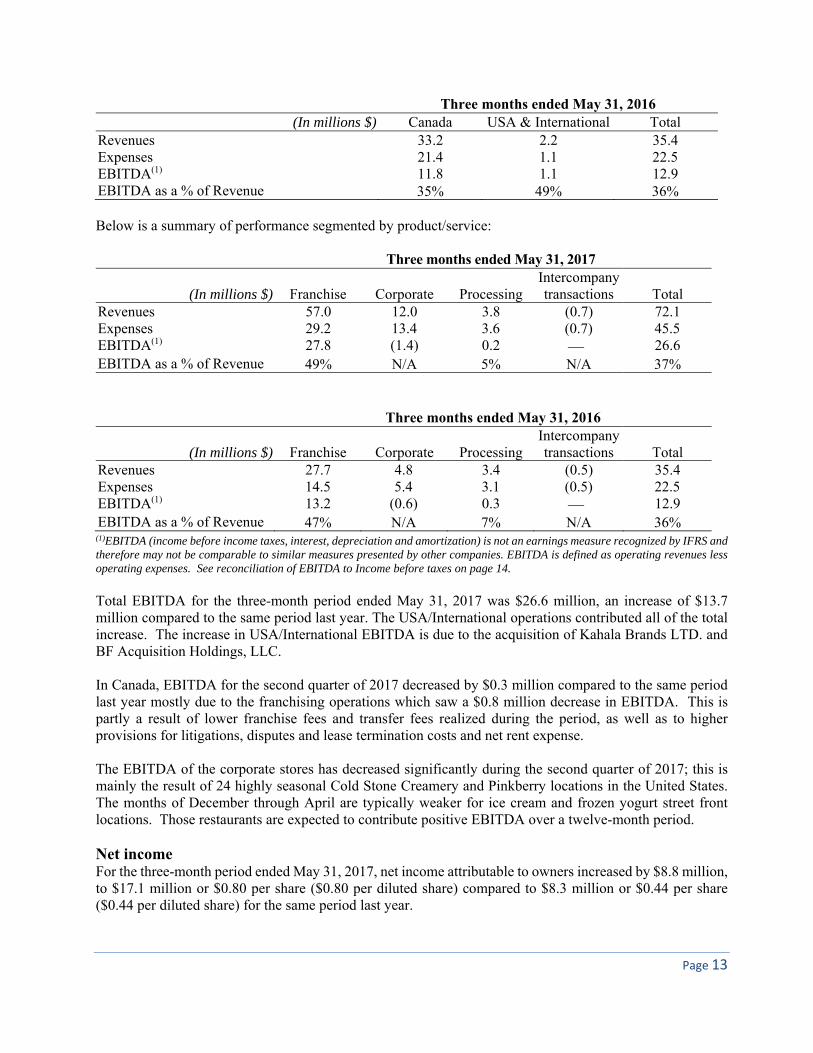
Three months ended May 31, 2016 (In millions $) Canada USA & International Total
Revenues 33.2 2.2 35.4 Expenses 21.4 1.1 22.5 EBITDA(1) 11.8 1.1 12.9 EBITDA as a % of Revenue 35% 49% 36% Below is a summary of performance segmented by product/service: Three months ended May 31, 2017
(In millions $) Franchise Corporate Processing Intercompany transactions Total
Revenues 57.0 12.0 3.8 (0.7) 72.1 Expenses 29.2 13.4 3.6 (0.7) 45.5 EBITDA(1) 27.8 (1.4) 0.2 — 26.6 EBITDA as a % of Revenue 49% N/A 5% N/A 37%
Three months ended May 31, 2016
(In millions $) Franchise Corporate Processing Intercompany transactions Total
Revenues 27.7 4.8 3.4 (0.5) 35.4 Expenses 14.5 5.4 3.1 (0.5) 22.5 EBITDA(1) 13.2 (0.6) 0.3 — 12.9 EBITDA as a % of Revenue 47% N/A 7% N/A 36%
(1)EBITDA (income before income taxes, interest, depreciation and amortization) is not an earnings measure recognized by IFRS and therefore may not be comparable to similar measures presented by other companies. EBITDA is defined as operating revenues less operating expenses. See reconciliation of EBITDA to Income before taxes on page 14. Total EBITDA for the three-month period ended May 31, 2017 was $26.6 million, an increase of $13.7 million compared to the same period last year. The USA/International operations contributed all of the total increase. The increase in USA/International EBITDA is due to the acquisition of Kahala Brands LTD. and BF Acquisition Holdings, LLC. In Canada, EBITDA for the second quarter of 2017 decreased by $0.3 million compared to the same period last year mostly due to the franchising operations which saw a $0.8 million decrease in EBITDA. This is partly a result of lower franchise fees and transfer fees realized during the period, as well as to higher provisions for litigations, disputes and lease termination costs and net rent expense. The EBITDA of the corporate stores has decreased significantly during the second quarter of 2017; this is mainly the result of 24 highly seasonal Cold Stone Creamery and Pinkberry locations in the United States. The months of December through April are typically weaker for ice cream and frozen yogurt street front locations. Those restaurants are expected to contribute positive EBITDA over a twelve-month period. Net income For the three-month period ended May 31, 2017, net income attributable to owners increased by $8.8 million, to $17.1 million or $0.80 per share ($0.80 per diluted share) compared to $8.3 million or $0.44 per share ($0.44 per diluted share) for the same period last year.

Page 14
The increase is mainly due to acquisition of Kahala Brands Ltd. And BF Acquisition Holdings, LLC. In addition, a non-recurring foreign exchange gain of $6.8 million recorded on the revaluation of a loan with one of the Company’s foreign subsidiaries which is fair valued at the end of each reporting period. On a normalized basis, net income attributable to owners would have been $10.3 million ($0.48 per share and $0.48 per diluted share). Calculation of Earnings Before Interest, Taxes, Depreciation and Amortization (EBITDA)
(in thousands of dollars)Period endedMay 31, 2017
Period endedMay 31, 2016
Income before taxes 24,434 11,479 Depreciation – property, plant and equipment 571 365 Amortization – intangible assets 5,713 1,606 Interest on long-term debt 2,444 42 Foreign exchange loss (gain) (5,984) 57 Interest income (119) (79)Gain on disposal of property, plant and equipment and
intangibles (458) (650)EBITDA 26,601 12,820
Other income and charges Interest on long-term debt increased to $2.4 million from $0.1 million during the three-month period as a result of the interest on the new credit facilities related to the acquisition of Kahala Brands Ltd. and BF Acquisition Holdings, LLC. During the three-month period, the Company recorded a foreign exchange gain of $6.8 million on the revaluation of a loan with one of its foreign subsidiaries which is fair valued at the end of each reporting period. This gain was partially offset by the foreign exchange loss recorded on the conversion of monetary assets and liabilities held by the Company’s foreign subsidiaries.
Income taxes The provision for income taxes as a percentage of income before taxes has increased to 29.4% of income before taxes. The slightly higher rate mainly resulted from some adjustments made to previous years’ provision and differences between foreign statutory rates, which were partially offset by permanent differences.
Page 15
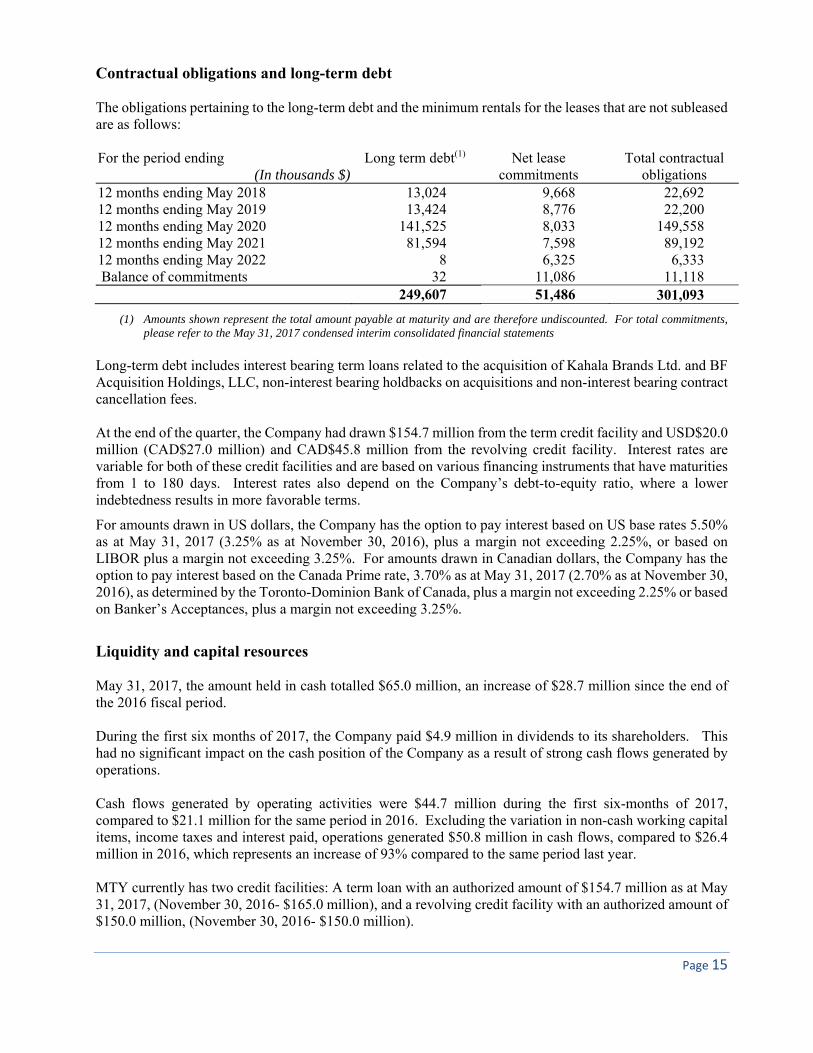
Contractual obligations and long-term debt The obligations pertaining to the long-term debt and the minimum rentals for the leases that are not subleased are as follows: For the period ending
(In thousands $)Long term debt(1) Net lease
commitments Total contractual
obligations 12 months ending May 2018 13,024 9,668 22,692 12 months ending May 2019 13,424 8,776 22,200 12 months ending May 2020 141,525 8,033 149,558 12 months ending May 2021 81,594 7,598 89,192 12 months ending May 2022 8 6,325 6,333 Balance of commitments 32 11,086 11,118
249,607 51,486 301,093
(1) Amounts shown represent the total amount payable at maturity and are therefore undiscounted. For total commitments, please refer to the May 31, 2017 condensed interim consolidated financial statements
Long-term debt includes interest bearing term loans related to the acquisition of Kahala Brands Ltd. and BF Acquisition Holdings, LLC, non-interest bearing holdbacks on acquisitions and non-interest bearing contract cancellation fees. At the end of the quarter, the Company had drawn $154.7 million from the term credit facility and USD$20.0 million (CAD$27.0 million) and CAD$45.8 million from the revolving credit facility. Interest rates are variable for both of these credit facilities and are based on various financing instruments that have maturities from 1 to 180 days. Interest rates also depend on the Company’s debt-to-equity ratio, where a lower indebtedness results in more favorable terms.
For amounts drawn in US dollars, the Company has the option to pay interest based on US base rates 5.50% as at May 31, 2017 (3.25% as at November 30, 2016), plus a margin not exceeding 2.25%, or based on LIBOR plus a margin not exceeding 3.25%. For amounts drawn in Canadian dollars, the Company has the option to pay interest based on the Canada Prime rate, 3.70% as at May 31, 2017 (2.70% as at November 30, 2016), as determined by the Toronto-Dominion Bank of Canada, plus a margin not exceeding 2.25% or based on Banker’s Acceptances, plus a margin not exceeding 3.25%.
Liquidity and capital resources May 31, 2017, the amount held in cash totalled $65.0 million, an increase of $28.7 million since the end of the 2016 fiscal period. During the first six months of 2017, the Company paid $4.9 million in dividends to its shareholders. This had no significant impact on the cash position of the Company as a result of strong cash flows generated by operations. Cash flows generated by operating activities were $44.7 million during the first six-months of 2017, compared to $21.1 million for the same period in 2016. Excluding the variation in non-cash working capital items, income taxes and interest paid, operations generated $50.8 million in cash flows, compared to $26.4 million in 2016, which represents an increase of 93% compared to the same period last year. MTY currently has two credit facilities: A term loan with an authorized amount of $154.7 million as at May 31, 2017, (November 30, 2016- $165.0 million), and a revolving credit facility with an authorized amount of $150.0 million, (November 30, 2016- $150.0 million).
Page 16
The facilities have the following financial covenants: The Debt to EBITDA ratio must be less than or equal to 4.00:1.00 until July 20, 2017, 3.50:1.00 from
July 21, 2017 to July 20, 2018 and less than 3.00:1.00 thereafter. The fixed charges coverage ratio must be at 1.25:1.00 at all times.
The credit agreement also contains various limitations on distributions and on the usage of the proceeds from the disposal of assets which are not expected to impact the Company during the term of the credit agreement. Both the term loan and the revolving facility are repayable without penalty; minimum quarterly repayments on the term loan are $2.2 million. At quarter end, the Company was in compliance with the covenants of the credit agreement. In the short-term, management will continue to open new locations that will be funded by new franchisees. MTY will continue its efforts to sell some of its existing corporate owned locations and will seek new opportunities to acquire other food service operations. Financial position Accounts receivable at the end of the period were at $33.0 million, compared to $36.4 million at the end of the 2016 fiscal period. The decrease is due to timing of cash receipts. Loans receivable were $7.9 million at quarter end, $0.3 million lower than at November 30, 2016. The decrease is due to monthly payments received. Property, plant and equipment decreased by $2.1 million and intangible assets decreased by $9.0 million compared to prior year. The decrease is mostly due to amortization, as well as the foreign exchange impact on the assets held by the Company’s foreign subsidiaries. Property, plant and equipment also decreased due to the sale of multiple corporate stores in the USA. Accounts payable increased to $50.1 million as at May 31, 2017, from $44.3 million as at November 30, 2016. The $5.8 million increase is mostly due to the working capital adjustment of $4.2 million ($US3.2 million) related to the acquisition of Kahala Brands Ltd. Provisions, which are composed of litigation and dispute, closed store and gift card provisions, decreased to $74.3 million as at May 31, 2017 from $74.7 million as at November 30, 2016. The decrease is mostly due to the normal seasonality-related decreases in gift card provisions in the months of January and February and the recognition of gift card breakage revenue. Deferred revenues and deposits consist of distribution rights which are earned on a consumption basis, deferred rent payment received and include initial franchise fees to be earned once substantially all of the initial services have been performed. The balance as at May 31, 2017 was $23.5 million, an increase of $3.0 million since November 30, 2016. The increase stems mostly from new distribution rights received during the second quarter of 2017. These amounts will be recognized to income as they are earned. Long-term debt includes interest bearing term loans related to the acquisition of Kahala Brands Ltd., non-interest bearing holdbacks on acquisitions and non-interest bearing contract cancellation fees. During the six-month period, the Company repaid for $11.1 million of long-term debt. Further details on the above statement of financial position items can be found in the notes to the May 31, 2017 condensed interim consolidated financial statements.

Page 17
Location information MTY’s locations can be found in: i) food courts and shopping malls; ii) street front; and iii) non-traditional format within petroleum retailers, convenience stores, cinemas, amusement parks, in other venues or retailer shared sites, hospitals, universities and airports. The non-traditional locations are typically smaller in size, require lower investment and generate lower revenue than the shopping malls, food courts and street front locations.
Number of locations May 31, 2017 May 31, 2016
Franchises, beginning of period 5,599 2,695Corporate owned, beginning of year
Canada 31 40United States 51 3
Opened during the period 119 79 Closed during the period (227) (129)
Acquired during the period 20 — Reduction due to sale of Yogen Früz (99) —Total end of period 5,494 2,688 Franchises, end of period 5,428 2,649Corporate owned, end of period
Canada 33 36United States 33 3
Total end of period 5,494 2,688
During the first six months of 2017, the Company completed the acquisitions of the assets of La Diperie, which contributed 5 additional franchised stores, of Steak Frites St-Paul, which contributed 9 additional franchised stores, and of Giorgio Ristorante, which contributed 6 additional franchised stores. On February 1st, 2017, the Company sold its Yogen Früz Master franchise rights back to Yogen Früz Canada. This transaction resulted in a reduction of 99 locations to our store count. Excluding the three transactions above, the Company’s network opened 119 locations (60 in Canada, 33 in the United States and 26 International) and closed 227 locations (82 in Canada, 103 in the United States and 42 International) during the first half of 2017. The net reduction of 108 locations (60 in the first quarter and 48 in the second quarter) results from a multitude of factors, which includes competitive pressures, leases expiring and closure of underperforming stores. The average monthly sales for the stores closed during the first half of 2017 was approximately $17,800, while the average monthly sales of stores opened during the same period was approximately $27,700.
Page 18
The chart below provides the breakdown of MTY’s locations and system sales by type:
Location type % of location count
% of system sales six months ended
May 31 2017 2016
May 31 2017 2016
Shopping mall & food court 24% 39% 28% 45% Street front 48% 39% 56% 44% Non-traditional format 28% 22% 16% 11%
The geographical breakdown of MTY’s locations and system sales consists of:
Geographical location % of location count
% of system sales six months ended
May 31 2017 2016
May 31 2017 2016
Ontario 17% 37% 13% 27% Quebec & Eastern Canada 16% 34% 18% 39% Western Canada 10% 21% 11% 23% United States 48% 3% 50% 5% International 9% 5% 8% 6%
The system sales information presented in the two tables above contains the sales of the Kahala Brands Ltd. and BF Acquisition Holdings, LLC. networks for the first six months of 2017 but not for the same period in 2016. This explains the material variations in the proportion of locations and of sales realized in the presented regions. System wide sales During the first six months of 2017, MTY’s network generated $1,122.7 million in sales, an increase of 109% compared to the same period in 2016. The increase is distributed as follows:
Sales (millions of $) Reported sales – first six months of 2016 536.7 Net increase in sales generated by concepts acquired during 2016 583.0 Net increase in sales generated by concepts acquired during 2017 1.2 Net decrease resulting from the sale of the Yogen Früz network (4.9) Net increase resulting from stores opened in the last 18 months 40.5 Net decrease resulting from stores closed in the last 18 months (22.2) Impact of same store sales growth (9.4) Cumulative impact of foreign exchange variation (0.2) Other non-material variations (2.0) Reported sales – first six months of 2017 1,122.7
For the first six months of 2017, system sales totalled $1,122.7 million, compared to $536.7 million during the same period last year. The acquisitions of Kahala Brands Ltd. and BFAH in the second half of 2016 accounted for nearly all of the increase. The net impact of stores opened in the past 18 months contributed
Page 19
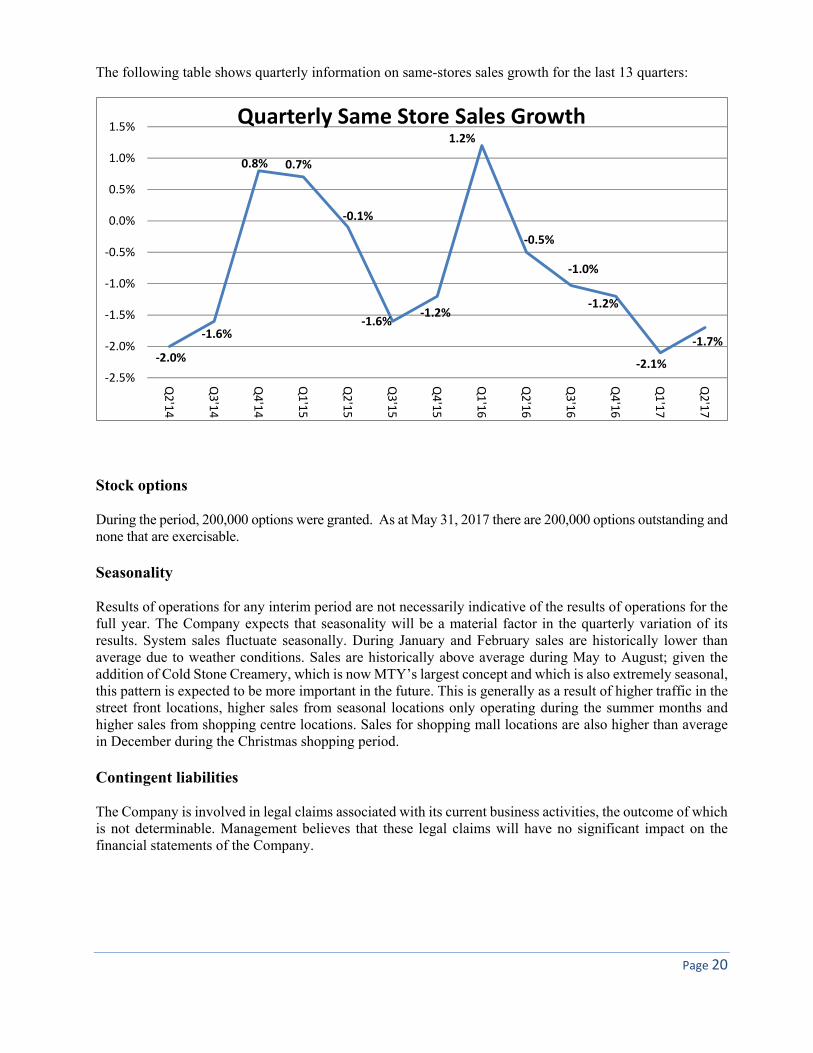
$40.5 million while the net impact of stores closed during the same period caused a reduction of $22.2 million. The negative same-store sales growth was also a factor, causing a net decreases of $9.4 million. During the second quarter of 2017, system sales reached $603.5 million, an increase of 120% over the comparable period last year. The increase is due to the acquisitions realized in the second half of 2016 and in the first half of 2017. During the first six months of 2017, only Cold Stone Creamery represented more than 10% of system sales, generating over one quarter of the total sales of MTY’s network. System wide sales include sales for corporate and franchise locations and exclude sales realized by the distribution center or by the food processing plant. Same store sales During the three months ended May 31, 2017, same store sales declined by 1.7% over the same period last year. Year to date, the decline is 2.0%. Excluding the impact of the leap year in 2016, the year to date decline would be approximately 1.5%. During the second quarter, same store sales for Canadian locations declined by 1.2%; the months of March and May were both positive, while the month of April proved to be exceptionally difficult across all provinces with a global decline of 4.0%. The April decline was mostly felt in Ontario and Quebec, which both experienced record rainfalls, floods and cooler than normal temperatures. The provinces of Alberta and Saskatchewan remained under significant pressure in the second quarter of 2017, with same store sales declines that were similar to those of previous quarters. At the other end of the spectrum, Quebec and British Columbia were both showing positive trends despite the temporary decline experienced in April. The stores acquired in the Kahala transaction, which are excluded from the consolidated numbers above, have generated a negative growth of 1.4% in the last three months, and 1.6% in the first half of 2017. Excluding the impact of the leap year, the year-to-date decline would have been approximately 1.1%, suffering from the impact of extremely weak months of December, March and May, during which all of our frozen treats brands have seen declines in same-store-sales. For the rest of 2017 and for 2018, management expects competition in both the Canadian and US markets to intensify further both from a price and an offering point of view. Although consumer confidence seems to be favorable at the moment, volatility in the price of commodities and currencies has a very material impact on employment rates and disposable income for MTY’s customers, resulting in uncertainty with respect to the future. Restaurants are also facing more and more competition for food dollars coming from various sources including retail stores and “grab and go” types of offering.
Page 20
The following table shows quarterly information on same-stores sales growth for the last 13 quarters:
Stock options During the period, 200,000 options were granted. As at May 31, 2017 there are 200,000 options outstanding and none that are exercisable. Seasonality Results of operations for any interim period are not necessarily indicative of the results of operations for the full year. The Company expects that seasonality will be a material factor in the quarterly variation of its results. System sales fluctuate seasonally. During January and February sales are historically lower than average due to weather conditions. Sales are historically above average during May to August; given the addition of Cold Stone Creamery, which is now MTY’s largest concept and which is also extremely seasonal, this pattern is expected to be more important in the future. This is generally as a result of higher traffic in the street front locations, higher sales from seasonal locations only operating during the summer months and higher sales from shopping centre locations. Sales for shopping mall locations are also higher than average in December during the Christmas shopping period. Contingent liabilities The Company is involved in legal claims associated with its current business activities, the outcome of which is not determinable. Management believes that these legal claims will have no significant impact on the financial statements of the Company.
‐2.0%
‐1.6%
0.8% 0.7%
‐0.1%
‐1.6%‐1.2%
1.2%
‐0.5%
‐1.0%
‐1.2%
‐2.1%
‐1.7%
‐2.5%
‐2.0%
‐1.5%
‐1.0%
‐0.5%
0.0%
0.5%
1.0%
1.5%
Q2'14
Q3'14
Q4'14
Q1'15
Q2'15
Q3'15
Q4'15
Q1'16
Q2'16
Q3'16
Q4'16
Q1'17
Q2'17
Quarterly Same Store Sales Growth

Page 21
Guarantee The Company has provided a guarantee in the form of a letter of credit for an amount of $1.9 million (November 30, 2016 - $1.8 million). Risks and uncertainties Despite the fact that the Company has various numbers of concepts, diversified in type of locations and geographics across Canada and the United States, the performance of the Company is also influenced by changes in demographic trends, traffic patterns, occupancy level of malls and office towers and the type, number, and location of competing restaurants. In addition, factors such as innovation, increased food costs, labour and benefits costs, occupancy costs and the availability of experienced management and hourly employees may adversely affect the Company. Changing consumer preferences and discretionary spending patterns could oblige the Company to modify or discontinue concepts and/or menus and could result in a reduction of revenue and operating income. Even if the Company was able to compete successfully with other restaurant companies with similar concepts, it may be forced to make changes in one or more of its concepts in order to respond to changes in consumer tastes or dining patterns. If the Company changes a concept, it may lose additional customers who do not prefer the new concept and menu, and it may not be able to attract a sufficient new customer base to produce the revenue needed to make the concept profitable. Similarly, the Company may have different or additional competitors for its intended customers as a result of such a concept change and may not be able to successfully compete against such competitors. The Company's success also depends on numerous factors affecting discretionary consumer spending, including economic conditions, disposable consumer income and consumer confidence. Adverse changes in these factors could reduce customer traffic or impose practical limits on pricing, either of which could reduce revenue and operating income. The growth of MTY is dependent on maintaining the current franchise system which is subject to the renewal of existing leases at sustainable rates, MTY’s ability to continue to expand by obtaining acceptable store sites and lease terms, obtaining qualified franchisees, increasing comparable store sales and completing acquisitions. The time, energy and resources involved in the integration of the acquired businesses into the MTY system and culture could also have an impact on MTY’s results. Off-balance sheet arrangement
MTY has no off-balance sheet arrangements. Related party transactions
Balances and transactions between the Company and its subsidiaries, which are related parties of the Company, have been eliminated on consolidation. Details of transactions between the Company and other related parties are disclosed below.
Page 22
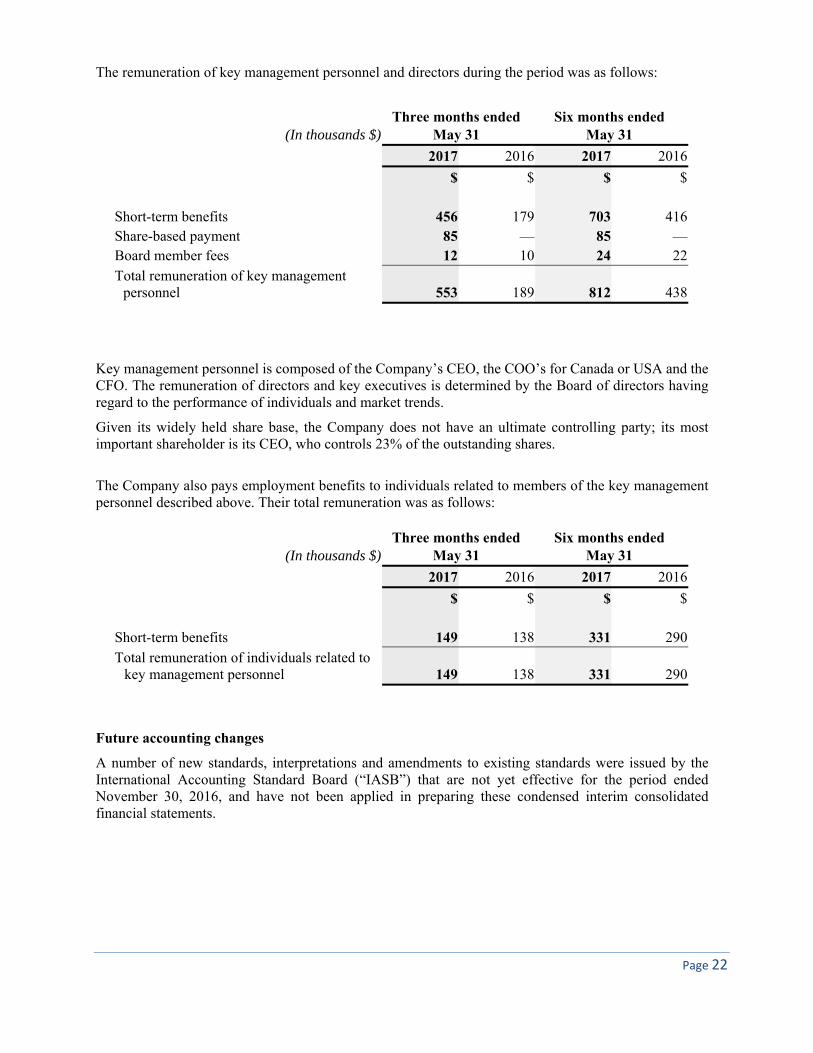
The remuneration of key management personnel and directors during the period was as follows:
(In thousands $)Three months ended
May 31 Six months ended
May 31
2017 2016 2017 2016
$ $ $ $ Short-term benefits 456 179 703 416Share-based payment 85 — 85 —Board member fees 12 10 24 22Total remuneration of key management
personnel 553 189 812 438
Key management personnel is composed of the Company’s CEO, the COO’s for Canada or USA and the CFO. The remuneration of directors and key executives is determined by the Board of directors having regard to the performance of individuals and market trends.
Given its widely held share base, the Company does not have an ultimate controlling party; its most important shareholder is its CEO, who controls 23% of the outstanding shares.
The Company also pays employment benefits to individuals related to members of the key management personnel described above. Their total remuneration was as follows:
(In thousands $)Three months ended
May 31 Six months ended
May 31
2017 2016 2017 2016
$ $ $ $ Short-term benefits 149 138 331 290Total remuneration of individuals related to
key management personnel 149 138 331 290
Future accounting changes
A number of new standards, interpretations and amendments to existing standards were issued by the International Accounting Standard Board (“IASB”) that are not yet effective for the period ended November 30, 2016, and have not been applied in preparing these condensed interim consolidated financial statements.
Page 23
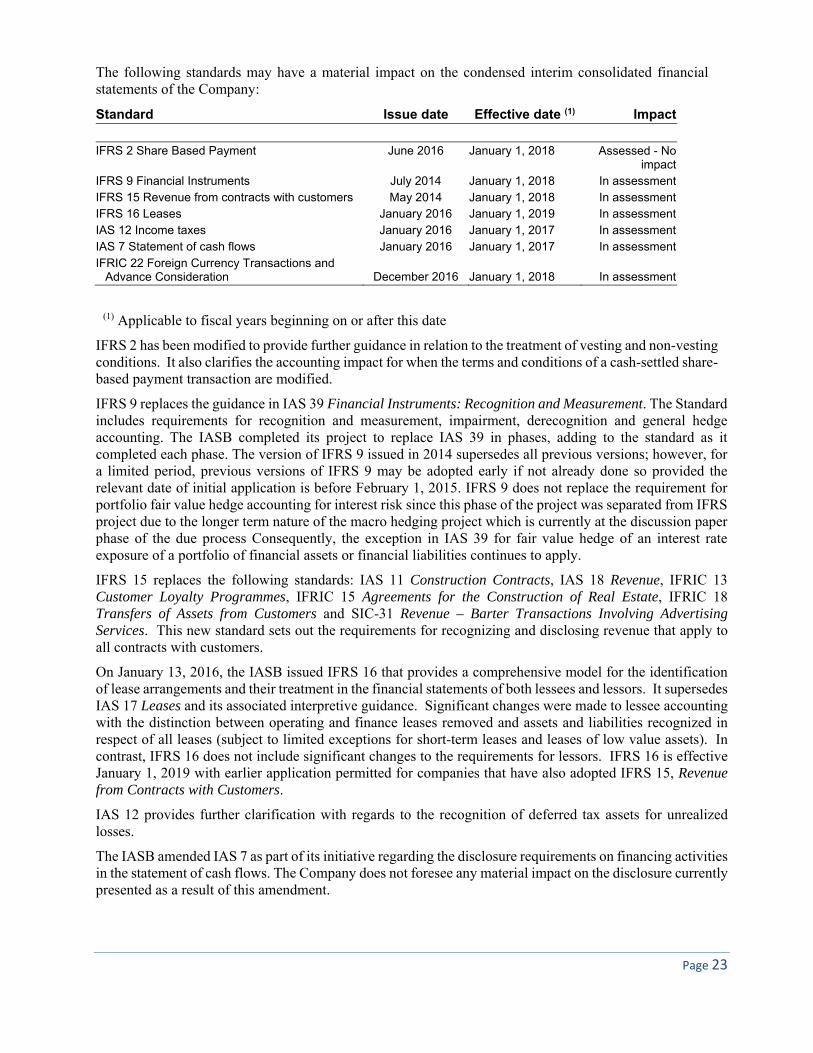
The following standards may have a material impact on the condensed interim consolidated financial statements of the Company:
Standard Issue date Effective date (1) Impact IFRS 2 Share Based Payment June 2016 January 1, 2018 Assessed - No
impactIFRS 9 Financial Instruments July 2014 January 1, 2018 In assessmentIFRS 15 Revenue from contracts with customers May 2014 January 1, 2018 In assessmentIFRS 16 Leases January 2016 January 1, 2019 In assessmentIAS 12 Income taxes January 2016 January 1, 2017 In assessmentIAS 7 Statement of cash flows January 2016 January 1, 2017 In assessmentIFRIC 22 Foreign Currency Transactions and
Advance Consideration December 2016 January 1, 2018 In assessment
(1) Applicable to fiscal years beginning on or after this date
IFRS 2 has been modified to provide further guidance in relation to the treatment of vesting and non-vesting conditions. It also clarifies the accounting impact for when the terms and conditions of a cash-settled share-based payment transaction are modified.
IFRS 9 replaces the guidance in IAS 39 Financial Instruments: Recognition and Measurement. The Standard includes requirements for recognition and measurement, impairment, derecognition and general hedge accounting. The IASB completed its project to replace IAS 39 in phases, adding to the standard as it completed each phase. The version of IFRS 9 issued in 2014 supersedes all previous versions; however, for a limited period, previous versions of IFRS 9 may be adopted early if not already done so provided the relevant date of initial application is before February 1, 2015. IFRS 9 does not replace the requirement for portfolio fair value hedge accounting for interest risk since this phase of the project was separated from IFRS project due to the longer term nature of the macro hedging project which is currently at the discussion paper phase of the due process Consequently, the exception in IAS 39 for fair value hedge of an interest rate exposure of a portfolio of financial assets or financial liabilities continues to apply.
IFRS 15 replaces the following standards: IAS 11 Construction Contracts, IAS 18 Revenue, IFRIC 13 Customer Loyalty Programmes, IFRIC 15 Agreements for the Construction of Real Estate, IFRIC 18 Transfers of Assets from Customers and SIC-31 Revenue – Barter Transactions Involving Advertising Services. This new standard sets out the requirements for recognizing and disclosing revenue that apply to all contracts with customers.
On January 13, 2016, the IASB issued IFRS 16 that provides a comprehensive model for the identification of lease arrangements and their treatment in the financial statements of both lessees and lessors. It supersedes IAS 17 Leases and its associated interpretive guidance. Significant changes were made to lessee accounting with the distinction between operating and finance leases removed and assets and liabilities recognized in respect of all leases (subject to limited exceptions for short-term leases and leases of low value assets). In contrast, IFRS 16 does not include significant changes to the requirements for lessors. IFRS 16 is effective January 1, 2019 with earlier application permitted for companies that have also adopted IFRS 15, Revenue from Contracts with Customers.
IAS 12 provides further clarification with regards to the recognition of deferred tax assets for unrealized losses.
The IASB amended IAS 7 as part of its initiative regarding the disclosure requirements on financing activities in the statement of cash flows. The Company does not foresee any material impact on the disclosure currently presented as a result of this amendment.

Page 24
IFRIC 22 clarifies the accounting for transactions that include the receipt or payment of advance consideration in a foreign currency.
The Company is in the process of assessing the impact of these standards on its condensed interim consolidated financial statements. Although the extent of the impact has not yet been determined, the Company expects that the adoption of IFRS 15 and IFRS 16 will result in material changes to its consolidated statement of income and consolidated statement of financial position. Economic environment risk The business of the Company is dependent upon numerous aspects of a healthy general economic environment, from strong consumer spending to provide sales revenue, to available credit to finance the franchisees and the Company. In light of recent upheaval in economic, credit and capital markets, the Company’s performance and market price may be adversely affected. The Company’s current planning assumptions forecast that the quick service restaurant industry will be impacted by the current economic recession in the provinces in which it operates. However, management is of the opinion that the current economic situation will not have a major impact on the Company due to the following reasons: 1) the Company has strong cash flows; 2) quick service restaurants represent an affordable dining out option for consumers in an economic slowdown. Financial instruments and financial risk exposure In the normal course of business, the Company uses various financial instruments which by their nature involve risk, including market risk and the credit risk of non-performance by counterparties. These financial instruments are subject to normal credit standards, financial controls, risk management as well as monitoring procedures.
Fair value of recognized financial instruments
The carrying amount of financial assets and financial liabilities of the Company are a reasonable approximation of fair value as at May 31, 2017 and as at November 30, 2016.
The Company, through its financial assets and liabilities, is exposed to various risks. The following analysis provides a measurement of risks as at May 31, 2017.
Credit risk
The Company’s credit risk is primarily attributable to its trade receivables. The amounts disclosed in the condensed interim consolidated statement of financial position are net of allowances for bad debts, estimated by the Company’s management based on past experience and counterparty specific circumstances. The Company believes that the credit risk of accounts receivable is limited for the following reasons:
- Other than receivables from international locations, the Company’s broad client base is spread mostly across Canada and USA, which limits the concentration of credit risk.
- The Company accounts for a specific bad debt provision when management considers that the expected recovery is less than the actual account receivable.
The credit risk on cash is limited because the Company invests its excess liquidity in high quality financial instruments and with credit-worthy counterparties.
The credit risk on the loans receivable is similar to that of accounts receivable. There is currently an allowance for doubtful accounts recorded for loans receivable of $0.7 million (November 30, 2016 - $0.9 million).
Page 25
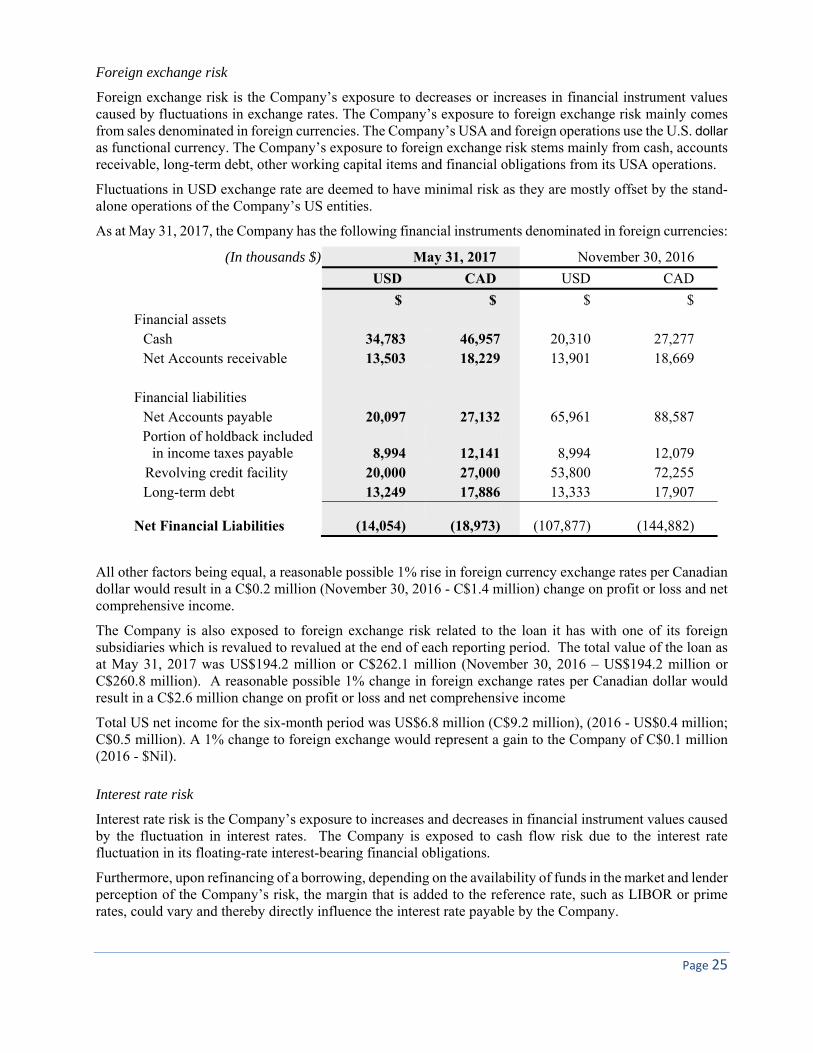
Foreign exchange risk
Foreign exchange risk is the Company’s exposure to decreases or increases in financial instrument values caused by fluctuations in exchange rates. The Company’s exposure to foreign exchange risk mainly comes from sales denominated in foreign currencies. The Company’s USA and foreign operations use the U.S. dollar as functional currency. The Company’s exposure to foreign exchange risk stems mainly from cash, accounts receivable, long-term debt, other working capital items and financial obligations from its USA operations.
Fluctuations in USD exchange rate are deemed to have minimal risk as they are mostly offset by the stand-alone operations of the Company’s US entities.
As at May 31, 2017, the Company has the following financial instruments denominated in foreign currencies:
(In thousands $) May 31, 2017 November 30, 2016
USD CAD USD CAD
$ $ $ $ Financial assets
Cash 34,783 46,957 20,310 27,277 Net Accounts receivable 13,503 18,229 13,901 18,669
Financial liabilities
Net Accounts payable 20,097 27,132 65,961 88,587 Portion of holdback included
in income taxes payable 8,994 12,141 8,994 12,079 Revolving credit facility 20,000 27,000 53,800 72,255
Long-term debt 13,249 17,886 13,333 17,907
Net Financial Liabilities (14,054) (18,973) (107,877) (144,882)
All other factors being equal, a reasonable possible 1% rise in foreign currency exchange rates per Canadian dollar would result in a C$0.2 million (November 30, 2016 - C$1.4 million) change on profit or loss and net comprehensive income.
The Company is also exposed to foreign exchange risk related to the loan it has with one of its foreign subsidiaries which is revalued to revalued at the end of each reporting period. The total value of the loan as at May 31, 2017 was US$194.2 million or C$262.1 million (November 30, 2016 – US$194.2 million or C$260.8 million). A reasonable possible 1% change in foreign exchange rates per Canadian dollar would result in a C$2.6 million change on profit or loss and net comprehensive income
Total US net income for the six-month period was US$6.8 million (C$9.2 million), (2016 - US$0.4 million; C$0.5 million). A 1% change to foreign exchange would represent a gain to the Company of C$0.1 million (2016 - $Nil).
Interest rate risk
Interest rate risk is the Company’s exposure to increases and decreases in financial instrument values caused by the fluctuation in interest rates. The Company is exposed to cash flow risk due to the interest rate fluctuation in its floating-rate interest-bearing financial obligations.
Furthermore, upon refinancing of a borrowing, depending on the availability of funds in the market and lender perception of the Company’s risk, the margin that is added to the reference rate, such as LIBOR or prime rates, could vary and thereby directly influence the interest rate payable by the Company.

Page 26
Long-term debt stems mainly from acquisitions of long-term assets and business combinations. The Company is exposed to interest rate risk with its revolving credit facility and term credit facility which were used to finance the Company’s acquisitions. Both facilities bear interest at a variable rate and as such the interest burden could change materially. $227.5 million of the credit facilities were used as at May 31, 2017 (November 30, 2016 - $237.3 million). A 100 basis points increase in the bank’s prime rate would result in additional interest of $2.3 million per annum (2016 - $2.4 million) on the outstanding credit facility.
Liquidity risk
Liquidity risk refers to the possibility of the Company not being able to meet its financial obligations when they become due. The Company has contractual and fiscal obligations as well as financial liabilities and is therefore exposed to liquidity risk. Such risk can result, for example, from a market disruption or a lack of liquidity. The Company actively maintains credit facilities to ensure it has sufficient available funds to meet current and foreseeable financial requirements at a reasonable cost.
As at May 31, 2017, the Company had authorized revolving credit facilities for which the available amount may not exceed, respectively, $154.7 million and $150.0 million to ensure that sufficient funds are available to meet its financial requirements. The terms and conditions related to these revolving credit facilities are described in note 13 of the condensed interim consolidated financial statements.
The following are the contractual maturities of financial liabilities as at May 31, 2017:
(In thousands $) Carrying
amount Contractual cash flows
0 to 6 months
6 to 12 months
12 to 24 months
thereafter
$ $ $ $ $ $
Accounts payable and accrued liabilities 50,071 50,071 50,071 — —
—
Portion of holdback included in income taxes payable 12,141 12,141 4,036 — 4,036
4,069Long-term debt 243,768 249,607 8,645 4,379 13,424 223,159Interest on long-term
debt (1) n/a 16,519 3,395 3,330 6,464 3,330 305,980 328,338 66,147 7,709 23,924 230,558
(1) When future interest cash flows are variable, they are calculated using the interest rates prevailing at the end of the reporting period
Outlook It is Management’s opinion that in the long-term the quick service and fast casual restaurants industry will continue to grow in response to the demand from busy and on-the-go consumers. In the very short term, management expects the significant pressures of the last few months to remain. Our primary focus will be on producing positive same store sales by generating more innovation and differentiating our offering, focusing on the quality of customer service in each of our outlets and maximizing the value offered to its customers. The quick service restaurant industry will remain challenging in the future, and management believes that the focus on the food offering, consistency and store design will give MTY’s restaurants a stronger position to face challenges. Given this difficult competitive context in which more restaurants compete for a finite
Page 27
amount of consumer dollars, each concept needs to preserve and improve the relevance of its offer to consumers. Management will also focus on identifying and acquiring high quality restaurant chains in Canada and in the United States. Management will maintain its focus on maximizing shareholder value by adding new locations of its existing concepts and remains committed to seek potential acquisitions to increase its market share. Controls and Procedures
Disclosure controls and procedures
Disclosure controls and procedures are designed to provide reasonable assurance that information required to be disclosed in reports filed with the securities regulatory authorities are recorded, processed, summarized and reported in a timely fashion. The disclosure controls and procedures are designed to ensure that information required to be disclosed by the Company in such reports is then accumulated and communicated to the Company’s management to ensure timely decisions regarding required disclosure. Management regularly reviews disclosure controls and procedures; however, they cannot provide an absolute level of assurance because of the inherent limitations in control systems to prevent or detect all misstatements due to error or fraud. The Company’s Chief Executive Officer and the Chief Financial Officer have concluded that the design of the disclosure controls and procedures (“DC&P”) as at May 31, 2017 provide reasonable assurance that significant information relevant to the Company, including that of its subsidiaries, is reported to them during the preparation of disclosure documents.
Internal controls over financial reporting
The Chief Executive Officer and the Chief Financial Officer are responsible for establishing and maintaining internal controls over financial reporting. The Company’s internal controls over financial reporting is designed to provide reasonable assurance regarding the reliability of financial reporting and the preparation of financial statements for external purposes in accordance with IFRS. The Chief Executive Officer and the Chief Financial Officer, together with Management, after evaluating the effectiveness of the Company’s internal controls over financial reporting as at May 31, 2017, have concluded that the Company’s internal controls over financial reporting was effective. The Chief Executive Officer and the Chief Financial Officer, together with Management, have concluded after having conducted an evaluation and to the best of their knowledge that, as at May 31, 2017, no change in the Company’s internal controls over financial reporting occurred that could have materially affected or is reasonably likely to materially affect the Company’s internal controls over financial reporting. Limitations of Controls and Procedures Management, including the President and Chief Executive Officer and Chief Financial Officer, believes that any disclosure controls and procedures or internal controls over financial reporting, no matter how well conceived and operated, can provide only reasonable, not absolute, assurance that the objectives of the control system are met. Further, the design of a control system must reflect the fact that there are resource constraints, and the benefits of controls must be considered relative to their costs. Because of the inherent limitations in all control systems, they cannot provide absolute assurance that all control issues and instances of fraud, if any, within the Company have been prevented or detected. These inherent limitations include the realities

Page 28
judgments in decision-making can be faulty, and that breakdowns can occur because of simple errors or mistakes. Additionally, controls can be circumvented by the individual acts of some persons, by collusion of two or more people, or by unauthorized override of the control. The design of any control system of controls also is based in part upon certain assumptions about the likelihood of future events, and there can be no assurance that any design will succeed in achieving its stated goals under all potential future conditions. Accordingly, because of the inherent limitations in a cost effective control system, misstatements due to error or fraud may occur and not be detected. Limitation on scope of design The Company’s management, with the participation of its President and Chief Executive Officer and Chief Financial Officer, has limited the scope of the design of the Company’s disclosure controls and procedures and internal controls over financial reporting to exclude controls, policies and procedures and internal controls over financial reporting of the recently acquired operations of, Kahala Brands Ltd. (acquired July 26, 2016), BF Acquisition Holdings, LLC (acquired October 5, 2016), La Diperie (acquired December 9, 2016) and Steak Frites St-Paul and Giorgio Ristorante (acquired May 8, 2017). The operations respectively represent 69%, 5%, 0% and 0% of the Company’s assets (35%, 6%, 0% and 0% of current assets, 74%, 5%, 0%and 0% of non-current assets); they also represent 70%, 3%, 0% and 0% of current liabilities and 29%, 0%, 0% and 0% of long-term liabilities, 45%, 6%, 0% and 0% of the Company’s revenues and 27%, 8%, 1% and 0% of the Company’s net earnings for the period ended May 31, 2017. The Company’s management, with the participation of its President and Chief Executive Officer and Chief Financial Officer, has limited the scope of the design of the Company’s disclosure controls and procedures and internal controls over financial reporting to exclude controls, policies and procedures and internal controls over financial reporting of certain special purpose entities (“SPEs”) on which the Company has the ability to exercise de facto control and which have as a result been consolidated in the Company’s condensed interim consolidated financial statements. For the period ended May 31, 2017, these SPEs represent 0% of the Company’s current assets, 0% of its non-current assets, 0% of the Company’s current liabilities, 0% of long-term liabilities, 2% of the Company’s revenues and 0% of the Company’s net earnings. “Stanley Ma” __________________________ Stanley Ma, Chief Executive Officer “Eric Lefebvre” __________________________ Eric Lefebvre, CPA, CA, MBA Chief Financial Officer