management’s discussion and analysis (md&a) - cwb …/media/cwb group/documents… · ·...
TRANSCRIPT

CWB Financial Group 2016 Annual Report14
Management’s Discussion and Analysis (MD&A)
BUSINESS PROFILE AND STRATEGYCanadian Western Bank (TSX:CWB) is the only Schedule 1 bank in Canada specializing in mid-market commercial banking, real estate and construction financing, and equipment financing and leasing. CWB, along with its subsidiaries, National Leasing Group Inc. (National Leasing), CWB Maxium Financial Inc. (CWB Maxium), Canadian Western Trust Company (CWT), CWB Wealth Management Ltd. (CWB WM), Adroit Investment Management Ltd. (Adroit), McLean & Partners Wealth Management Ltd. (McLean & Partners) and Canadian Western Financial Ltd. (CWF), are together known as CWB Financial Group (CWB).
Clients recognize CWB for our in-depth knowledge of targeted segments within Canada’s commercial banking industry and our unique brand of personal service. Shareholders value CWB’s strong track record of high-quality, industry-leading growth, conservative approach to risk management and consistent profitability. We define success as a well-funded, well-capitalized mid-market commercial banking franchise deserving of a premium price-to-earnings multiple based on strong core operating performance and consistent growth of earnings and profitability from current levels.
Our balanced growth strategy is based on delivery of responsive, personalized service and sensible financial solutions. We remain committed to our fundamental identity as a conservative, growth-oriented organization, and we maintain a supportive environment for employees within a results-oriented culture. Our focus is to empower our people to deliver the highest level of client service, accelerate growth of multi-product client relationships, and optimize our capital and risk management processes. We aim to provide strong long-term returns for shareholders and give back within the communities where we live and work.
Our strategic objectives include strong, balanced growth of both loans and funding sources, as well as progress toward a more balanced geographic footprint with broader diversification across targeted sectors of Canada’s commercial banking industry. These objectives are
complemented by specific goals related to risk and capital management, and business transformation through targeted use of technology.
To complement our commercial banking focus, CWB’s full-service banking strategy delivers a wide variety of personal financial products and services, including personal loans and mortgages, deposit accounts and investment products. Customer access to all banking services is primarily provided through a network of 42 client-focused branches in select locations across the four western provinces. Canadian Direct Financial® (CDF) is CWB’s Internet-based division offering a range of deposit and registered savings products directly to customers in all provinces and territories except Quebec.
National Leasing specializes in small- and mid-sized commercial equipment leases and is represented across all provinces of Canada. CWB Maxium provides loans, leases and structured financing to clients primarily in Ontario. CWB Franchise Finance is a specialty lending division that provides loans and leases to hotel and restaurant franchises across the country. CWB Optimum Mortgage (Optimum) underwrites and administers residential mortgages sourced through an extensive network of mortgage brokers located in Western Canada, Ontario and Atlantic Canada. CWT provides trustee and custody services to independent financial advisors, corporations, brokerage firms and individuals. Comprehensive wealth advisory services are offered through CWB Wealth Management. This includes discretionary wealth management primarily for high net-worth individuals provided through Adroit and McLean & Partners, as well as third-party mutual funds and the proprietary CWB Core Funds and CWB Onyx Portfolio Series of mutual funds offered with financial and investment planning advice through CWB’s branch network.
TABLE OF CONTENTSBUSINESS PROFILE AND STRATEGY 14
VISION 15
FISCAL 2016 SIGNIFICANT EVENTS 15
FORWARD-LOOKING STATEMENTS 16
TAXABLE EQUIVALENT BASIS (TEB) 16
NON-IFRS MEASURES 16
CWB FINANCIAL GROUP
PERFORMANCE 18
OVERVIEW 18
NET INTEREST INCOME 23
NON-INTEREST INCOME 24
NON-INTEREST EXPENSES, EFFICIENCY
AND OPERATING LEVERAGE 26
ACQUISITION-RELATED FAIR VALUE
CHANGES 28
INCOME TAXES 28
RESULTS OF DISCONTINUED
OPERATIONS 29
COMPREHENSIVE INCOME 30
CASH AND SECURITIES 30
LOANS 31
CREDIT QUALITY 35
DEPOSITS 38
OTHER ASSETS AND OTHER LIABILITIES 39
LIQUIDITY MANAGEMENT 40
CAPITAL MANAGEMENT 42
FINANCIAL INSTRUMENTS AND
OTHER INSTRUMENTS 45
ACQUISITIONS AND DIVESTITURES 46
OFF-BALANCE SHEET 46
SUMMARY OF QUARTERLY
RESULTS AND FOURTH QUARTER 47
QUARTERLY RESULTS 47
FOURTH QUARTER OF 2016 49
ACCOUNTING POLICIES
AND ESTIMATES 50
CRITICAL ACCOUNTING ESTIMATES 50
CHANGES IN ACCOUNTING POLICIES
AND FINANCIAL STATEMENT
PRESENTATION 52
FUTURE CHANGES IN
ACCOUNTING POLICIES 52
RISK MANAGEMENT 53
RISK MANAGEMENT OVERVIEW 54
REPORT ON PRINCIPAL RISKS 59
CREDIT RISK 59
MARKET RISK 61
CAPITAL RISK 66
OPERATIONAL RISK 67
OTHER RISK FACTORS 69
UPDATED SHARE INFORMATION 70
CONTROLS AND PROCEDURES 70

CWB Financial Group 2016 Annual Report 15
VISION To be seen as crucial to our clients' futures.
CWB is focused on becoming the trusted financial partner to a growing base of clients. Our teams focus on key activities which contribute the greatest impact toward the achievement of our vision to be seen as crucial to our clients’ futures. We track both financial and non-financial measures within four interdependent realms of activity (People, Support, Clients, Financial) to monitor progress toward achievement of our strategic objectives:
People (P)Invest in our people;
Live our values
Support (S)Balance risk and reward;
Drive operational ef�ciency;Build funding sources
Clients (C)Be the trusted
�nancial partner
Financial (F)Deliver pro�table growth
pro�table growth
investment
CWBrelationships
The consolidated financial statements have been prepared in accordance with International Financial Reporting Standards (IFRS) and are presented in Canadian dollars.
The following pages contain management’s discussion of the financial performance of CWB and a summary of quarterly results. Additional information relating to CWB, including the Annual Information Form, is available on SEDAR at sedar.com and on CWB’s website at cwb.com.
FISCAL 2016 SIGNIFICANT EVENTS
Strategic Acquisitions
On March 1, 2016, CWB acquired the non-securitized lending assets and other net business assets, including key employees, of Maxium Financial Services Inc. and Desante Financial Services Inc., now “CWB Maxium”. CWB Maxium provides loans, equipment leases and structured financing solutions to more than 35,000 clients, mainly in Ontario. Specialized financing solutions are primarily provided in the areas of health care, golf, transportation, real estate and general corporate financing. On July 1, 2016, CWB acquired GE Capital’s Canadian Franchise Finance platform, now “CWB Franchise Finance”. The business provides financing across Canada to a diverse group of established companies in the franchised hotel and restaurant industries.
These acquisitions are integral components of CWB’s balanced growth strategy, and represent the strategic redeployment of divestiture gains realized last year. With 70 − 80% of both portfolios based outside of Western Canada and the majority of originations focused within the general commercial sector, CWB Maxium and CWB Franchise Finance will contribute to the targeted expansion of CWB’s geographic footprint and further diversification of its asset mix. In combination, the acquisitions were slightly accretive to adjusted cash earnings per share this year, with accelerating contributions expected going forward. Details as to financial consideration are disclosed within the Acquisitions and Divestitures section of this MD&A.
Core Banking System Implementation
CWB’s earnings growth and business diversification are expected to benefit from ongoing success in key strategic initiatives to broaden and deepen multi-product client relationships and attract new clients. The successful launch of CWB’s new core banking system on May 2, 2016, is expected to facilitate these initiatives over the medium term and advance efforts to build core funding sources, enhance product and service offerings, and leverage current and future investment in technology. This improved technology will enable CWB to benefit from a client-centric view of branch-based relationships and achieve further operational efficiencies. The new system will also support CWB’s application for transition to the Advanced Internal Ratings Based (AIRB) methodology for managing credit risk and calculating risk-weighted assets. A project plan has been finalized in support of CWB’s application, including an anticipated three-year time frame.
Oil and Gas-related Provisions for Credit Losses
Credit quality as measured by the provision for credit losses outside of CWB’s small portfolio of oil and gas loans was consistent with management’s expectations. This reflected CWB’s secured lending business model, disciplined underwriting practices and proactive loan management. However, significantly higher provisioning within the oil and gas loans portfolio resulted from the impact of persistently low and volatile energy commodity prices on producer cash flows, as well as the influence of regulatory factors on the liquidity of assets securing these exposures. In view of these factors, management took a proactive approach to resolve positions within this portfolio and recorded cumulative provisions for credit losses on oil and gas production loans of $41.6 million. Prior to reporting second quarter financial results, management announced revised expectations for the annual provision for credit losses of 35 – 45 basis points, compared with previous expectations of 18 – 23 basis points. The realized annual provision for credit losses of 38 basis points was consistent with these revised expectations, with the increase from 17 basis points last year entirely attributed to the credit performance of oil and gas loans.

CWB Financial Group 2016 Annual Report16
FORWARD-LOOKING STATEMENTSFrom time to time, CWB makes written and verbal forward-looking statements. Statements of this type are included in the Annual Report and reports to shareholders and may be included in filings with Canadian securities regulators or in other communications such as press releases and corporate presentations. Forward-looking statements include, but are not limited to, statements about CWB’s objectives and strategies, targeted and expected financial results and the outlook for CWB’s businesses or for the Canadian economy. Forward-looking statements are typically identified by the words “believe”, “expect”, “anticipate”, “intend”, “estimate”, “may increase”, “may impact”, “goal”, “focus”, “potential”, “proposed” and other similar expressions, or future or conditional verbs such as “will”, “should”, “would” and “could”.
By their very nature, forward-looking statements involve numerous assumptions and are subject to inherent risks and uncertainties, which give rise to the possibility that management’s predictions, forecasts, projections, expectations and conclusions will not prove to be accurate, that its assumptions may not be correct and that its strategic goals will not be achieved.
A variety of factors, many of which are beyond CWB’s control, may cause actual results to differ materially from the expectations expressed in the forward-looking statements. These factors include, but are not limited to, general business and economic conditions in Canada, including the volatility and level of liquidity in financial markets, fluctuations in interest rates and currency values, the volatility and level of various commodity prices, changes in monetary policy, changes in economic and political conditions, legislative and regulatory developments, legal developments, the level of competition, the occurrence of natural catastrophes, changes in accounting standards and policies, the accuracy and completeness of information CWB receives about customers and counterparties, the ability to attract and retain key personnel, the ability to complete and integrate acquisitions, reliance on third parties to provide components of business infrastructure, changes in tax laws, technological developments, unexpected changes in consumer spending and saving habits, timely development and introduction of new products, and management’s ability to anticipate and manage the risks associated with these factors. It is important to note that the preceding list is not exhaustive of possible factors.
Additional information about these factors can be found in the Risk Management section of this MD&A. These and other factors should be considered carefully, and readers are cautioned not to place undue reliance on these forward-looking statements as a number of important factors could cause CWB’s actual results to differ materially from the expectations expressed in such forward-looking statements. Unless required by securities law, CWB does not undertake to update any forward-looking statement, whether written or verbal, that may be made from time to time by it or on its behalf.
Assumptions about the performance of the Canadian economy over the forecast horizon and how it will affect CWB’s businesses are material factors considered when setting organizational objectives and targets. In determining expectations for economic growth, management primarily considers economic data and forecasts provided by the Canadian government and its agencies, as well as an average of certain private sector forecasts. These forecasts are subject to inherent risks and uncertainties that may be general or specific. Where relevant, material economic assumptions underlying forward-looking statements are disclosed within the Outlook sections of this MD&A.
TAXABLE EQUIVALENT BASIS (TEB)Most banks analyze revenue on a taxable equivalent basis to permit uniform measurement and comparison of net interest income. Net interest income (as presented in the consolidated statements of income) includes tax-exempt income on certain securities. Since this income is not taxable, the rate of interest or dividends received is significantly lower than would apply to a loan or security of the same amount. The fiscal 2016 adjustment to taxable equivalent basis from Continuing Operations of $3.2 million (2015 – $5.6 million) increases interest income and the provision for income taxes to what they would have been had the tax-exempt securities been taxed at the statutory rate. The taxable equivalent basis does not have a standardized meaning prescribed by IFRS and, therefore, may not be comparable to similar measures presented by other banks. Total revenues, net interest income and income taxes are discussed on a taxable equivalent basis throughout this MD&A.
NON-IFRS MEASURESTaxable equivalent basis, adjusted cash earnings per common share, pre-tax, pre-provision income, return on common shareholders’ equity, adjusted return on common shareholders’ equity, return on assets, efficiency ratio, net interest margin, common equity Tier 1, Tier 1 and total capital adequacy ratios, operating leverage, common share dividend payout ratio and average balances do not have standardized meanings prescribed by IFRS and therefore may not be comparable to similar measures presented by other financial institutions. The non-IFRS measures used in this MD&A are calculated as follows:
• Taxable equivalent basis – described above.
• Pre-tax, pre-provision income – total revenue (teb) less non-interest expenses, excluding the pre-tax amortization of acquisition-related intangible assets (see calculation on page 17).
• Adjusted cash earnings per common share – diluted earnings per common share excluding the acquisition-related amortization of intangible assets and contingent consideration fair value changes, net of tax (see calculation on page 17). Excluded items are not considered to be indicative of ongoing business performance.
• Return on common shareholders’ equity – common shareholders’ net income divided by average common shareholders’ equity.
• Adjusted return on common shareholders’ equity – common shareholders’ net income excluding the acquisition-related amortization of intangible assets and contingent consideration fair value changes, net of tax (see calculation on page 17), divided by average common shareholders’ equity.
• Return on assets – common shareholders’ net income divided by average total assets.
• Efficiency ratio – non-interest expenses, excluding the pre-tax amortization of acquisition-related intangible assets (see calculation on page 17), divided by total revenues, including the net gain related to the sales of the property and casualty insurance subsidiary and CWB’s stock transfer business.
• Operating leverage – total revenue (teb) growth less growth of non-interest expenses, excluding the pre-tax amortization of acquisition-related intangible assets.
• Net interest margin – net interest income divided by average total assets.
• Basel III common equity Tier 1, Tier 1 and total capital ratios under the Standardized approach for calculating risk-weighted assets – in accordance with guidelines issued by the Office of the Superintendent of Financial Institutions Canada (OSFI).
• Common share dividend payout ratio − common share dividends declared during the year divided by common shareholders’ net income.
• Average balances – average daily balances.

CWB Financial Group 2016 Annual Report 17
Table 1 - Adjusted Financial Measures (Continuing Operations)(1)
($ thousands)
2016 2015
Non-interest expenses $ 313,647 $ 293,489
Adjustments (pre-tax):
Amortization of acquisition-related intangible assets (6,354) (4,548)
Adjusted non-interest expenses $ 307,293 $ 288,941
Common shareholders' net income from Continuing Operations $ 177,761 $ 208,064
Adjustments (after-tax):
Amortization of acquisition-related intangible assets 4,682 3,006
Acquisition-related fair value changes 5,775 638
Adjusted common shareholders' net income $ 188,218 $ 211,708
Table 2 - Adjusted Financial Measures (Combined Operations)(1)
($ thousands)
2016 2015
Non-interest expenses $ 313,647 $ 304,593
Adjustments (pre-tax):
Amortization of acquisition-related intangible assets (6,354) (4,548)
Adjusted non-interest expenses $ 307,293 $ 300,045
Common shareholders' net income from Combined Operations $ 177,761 $ 319,701
Adjustments (after-tax):
Amortization of acquisition-related intangible assets 4,682 3,006
Contingent consideration fair value changes 5,775 638
Adjusted common shareholders' net income $ 188,218 $ 323,345
Table 3 - Pre-tax, Pre-provision (PPTP) Income (Continuing Operations)(1)
($ thousands)
2016 2015
Total revenue (teb) $ 661,136 $ 617,000
Less:
Adjusted non-interest expenses (see above) 307,293 288,941
Pre-tax, pre-provision income $ 353,843 $ 328,059
(1) See footnote 2 on page 19.

CWB Financial Group 2016 Annual Report18
CWB FINANCIAL GROUP PERFORMANCE
OVERVIEW
Highlights of 2016 for Continuing Operations (compared to 2015)• Completed the acquisitions now known as CWB Maxium Financial
and CWB Franchise Finance, supporting CWB’s strategic objective to achieve further geographic and business diversification within targeted segments of the commercial banking industry.
• Successfully launched CWB’s new core banking system, a key technology investment which is expected to facilitate business process improvements that will empower CWB teams to deliver the highest level of client service, accelerate growth of multi-product client relationships, and optimize CWB’s capital and risk management processes.
• Opened CWB’s 42nd full-service branch through expansion of operations in Lloydminster, Saskatchewan.
• Very strong, well-diversified loan growth of 13%, marking the achievement of double-digit annual loan growth for the 26th time in 27 years.
• Very strong branch-raised deposit growth of 12%, including 15% growth of targeted notice and demand deposits.
• Strong core operating performance, with pre-tax, pre-provision income of $353.8 million, up 8%, and positive operating leverage.
• Common shareholders’ net income of $177.8 million, down 15%.
• Diluted earnings per common share of $2.13, down 18%, and adjusted cash earnings per common share of $2.26, down 14%.
• Earnings growth constrained by credit performance of oil and gas loans and continued net interest margin pressure.
• Provision for credit losses as a percentage of average loans of 38 basis points, up from 17 basis points due to losses related to oil and gas loans. The full year provision was within CWB’s expectation of 35 – 45 basis points, revised from 18 – 23 basis points prior to CWB reporting second quarter financial results. Excluding oil and gas-related credit losses, the annual provision was 18 basis points of average loans. Gross impaired loans represented 0.58% of total loans, up from 0.49%, primarily due to increased impairments within Alberta.
• Net interest margin (teb) of 2.43%, down 13 basis points. The change primarily reflects lower asset yields, partly due to the impact of the Bank of Canada’s 2015 rate cuts, partially offset by the positive impact of these rate cuts on some deposit costs and favourable changes in deposit mix.
• Strengthened capital position through issuance of $150 million of common shares and $140 million of preferred shares, contributing to very strong Basel III regulatory capital ratios under the Standardized approach for calculating risk-weighted assets of 9.2% common equity Tier 1 (CET1), 11.0% Tier 1 and 13.1% total capital.

CWB Financial Group 2016 Annual Report 19
Table 4 - Select Annual Financial Information(1)
($ thousands, except per share amounts)
Change from 2015
2016 2015 2014 $ %
Key Performance Indicators (Continuing Operations)(2)
Total revenues (teb) $ 661,136 $ 617,000 $ 590,343 $ 44,136 7%
Total revenues 657,896 611,420 583,600 46,476 8
Pre-tax, pre-provision income (teb) 353,843 328,059 325,720 25,784 8
Common shareholders' net income 177,761 208,064 205,288 (30,303) (15)
Earnings per share
Basic 2.13 2.59 2.57 (0.46) (18)
Diluted 2.13 2.59 2.54 (0.46) (18)
Adjusted cash 2.26 2.63 2.59 (0.37) (14)
Return on common shareholders' equity 9.3 % 12.4% 13.9 % (310) bp(3)
Adjusted return on common shareholders' equity 9.9 12.6 14.2 (270)
Return on assets 0.73 0.97 1.05 (24)
Efficiency ratio (teb)(4) 46.5 46.8 44.8 (30)
Efficiency ratio(4) 46.7 47.3 45.4 (60)
Net interest margin (teb) 2.43 2.56 2.59 (13)
Net interest margin 2.41 2.53 2.56 (12)
Operating leverage 1 (5) - 600
Provision for credit losses as a percentage of average loans 0.38 0.17 0.15 21
Key Performance Indicators (Combined Operations)(2)
Common shareholders' net income $ 177,761 $ 319,701 $ 218,549 $ (141,940) (44)%
Earnings per share
Basic 2.13 3.97 2.73 (1.84) (46)
Diluted 2.13 3.97 2.70 (1.84) (46)
Adjusted cash 2.26 4.01 2.76 (1.75) (44)
Return on common shareholders' equity 9.3 % 19.1% 14.8 % (980) bp(3)
Adjusted return on common shareholders' equity 9.9 19.3 15.1 (940)
Return on assets 0.73 1.48 1.10 (75)
Key Performance Indicators (Discontinued Operations)(2)
Common shareholders' net income $ - $ 111,637 $ 13,261 $ (111,637) (100)%
Earnings per common share
Basic - 1.38 0.16 (1.38) (100)
Diluted - 1.38 0.16 (1.38) (100)
Adjusted cash - 1.38 0.17 (1.38) (100)
Other Financial Information (Combined Operations)(2)
Total assets $ 25,222,549 $ 22,838,527 $ 20,635,046 $ 2,384,022 10%
Dividends per common share 0.92 0.86 0.78 0.06 7
(1) See page 16 for a discussion of teb and non-IFRS measures.(2) On May 1, 2015, CWB sold its property and casualty insurance subsidiary and CWB’s stock transfer business as described in Note 3 of the annual consolidated financial statements. Revenues, expenses and gains on sale associated with
the businesses sold are defined and classified on the consolidated statements of income for prior periods as “Discontinued Operations”. The remaining operations are defined as “Continuing Operations”, and the total Continuing Operations and Discontinued Operations are defined as “Combined Operations”. Total revenues from Combined Operations in 2015 include $107.8 million of divestiture gains. Return on shareholders’ equity reflects equity from Combined Operations. All other measures reflect either Continuing or Combined Operations as indicated.
(3) bp – basis points.(4) A decrease in the ratio reflects improved efficiency, while an increase reflects deterioration.

CWB Financial Group 2016 Annual Report20
Summary of Continuing Operations
CWB’s core operating performance was strong based on achievement of record total revenues and 8% growth of pre-tax, pre-provision income to $353.8 million. However, common shareholders’ net income of $177.8 million was 15% lower. Growth of 7% in net interest income (teb) was driven by very strong 13% loan growth, partially offset by the impact of a 13 basis point reduction in net interest margin (teb) to 2.43%. Of note, 2016 marked the 26th time in 27 years CWB has achieved double-digit loan growth. Loan growth within British Columbia (BC) and Ontario accounted for more than 90% of the increase from 2015. The balance of outstanding loans in Alberta was relatively unchanged compared to last year. Very strong overall loan growth in view of the challenging operating environment in the oil-producing provinces demonstrates the benefit of CWB’s balanced growth strategy, which includes strategic objectives to achieve a more balanced geographic footprint and broader diversification within targeted sectors of Canada’s commercial banking industry. Non-interest income was also 7% higher, mainly due to growth of credit related fees, lower net losses on securities and increased trust services revenue. These positive factors were more than offset by an increase in the annual provision for credit losses to 38 basis points as a percentage of average loans, compared to 17 basis points last year, and a 7% increase in non-interest expenses. Although credit quality outside of CWB’s portfolio of oil and gas loans remained stable, higher provisions for credit losses resulted from losses recorded against oil and gas loans. The increase in non-interest expenses primarily reflects higher salaries and benefits, including the impact of acquisition-related increases in staffing, as well as the addition of amortization and sustainment costs related to the new core banking system and increased premises and other expenses to facilitate business growth. Further constraining growth of common shareholders’ net income, acquisition-related fair value changes were $7.9 million, compared to $0.6 million last year, and preferred share dividends of $10.6 million were up from $5.5 million. Diluted earnings per common share of $2.13 were down 18%, and adjusted cash earnings per common share of $2.26 were down 14%, reflecting the factors described above and the issuance of common shares.
Adjusted return on common shareholders’ equity (ROE) of 9.9% was down from 12.6% in 2015, reflecting both lower earnings, the issuance of common shares and the impact of divestiture gains on total shareholders’ equity prior to re-deployment through acquisition. Total cash dividends paid to common shareholders of $0.92 per share increased 7% from $0.86 per share paid in the prior year, and resulted in a 2016 dividend payout ratio of 43% of total common shareholders’ net income.
Total assets increased 10% to reach $25,223 million. Loan growth of 13% was very strong, and deposits grew 9%, to reach $21,961 million and $21,195 million, respectively. Total branch-raised deposits increased 12%, while the demand and notice component within branch-raised deposits was up 15%. Strong growth in branch-raised deposits, including the demand and notice component, reflects the success of ongoing strategies to further enhance and diversify core funding sources. Total branch-raised deposits represented 55% of total deposits at October 31, 2016, up from 54% a year earlier. The demand and notice component comprised 36% of total deposits, up from 35% last year. The balance of deposits raised through the capital markets represented 9% of total funding, compared to 10% at October 31, 2015, while the proportion of total funding represented by personal fixed rate term deposits raised through the deposit broker network was unchanged at 36%. The ratio of total deposits to total loans at October 31, 2016 was effectively 1:1, relatively unchanged from a year earlier.
The maintenance of solid capital levels is fundamental to CWB’s objectives to effectively manage risks and support strong growth. CWB’s Basel III CET1, Tier 1 and total capital ratios at October 31, 2016 of 9.2%,
11.0% and 13.1%, respectively, were above both internal and regulatory minimums. OSFI’s minimum Basel III regulatory capital ratios for CWB, which include a 250 basis point capital conservation buffer, are 7.0% CET1, 8.5% Tier 1 and 10.5% total capital. The increase in CWB’s CET1 capital ratio from last year mainly reflects the issuance of $150 million of common shares. Higher Tier 1 and Total capital ratios compared to last year reflect the issuance of $140 million of non-cumulative 5-year rate reset First Preferred Shares Series 7 (Non-Viability Contingent Capital), partially offset within Total capital by the redemption of $300 million of subordinated debentures.
Summary of Combined Operations
Common shareholders’ net income of $177.8 million was down from $319.7 million in 2015. Diluted earnings per share of $2.13 compared to $3.97, and adjusted cash earnings per common share of $2.26 decreased from $4.01. Excluding the impact of $107.8 million of divestiture gains and six months of operating contributions from divested businesses last year, the changes in common shareholders’ net income and earnings per share reflect the factors discussed within the overview of Continuing Operations above. Adjusted ROE for the year of 9.9% was down from 19.3% last year when divestiture gains were realized.

CWB Financial Group 2016 Annual Report 21
Medium-term Performance Target Ranges CWB’s medium-term performance target ranges are unchanged from last year. Targets reflect key areas of shareholder value, the objectives embedded within CWB’s strategic direction and a time horizon
consistent with the longer-term interests of CWB shareholders. Target ranges for key financial metrics over a three- to five-year time horizon are presented in the following table:
Medium-term Performance
Target Ranges Current Context
Adjusted cash earnings per common share growth(1) 7 - 12%
Earnings and profitability for 2016 reflect the credit performance of CWB’s oil and gas loans, lower net interest margin and the issuance of common shares.Adjusted return on common
shareholders’ equity(2)12 - 15%
Operating leverage(3) Positive Fiscal 2016 operating leverage was positive 1%.
Common equity Tier 1 capital ratio under the Standardized approach(4) Strong Q4 2016 ratio of 9.2% is very strong.
Common share dividend payout ratio(5) ~30%Fiscal 2016 ratio of 43% includes the impact of credit performance of oil and gas loans and the issuance of common shares.
(1) Adjusted cash earnings per common share is calculated as diluted earnings per common share excluding the acquisition-related amortization of intangible assets and the contingent consideration fair value changes, net of tax, which represent charges that are not considered to be indicative of ongoing operating performance. Performance for adjusted cash earnings per common share is the current year results over the prior year results.
(2) Adjusted return on common shareholders’ equity is calculated as common shareholders’ net income excluding the acquisition-related amortization of intangible assets and the contingent consideration fair value changes, net of tax, divided by average common shareholders’ equity.
(3) Operating leverage is calculated as total revenue (teb) growth, less growth of non-interest expenses excluding the pre-tax amortization of acquisition-related intangible assets.(4) Common equity Tier 1 capital ratio is calculated in accordance with Basel III guidelines issued by the Office of the Superintendent of Financial Institutions Canada (OSFI) using the Standardized approach for credit risk.(5) Common share dividend payout ratio is calculated as common share dividends declared during the year divided by common shareholders’ net income.
Medium-term performance target ranges are based on expectations for moderate economic growth and a relatively stable interest rate environment in Canada over the three- to five-year forecast horizon. Achievement of overall financial results within these target ranges will be largely driven by CWB’s commitment to continue to deliver ongoing strong loan growth at levels relatively consistent with recent performance, further optimization of CWB’s funding mix, strong credit quality, effective expense management in consideration of revenue growth opportunities and prudent capital management.
Outlook for Continuing Operations
Financial performance over a three- to five-year time frame is expected to be consistent with CWB’s medium-term targets, and to benefit from an expanding geographic footprint with increased business diversification. Ongoing success in key strategic initiatives to enhance client offerings, build core funding sources, and leverage current and future investment in technology is also expected to support strong financial performance over the medium-term. Management expects earnings growth and profitability to fall below medium-term target ranges in fiscal 2017. This reflects expectations for ongoing pressure on net interest margin, incremental increases in CWB’s expense base, mainly related to implementation of the new core banking system, a higher share count following the issuance of common shares in 2016, as well as the impact of the current recession in Alberta and Saskatchewan on loan growth and credit quality within those provinces.
Management expects CWB’s earnings growth and business diversification to benefit from expansion of existing client relationships and the attraction of new clients. Successful implementation of the new core banking system is expected to facilitate initiatives in support of these objectives over the medium term. This improved technology will enable CWB to benefit from a client-centric view of branch-based relationships and achieve further operational efficiencies. The new system will also support
CWB’s application for transition to the Advanced Internal Ratings Based (AIRB) methodology for managing credit risk and calculating risk-weighted assets. A project plan has been finalized in support of CWB’s application, including an anticipated three-year time frame.
Strong Loan and Deposit Growth with Strategic Diversification
Over the medium term, ongoing strong, balanced growth of both loans and funding sources remain important strategic objectives. Further geographic and business sector diversification within targeted segments of Canada’s commercial banking industry is the foundation of CWB’s strategic direction. CWB will continue to focus on prudent growth of secured loans that offer an appropriate return and acceptable risk profile. Loan growth within Alberta and Saskatchewan is expected to remain challenging due to the impact of the current recession.
However, management expects to deliver solid overall loan growth at levels relatively consistent with recent performance, primarily based on higher relative contributions from non-oil producing provinces across CWB’s growing geographic footprint. A key strategic objective, supported by CWB’s investment in the new core banking system, is to increase the level of branch-raised deposits as this core source of funding is typically lower cost than non-branch-raised funding. Branch-raised deposit products, including business savings, cash management and bare trustee accounts, also represent tools which help clients conveniently manage their business and personal finances, and management considers growth within this category to demonstrate success in strengthening key, multi-product client relationships.

CWB Financial Group 2016 Annual Report22
Net Interest Margin
CWB expects efforts to optimize the overall cost of funds through targeted growth of lower-cost funding sources, along with selective, geographically diversified growth in higher yielding loan portfolios with an acceptable risk profile to mitigate the earnings impact of ongoing margin pressure over the medium term. However, in the near term, management expects these efforts to only partially offset the impacts of ongoing very low interest rates, competitive influences and a flat interest rate curve. As such, net interest margin pressure is expected to persist in 2017.
Credit Quality
Overall credit quality is expected to reflect CWB’s secured lending business model, disciplined underwriting practices and proactive loan management. Gross impaired loans within Alberta have increased in most portfolios compared to last year as the operating environment has remained particularly challenging due to the current recession. CWB continues to work with affected clients, and management will continue to monitor the entire loan portfolio for signs of weakness resulting from the first and second order impacts of lower oil prices. CWB will also continue to closely observe developments within the residential housing sector, with a particular focus on markets where a combination of rapid price escalation and regulatory change could impact pricing and the level of future activity. Although CWB expects periodic increases in the balance of impaired loans across the portfolio, loss rates on impaired loans outside of oil and gas production lending are expected to be consistent with CWB’s prior experience, where write-offs have been low as a percentage of impaired loans. The 2017 provision for credit losses as a percentage of average loans is expected to fall below the unusual level of 38 basis points experienced in 2016, within a range between 25 and 35 basis points.
Based on the results of stress tests simulating severe economic conditions in Alberta and Saskatchewan, in combination with very challenging economic conditions throughout the rest of CWB’s geographic footprint over a multi-year timeframe, management is confident CWB will continue to deliver positive earnings for shareholders while maintaining financial stability and a strong capital position. Stress test assumptions include severe credit losses, a persistent low interest rate environment and significantly slower loan growth to reflect lower assumed levels of economic activity, as well as increased competition for deposits and much higher levels of gross impaired loans that could combine to result in significant compression of net interest margin.
Efficient Operations and Operating Leverage
A key priority for CWB is to deliver consistent increases in adjusted cash earnings per share through business growth and strategic in-vestment while maintaining effective control of costs. CWB’s ongoing investment in people, technology and infrastructure is expected to contribute to long-term shareholder value through improved financial performance in future periods. In view of the level of necessary future
investment to facilitate ongoing implementation of CWB’s strategic direction, as well as the low probability of meaningful short-term improvement in net interest margin, management expects CWB’s efficiency ratio to fluctuate at levels moderately higher than the recent past. Management is committed to disciplined control of all discretionary expenses, and positive operating leverage is expected over the medium term.
Prudent Capital Management and Dividends
With a very strong capital position under the more conservative Standardized approach for calculating risk-weighted assets and a targeted dividend payout ratio of approximately 30%, CWB is well-positioned to continue to execute against our balanced growth strategy, strengthen shareholder returns and ensure resilience and flexibility through the maintenance of strong regulatory capital ratios. Ongoing support and development of each of CWB’s core businesses will remain a key priority, while potential strategic acquisitions will continue to be evaluated.
At October 31, 2016, CWB’s capital ratios were 9.2% CET1, 11.0% Tier 1 and 13.1% total capital. Changes in CWB’s capital ratios from last year mainly reflect an increase of approximately 70 basis points related to the issuance of $150 million of common shares on July 7, 2016. Higher Tier 1 and Total capital ratios compared to last year also reflect the issuance on March 31, 2016 of $140 million of non-cumulative 5-year rate reset First Preferred Shares Series 7 (Non-Viability Contingent Capital), partially offset by the redemption of $300 million of subordinated debentures on November 30, 2015. Redemption of $105 million of CWB Capital Trust Securities Series 1 (the “WesTS”) on December 31, 2016 is expected to reduce CWB’s Tier 1 and Total capital ratios by approximately 50 basis points.
Common share dividend increases are evaluated every quarter against the dividend payout ratio target of approximately 30%. The timing of future dividend increases will be influenced by capital requirements under the Standardized approach to support ongoing strong and balanced asset growth, as well as challenges related to persistent net interest margin pressure and ongoing macroeconomic uncertainty.
Further guidance related to management’s expectations for specific measures of financial performance, as well as related risk factors, is provided within the Outlook sections of this MD&A.
Unless otherwise noted, the remainder of this MD&A refers to financial performance from, and the outlook for, Continuing Operations.

CWB Financial Group 2016 Annual Report 23
NET INTEREST INCOMENet interest income is the difference between interest and dividends earned on assets, and interest paid on deposits and other liabilities, including debt. Net interest margin is net interest income as a percentage of average total assets.
Highlights of 2016• Net interest income (teb) increased 7% to a record $588.5 million
primarily based on very strong 13% loan growth.• Net interest margin (teb) of 2.43% was down 13 basis points as
the combined benefits of reduced deposit costs, lower average balances of cash and securities as a percentage of total assets, and beneficial changes in deposit mix were more than offset by lower asset yields. Of note, loan yields remained under pressure due to both the low interest rate environment and competitive factors.
Table 5 - Net Interest Income (teb)(1)
($ thousands)
2016 2015
AverageBalance Mix Interest
InterestRate
AverageBalance Mix Interest
Interest Rate
Assets
Cash, securities and deposits with
regulated financial institutions $ 2,719,327 11 % $ 36,352 1.34 % $ 2,597,920 12 % $ 48,142 1.85 %
Securities purchased under
resale agreements 131,891 1 620 0.47 46,359 - 341 0.74
Loans
Personal 3,659,510 15 141,277 3.86 3,027,366 14 119,358 3.94
Business 17,264,663 71 786,980 4.56 15,470,444 72 736,009 4.76
20,924,173 86 928,257 4.44 18,497,810 86 855,367 4.62
Total interest bearing assets 23,775,391 98 965,229 4.06 21,142,089 98 903,850 4.28
Other assets 424,060 2 - 0.00 339,097 2 - 0.00
Total Assets $ 24,199,451 100 % $ 965,229 3.99 % $ 21,481,186 100 % $ 903,850 4.21 %
Liabilities
Deposits
Personal $ 12,489,741 52 % $ 231,429 1.85 % $ 10,614,819 50 % $ 205,776 1.94 %
Business and government 7,955,410 33 114,895 1.46 7,579,692 35 110,774 1.46
20,445,151 85 346,324 1.70 18,194,511 85 316,550 1.74
Other liabilities 419,883 2 174 0.04 332,050 2 288 0.09
Debt 1,226,192 5 30,267 2.47 1,150,251 5 37,960 3.30
Shareholders' equity 2,107,633 8 - 0.00 1,803,047 8 - 0.00
Non-controlling interests 592 - - 0.00 1,327 - - 0.00
Total Liabilities and Equity $ 24,199,451 100 % $ 376,765 1.56 % $ 21,481,186 100 % $ 354,798 1.65 %
Total Assets/Net Interest Income $ 24,199,451 $ 588,464 2.43 % $ 21,481,186 $ 549,052 2.56 %
(1) See page 16 for a discussion of teb and other non-IFRS measures.
Net interest income (teb) increased 7% to reach a record $588.5 million driven by 12% growth in average interest-earning assets. The impact of strong 13% loan growth was partially offset by a 13 basis point reduction in net interest margin (teb) to 2.43%.
The yield on CWB’s average loans fell by 18 basis points in 2016, and the yield on average cash, securities and deposits with regulated financial institutions was down 51 basis points. The latter change reflects both the lower interest rate environment and an increase in the proportion of cash
and debt securities held compared to higher yielding preferred shares and common equities. CWB has liquidated its holdings of common equities and has no plans to re-establish this portfolio.
Through strong growth of branch-raised deposits, including 15% growth of targeted notice and demand deposits, CWB realized beneficial changes in deposit mix. However, average deposit costs fell only four basis points compared to the 18 basis point decline in loan yields mentioned above.

CWB Financial Group 2016 Annual Report24
Outlook for Net Interest Income and Net Interest MarginCWB will maintain its strategic focus on mitigating the earnings impact of ongoing margin pressure through continued implementation of its balanced growth strategy. This strategy includes efforts to optimize the overall cost of funds through targeted growth of lower-cost funding sources, as well as selective, geographically diversified growth in higher yielding loan portfolios with an acceptable risk profile. Loan growth will continue to have a positive influence on net interest income, but the combination of the persistent very low interest rate environment, ongoing competition for both loans and deposits, and a relatively flat yield curve is expected to result in further pressure on net interest margin compared to the 2.43% level realized in 2016. Management expects to sustain positive momentum toward beneficial changes in deposit mix through strong growth in preferred types of branch-raised deposits and ongoing development of new funding channels; however, the current interest rate environment diminishes the
incremental benefit of low and no-cost deposits, as well as deposits that are less interest sensitive. A sustained upward slope in the interest rate curve, and/or an increase in the prime lending interest rate would benefit CWB’s net interest margin. CWB’s projections for 2017 assume no change in the prime rate. Competitive factors, particularly in certain business areas, are expected to result in continued downward pressure on loan pricing and upward pressure on overall deposit costs. Changes in average balances of cash and securities also have an impact on net interest margin, with lower average balances generally enhancing margin, and higher average balances having the opposite effect. Consistent with its liquidity risk appetite, CWB expects to maintain average balances of cash and securities at prudent levels, relatively consistent with 2016.
NON-INTEREST INCOME
Highlights of 2016• Non-interest income of $72.7 million, up 7%.
• Strong growth in credit related income and lower net losses on securities.
• Non-interest income represented 11% of total revenues (teb), unchanged from 2015.
Table 6 - Non-interest Income($ thousands)
Change from 2015
2016 2015 $ %
Credit related $ 30,598 $ 27,855 $ 2,743 10%
Wealth management 14,021 14,448 (427) (3)
Retail services 13,617 13,697 (80) (1)
Trust services 11,522 10,816 706 7
Losses on securities, net (2,830) (4,324) 1,494 (35)
Other(1) 5,744 5,456 288 5
Total Non-interest Income $ 72,672 $ 67,948 $ 4,724 7%
(1) Includes gains on loan portfolio sales, lease administration services, foreign exchange gains/losses, gains/losses on land, buildings and equipment disposals, and other miscellaneous non-interest revenues.
Non-interest income of $72.7 million was up 7% as the combined benefit of strong growth in credit related income, lower net losses on securities and higher trust services revenues more than offset slight decreases in wealth management income and fees for retail services. Growth in credit related income was consistent with strong lending activity. While market conditions remained persistently challenging in 2016, lower net losses on securities compared to last year reflect reduced equity market exposure following liquidation of CWB’s holdings of common equities and improved market conditions within the Canadian preferred share market this year. Management has no plans to re-establish the portfolio of common equities. ‘Other’ non-interest income mainly reflects gains on the sale of residential mortgages.
Non-interest income as a percentage of total revenues (net interest income (teb) and non-interest income) was 11%, unchanged from 2015.

CWB Financial Group 2016 Annual Report 25
Outlook for Non-interest IncomeGrowth of non-interest income is expected to reflect the extension and deepening of CWB’s relationships with both new and existing clients. Increases are expected across most categories of non-interest income reflecting CWB’s continued focus on strong, high quality loan growth with associated fee income, as well as enhanced transactional capabilities in cash management and other retail services, including CWB’s branch-raised deposit franchise.
CWB has liquidated its holdings of common equities and has no plans to re-establish this portfolio. In view of this change, and based on the current composition of the securities portfolio, net gains/losses on securities are not expected to contribute materially to non-interest income in 2017; however, the magnitude and timing of gains or losses are dependent on market factors that are difficult to predict.
Continued solid growth is expected from Trust Services, resulting from ongoing business development. Management expects further
increases in wealth management revenues to result from solid performance within CWB Wealth Management, including organic growth at McLean & Partners and Adroit, as well as the introduction of discretionary investment services to more CWB banking clients. Further development of CWB’s regional wealth management specialist channel is expected to improve CWB Wealth Management’s ability to attract new clients through enhanced delivery of value-added financial and investment planning services. CWB’s branch-based mutual fund dealer, CWF, is expected to perform well within this segment. Management expects CWF to leverage the introduction of proprietary CWB Core Funds and Onyx Portfolio Series mutual funds within CWB’s branch network in support of further growth in, and profitability of, assets under management.
CWB maintains its long-term objective to diversify total revenues and will continue with initiatives to further develop and/or acquire additional sources of complementary non-interest income.
CWB Financial Group 2016 Annual Report26
NON-INTEREST EXPENSES, EFFICIENCY AND OPERATING LEVERAGE
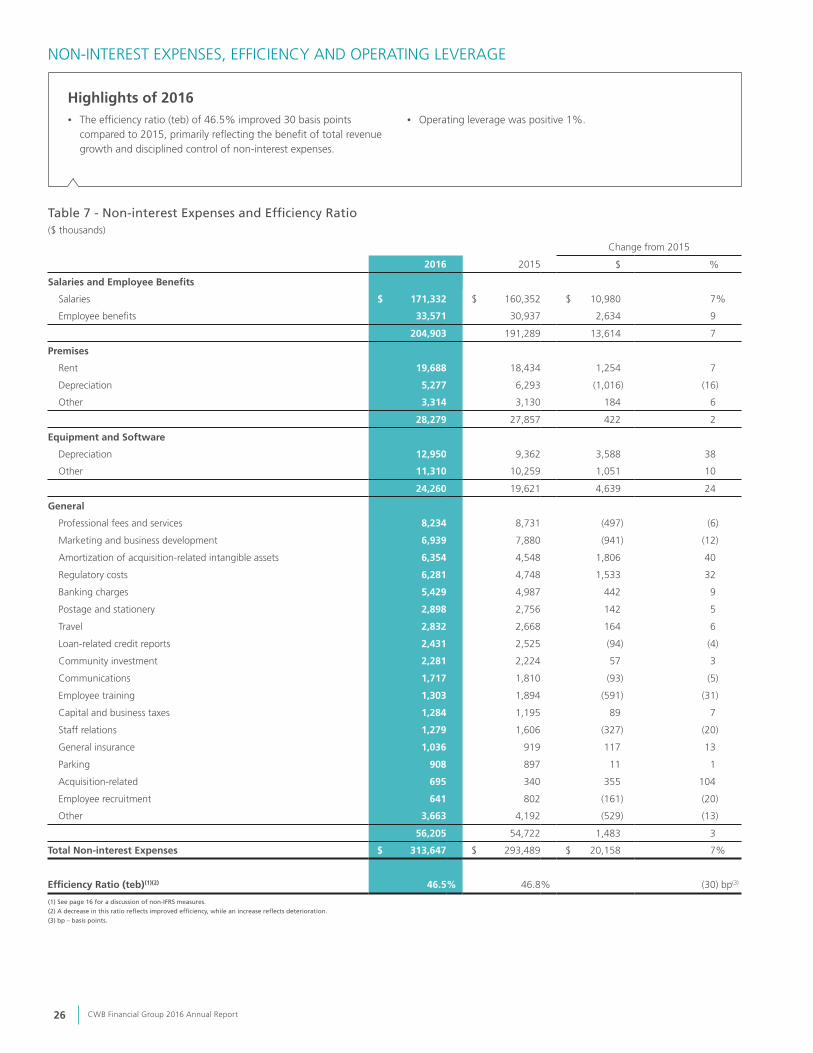
Highlights of 2016• The efficiency ratio (teb) of 46.5% improved 30 basis points
compared to 2015, primarily reflecting the benefit of total revenue growth and disciplined control of non-interest expenses.
• Operating leverage was positive 1%.
Table 7 - Non-interest Expenses and Efficiency Ratio($ thousands)
Change from 2015
2016 2015 $ %
Salaries and Employee Benefits
Salaries $ 171,332 $ 160,352 $ 10,980 7%
Employee benefits 33,571 30,937 2,634 9
204,903 191,289 13,614 7
Premises
Rent 19,688 18,434 1,254 7
Depreciation 5,277 6,293 (1,016) (16)
Other 3,314 3,130 184 6
28,279 27,857 422 2
Equipment and Software
Depreciation 12,950 9,362 3,588 38
Other 11,310 10,259 1,051 10
24,260 19,621 4,639 24
General
Professional fees and services 8,234 8,731 (497) (6)
Marketing and business development 6,939 7,880 (941) (12)
Amortization of acquisition-related intangible assets 6,354 4,548 1,806 40
Regulatory costs 6,281 4,748 1,533 32
Banking charges 5,429 4,987 442 9
Postage and stationery 2,898 2,756 142 5
Travel 2,832 2,668 164 6
Loan-related credit reports 2,431 2,525 (94) (4)
Community investment 2,281 2,224 57 3
Communications 1,717 1,810 (93) (5)
Employee training 1,303 1,894 (591) (31)
Capital and business taxes 1,284 1,195 89 7
Staff relations 1,279 1,606 (327) (20)
General insurance 1,036 919 117 13
Parking 908 897 11 1
Acquisition-related 695 340 355 104
Employee recruitment 641 802 (161) (20)
Other 3,663 4,192 (529) (13)
56,205 54,722 1,483 3
Total Non-interest Expenses $ 313,647 $ 293,489 $ 20,158 7%
Efficiency Ratio (teb)(1)(2) 46.5% 46.8% (30) bp(3)
(1) See page 16 for a discussion of non-IFRS measures.(2) A decrease in this ratio reflects improved efficiency, while an increase reflects deterioration.(3) bp – basis points.

CWB Financial Group 2016 Annual Report 27
Total non-interest expenses of $313.6 million were up 7%. The 7% increase in salary and benefit costs reflects the combined impact of acquisition-related increases in staffing, hiring activity in support of business growth and annual salary increments. CWB Maxium accounted for approximately 30% of the total increase in non-interest expenses. The net increase in full-time equivalent employees (FTEs) was modest at only 2% (38 FTEs) as the addition of more than 50 FTEs through acquisition was partially offset by the release of contract staff related to the core banking system project. Premises expense was relatively stable, up only 2% including depreciation. Ongoing investment in technology infrastructure necessary to position CWB for future growth also contributed to the increase in non-interest expenses. Equipment expenses increased 24%, including depreciation, primarily reflecting implementation of CWB’s new core banking system.
Combined amortization and sustainment costs related to the new core banking system after implementation accounted for approximately 15% of the total increase in non-interest expenses. Growth of general non-interest expenses was also moderate at 3%. Amortization of acquisition-related intangible assets was $1.8 million higher due to the acquisition of CWB Maxium, and regulatory costs increased $1.5 million. Disciplined management of discretionary expenses partially offset these factors and small increases in other categories.
The efficiency ratio (teb) of 46.5% improved 30 basis points compared to 2015, primarily reflecting the benefit of total revenue growth despite persistent net interest margin pressure and disciplined control of non-interest expenses. Operating leverage for the year was positive 1%.
Figure 1 – Number of Full-time Equivalent Staff
2012 2013 2014 2015 2016
1,715 (+8%)
1,788(+4%)
1,928(+8%)
1,966(+2%)
1,583 (+6%)
2,037* (+8%)
2,094* (+3%)
1,885* (+5%)
Continuing Operations
Discontinued Operations
Combined Operations*
CWB Financial Group 2016 Annual Report28
Outlook for Non-interest Expenses, Efficiency and Operating LeverageA key priority for CWB is to deliver strong long-term growth in adjusted cash earnings per share through strategic investment while maintaining effective control of costs. CWB’s current investments in people, technology and infrastructure are expected to contribute to long-term shareholder value through improved financial performance in future periods.
The major program to implement a new core banking system culminated with implementation of the system in the third quarter. The core banking and other technology investments are expected to provide considerable efficiencies in the future, including improved client relationship management capabilities and enhanced data management. While the beneficial impact of these efficiencies on CWB’s cost structure and revenues will be realized over time, combined amortization and sustainment costs related to the new core banking system are expected to add approximately $2.0 million to non-interest expenses on a quarterly basis compared to pre-implementation levels.
Certain technology investments, including the new core banking system, are also key requirements to facilitate an eventual transition to the AIRB methodology for managing credit risk and calculating risk-weighted assets.
CWB opened its 42nd full-service branch through expansion of operations in Lloydminster, Saskatchewan during the third quarter. Additional opportunities to upgrade and expand branch infrastructure continue to be reviewed.
Compliance with an increasing level of regulatory rules and oversight for all Canadian banks requires the investment of both time and resources.
Anticipated growth in total revenues (teb) should largely offset the impact of increased investment necessary for effective execution of CWB’s balanced growth strategy over the medium term. However, in consideration of expense growth related to newly acquired businesses, ongoing investment in growth initiatives, including those discussed above, and expectations for constrained net interest margin in the absence of increases in the prime lending interest rate and/or sustained steepening of the yield curve, periods of negative operating leverage may occur over the short term. Management remains committed to disciplined management of all discretionary expenses based on total revenue growth, and has targeted positive operating leverage over a medium-term, three- to five-year time horizon.
ACQUISITION-RELATED FAIR VALUE CHANGESThe tax deductible change in the estimated fair value of contingent consideration since the acquisition of CWB Maxium was $7.9 million. The change in fair value reflects the expected value of the contingent consideration after evaluating actual earnings to date and the estimated
probability-weighted future operating performance of this newly acquired business. Quarterly fair value changes similar in magnitude through the remainder of the three-year earn out period would approximate an amount near the maximum available through the purchase agreement.
INCOME TAXESThe 2016 effective income tax rate (teb) was 27.3% compared to 26.3% in 2015 while the effective tax rate before the teb adjustment was 26.4% compared to 24.9% last year. The 20% increase in Alberta’s provincial corporate income tax rate, from 10% to 12%, effective July 1, 2015, reduced CWB’s common shareholders’ net income in 2016 by approximately 1.4% ($3.6 million). The tax increase did not have a material impact on common shareholders’ net income in fiscal 2015, as the increase was offset by the related recovery on the deferred tax asset revaluation in that year.
Deferred tax assets and liabilities represent the cumulative amount of tax applicable to temporary differences between the carrying amount of assets and liabilities, and their values for tax purposes. CWB’s deferred income tax assets and liabilities relate primarily to the collective allowance for credit losses and intangible assets. Deferred tax assets and liabilities are measured using enacted or substantively enacted tax rates anticipated to apply to taxable income in the years in which those temporary differences are expected to be recovered or settled. Changes in deferred income taxes related to a change in tax rates are recognized as income in the period of the tax rate change.
Outlook for Income TaxesCWB’s expected income tax rate (teb) for fiscal 2017 is approximately 27.5%, relatively unchanged from 2016.

CWB Financial Group 2016 Annual Report 29
RESULTS OF DISCONTINUED OPERATIONSTable 8 summarizes the components of net income from Discontinued Operations included in the consolidated statements of income, which are attributable entirely to CWB common shareholders.
Table 8 - Results of Discontinued Operations($ thousands)
Change from 2015
2016 2015 $ %
Non-interest income (teb) $ - $ 3,875 $ (3,875) (100)%
Non-interest income
Insurance revenues, net - 9,416 (9,416) (100)
Trust services - 3,221 (3,221) (100)
Losses on securities, net - (283) 283 (100)
Total revenue (teb) - 16,229 (16,229) (100)
Non-interest expenses - 11,104 (11,104) (100)
Net income before income taxes - 5,125 (5,125) (100)
Income taxes (teb) - 1,296 (1,296) (100)
Net Income from Discontinued Operations before Net Gain on Sale - 3,829 (3,829) (100)
Net gain on sale, after tax - 107,808 (107,808) (100)
Common Shareholders’ Net Income from Discontinued Operations $ - $ 111,637 $ (111,637) (100)%
Earnings Per Common Share
Basic $ - $ 1.38 $ (1.38) (100)%
Diluted - 1.38 (1.38) (100)
Adjusted cash - 1.38 (1.38) (100)
Common shareholders’ net income from Discontinued Operations for 2016 was nil compared to $1.38 per common share in 2015. Earnings from Discontinued Operations last year were comprised of $1.33 per common share of divestiture gains and six months of operating contributions from the divested businesses.

CWB Financial Group 2016 Annual Report30
COMPREHENSIVE INCOMEComprehensive income is comprised of net income and other comprehensive income (OCI), all net of income taxes. CWB’s OCI includes changes in unrealized gains and losses on available-for-sale cash and securities, and fair value changes for derivative instruments designated as cash flow hedges. The 2016 decrease in comprehensive income was primarily driven by 42% ($137.3 million) lower net income from Combined Operations, primarily reflecting $107.8 million of divestiture gains from Discontinued Operations realized last year, as well as lower net income from Continuing Operations this year, mainly due to the credit performance of oil and gas production loans.
These changes were partially offset by a $56.4 million increase in OCI. Changes in OCI included an $80.4 million increase in fair value of available-for-sale securities, partially offset by a $16.0 million decrease in fair value of derivatives designated as cash flow hedges. While the dollar amount of CWB’s investment in available-for-sale securities, which includes preferred shares and included common shares prior to liquidation of these holdings in 2016, is relatively small in relation to total liquid assets, these investments can lead to fluctuations in OCI.
Table 9 - Comprehensive Income($ thousands)
2015Change from
20152016
Net Income from Continuing Operations $ 189,334 $ 214,965 $ (25,631)
Common Shareholders' Net Income from Discontinued Operations - 111,637 (111,637)
Net Income from Combined Operations 189,334 326,602 (137,268)
Other Comprehensive Income (Loss)
Available-for-sale securities
Gains (losses) from change in fair value, net of tax 20,799 (59,593) 80,392
Reclassification to net income, net of tax 2,158 6,612 (4,454)
22,957 (52,981) 75,938
Derivatives designated as cash flow hedges
Gains (losses) from change in fair value, net of tax (8,157) 7,846 (16,003)
Reclassification to net income, net of tax 113 3,640 (3,527)
(8,044) 11,486 (19,530)
Other Comprehensive Income (Loss), net of tax 14,913 (41,495) 56,408
Total Comprehensive Income $ 204,247 $ 285,107 $ (80,860)
CASH AND SECURITIESCash, securities and securities purchased under resale agreements totalled $2,792 million at October 31, 2016, compared to $2,995 million one year ago. The cash and securities portfolio is mainly comprised of high-quality debt instruments and a comparatively smaller component of preferred shares. The portfolio previously included a small portfolio of common shares; however, CWB liquidated these holdings in 2016 and has no plans to re-establish this portfolio. Securities are not held for trading purposes and, where applicable, are typically held until maturity.
Fluctuations in the value of securities are generally attributed to changes in interest rates and movements in market credit spreads. Volatility in equity markets caused fluctuations in the value of common shares during the period in which CWB held these investments. Total net unrealized losses before tax recorded on the balance sheet at October 31, 2016 were $44.7 million, compared to $76.2 million last year. Net unrealized gains or losses are reflected in Table 10.
Table 10 - Unrealized Gains (Losses) on Available-for-Sale Cash and Securities($ thousands)
As at October 31, 2016 As at October 31, 2015
AmortizedCost
Net Unrealized
Gains (Losses)Fair
ValueAmortized
Cost
NetUnrealized
Gains (Losses)Fair
Value
Deposits with Regulated Financial Institutions $ 890,597 $ (81) $ 890,516 $ 413,145 $ (377) $ 412,768
Securities Issued or Guaranteed by
Canada 1,142,651 147 1,142,798 1,373,476 (8,614) 1,364,862
A province or municipality 291,814 133 291,947 626,300 (5,396) 620,904
Other Debt Securities 153,126 1,522 154,648 347,322 (1,023) 346,299
Preferred Shares 165,606 (46,405) 119,201 198,325 (54,457) 143,868
Common Shares - - - 81,528 (6,349) 75,179
Total $ 2,643,794 $ (44,684) $ 2,599,110 $ 3,040,096 $ (76,216) $ 2,963,880

CWB Financial Group 2016 Annual Report 31
The decrease in unrealized losses on securities compared to 2015 primarily relates to the impact of changes in interest rates on pricing within the debt securities market, improvements in market conditions within the Canadian preferred share market and liquidation of CWB’s common share holdings. The level of unrealized losses on securities is regularly reviewed. Impairment charges on debt securities and preferred shares are reflected in net gains/losses on securities only in the case of an issuer credit event. CWB has no direct investment in any non-Canadian sovereign debt or other securities issued outside of Canada or the United States (U.S..
Net losses on securities of $2.8 million were realized in 2016, compared to net losses of $4.3 million in the prior year. While market conditions remained persistently challenging in 2016, lower net losses on securities compared to last year reflect reduced equity market exposure following liquidation of CWB’s holdings of common equities and certain preferred shares, as well as improved market conditions within the Canadian preferred share market this year.
See Table 28 – Valuation of Financial Instruments of this MD&A for additional information on significant financial assets and liabilities reported at fair value.
The balance and mix of cash and securities are managed as part of CWB’s overall liquidity management process; additional information, including management’s outlook for 2017, is included in the Liquidity Management discussion of this MD&A.
LOANS
Highlights of 2016 • Very strong, well-diversified 13% loan growth, largely driven by
very strong performance in British Columbia and Ontario, with contributions led by general commercial loans, real estate project loans and personal loans and mortgages.
• Double-digit loan growth achieved in 26 of the past 27 years (the exception being 2009 when loan growth during the global financial crisis was 7%).
Table 11 - Outstanding Loans by Portfolio($ millions)
Change from 2015
2016 2015 $ %
General commercial loans $ 4,808 $ 3,805 $ 1,003 26%
Real estate project loans 4,181 3,266 915 28
Personal loans and mortgages 4,064 3,318 746 22
Commercial mortgages 3,999 3,839 160 4
Equipment financing and leasing 3,693 3,772 (79) (2)
Corporate lending 1,099 1,257 (158) (13)
Oil and gas production loans 221 313 (92) (29)
Total Outstanding Loans $ 22,065 $ 19,570 $ 2,495 13%
Total loans before the allowance for credit losses increased 13% to reach $22,065 million at year end. Acquisition of the CWB Franchise Finance portfolio contributed approximately $350 million for the year, and net originations within CWB Maxium were approximately $300 million, both primarily within the general commercial category. Securitized assets originated by the CWB Maxium team prior to March 1, 2016, were not included as part of the acquisition; however, CWB holds renewal rights related to these assets. General commercial loans made the greatest contribution to annual loan growth measured in dollars, as shown in Table 11, followed by very strong performance in real estate project loans, and personal loans and mortgages. Of note, loan growth within BC and Ontario accounted for more than 90% of the increase from 2015.
General commercial loans increased 26%. Based on industry sector, as shown in Table 12, general commercial loans include categories such as manufacturing, finance and insurance, and wholesale and retail trade. CWB’s promising pipeline of new commercial loans, including opportunities within CWB Maxium and CWB Franchise Finance,
along with management’s ongoing efforts to emphasize the strategic relevance of this area to CWB’s funding diversification objectives, support expectations for strong relative growth in this portfolio over time.
Growth in real estate project loans remained strong as CWB has continued to finance well-capitalized developers on the basis of sound loan structures and acceptable pre-sale/lease levels. Growth within this segment slowed late in the year, in a manner consistent with management’s expectations. Total exposure to real estate project loans remains within CWB’s established risk appetite.
Personal loans and mortgages include CWB’s broker-sourced residential mortgage business, Optimum, lending activity in banking branches, and CWB’s participation in the National Housing Act Mortgage-backed Securities (NHA MBS) program. Participation in the NHA MBS program contributed $391 million to growth in 2016 (2015 – nil). Net of the sale of three portfolios totalling $71 million, total loans of $2,283 million in Optimum represented net growth of 18% ($355 million). Net growth

CWB Financial Group 2016 Annual Report32
was mainly driven by alternative mortgages secured via conventional residential first mortgages carrying a weighted average loan-to-value ratio at initiation of approximately 69%. The book value of alternative mortgages represented approximately 92% (2015 – 88%) of Optimum’s total portfolio. Ontario continues to account for over half of Optimum’s new originations. At approximately 49% of the total, Ontario represents the largest geographic exposure by province within Optimum’s portfolio, followed by Alberta at 23% and BC at 17%. The average size of Optimum mortgages originated in 2016 was approximately $308,000, and the average size of mortgages outstanding at October 31, 2016 was approximately $241,000. Management remains committed to the ongoing development of this business, including further expansion in Ontario, as it continues to produce solid returns while maintaining an acceptable risk profile.
The balance of loans in equipment financing and leasing includes the branch-based heavy equipment financing business and $1,720 million of small- and mid-ticket leases within National Leasing. Strong, double-digit growth of 10% within National Leasing reflects the company’s solid market position and coast-to-coast footprint. Areas outside of Western Canada account for more than half of National Leasing’s leasing exposure by geography. The balance of branch-based equipment finance loans contracted, primarily due to the challenging operating environment within Alberta.
Corporate lending represents a diversified portfolio that is centrally sourced and administered through designated lending groups. Corporate lending includes participation in select syndications structured and led primarily by the major Canadian banks, but excludes participation in various other syndicated facilities sourced through relationships developed at CWB branches. Syndicated facilities sourced in branches
are primarily real estate project loans, and oil and gas production loans, which are both included as separate classifications in Table 11.
Management took a conservative approach to resolving positions within CWB’s small portfolio of oil and gas production loans in 2016. The balance of loans in this category now represents 1% of the total portfolio (2015 – 2%).
The mix of CWB’s portfolio (see Figure 2) shifted in a manner generally consistent with management’s strategic diversification objectives during the year. Strong growth in general commercial loans, real estate project loans, and personal loans and mortgages combined with a more modest increase in commercial mortgages and contractions in corporate lending, equipment financing and leasing, and oil and gas production loans to result in decreased concentrations in the latter four categories. The lower balance of outstanding loans within equipment financing and leasing primarily reflects the impact of the current recession in Alberta. Alberta borrowers within this segment have been proactive in reducing the size of their fleets, with a resulting increase in early pay-outs.
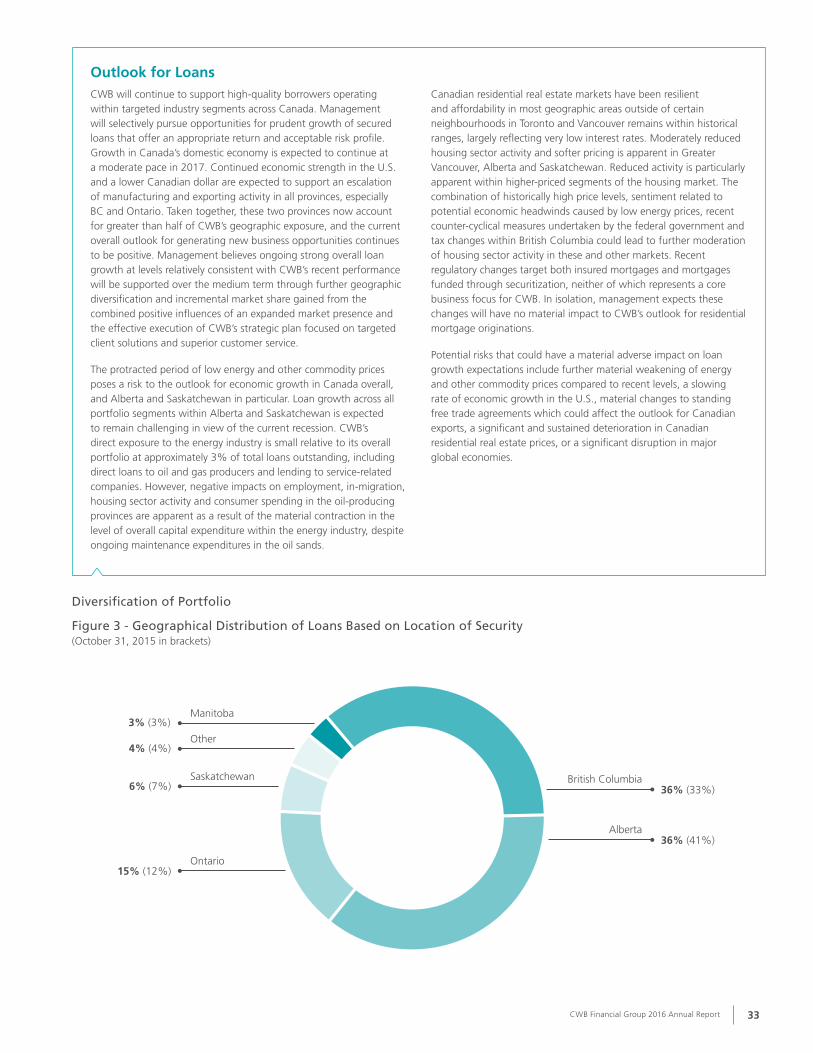
Based on the location of security (see Figure 3), Alberta and BC each represented 36% of total loans at year end, compared to 41% and 33%, respectively, in 2015. The material shift resulted from the combined impact of strong growth in Ontario related to contributions from CWB Franchise Finance, CWB Maxium, Optimum and National Leasing, strong growth in BC primarily driven by real estate project loans, and a slight net contraction of CWB’s portfolio in Alberta.
Figure 2 - Outstanding Loans by Portfolio
(October 31, 2015 in brackets)
Equipment Financing17% (19%)
Commercial Mortgages18% (20%)
General Commercial Loans22% (19%)
Personal Loans and Mortgages18% (17%)
Real Estate Project Loans19% (17%)
Corporate Loans5% (6%)
Oil & Gas Production1% (2%)
CWB Financial Group 2016 Annual Report 33
Outlook for LoansCWB will continue to support high-quality borrowers operating within targeted industry segments across Canada. Management will selectively pursue opportunities for prudent growth of secured loans that offer an appropriate return and acceptable risk profile. Growth in Canada’s domestic economy is expected to continue at a moderate pace in 2017. Continued economic strength in the U.S. and a lower Canadian dollar are expected to support an escalation of manufacturing and exporting activity in all provinces, especially BC and Ontario. Taken together, these two provinces now account for greater than half of CWB’s geographic exposure, and the current overall outlook for generating new business opportunities continues to be positive. Management believes ongoing strong overall loan growth at levels relatively consistent with CWB’s recent performance will be supported over the medium term through further geographic diversification and incremental market share gained from the combined positive influences of an expanded market presence and the effective execution of CWB’s strategic plan focused on targeted client solutions and superior customer service.
The protracted period of low energy and other commodity prices poses a risk to the outlook for economic growth in Canada overall, and Alberta and Saskatchewan in particular. Loan growth across all portfolio segments within Alberta and Saskatchewan is expected to remain challenging in view of the current recession. CWB’s direct exposure to the energy industry is small relative to its overall portfolio at approximately 3% of total loans outstanding, including direct loans to oil and gas producers and lending to service-related companies. However, negative impacts on employment, in-migration, housing sector activity and consumer spending in the oil-producing provinces are apparent as a result of the material contraction in the level of overall capital expenditure within the energy industry, despite ongoing maintenance expenditures in the oil sands.
Canadian residential real estate markets have been resilient and affordability in most geographic areas outside of certain neighbourhoods in Toronto and Vancouver remains within historical ranges, largely reflecting very low interest rates. Moderately reduced housing sector activity and softer pricing is apparent in Greater Vancouver, Alberta and Saskatchewan. Reduced activity is particularly apparent within higher-priced segments of the housing market. The combination of historically high price levels, sentiment related to potential economic headwinds caused by low energy prices, recent counter-cyclical measures undertaken by the federal government and tax changes within British Columbia could lead to further moderation of housing sector activity in these and other markets. Recent regulatory changes target both insured mortgages and mortgages funded through securitization, neither of which represents a core business focus for CWB. In isolation, management expects these changes will have no material impact to CWB’s outlook for residential mortgage originations.
Potential risks that could have a material adverse impact on loan growth expectations include further material weakening of energy and other commodity prices compared to recent levels, a slowing rate of economic growth in the U.S., material changes to standing free trade agreements which could affect the outlook for Canadian exports, a significant and sustained deterioration in Canadian residential real estate prices, or a significant disruption in major global economies.
Diversification of Portfolio
Figure 3 - Geographical Distribution of Loans Based on Location of Security(October 31, 2015 in brackets)
Alberta36% (41%)
British Columbia36% (33%)
Ontario15% (12%)
Saskatchewan6% (7%)
Other4% (4%)
Manitoba3% (3%)

CWB Financial Group 2016 Annual Report34
Table 12 - Total Advances Based on Industry Sector(1)
(% at October 31)
2016 2015
Construction 21 % 22 %
Real estate operations 21 21
Consumer loans and residential mortgages(2) 18 16
Finance and insurance 7 6
Transportation and storage 6 7
Hotel/motel 5 4
Health and social services 4 4
Retail trade 3 2
Other services 3 2
Wholesale trade 2 2
Manufacturing 2 2
Agriculture 2 2
Oil and gas service 2 3
Logging/forestry 2 2
Oil and gas production 1 2
All other 1 3
Total 100 % 100 %
(1) Table is based on the North American Industry Classification System (NAICS) codes.(2) Residential mortgages in this table include only single-family properties.
The loan portfolio is focused on areas of demonstrated lending expertise, while concentrations measured by geographic area and industry sector are managed within specified tolerance levels. The portfolio is well-diversified with a mix of business and personal loans. Heavy equipment financing is primarily sourced by specialized lenders within branches or through stand-alone equipment financing centres, while small- and mid-sized leases are offered across Canada through National Leasing. Oil
and gas production lending is conducted by specialists located in Calgary. Real estate specialists are established in the major centres of Vancouver, Edmonton and Calgary. Optimum maintained centralized administration based in Alberta in 2016, and sourced residential mortgages throughout Western Canada and select regions of Ontario and Atlantic Canada through an established network of mortgage brokers.
Outlook for Diversification of Portfolio Strong loan growth this year was the result of significantly higher relative contributions from non-oil producing provinces across CWB’s growing geographic footprint and includes the impact of Optimum, National Leasing and CWB’s newly acquired businesses. Growth is expected across all lending sectors in 2017 with the exception of oil and gas production loans. Relatively stronger economic activity in BC and increased lending exposure in Ontario are expected to lead to comparatively faster growth in these areas. In combination with the impact of the current recession in Alberta, this may result in a further reduction to the relative concentration of CWB’s Alberta-based lending exposures. Management has targeted higher net growth in areas such as general commercial loans, personal loans and mortgages, and equipment financing and leasing, compared to commercial mortgages and real estate project loans. Combined annual general commercial lending originations from CWB Maxium and CWB Franchise Finance are expected to exceed $500 million in fiscal 2017, and management expects CWB Maxium to surpass $1,000 million of total on-balance sheet loans and leases by 2019. Approximately 70 − 80% of the current business in both cases is outside of Western Canada. Originations within these new businesses are therefore expected to contribute both to strong growth in general commercial loans and further geographic diversification. Growth of personal loans and mortgages is expected to benefit from
continued expansion of Optimum. Of note, Optimum expects to add an Ontario-based underwriting centre in 2017, making use of space within the CWB Maxium premises in Richmond Hill. Equipment financing and leasing exposures comprise CWB’s branch-based heavy equipment lending operations, a specialized underwriting centre which partners with the finance companies of original equipment manufacturers, National Leasing, and a portion of the business of CWB Maxium. Expectations for slower growth in real estate project loans compared to that achieved in 2016 reflect the combined impact of this portfolio’s relatively short duration and forecasted moderation in Canadian residential real estate activity, partly as a result of recent regulatory changes intended to constrain growth of the housing sector. Within the parameters of its established risk appetite, CWB will continue to finance well-capitalized developers on the basis of sound loan structures and acceptable pre-sale/lease levels as such opportunities arise. Commercial mortgages are often subject to a higher level of pricing competition compared to other types of lending, and CWB will remain focused on maintaining this portfolio based on client relationships and adequate returns. CWB maintains its long-term objective to deliver further industry and geographic diversification, and management will continue with initiatives to develop and/or acquire complementary sources of high-quality growth.

CWB Financial Group 2016 Annual Report 35
CREDIT QUALITY
Highlights of 2016• Credit quality reflected strain within CWB’s small portfolio of oil
and gas loans, and management’s proactive approach to resolving positions within this portfolio. Very low commodity prices early in 2016 affected producer cash flows, and certain regulatory factors affected the liquidity of assets securing these exposures. Loss rates related to impaired loans within this portfolio exceeded those experienced during prior economic cycles and the overall level of provisioning was elevated compared to historical experience.
• Prior to reporting second quarter financial results, management announced revised expectations for the annual provision for credit losses of 35 – 45 basis points, compared to previous expectations of 18 – 23 basis points.
• The total provision for credit losses of $79.1 million represented 38 basis points of average loans, consistent with revised expectations and up from 17 basis points in 2015.
• The total provision for credit losses included cumulative provisions of $41.6 million recorded against oil and gas production loans.
• Credit quality as measured by the provision for credit losses was stable outside of the oil and gas production loan portfolio.
• Gross impaired loans increased 34% and represented 58 basis points as a percentage of total loans, compared to 49 basis points one year ago.
• Growth in the collective allowance of 11% generally reflected the level of overall loan growth.
• The total allowance for credit losses as a percentage of gross impaired loans (coverage ratio) was 100%, down from 122% in 2015.
Impaired Loans
The loan portfolio is delineated through the assignment of internal risk ratings to each borrower. The rating is based on assessments of key evaluation factors for the nature of the exposure applied on a consistent basis across the portfolio. The current rating system has 12 levels of risk and ratings are updated at least annually for all loans, with the exception of consumer loans and single-unit residential mortgages.
As shown in the table below, gross impaired loans totalled $127.2 million and represented 0.58% of total loans, compared to $94.9 million or 0.49% at the end of 2015. Total gross impaired loans within Alberta of $64.8 million increased from $41.7 million last year. Gross impaired loans
within the oil and gas production lending portfolio totalled $16.9 million, compared to $22.8 million last year. The increase in write-offs this year primarily related to losses within this portfolio. Gross impaired loans from CWB’s equipment financing and leasing exposures were $40.2 million compared to $19.6 million last year. Approximately 52% of the impaired balance in this category is comprised of Alberta exposures, compared to 24% last year. The ten largest accounts classified as impaired, measured by dollars outstanding, represented approximately 48% of total gross impaired loans at year end, down from 59%. New formations of impaired loans totalled $164.4 million, compared to $120.3 million last year.
Table 13 - Change in Gross Impaired Loans($ thousands)
Change from 2015
2016 2015 $ %
Gross impaired loans, beginning of period $ 94,905 $ 62,120 $ 32,785 53%
New formations 164,386 120,338 44,048 37
Reductions, impaired accounts paid down
or returned to performing status (61,619) (71,744) 10,125 (14)
Write-offs (70,460) (15,809) (54,651) 346
Total, end of period(1) $ 127,212 $ 94,905 $ 32,307 34%
Balance of the ten largest impaired accounts $ 61,397 $ 55,665 $ 5,732 10%
Total number of accounts classified as impaired(2) 232 117 115 98
Total number of accounts classified as impaired under $1 million(2) 217 104 113 109
Gross impaired loans as a percentage of total loans(3) 0.58% 0.49% 9 bp(4)
(1) Gross impaired loans includes foreclosed assets held for sale with a carrying value of $3,876 (2015 – $979). CWB pursues timely realization on foreclosed assets and does not use the assets for its own operations.(2) Total number of accounts excludes National Leasing accounts. (3) Total loans do not include an allocation for credit losses or deferred revenue and premiums.(4) bp – basis points.
The dollar level of gross impaired loans fluctuates as loans become impaired and are subsequently resolved, and does not directly reflect the dollar value of expected write-offs given tangible security held in support of lending exposures. The higher balance of gross impaired loans reflects the increase in new formations, partially offset by the success of ongoing
loan realization efforts and work-out programs. Outside of the oil and gas portfolio, actual credit losses as a percentage of total loans continue to demonstrate the benefits of CWB’s secured lending practices and disciplined underwriting.

CWB Financial Group 2016 Annual Report36
The overall loan portfolio is reviewed regularly with credit decisions undertaken on a case-by-case basis to provide early identification of possible adverse trends. Loans that have become impaired are monitored closely by a specialized team with regular quarterly, or more frequent,
reviews of each loan and its realization plan. An impaired loans report is reviewed quarterly by the Board Risk Committee. Please see the Risk Management section of this MD&A for further information.
Outlook for Impaired Loans Gross impaired loans remain low as a percentage of total loans, with the current level of 0.58% comparing to a peak during the prior credit cycle of 1.68% in the second quarter of 2010. Partially due the extended period of economic weakness within Alberta, we expect periodic further increases in the balance of impaired loans across the portfolio; however, we anticipate loss rates on impaired loans outside of oil and gas production lending to reflect the combined positive impact of our disciplined underwriting, secured lending practices and proactive account management, and to be more consistent with our prior experience. Ongoing loan management processes include assignment of experienced credit adjudicators to help branches and credit teams proactively identify and address higher risk loans. Gross impaired loans within Optimum are expected
to increase in view of softer housing market conditions, particularly in Alberta. Management remains confident in the strength, diversity and underwriting structure of the overall loan portfolio and lending exposures will continue to be closely monitored.
Potential risks that could have a material adverse impact on loan growth expectations include further material weakening of energy and other commodity prices compared to recent levels, a slowing rate of economic growth in the U.S., material changes to standing free trade agreements which could affect the outlook for Canadian exports, a significant and sustained deterioration in Canadian residential real estate prices, or a significant disruption in major global economies.
Allowance for Credit Losses
Current estimates of expected write-offs for existing loans classified as impaired are reflected in the specific provisions for credit losses, which totalled $16.3 million at year end, compared to $15.8 million a year earlier. Estimates are established through detailed analyses of both the overall quality and ultimate marketability of the security held against each
impaired account. The year-over-year change in the allowance for credit losses split between the specific allowance by category of impaired loans and the collective allowance for credit risk is provided in Table 14.
Table 14 - Allowance for Credit Losses($ thousands)
2016OpeningBalance
Provisionfor Credit
Losses
Write-Offs, net of Recoveries(1)
2016Ending
Balance
Specific Allowance
Equipment financing $ 4,346 $ 19,904 $ (14,687) $ 9,563
Energy 9,300 41,558 (48,715) 2,143
Real estate 1,770 4,026 (2,807) 2,989
Commercial 128 1,726 (484) 1,370
Consumer and personal 262 571 (629) 204
15,806 67,785 (67,322) 16,269
Collective Allowance 99,613 11,330 - 110,943
Total $ 115,419 $ 79,115 $ (67,322) $ 127,212
Represented by:
Loans $ 103,788
Committed but undrawn credit exposures(2) 23,424
Total $ 127,212
(1) Recoveries in 2016 totalled $3,138.(2) The collective allowance for credit losses related to committed but undrawn credit exposures is included in Other Liabilities on the consolidated balance sheets.
Allowances for credit losses are maintained to absorb both identified and unidentified losses in the loan portfolio and, at October 31, 2016, consisted of $16.3 million (2015 – $15.8 million) of specific allowances and $110.9 million (2015 – $99.6 million) in the collective allowance for credit losses. The specific allowance includes the amount of accumulated provisions for losses required to reduce the carrying value of identified impaired loans to their estimated realizable value. The collective
allowance includes allowances for losses inherent in the portfolio that are not presently identifiable on an account-by-account basis. Policies and methodology governing the management of the collective allowance are in place.

CWB Financial Group 2016 Annual Report 37
Growth in the collective allowance of 11% generally reflected the level of overall loan growth. The total allowance for credit losses as a percentage of gross impaired loans (coverage ratio) was 100%, down from 122% in 2015.
An assessment of the adequacy of the collective allowance for credit losses is conducted quarterly in consideration of:
• historical trends in loss experience during economic cycles;
• the current portfolio composition and profile;
• historical loss experience in portfolios that display similar credit risk characteristics;
• the estimated period of time between when the impairment occurs and when the loss is identified; and,
• management's judgment as to whether current economic and credit conditions are such that the actual level of inherent losses at the balance sheet date is likely to be greater or less than that suggested by historical experience.
Outlook for Allowance for Credit LossesSpecific allowances will continue to be determined on an account-by-account basis and reviewed at least quarterly. Lower levels of specific allowances are expected in strong economic times and higher levels of specific allowances in weaker economic times. As such, the level of specific allowances may increase as a result of relative economic weakness within the oil exporting provinces in Western Canada. The
collective allowance is expected to fluctuate as a result of portfolio growth and normal progress through the credit cycle. Based on management’s current outlook for credit performance and CWB’s actual historical loss experience, the existing level of the collective allowance is considered sufficient to mitigate losses inherent in the portfolio that are not presently identifiable.
Provision for Credit Losses
The 2016 provision for credit losses of $79.1 million increased 155%, primarily due to $41.6 million of specific provisions related to oil and gas production loans. Significantly higher provisioning within the oil and gas portfolio resulted from the impact of persistently low and volatile energy commodity prices on producer cash flows, as well as the influence of regulatory factors on the liquidity of assets securing these exposures.
The provision for credit losses represented 38 basis points of average loans in 2016 (see Table 15), up 21 basis points from the previous year. Net new specific provisions represented 32 basis points of average loans, compared to 12 basis points in 2015. CWB has a long history of strong
credit quality and low loan losses, both of which compare very favourably to the Canadian banking industry. Of the 32 basis points of net new specific provisions this year, approximately 20 basis points related to oil and gas production loans. Approximately 99% of CWB’s portfolio is comprised of non-oil and gas loans, and this portion accounted for approximately 12 basis points of net new specific provisions this year, consistent with 2015. Increases to the collective allowance comprised the remainder of the total provision. Macroeconomic and other external factors that may impact core geographic regions and/or industry sectors in which CWB customers operate are continually analyzed.
Table 15 - Provision for Credit Losses($ thousands)
2016 2015 2014 2013 2012
Provision for credit losses(1) 0.38 % 0.17 % 0.15% 0.19 % 0.19 %
Net new specific provisions (net of recoveries)(2) 0.32 0.12 0.07 0.13 0.14
Collective allowance $ 110,943 $ 99,613 $ 90,075 $ 76,217 $ 67,344
Coverage ratio(3) 100 % 122 % 154 % 134 % 122 %
(1) As a percentage of average loans.(2) Portion of the year’s provision for credit losses allocated to specific provisions as a percentage of average loans.(3) Allowance for credit losses as a percentage of gross impaired loans.
Outlook for the Provision for Credit LossesCredit quality is expected to continue to reflect CWB’s secured lending business model and disciplined underwriting processes. Based on CWB’s current economic outlook, management’s assessment of the overall quality of the portfolio and its underlying security, and the adequacy of the collective allowance for credit losses, management expects the provision for credit losses to decrease moderately compared to 2016, and for loss rates on impaired loans outside of oil and gas production lending to be consistent with our prior experience. The 2017 provision as a percentage of average loans is expected to fall within a range of
25 – 35 basis points. The assessment process is continuous and updated expectations are communicated no less than quarterly.
Potential risks that could have a material adverse impact on credit quality expectations include further material weakening of energy and other commodity prices compared to recent levels, a slowing rate of economic growth in the U.S., material changes to standing free trade agreements which could affect the outlook for Canadian exports, a significant and sustained deterioration in Canadian residential real estate prices, or a significant disruption in major global economies.

CWB Financial Group 2016 Annual Report38
DEPOSITS
Highlights of 2016• Strong branch-raised deposit growth of 12%, including very
strong 15% growth of targeted notice and demand deposits.
• Branch-raised deposits were 55% of total deposits, up from 54% in 2015.
• Capital markets deposits were reduced to 9% of total deposits by source (2015 – 10%), while broker deposits were unchanged at 36% reflecting current deposit pricing advantages in the latter funding market as compared to the former.
Table 16 - Deposits($ thousands)
2016Total
% ofTotalDemand Notice Term
Personal $ 34,681 $ 3,866,441 $ 9,322,580 $ 13,223,702 62 %
Business and government 761,523 3,031,090 2,317,038 6,109,651 29
Capital markets - - 1,861,200 1,861,200 9
Total Deposits $ 796,204 $ 6,897,531 $ 13,500,818 $ 21,194,553 100 %
% of Total 4% 32% 64% 100%
2015Total
% ofTotalDemand Notice Term
Personal $ 33,129 $ 3,188,276 $ 8,195,216 $ 11,416,621 59 %
Business and government 590,411 2,907,597 2,431,917 5,929,925 31
Capital markets - - 2,018,861 2,018,861 10
Total Deposits $ 623,540 $ 6,095,873 $ 12,645,994 $ 19,365,407 100 %
% of Total 3% 32% 65% 100%
Total deposits of $21,195 million increased 9% over 2015 reflecting 16% growth in personal deposits, which include those issued through the deposit broker network, and 3% growth in business and government
deposits, partially offset by an 8% decrease in capital markets deposits outstanding.
Table 17 - Deposits by Source(as a percentage of total deposits at October 31)
2016 2015
Branches 55 % 54 %
Deposit brokers 36 36
Capital markets 9 10
Total 100 % 100 %
References to branch-raised deposits within this MD&A include all deposits generated through the branch network, as well as those raised via CWT, CDF and Valiant's deposit taking franchise. Increasing the level of branch-raised personal deposits and certain types of business deposits is an ongoing strategic focus for CWB as success in this area provides the most reliable and stable sources of funding. The importance of growing these funding sources increased under the Basel III rules governing liquidity implemented in 2015 (see the Liquidity Management section of this MD&A). CWT raises deposits through notice accounts (comprised primarily of cash balances held in self-directed registered accounts), corporate trust deposits and through CWB's branch network. CDF, the Internet-based banking division of CWB, currently offers various deposit products to customers in all provinces and territories except Quebec. Client deposits in CDF at October 31, 2016 totalled $324 million, a 9% decrease compared to a year earlier. Management has elected to continue to emphasize client retention over growth within this channel as pricing competition from new and existing market participants continues
to be intense. Valiant’s deposit taking franchise provides an additional channel to raise insured deposits through CWB branches, and is separate from Valiant’s stock transfer business which was sold last year.
Consistent with CWB’s commercial focus, a considerable portion of branch-raised deposits are generated from corporate clients that tend to hold larger balances compared to personal clients (see the Liquidity Management section of this MD&A).
Growth in total branch-raised deposits was 12% in 2016, while the demand and notice component within branch-raised deposits increased by a very strong 15%. Notice deposits raised within CWT accounted for a material portion of this growth. Demand and notice deposits, which include lower-cost funding sources, comprised 36% of total deposits at year end, up from 35% in the previous year. Branch-raised deposits comprised 55% of total deposits, up from 54% in 2015. The level of growth in demand and notice deposits reflects ongoing execution of

CWB Financial Group 2016 Annual Report 39
strategies to further enhance and diversify CWB’s core sources of funding.
Other types of deposits are primarily sourced through a deposit broker network and debt capital markets. Insured deposits raised through deposit brokers remain an efficient source of funding. Although these funds are subject to commissions, this cost is countered by a reduced dependence on a more extensive branch network and the benefit of generating insured fixed term retail deposits over a wide geographic base.
Additional sources of funding in 2016 included $734 million from the securitization of equipment leases (2015 – $371 million), maintenance of CWB’s bearer deposit note program, issuance of $250 million of senior deposit notes in the capital markets (2015 – $300 million), and whole loan sales of $71 million (2015 – $29 million) of residential mortgages.
Outlook for Deposits and FundingThe strategic focus to increase branch-raised deposits will continue, with particular emphasis on the demand and notice component, which is often lower cost and provides associated transactional fee income. Various strategic initiatives, which include the offering of enhanced cash management products and a competitive business savings account, are also intended to further augment growth of desired branch-raised funding. CWB’s growing market presence, which includes the expansion of full-service branches, also supports objectives to generate branch-raised deposits. The successful launch of CWB’s new core banking system has facilitated a client-centric view of branch-based relationships, and is expected to enhance the effectiveness of efforts to build core funding sources. CWB will re-establish CDF as an effective channel for funding growth through a planned strategic brand repositioning in 2017. The deposit broker
network remains an efficient source for raising insured fixed term retail deposits and has proven to be a reliable and effective way to access funding and liquidity over a wide geographic base. Selectively utilizing the debt capital markets is also part of management’s strategy to further augment and diversify both the long- and short-term funding base over time. National Leasing will continue to utilize securitization channels for a portion of its funding requirements, provided that both related costs and the regulatory capital impact remain satisfactory. CWB commenced securitization of residential mortgages in 2016 through the NHA MBS program, and expects to initiate participation in the Canada Mortgage Bond (CMB) Program in 2017.
OTHER ASSETS AND OTHER LIABILITIESOther assets at October 31, 2016 totalled $469 million (2015 – $369 million). The amount of goodwill and intangible assets recorded on the balance sheet at October 31, 2016 was $85 million (2015 – $44 million) and $149 million (2015 – $106 million), respectively. The increase in goodwill primarily relates to the acquisition of CWB Maxium. Higher
intangible assets relate to both investment in CWB’s core banking system and the CWB Maxium acquisition.
Other liabilities totalled $417 million at October 31, 2016 (2015 – $374 million).
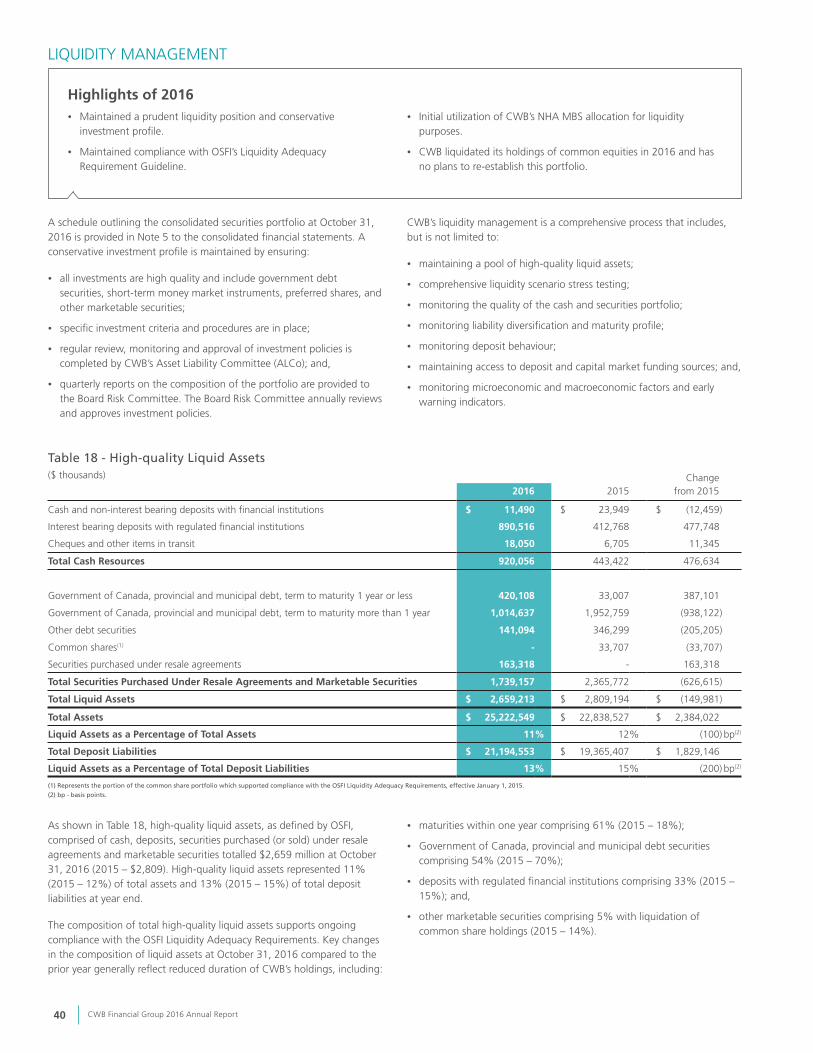
CWB Financial Group 2016 Annual Report40
LIQUIDITY MANAGEMENT
Highlights of 2016• Maintained a prudent liquidity position and conservative
investment profile.
• Maintained compliance with OSFI’s Liquidity Adequacy Requirement Guideline.
• Initial utilization of CWB’s NHA MBS allocation for liquidity purposes.
• CWB liquidated its holdings of common equities in 2016 and has no plans to re-establish this portfolio.
A schedule outlining the consolidated securities portfolio at October 31, 2016 is provided in Note 5 to the consolidated financial statements. A conservative investment profile is maintained by ensuring:
• all investments are high quality and include government debt securities, short-term money market instruments, preferred shares, and other marketable securities;
• specific investment criteria and procedures are in place;
• regular review, monitoring and approval of investment policies is completed by CWB’s Asset Liability Committee (ALCo); and,
• quarterly reports on the composition of the portfolio are provided to the Board Risk Committee. The Board Risk Committee annually reviews and approves investment policies.
CWB’s liquidity management is a comprehensive process that includes, but is not limited to:
• maintaining a pool of high-quality liquid assets;
• comprehensive liquidity scenario stress testing;
• monitoring the quality of the cash and securities portfolio;
• monitoring liability diversification and maturity profile;
• monitoring deposit behaviour;
• maintaining access to deposit and capital market funding sources; and,
• monitoring microeconomic and macroeconomic factors and early warning indicators.
Table 18 - High-quality Liquid Assets($ thousands) Change
from 20152016 2015
Cash and non-interest bearing deposits with financial institutions $ 11,490 $ 23,949 $ (12,459)
Interest bearing deposits with regulated financial institutions 890,516 412,768 477,748
Cheques and other items in transit 18,050 6,705 11,345
Total Cash Resources 920,056 443,422 476,634
Government of Canada, provincial and municipal debt, term to maturity 1 year or less 420,108 33,007 387,101
Government of Canada, provincial and municipal debt, term to maturity more than 1 year 1,014,637 1,952,759 (938,122)
Other debt securities 141,094 346,299 (205,205)
Common shares(1) - 33,707 (33,707)
Securities purchased under resale agreements 163,318 - 163,318
Total Securities Purchased Under Resale Agreements and Marketable Securities 1,739,157 2,365,772 (626,615)
Total Liquid Assets $ 2,659,213 $ 2,809,194 $ (149,981)
Total Assets $ 25,222,549 $ 22,838,527 $ 2,384,022
Liquid Assets as a Percentage of Total Assets 11 % 12 % (100) bp(2)
Total Deposit Liabilities $ 21,194,553 $ 19,365,407 $ 1,829,146
Liquid Assets as a Percentage of Total Deposit Liabilities 13 % 15 % (200) bp(2)
(1) Represents the portion of the common share portfolio which supported compliance with the OSFI Liquidity Adequacy Requirements, effective January 1, 2015.(2) bp - basis points.
As shown in Table 18, high-quality liquid assets, as defined by OSFI, comprised of cash, deposits, securities purchased (or sold) under resale agreements and marketable securities totalled $2,659 million at October 31, 2016 (2015 – $2,809). High-quality liquid assets represented 11% (2015 – 12%) of total assets and 13% (2015 – 15%) of total deposit liabilities at year end.
The composition of total high-quality liquid assets supports ongoing compliance with the OSFI Liquidity Adequacy Requirements. Key changes in the composition of liquid assets at October 31, 2016 compared to the prior year generally reflect reduced duration of CWB’s holdings, including:
• maturities within one year comprising 61% (2015 – 18%);
• Government of Canada, provincial and municipal debt securities comprising 54% (2015 – 70%);
• deposits with regulated financial institutions comprising 33% (2015 – 15%); and,
• other marketable securities comprising 5% with liquidation of common share holdings (2015 – 14%).

CWB Financial Group 2016 Annual Report 41
Additional sources of liquidity and funding in 2016 included $734 million from the securitization of equipment leases (2015 – $371 million), $391 million of residential mortgages which represent utilization of CWB’s NHA MBS allocation, and $71 million (2015 – $29 million) of residential mortgages sold via whole loan sales. The primary source of incremental
new funding was branch-raised deposits supported by the issuance of personal fixed term deposits through the broker deposit market. A summary of all outstanding deposits by contractual maturity date is presented in Tables 19 and 20.
Table 19 - Deposit Maturities Within One Year($ millions)
Within 1 to 3 3 Months CumulativeOctober 31, 2016 1 Month Months to 1 Year Within 1 Year
Demand deposits $ 796 $ - $ - $ 796
Notice deposits 6,898 - - 6,898
Deposits payable on a fixed date 643 1,408 4,116 6,167
Total $ 8,337 $ 1,408 $ 4,116 $ 13,861
October 31, 2015 Total $ 7,327 $ 893 $ 4,739 $ 12,959
Table 20 - Total Deposit Maturities($ millions)
Within 1 to 2 2 to 3 3 to 4 4 to 5 More thanOctober 31, 2016 1 year Years Years Years Years 5 Years Total
Demand deposits $ 796 $ - $ - $ - $ - $ - $ 796
Notice deposits 6,898 - - - - - 6,898
Deposits payable on a fixed date 6,167 3,515 1,554 1,008 1,257 - 13,501
Total $ 13,861 $ 3,515 $ 1,554 $ 1,008 $ 1,257 $ - $ 21,195
October 31, 2015 Total $ 12,959 $ 3,582 $ 1,369 $ 726 $ 729 $ - $ 19,365
A breakdown of deposits by source is provided in Table 17. Target limits by source have been established as part of the overall liquidity policy and are monitored regularly to ensure an acceptable level of funding diversification is maintained. Management continues to develop and implement strategies to ensure branch-raised deposits remain the core source of funding. Deposits raised through deposit brokers remain an effective incremental funding source. Senior and bearer deposit notes raised in the capital markets provide a further source of funding and liquidity.
In addition to deposit liabilities, CWB has subordinated debentures and debt securities related to the securitization of leases to third parties (refer to Note 16 of the consolidated financial statements for additional information). A summary of subordinated debentures outstanding is presented in Table 21.
Table 21 - Subordinated Debentures Outstanding($ thousands)
InterestRate
Maturity Date
Earliest Date Redeemable
by CWB at Par
As at October 31
2016
As at October 31
2015
3.463%(1) December 17, 2024 December 17, 2019 $ 250,000 $ 250,000
5.571%(2) March 21, 2022 March 22, 2017 75,000 75,000
4.389%(3) November 30, 2020 November 30, 2015 - 300,000
Total $ 325,000 $ 625,000
(1) These conventional debentures have a 12-year term with a fixed interest rate for the first seven years. Thereafter, the interest rate will be reset quarterly at the 3-month Canadian dollar CDOR rate plus 160 basis points.(2) These conventional debentures have a 15-year term with a fixed interest rate for the first 10 years. Thereafter, the interest rate will be reset quarterly at the Canadian dollar CDOR 90-day Bankers’ Acceptance rate plus 180 basis
points.(3) These conventional debentures had a 10-year term with a fixed interest rate for the first five years. Thereafter, the interest rate would have reset quarterly at the Canadian dollar CDOR 90-day Bankers’ Acceptance rate plus 193 basis
points. These debentures were fully redeemed at par on November 30, 2015.
Outlook for Liquidity Management Internal methodologies for managing liquidity risk are continuously refined. CWB utilizes comprehensive stress testing to manage, measure and monitor liquidity risk to ensure a prudent approach. CWB will maintain prudent liquidity levels in 2017 while maintaining
compliance with the OSFI Liquidity Adequacy Guideline. Management has initiated a multi-year program to upgrade CWB’s treasury infrastructure, with expected benefits related to all aspects of liquidity and asset/liability management.

CWB Financial Group 2016 Annual Report42
CAPITAL MANAGEMENT
Highlights of 2016• Very strong Basel III common equity Tier 1, Tier 1 and total capital
adequacy ratios of 9.2%, 11.0% and 13.1%, respectively.
• Redemption of $300 million of 4.389% subordinated debentures in November 2015.
• Issuance of $140 million of non-viability contingent capital (NVCC) preferred shares Series 7 in March 2016.
• Issuance of $150 million of common shares in July 2016.
• Implementation of initiatives which resulted in lower overall capital requirements for CWB’s existing pool of securitized leases.
• Cash dividends of $0.92 per share paid to common shareholders, up 7%.
• Very conservative Basel III leverage ratio of 8.6%, compared to the regulatory minimum of 3%.
Subsequent Highlights• On December 31, 2016, CWB will redeem through CWB Capital
Trust all $105 million outstanding 6.199% Trust Capital Securities (the WesTS) at par plus accrued interest. The redemption will result in an approximate 50 basis point reduction to CWB’s Tier 1 and total capital ratios; however, CWB’s capital ratios will remain strong.
• In November 2016, the Board of Directors declared a quarterly cash dividend of $0.23 per common share, unchanged from the prior quarter and the dividend declared last year. The Board also declared a cash dividend of $0.275 per Series 5 Preferred Share, and a cash dividend of $0.390625 per Series 7 Preferred Share.
Capital is managed in accordance with policies and plans that are regularly reviewed and approved by the Board Risk Committee. Capital management takes into account forecasted capital needs with consideration of anticipated profitability, asset growth, market and economic conditions, regulatory changes, and common and preferred share dividends. The overriding goal is to remain well-capitalized in order to protect depositors and policyholders, and provide capacity for internally generated growth and strategic opportunities that do not otherwise require accessing the capital markets, all while providing a satisfactory return for common shareholders. CWB has implemented an Internal Capital Adequacy Assessment Process (ICAAP) to establish target capital levels deemed prudent to effectively manage risks, including potential capital shocks from unexpected macroeconomic and/or CWB-specific events.
CWB provides a share incentive plan to officers and employees who are in a position to materially impact the longer-term financial success of the organization, as measured by overall profitability, earnings growth, share price appreciation and dividends. Note 18 to the consolidated financial statements details the number of options outstanding, the weighted average exercise price and the amounts exercisable at year end.
Holders of CWB common shares and holders of any other class of shares deemed eligible by the Board are offered the choice to direct cash dividends paid toward the purchase of common shares through a dividend reinvestment plan (DRIP). Further details regarding CWB’s DRIP are available at cwb.com/investor_relations.
Basel III Capital Adequacy Accord
Regulatory capital and capital ratios are calculated in accordance with the requirements of OSFI, and capital is managed and reported in accordance with the requirements of the Basel III Capital Adequacy Accord (Basel III).
CWB’s minimum Basel III regulatory capital ratios, including a 250 basis point capital conservation buffer, are 7.0% CET1, 8.5% Tier 1 and 10.5% total capital, and a 3.0% leverage ratio. The Basel III rules provide for transitional adjustments whereby certain aspects of the new rules are phased in between 2013 and 2019. The only available transition adjustment in the Basel III capital standards permitted by OSFI for Canadian banks relates to the multi-year phase-out of non-qualifying capital instruments.
CWB currently reports its regulatory capital ratios using the Standardized approach for calculating risk-weighted assets. This approach requires CWB to carry significantly more capital for certain credit exposures compared to requirements under the AIRB methodology used by larger Canadian financial institutions. For this reason, regulatory capital ratios of banks that utilize the Standardized approach versus the AIRB methodology are not directly comparable.
CWB complied with all internal and external capital requirements in 2016.
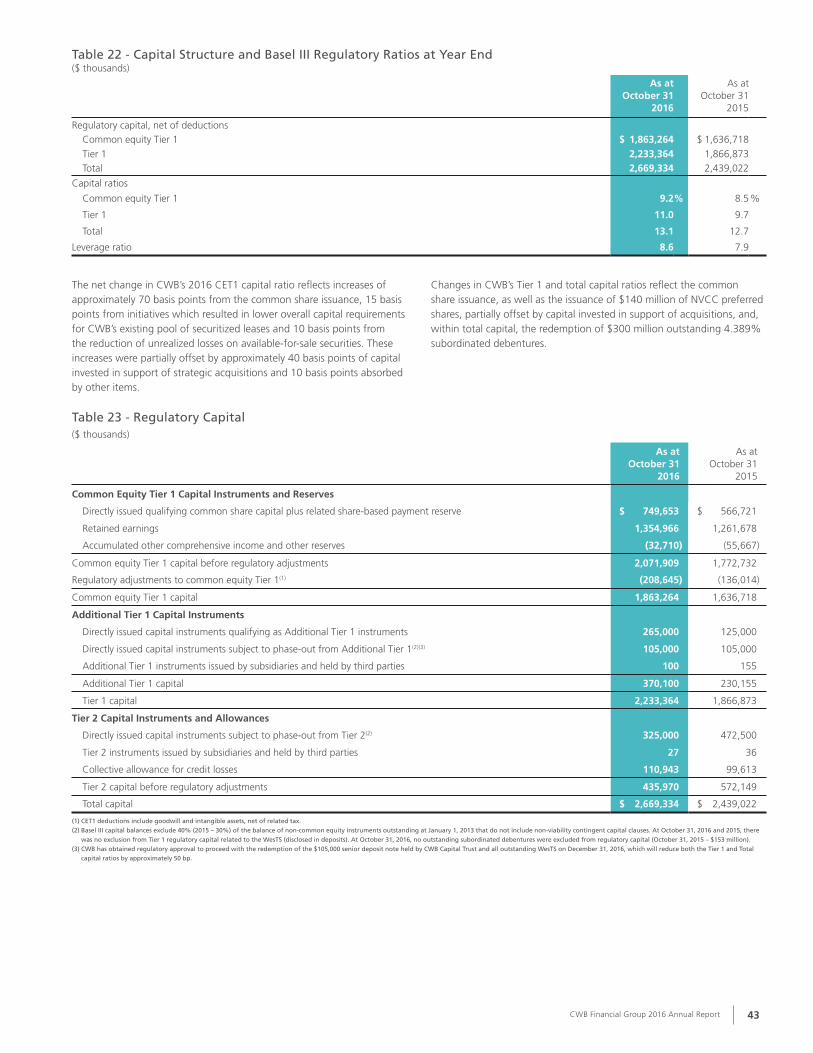
CWB Financial Group 2016 Annual Report 43
Table 22 - Capital Structure and Basel III Regulatory Ratios at Year End($ thousands)
As atOctober 31
2016
As atOctober 31
2015
Regulatory capital, net of deductionsCommon equity Tier 1 $ 1,863,264 $ 1,636,718
Tier 1 2,233,364 1,866,873 Total 2,669,334 2,439,022
Capital ratios
Common equity Tier 1 9.2 % 8.5 %
Tier 1 11.0 9.7
Total 13.1 12.7
Leverage ratio 8.6 7.9
The net change in CWB’s 2016 CET1 capital ratio reflects increases of approximately 70 basis points from the common share issuance, 15 basis points from initiatives which resulted in lower overall capital requirements for CWB’s existing pool of securitized leases and 10 basis points from the reduction of unrealized losses on available-for-sale securities. These increases were partially offset by approximately 40 basis points of capital invested in support of strategic acquisitions and 10 basis points absorbed by other items.
Changes in CWB’s Tier 1 and total capital ratios reflect the common share issuance, as well as the issuance of $140 million of NVCC preferred shares, partially offset by capital invested in support of acquisitions, and, within total capital, the redemption of $300 million outstanding 4.389% subordinated debentures.
Table 23 - Regulatory Capital($ thousands)
As atOctober 31
2016
As at October 31
2015
Common Equity Tier 1 Capital Instruments and Reserves
Directly issued qualifying common share capital plus related share-based payment reserve $ 749,653 $ 566,721
Retained earnings 1,354,966 1,261,678
Accumulated other comprehensive income and other reserves (32,710) (55,667)
Common equity Tier 1 capital before regulatory adjustments 2,071,909 1,772,732
Regulatory adjustments to common equity Tier 1(1) (208,645) (136,014)
Common equity Tier 1 capital 1,863,264 1,636,718
Additional Tier 1 Capital Instruments
Directly issued capital instruments qualifying as Additional Tier 1 instruments 265,000 125,000
Directly issued capital instruments subject to phase-out from Additional Tier 1(2)(3) 105,000 105,000
Additional Tier 1 instruments issued by subsidiaries and held by third parties 100 155
Additional Tier 1 capital 370,100 230,155
Tier 1 capital 2,233,364 1,866,873
Tier 2 Capital Instruments and Allowances
Directly issued capital instruments subject to phase-out from Tier 2(2) 325,000 472,500
Tier 2 instruments issued by subsidiaries and held by third parties 27 36
Collective allowance for credit losses 110,943 99,613
Tier 2 capital before regulatory adjustments 435,970 572,149
Total capital $ 2,669,334 $ 2,439,022
(1) CET1 deductions include goodwill and intangible assets, net of related tax.(2) Basel III capital balances exclude 40% (2015 – 30%) of the balance of non-common equity instruments outstanding at January 1, 2013 that do not include non-viability contingent capital clauses. At October 31, 2016 and 2015, there
was no exclusion from Tier 1 regulatory capital related to the WesTS (disclosed in deposits). At October 31, 2016, no outstanding subordinated debentures were excluded from regulatory capital (October 31, 2015 – $153 million). (3) CWB has obtained regulatory approval to proceed with the redemption of the $105,000 senior deposit note held by CWB Capital Trust and all outstanding WesTS on December 31, 2016, which will reduce both the Tier 1 and Total
capital ratios by approximately 50 bp.

CWB Financial Group 2016 Annual Report44
Table 24 - Risk-Weighted Assets($ thousands)
Cash,Securities
and ResaleAgreements Loans
OtherItems
As at October 31, 2016
Total
Risk-Weighted
Assets
Corporate $ 141,166 $ 14,553,429 $ - $ 14,694,595 $ 14,605,432
Sovereign 1,733,179 27,504 - 1,760,683 5,501
Bank 744,666 77,708 - 822,374 193,976
Retail residential mortgages 5,369 4,025,861 - 4,031,230 1,222,422
Other retail
Excluding small business entities - 186,144 - 186,144 128,626
Small business entities - 2,198,647 - 2,198,647 1,699,096
Equity 133,411 - - 133,411 133,411
Undrawn commitments - 330,145 - 330,145 325,611
Operational risk - - 89,568 89,568 1,119,599
Securitization risk - 102,593 - 102,593 531,070
Other - 175,445 455,369 630,814 396,839
As at October 31, 2016 $ 2,757,791 $ 21,677,476 $ 544,937 $ 24,980,204 $ 20,361,583
As at October 31, 2015 $ 2,997,607 $ 19,510,753 $ 439,753 $ 22,948,113 $ 19,198,092
Table 25 - Risk-Weighting Category($ thousands)
As at October 31, 2016150% and
0 % 20 % 35 % 50 % 75 % 100 % greater Balance Weighted
Corporate $ 49,272 $ 7,701 $ - $ 138,756 $ - $ 14,427,569 $ 71,297 $ 14,694,595 $ 14,605,432 Sovereign 1,733,179 27,504 - - - - - 1,760,683 5,501 Bank 163,327 581,339 - - - 77,708 - 822,374 193,976 Retail residential
mortgages 615,816 - 3,362,699 - 28,953 23,762 - 4,031,230 1,222,422
Other retail
Excluding small
business entities 14,086 1,284 - - 170,389 - 385 186,144 128,626 Small business entities 7,577 1,306 - - 2,016,264 147,226 26,274 2,198,647 1,699,096
Equity - - - - - 133,411 - 133,411 133,411 Undrawn commitments - - - - 18,207 311,902 36 330,145 325,611 Operational risk - - - - - - 89,568 89,568 1,119,599 Securitization risk - - - - - 65,334 37,259 102,593 531,070 Other 251,518 37,173 - - 34,297 271,169 36,657 630,814 396,839
As at October 31, 2016 $ 2,834,775 $ 656,307 $ 3,362,699 $ 138,756 $ 2,268,110 $ 15,458,081 $ 261,476 $ 24,980,204 $ 20,361,583
As at October 31, 2015 $ 2,681,408 $ 563,429 $ 2,565,052 $ 90,918 $ 2,878,813 $ 13,929,747 $ 238,746 $ 22,948,113 $ 19,198,092

CWB Financial Group 2016 Annual Report 45
Outlook for Capital ManagementCWB will maintain strong capital ratios under the Standardized approach for calculating risk-weighted assets, above its target thresholds and OSFI’s required minimums, and is well positioned to manage future business growth and unexpected events. Target capital ratios, including an appropriate capital buffer over the prescribed OSFI minimums, are reconfirmed regularly through CWB’s Regulatory Capital Plan. The ongoing retention of earnings, net of expected common and preferred share dividends, is expected to support capital requirements associated with the anticipated achievement of CWB’s medium-term performance target range for a strong common equity Tier 1 ratio. With a very conservative Basel III leverage ratio of 8.6% at October 31, 2016, CWB is not constrained by OSFI’s stated requirement for banks to maintain a minimum leverage ratio of 3%.
Based on the results of stress tests simulating severe economic conditions in Alberta and Saskatchewan, in combination with very challenging economic conditions throughout the rest of CWB’s geographic footprint over a multi-year time frame, management is confident CWB will continue to deliver positive earnings for shareholders while maintaining financial stability and a strong capital position.
Stress test assumptions include severe credit losses, a persistent low interest rate environment and significantly slower loan growth to reflect lower assumed levels of economic activity, as well as increased competition for deposits and much higher levels of gross impaired loans that could combine to result in significant compression of net interest margin.
The resilience of CWB’s capital position under the severe conditions assumed within its stress tests reflects both CWB’s commercial lending focus and its use of the Standardized approach for calculating risk-weighted assets. Under the Standardized approach, most of CWB’s commercial lending exposures are risk-weighted at 100%. In view of the assumption for constrained loan growth in the stress scenario, incremental increases in risk-weighted assets mainly result from a 50% increase in risk weights on loans assumed to be in default. This increase is effectively offset by the runoff of CWB’s relatively short duration portfolio, resulting in stable regulatory capital ratios over a multi-year time frame.
Management continues to evaluate alternatives to deploy capital for the long-term benefit of CWB shareholders, which includes
a medium-term target range for the common share dividend payout ratio of approximately 30% and the potential for strategic acquisitions.
AIRB Transition Plan
A project plan has been finalized in support of CWB’s application for transition to an AIRB methodology for managing credit risk and calculating risk-weighted assets, including an anticipated three-year time frame. CWB’s new core banking system is a critical component for a number of requirements necessary for AIRB compliance, including the collection of certain types of data. The AIRB approach will put CWB on more equal footing with its competition. It will add risk sensitivity to CWB’s framework for capital management, increase risk quantification processes, improve risk-based pricing capabilities and economic capital estimations, and enhance CWB’s ability to comply with new accounting standards. These improved risk management capabilities will better equip CWB to target business segments that generate the most attractive risk-adjusted returns and allocate resources accordingly.
CWB’s AIRB transition project is separated into several discrete phases, including: establishment of formalized project governance; creation of models including data collection, development, validation, deployment, operationalization and use test; commencement of model validation; implementation of risk-weighted asset calculator; and, submission of final application to OSFI.
In 2016, management commenced development of an enhanced enterprise data warehouse to serve as a repository for the required data. Development, validation and deployment of AIRB models for Optimum, National Leasing and branch-based residential mortgages was also undertaken, with initiation of a pilot phase of model use underway for Optimum and branch-based residential mortgages. Management expects all models to be developed and deployed with operational testing underway by the end of 2017.
Readers are cautioned that CWB’s move to the AIRB approach is dependent on regulatory approval with the potential impact also dependent upon future changes in both the Standardized and/or AIRB approaches. Both approaches are currently under review by the Basel Committee.
FINANCIAL INSTRUMENTS AND OTHER INSTRUMENTSAs a financial institution, most of CWB’s balance sheet is comprised of financial instruments and the majority of net income results from revenues, expenses, gains and losses related to the same.
Financial instrument assets include cash resources, securities, securities purchased under resale agreements, loans, derivative financial instruments and certain other assets. Financial instrument liabilities include deposits, debt, derivative financial instruments and certain other liabilities.
The use of financial instruments exposes CWB to credit, liquidity and market risk. A discussion of how these and other risks are managed can be found in the Risk Management section of this MD&A.
Further information on how the fair value of financial instruments is determined is included in the Financial Instruments Measured at Fair Value discussion in the Critical Accounting Estimates section of this MD&A.
Income and expenses are classified as to source, either securities or loans for income, and deposits or borrower funds for expense. Net realized gains (losses) on securities are shown separately in non-interest income.
Derivative Financial Instruments
More detailed information on the nature of derivative financial instruments is shown in Note 11 to the consolidated financial statements. The notional amounts of derivative financial instruments are not reflected on the consolidated balance sheets.

CWB Financial Group 2016 Annual Report46
Table 26 - Derivative Financial Instruments($ thousands)
2016 2015
Notional Amounts
Interest rate contracts designated as accounting hedges(1) $ 3,698,000 $ 2,805,000
Equity swaps designated as accounting hedges(2) 20,117 19,860
Equity swaps not designated as accounting hedges(3) 3,628 3,024
Foreign exchange contracts(4) 124,056 233,129
Total $ 3,845,801 $ 3,061,013
(1) Interest rate contracts are used as hedging devices to manage interest rate risk. The outstanding contracts mature between November 2016 and September 2021.(2) Equity swaps designated as hedges mature between June 2017 and June 2019. Equity swaps are used to reduce the earnings volatility from restricted share units linked to CWB’s common share price. (3) Equity swaps not designated as hedges mature between June and December 2017. Equity swaps are used to reduce the earnings volatility from deferred share units linked to CWB’s common share price.(4) U.S. dollar foreign exchange contracts are used from time to time to manage the difference between U.S. dollar assets and liabilities. Forward foreign exchange contracts outstanding mature between November 2016 and April 2017.
The active use of interest rate contracts remains an integral component to manage the interest rate gap position. The increase in the volume of outstanding contracts (measured by the notional amount) reflects normal course management of interest rate risk. Derivative financial instruments are entered into only for CWB’s own account. CWB does not act as an intermediary in derivatives markets. Transactions are entered into on
the basis of industry standard contracts with approved counterparties subject to periodic and at least annual review, including an assessment of the credit worthiness of the counterparty. Policies regarding the use of derivative financial instruments are approved, reviewed and monitored on a regular basis by ALCo, and are reviewed and approved by the Board Risk Committee no less than annually.
ACQUISITIONS AND DIVESTITURESOn March 1, 2016, CWB acquired the non-securitized lending assets and other net business assets, including key employees, of Maxium Financial Services Inc. and Desante Financial Services Inc., now referred to as “CWB Maxium Financial” (CWB Maxium). CWB Maxium provides loans, equipment leases and structured financing solutions to more than 35,000 clients, mainly in Ontario. Specialized financing solutions are primarily provided in the areas of health care, golf, transportation, real estate, and general corporate financing. Securitized assets of approximately $1,000 million that were originated prior to March 1, 2016 were not included in the transaction; however, CWB holds rights of renewal related to these assets. The maximum total consideration is $120 million. The acquisition was funded at closing with 1,250,312 common shares valued at $26 million and $20 million in cash. Remaining consideration consists of contingent payments to the vendors that could total up to $71 million, with an estimated fair value at the acquisition date of $16 million. Contingent payment instalments will be made annually with determination of the total amount payable based on CWB Maxium’s cumulative business performance over a 36-month purchase price adjustment period. Up to 50% of the total contingent consideration may be settled with CWB shares at the vendors’ option, provided the average share price over the 20 days preceding issuance exceeds $30.00, with the remainder to be paid in cash. Full disclosure of the accounting treatment
of the transaction is provided in Note 3 of the audited consolidated financial statements. Other than the contingent consideration payable to the vendors, there were no other contingent liabilities or commitments arising from the acquisition.
On July 1, 2016, CWB acquired GE Capital’s Canadian Franchise Finance platform, now referred to as “CWB Franchise Finance”. The business provides financing across Canada to a diverse group of established companies in the franchised hospitality and restaurant industries. The acquisition included key employees to support CWB’s continued strategic commercial banking growth and geographic expansion. The balance of loans acquired was approximately $350 million. Financial consideration was comprised of cash and no goodwill or intangible assets were included in the purchase structure.
The sales of CWB’s property and casualty insurance subsidiary, Canadian Direct Insurance (CDI), and the stock transfer business of its subsidiary, Valiant Trust Company, closed effective May 1, 2015. The transactions consisted of the sale of 100% of the shares of CDI as well as the transfer of certain operating assets, systems and employees that supported the stock transfer business.
OFF-BALANCE SHEET Off-balance sheet items include assets under administration and assets under management. Total assets under administration, which are comprised of trust assets under administration, third-party leases under administration, and mortgages under service agreements, totalled $10,689 million at October 31, 2016, compared to $9,294 million one year ago.
Assets under management held within Adroit and McLean & Partners were $1,924 million at year end, compared to $1,883 million last year.
Other off-balance sheet items are comprised of standard industry credit instruments (guarantees, standby letters of credit and commitments to extend credit). CWB does not utilize, nor does it have exposure to, collateralized debt obligations or credit default swaps. For additional information regarding other off-balance sheet items, refer to Note 20 of the audited consolidated financial statements.
CWB Financial Group 2016 Annual Report 47
SUMMARY OF QUARTERLY RESULTS AND FOURTH QUARTER
QUARTERLY RESULTSThe financial results for each of the last eight quarters are summarized in Table 27. In general, CWB’s performance reflects a consistent growth trend, although the second quarter contains three fewer revenue-earning days, or two fewer days during leap years. Results from Combined Operations for the third quarter of 2015 reflect the impact of divestiture gains. Results from Continuing Operations in the second and third quarters of 2016 reflect the credit performance of oil and gas production loans.
Quarterly financial results were subject to some fluctuation due to exposure to property and casualty insurance prior to the divestiture of Canadian Direct Insurance, completed on May 1, 2015. Insurance operations, which were primarily reflected in non-interest income within the results of Discontinued and Combined Operations, were subject to seasonal weather conditions, cyclical patterns of the industry and natural catastrophes.
Among other things, quarterly results can also fluctuate from the recognition of periodic income tax items.
Detailed management’s discussion and analysis along with unaudited interim consolidated financial statements for each quarter, except for the fourth quarters, are available for review on SEDAR at sedar.com and on CWB’s website at cwb.com. Copies of the quarterly reports to shareholders can also be obtained, free of charge, by contacting [email protected].

CWB Financial Group 2016 Annual Report48
Table 27 - Quarterly Financial Highlights(1)
($ thousands, except per share amounts)
2016 2015
Q4 Q3 Q2 Q1 Q4 Q3 Q2 Q1
Results from Continuing Operations
Net interest income (teb) $ 149,704 $ 149,547 $ 145,106 $ 144,107 $ 141,096 $ 140,503 $ 133,064 $ 134,389
Less teb adjustment 579 676 754 1,231 1,377 1,280 1,455 1,468
Net interest income 149,125 148,871 144,352 142,876 139,719 139,223 131,609 132,921
Non-interest income 19,127 19,541 19,378 14,626 17,949 13,269 18,435 18,295
Total revenues (teb) 168,831 169,088 164,484 158,733 159,045 153,772 151,499 152,684
Total revenues 168,252 168,412 163,730 157,502 157,668 152,492 150,044 151,216
Pre-tax, pre-provision income (teb) 89,497 92,360 87,628 84,358 84,378 80,397 81,174 82,110
Common shareholders' net income 47,834 45,582 32,213 52,132 52,969 51,170 51,520 52,405
Earnings per common share
Basic 0.54 0.55 0.40 0.65 0.66 0.64 0.64 0.65
Diluted 0.54 0.55 0.40 0.65 0.66 0.64 0.64 0.65
Adjusted cash 0.59 0.60 0.41 0.66 0.67 0.65 0.65 0.66
Return on common
shareholders' equity 9.3 % 9.4 % 7.1 % 11.5 % 11.9 % 11.7 % 13.1 % 13.1 %
Adjusted return on common
shareholders' equity 10.1 10.3 7.4 11.7 12.0 11.9 13.3 13.4
Return on average total assets 0.76 0.73 0.55 0.90 0.94 0.94 1.00 1.01
Efficiency ratio (teb) 47.0 45.4 46.7 46.9 46.9 47.7 46.4 46.2
Efficiency ratio 47.2 45.6 46.9 47.2 47.4 48.1 46.9 46.7
Net interest margin (teb) 2.36 2.40 2.47 2.48 2.49 2.57 2.57 2.59
Net interest margin 2.35 2.39 2.45 2.46 2.47 2.55 2.54 2.56
Provision for credit losses as
a percentage of average loans 0.24 0.32 0.78 0.18 0.18 0.17 0.17 0.16
Results from Combined Operations
Net interest income (teb) $ 149,704 $ 149,547 $ 145,106 $ 144,107 $ 141,096 $ 140,503 $ 134,886 $ 136,442
Non-interest income 19,127 19,541 19,378 14,626 17,949 13,269 25,362 23,722
Net gain on sale of businesses, after tax - - - - 169 107,639 - -
Total revenues (teb) 168,831 169,088 164,484 158,733 159,214 261,411 160,248 160,164
Total revenues 168,252 168,412 163,730 157,502 157,837 260,131 158,598 158,478
Common shareholders' net income 47,834 45,582 32,213 52,132 53,138 158,809 53,545 54,209
Earnings per common share
Basic 0.54 0.55 0.40 0.65 0.66 1.97 0.67 0.67
Diluted 0.54 0.55 0.40 0.65 0.66 1.97 0.67 0.67
Adjusted cash 0.59 0.60 0.41 0.66 0.67 1.98 0.68 0.69
Return on common
shareholders' equity 9.3 % 9.4 % 7.1 % 11.5 % 11.9 % 36.3 % 13.6 % 13.5 %
Adjusted return on common
shareholders' equity 10.1 10.3 7.4 11.7 12.1 36.5 13.9 13.9
Return on average total assets 0.76 0.73 0.55 0.90 0.94 2.90 1.02 1.03
Results from Discontinued Operations
Total revenues (teb) $ - $ - $ - $ - $ 169 $ 107,639 $ 8,749 $ 7,480
Total revenues - - - - 169 107,639 8,554 7,262
Common shareholders' net income - - - - 169 107,639 2,025 1,804
Earnings per common share
Basic - - - - - 1.33 0.03 0.02
Diluted - - - - - 1.33 0.03 0.02
Adjusted cash - - - - - 1.33 0.03 0.03
(1) See page 16 for a discussion of teb and non-IFRS measures.
CWB Financial Group 2016 Annual Report 49
FOURTH QUARTER OF 2016Overview of Continuing OperationsQ4 2016 vs. Q4 2015
Core operating performance was strong based on 6% growth of pre-tax, pre-provision (PTPP) income to $89.5 million. Common shareholders’ net income of $47.8 million was down 10% from $53.0 million a year ago. Net interest income and non-interest income both increased 7%; however, the combined impact of moderate growth of non-interest expenses, increased provisions for credit losses, acquisition-related fair value changes and higher preferred share dividends resulted in lower earnings. Higher net interest income reflects the benefit of very strong 13% loan growth, partially offset by a 13 basis point decrease in net interest margin (teb) to 2.36%. Increased non-interest income mainly reflects growth in credit related fees and trust services revenue, partially offset by a decrease in ‘other’ non-interest income. Increased non-interest expenses primarily relate to higher salaries and benefits reflecting the combined impact of acquisition-related increases in staffing, hiring activity in support of business growth and annual salary increments. The fourth quarter provision for credit losses was 24 basis points, compared to 18 basis points last year. Of the provision this quarter, 13 basis points related to non-oil and gas loans, and 11 basis points comprised an increase in the collective allowance. The latter factor is consistent with expectations for the collective allowance to fluctuate as a result of portfolio growth and normal progress through the credit cycle. Provisions for direct oil and gas exposures were not material this quarter. Diluted earnings per common share of $0.54 and adjusted cash earnings per common share, which excludes the acquisition-related amortization of intangible assets and contingent consideration fair value changes, net of tax, of $0.59 declined 18% and 12%, respectively. This reflects the factors discussed above, as well as the issuance of common shares this year.
Q4 2016 vs. Q3 2016
Common shareholders’ net income increased 5% mainly due to lower provisions for credit losses. Net interest income was relatively unchanged as 1% loan growth was offset by a four basis point decline in net interest margin (teb). Non-interest income was also relatively consistent with the prior quarter, as the positive impact of increased credit related and retail services fees was offset by lower ‘other’ non-interest income. Gains on the sale of residential mortgages led to elevated ‘other’ non-interest income last quarter. Non-interest expenses increased 3% primarily due to higher full-time salaries as certain previously capitalized salaries related to the new core banking system are now expensed. Diluted and adjusted cash earnings per common share were both down 2%. PTPP income was 3% lower as total revenues were relatively unchanged while non-interest expenses increased 3%.
ROE and ROA
The quarterly adjusted return on common shareholders’ equity (ROE) of 10.1% decreased 190 basis points from a year earlier and was down from 10.3% in the prior quarter. Fourth quarter return on assets (ROA) was 0.76%, compared to 0.94% last year and 0.73% in the previous quarter.
Net Interest Margin
Fourth quarter net interest margin (teb) of 2.36% declined 13 basis points compared to last year primarily due to lower asset yields and slightly increased marginal funding costs, partially offset by favourable changes in deposit mix. Loan yields remained under pressure due to both the low interest rate environment and competitive factors. Net interest margin (teb) was down four basis points from the prior quarter reflecting similar factors, partially offset by the absence of the one-time impact of a change in methodology for the recognition of certain loan fees recorded last quarter.
Efficient Operations and Positive Operating Leverage
The quarterly efficiency ratio (teb), which measures non-interest expenses as a percentage of total revenues (teb), excluding acquisition-related fair value changes, was 47.0%, relatively unchanged from the fourth quarter last year.
Overview of Combined OperationsQ4 2016 vs. Q4 2015 and Q4 2016 vs. Q3 2016
The results of Combined Operations did not differ materially from Continuing Operations.
ROE and ROA
The quarterly adjusted ROE and ROA were materially consistent with the results of Continuing Operations.

CWB Financial Group 2016 Annual Report50
ACCOUNTING POLICIES AND ESTIMATES
CRITICAL ACCOUNTING ESTIMATESCWB’s significant accounting policies are outlined in Note 1 to the audited consolidated financial statements with related financial note disclosures by major caption. The policies discussed below are considered particularly important, as they require management to make significant estimates or judgments, some of which may relate to matters that are inherently uncertain.
Allowance for Credit Losses
An allowance for credit losses is maintained to absorb probable credit-related losses in the loan portfolio based on management’s estimate at the balance sheet date. In assessing existing credit losses, management must rely on estimates and exercise judgment regarding matters for which the ultimate outcome is unknown. These matters include economic factors, developments affecting particular industries and specific issues with respect to single borrowers. Changes in circumstances may cause future assessments of credit risk to be significantly different than current assessments and may require an increase or decrease in the allowance for credit losses. Establishing a range for the allowance for credit losses is difficult due to the number of uncertainties involved. The collective allowance for credit losses is intended to address this uncertainty. At October 31, 2016 CWB’s total allowance for credit losses was $127.2 million (2015 – $115.4 million) which included specific allowances of $16.3 million (2015 – $15.8 million) and a collective allowance of $110.9 million (2015 – $99.6 million). Additional information on the process and methodology for determining the allowance for credit losses can be found in the discussion of Credit Quality in this MD&A and in Note 8 to the consolidated financial statements.
Financial Instruments Measured at Fair Value
Cash resources, securities, securities purchased under resale agreements, acquisition-related contingent consideration and derivative financial instruments are reported on the consolidated balance sheets at fair value.
CWB categorizes its fair value measurements of financial instruments recorded on the consolidated balance sheets according to a three-level hierarchy. Level 1 fair value measurements reflect published market prices quoted in active markets. Level 2 fair value measurements were estimated using a valuation technique based on observable market data. Level 3 fair value measurements were determined using a valuation technique based on non-market observable input.
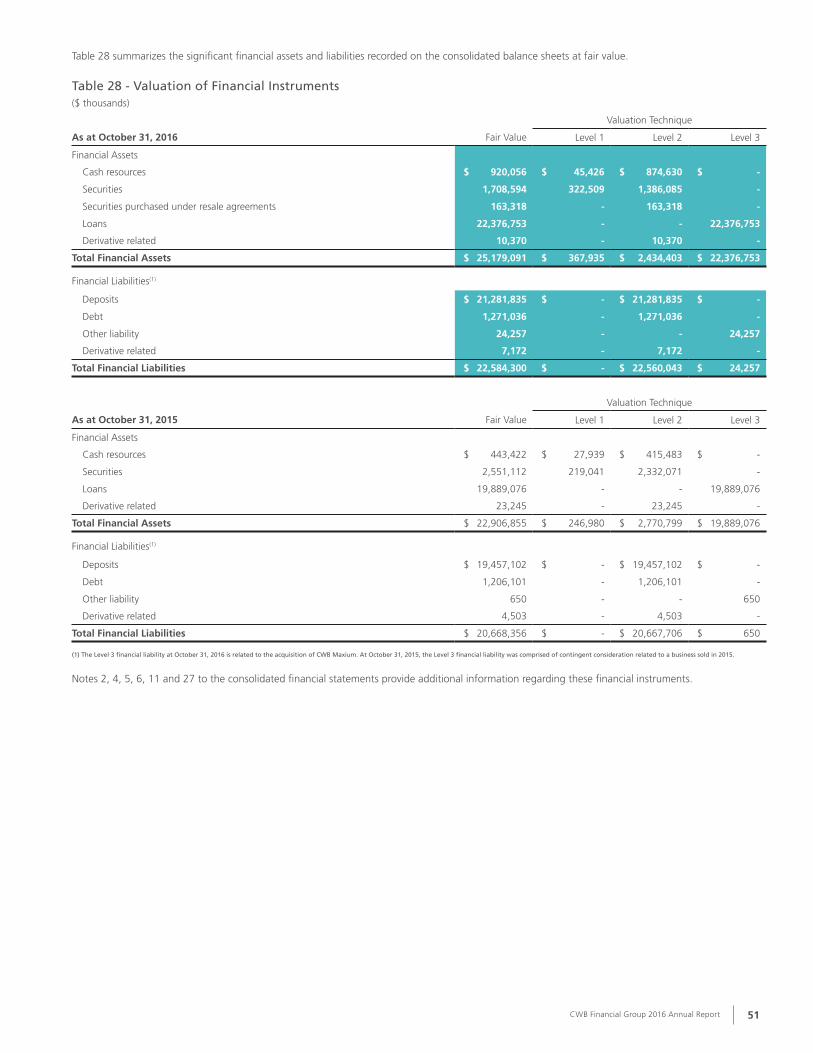
CWB Financial Group 2016 Annual Report 51
Table 28 summarizes the significant financial assets and liabilities recorded on the consolidated balance sheets at fair value.
Table 28 - Valuation of Financial Instruments($ thousands)
Valuation Technique
As at October 31, 2016 Fair Value Level 1 Level 2 Level 3
Financial Assets
Cash resources $ 920,056 $ 45,426 $ 874,630 $ -
Securities 1,708,594 322,509 1,386,085 -
Securities purchased under resale agreements 163,318 - 163,318 -
Loans 22,376,753 - - 22,376,753
Derivative related 10,370 - 10,370 -
Total Financial Assets $ 25,179,091 $ 367,935 $ 2,434,403 $ 22,376,753
Financial Liabilities(1)
Deposits $ 21,281,835 $ - $ 21,281,835 $ -
Debt 1,271,036 - 1,271,036 -
Other liability 24,257 - - 24,257
Derivative related 7,172 - 7,172 -
Total Financial Liabilities $ 22,584,300 $ - $ 22,560,043 $ 24,257
Valuation Technique
As at October 31, 2015 Fair Value Level 1 Level 2 Level 3
Financial Assets
Cash resources $ 443,422 $ 27,939 $ 415,483 $ -
Securities 2,551,112 219,041 2,332,071 -
Loans 19,889,076 - - 19,889,076
Derivative related 23,245 - 23,245 -
Total Financial Assets $ 22,906,855 $ 246,980 $ 2,770,799 $ 19,889,076
Financial Liabilities(1)
Deposits $ 19,457,102 $ - $ 19,457,102 $ -
Debt 1,206,101 - 1,206,101 -
Other liability 650 - - 650
Derivative related 4,503 - 4,503 -
Total Financial Liabilities $ 20,668,356 $ - $ 20,667,706 $ 650
(1) The Level 3 financial liability at October 31, 2016 is related to the acquisition of CWB Maxium. At October 31, 2015, the Level 3 financial liability was comprised of contingent consideration related to a business sold in 2015.
Notes 2, 4, 5, 6, 11 and 27 to the consolidated financial statements provide additional information regarding these financial instruments.

CWB Financial Group 2016 Annual Report52
CHANGES IN ACCOUNTING POLICIES AND FINANCIAL STATEMENT PRESENTATIONNew and amended accounting pronouncements issued by the International Accounting Standards Board (IASB) did not result in a change in CWB’s accounting policies during 2016.
FUTURE CHANGES IN ACCOUNTING POLICIESA number of standards and amendments have been issued by the IASB, and the following changes may have an impact on CWB’s future financial statements. CWB is currently reviewing these standards to determine the impact, if any, on the financial statements.
IFRS 9 – Financial Instruments
In July 2014, the IASB issued the complete version of IFRS 9, which will replace IAS 39 Financial Instruments: Recognition and Measurement. IFRS 9 addresses classification and measurement of financial assets and liabilities, impairment and hedge accounting.
Additional guidance from regulatory bodies has been issued since the final release of IFRS 9. In December 2015, the Basel Committee on Banking Supervision (BCBS) issued “Guidance on credit risk and accounting for expected credit losses” and, in June 2016, OSFI issued “IFRS 9 Financial Instruments and Disclosure”. OSFI’s guidance sets the Canadian expectations for IFRS 9 adoption and is consistent with the BCBS guidance.
IFRS 9 specifies that financial assets be classified into one of three categories (amortized cost, fair value through profit or loss or fair value through other comprehensive income) based on the cash flow characteristics and the business model under which the assets are held.
The final standard also introduces a new “expected credit loss” (ECL) model for calculating impairment on all financial assets classified at amortized cost or fair value through comprehensive income, with the most significant impact being to loans. The new impairment model categorizes a financial asset into three stages based on changes in credit risk since inception. Under stage one, if there has not been a significant increase in credit risk at the reporting date, the ECL will be measured and recognized at 12-month expected credit losses. A financial asset will move to stage two if it has experienced a significant increase in credit risk since inception and recognition of lifetime expected losses is required. When a financial asset is identified as credit impaired, it will move to stage three where interest income is recognized on the carrying amount of the asset, net of the impairment allowance. A financial asset can move between stages depending on improvement or deterioration of credit risk. CWB plans to leverage models being developed for AIRB to satisfy IFRS 9 requirements.
IFRS 9 also introduces a new hedge accounting model that expands the scope of eligible hedged items and risks eligible for hedge accounting, and aligns hedge accounting more closely with risk management.
IFRS 9 will be mandatorily effective for CWB’s fiscal year beginning on November 1, 2018, and early adoption is permitted. In January 2015, OSFI determined that Domestic Systemically Important Banks (D-SIBs) should adopt IFRS 9 beginning November 1, 2017, while early adoption is permitted but not required for other federally regulated Canadian banks with October year ends, such as CWB. CWB plans to adopt IFRS 9 on November 1, 2018.
During 2015, CWB commenced its IFRS 9 transition project and established a formal project governance structure, including a Steering Committee, to monitor the progress and critical decisions during the
transition to IFRS 9. The transition project focuses on the three main areas of IFRS 9: classification and measurement, impairment, and hedge accounting. IFRS 9 training for affected stakeholders has been and will continue to be delivered on an ongoing basis throughout the transition. The transition impact of IFRS 9 on CWB’s consolidated financial statements has not been determined.
IFRS 16 – Leases
In January 2016, the IASB issued IFRS 16, which requires most leases to be recorded on the balance sheet. For lessees, most operating leases other than short-term or low-value leases will be capitalized, and will result in a balance sheet increase in lease assets and lease liabilities, and a decrease in operating lease expenses and an increase in financing costs on the income statement. The new standard will not impact lessor accounting beyond additional disclosures. The new standard is effective for CWB’s fiscal year beginning November 1, 2019 with early adoption permitted if "IFRS 15 Revenue from Contracts with Customers" is applied. The impact on CWB of the new standard has not yet been determined.
IFRS 15 – Revenue from Contracts with Customers
The IASB has established principles for reporting about the nature, amount, timing and uncertainty of revenue and cash flows arising from an entity’s contracts with customers. The standard provides a single, principles-based model for revenue recognition to be applied to contracts with customers. The new standard does not apply to financial instruments or lease contracts, which fall in the scope of other IFRSs.
In April 2016, the IASB issued amendments to IFRS 15, which clarify the underlying principles of IFRS 15 and provide additional transitional relief on initial application. These amendments are effective for CWB’s fiscal year beginning November 1, 2018. The impact on CWB of the new standard has not yet been determined.
IFRS 2 – Share-based Payment Transactions
In June 2016, the IASB issued amendments to IFRS 2, which clarify how to account for certain types of share-based payment transactions. These amendments are effective for CWB’s fiscal year beginning November 1, 2018 and can be applied prospectively. The impact on CWB of these amendments has not yet been determined.
CWB continues to monitor IASB ongoing activity and proposed changes to IFRS. Several accounting standards that are in the process of being amended by the IASB, such as macro-hedging, may have an impact on CWB’s future consolidated financial statements.

CWB Financial Group 2016 Annual Report 53
RISK MANAGEMENT
The shaded areas of this MD&A represent a discussion of risk management policies and procedures relating to credit, market and liquidity risks as required under IFRS, which permits these specific disclosures to be included in the MD&A. Therefore, the shaded areas presented on pages 53 to 70 of this MD&A form an integral part of the audited consolidated financial statements for the year ended October 31, 2016.
Our Approach to Risk Management
Maintenance of an integrated and disciplined approach to risk management is a key success factor for CWB. Our risk management framework guides us in prudent, balanced and measured risk-taking aligned with CWB’s business strategy. The Enterprise Risk Management (ERM) group develops CWB’s risk metrics, risk appetite, risk policies and limits, and provides independent review and oversight across the enterprise on risk-related issues.
CWB's vision – to be seen as crucial to our clients’ futures – requires continuous consideration, understanding and responsible management of all key risks at both the strategic and operational levels. CWB’s core strategic objective to balance risk and reward requires each team member to make common-sense business decisions by assessing risk and reward trade-offs considering CWB’s strategy, risk appetite and regulatory/legal requirements. We consciously accept risks to add value for stakeholders and support
the responsible and efficient delivery of products and services provided those risks:
• Are aligned with our strategic objectives;
• Are thoroughly understood, measured and managed within the confines of well-communicated CWB risk tolerances, including the highest ethical standards; and,
• Serve the interests of stakeholders, including our clients, shareholders, creditors, employees, regulators and communities.
Highlights of 2016 Further enhancements to CWB’s risk management framework were undertaken in 2016 as part of the ongoing development and implementation of CWB’s risk management processes, including the following key initiatives:
• Further enhanced CWB’s three lines of defence risk governance framework;
• Established an integrated risk management function as the second line of defence for structural market risk and operational risk, as well as for CWB's Internal Capital Adequacy Assessment Process (ICAAP) and stress testing under AIRB;
• Established market risk metrics with corresponding risk appetite and limits for structural market risk exposures;
• Monitored and reported structural market risk exposures against the risk appetite and limits, independent of the first line of defence;
• Initiated the multi-year project plan in support of application for transition to the AIRB approach for managing credit risk and calculating risk-weighted assets. Transition to the AIRB approach will enhance CWB’s competitive position and facilitate risk-based pricing, enable further optimization of capital allocation, and enhance CWB’s risk quantification and stress testing capabilities;
• Initiated development of certain AIRB models and AIRB-based stress testing capabilities for Optimum Mortgage, branch-based mortgage and National Leasing portfolios;
• Developed IFRS 9 models for Optimum Mortgage, branch-based mortgage and National Leasing portfolios;
• Further developed an information services and data risk management platform and initiated an information services and data platform for the estimation of risk-weighted assets under the AIRB approach; and,
• Revised the mandate of, and re-named, CWB’s Credit Analytics Department as the Risk Data Aggregation, Analytics, and Reporting Group (RDAAR).

CWB Financial Group 2016 Annual Report54
Outlook for Risk ManagementWith ongoing enhancement of CWB’s enterprise-wide risk management framework in 2017, ERM will contribute to further progress toward CWB’s eventual transition to the AIRB approach and enhancements to stress testing processes.
Further development of an enhanced operational risk management framework consistent with industry best practices is underway.
RISK MANAGEMENT OVERVIEWRisk management processes are designed to complement CWB’s overall size, level of complexity, risk profile and philosophy regarding risk. CWB’s risk management philosophy emphasizes risk measurement, sound controls, effective governance, transparency and accountability. Selectively choosing and managing acceptable risks has been integral to CWB’s ability to grow profitably in both favourable and adverse market conditions. A strong risk culture continues to be a cornerstone of CWB’s approach to risk management.
As with all financial institutions, CWB is in the business of managing risk and is therefore exposed to various risk factors that could adversely affect its operating environment, financial condition and financial performance. Exposure to risk may also influence a client’s decision to make deposits and/or an investor’s decision to buy, sell or hold CWB shares or other securities. Each of CWB’s businesses is subject to certain risks that require unique mitigation strategies.
CWB has demonstrated its ability to effectively manage risks through conservative management practices based on a strong risk culture and a disciplined risk management approach; however, not all risks are within CWB’s direct control. A description of key external risk factors management considers is included in this risk management discussion. CWB actively evaluates existing and potential risks to develop, implement and continually enhance appropriate risk mitigation strategies.
Risk Management Strengths
• Strong risk culture with robust risk management framework which addresses risks throughout CWB;
• Low operational risk profile;
• In-depth knowledge of our clients;
• Secured lending business model;
• Disciplined underwriting with demonstrated strength through multiple credit cycles;
• Increasing geographic diversification;
• Low balance sheet leverage;
• Low average duration of lending portfolios; and,
• Relatively low exposure to economically sensitive retail lending portfolios.
Risk Management Challenges
• Ongoing global macroeconomic volatility, especially the persistence of low oil prices and related economic challenges within parts of Western Canada;
• Increasing volume and complexity of regulatory requirements and expectations; and,
• Capital requirements under the Standardized approach decoupled from the underlying economic risk.
Risk Management Principles
The following principles guide the management of risks across all operations and companies of CWB (enterprise-wide):
• An effective balance of risk and reward through alignment of business strategy with risk appetite, diversifying risk, pricing appropriately for risk, and mitigating risk through sound preventive and detection controls;
• An enterprise-wide view of risk and the acceptance of risks required to build the business with continuous consideration for how those risks may affect CWB’s reputation;
• The belief that every employee is accountable to understand the risks inherent in their respective day-to-day activities;
• Use of common sense, sound judgment and fulsome risk-based discussions;
• Recognition that “knowing your client” reduces risks by ensuring the services provided are suitable for, and understood by, the client; and,
• Ongoing commitment to a three lines of defence risk governance framework with independent oversight and effective challenge from the second line.
The mandate of CWB’s ERM function is to enhance existing processes and structure to help identify and appropriately mitigate risks on an enterprise-wide basis. The intent is to provide a suitable framework for CWB to properly balance risk and reward while ensuring risk management practices satisfy regulatory requirements.

CWB Financial Group 2016 Annual Report 55
Risk Management Framework
The primary goal of risk management is to ensure that the outcomes of risk-taking are consistent with CWB’s business activities, strategies and risk appetite. The enterprise-wide risk management framework provides the foundation for achieving this goal. CWB utilizes the ISO 31000 Standard for Risk Management as a comprehensive framework to help ensure risk is managed effectively and efficiently.
Figure 4 depicts the four main elements which comprise CWB's enterprise-wide risk management framework:
Figure 4 – Risk Management Framework
Risk Governance
Risk Appetite Framework
Principal Risks and Risk Management Processes
Strong Risk Culture
Risk Culture
A strong risk culture emphasizes transparency and accountability. Organizations with a strong risk culture have a consistent and repeatable approach to risk management when making key business decisions, including regular discussions of risk and reviews of risk scenarios that can help management and the Board understand the inter relationships and potential impacts of risks. CWB’s strong risk culture starts with an appropriate “tone at the top” that demonstrates and sends consistent and clear messages throughout the organization. Risk culture is communicated throughout CWB and is emphasized by the actions of senior management and the Board.
Principal Risks
The ability to identify, measure and monitor risks is a key component of effective enterprise-wide risk management. Certain principal risks have been identified that have the greatest potential to materially impact operations.
Figure 5 is a visual representation of CWB’s principal risk exposures by business line:
Figure 5 – Principal Risks
CWB
Businessand Personal
Banking
TrustServices
WealthManagement
Credit RiskMarket RiskCapital Risk
Operational Risk
Credit RiskOperational Risk
Credit RiskOperational Risk
Operational Risk
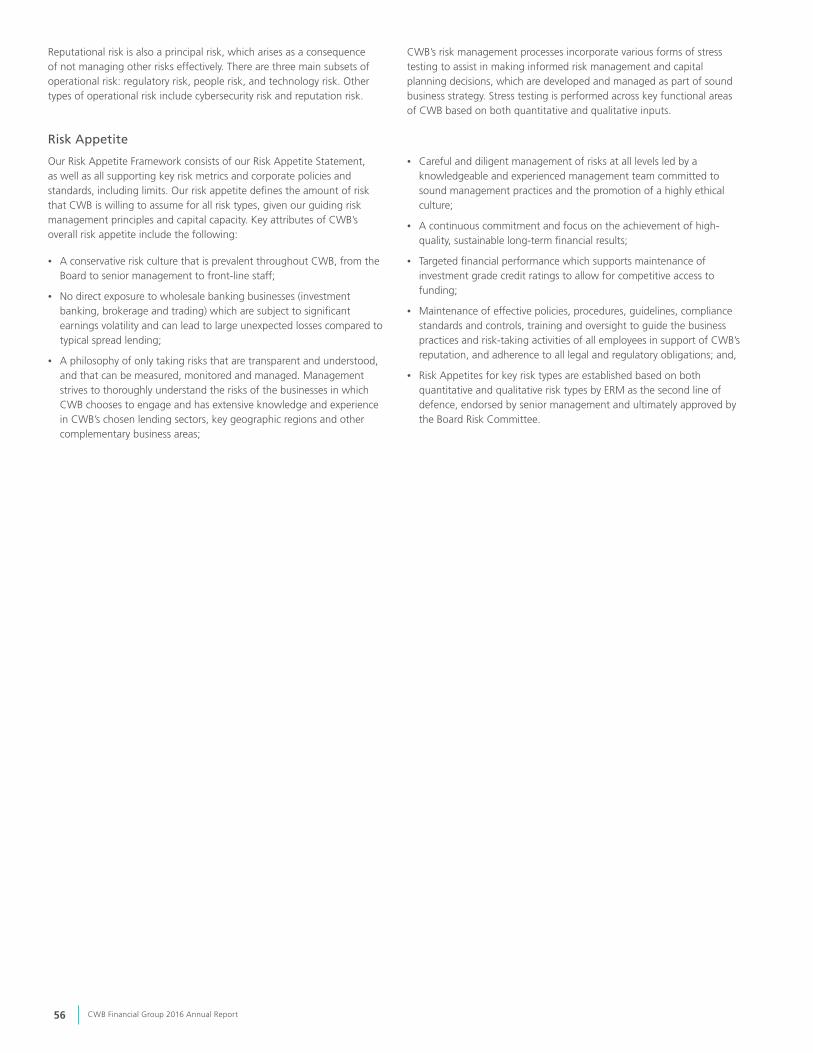
CWB Financial Group 2016 Annual Report56
Reputational risk is also a principal risk, which arises as a consequence of not managing other risks effectively. There are three main subsets of operational risk: regulatory risk, people risk, and technology risk. Other types of operational risk include cybersecurity risk and reputation risk.
CWB’s risk management processes incorporate various forms of stress testing to assist in making informed risk management and capital planning decisions, which are developed and managed as part of sound business strategy. Stress testing is performed across key functional areas of CWB based on both quantitative and qualitative inputs.
Risk Appetite
Our Risk Appetite Framework consists of our Risk Appetite Statement, as well as all supporting key risk metrics and corporate policies and standards, including limits. Our risk appetite defines the amount of risk that CWB is willing to assume for all risk types, given our guiding risk management principles and capital capacity. Key attributes of CWB’s overall risk appetite include the following:
• A conservative risk culture that is prevalent throughout CWB, from the Board to senior management to front-line staff;
• No direct exposure to wholesale banking businesses (investment banking, brokerage and trading) which are subject to significant earnings volatility and can lead to large unexpected losses compared to typical spread lending;
• A philosophy of only taking risks that are transparent and understood, and that can be measured, monitored and managed. Management strives to thoroughly understand the risks of the businesses in which CWB chooses to engage and has extensive knowledge and experience in CWB’s chosen lending sectors, key geographic regions and other complementary business areas;
• Careful and diligent management of risks at all levels led by a knowledgeable and experienced management team committed to sound management practices and the promotion of a highly ethical culture;
• A continuous commitment and focus on the achievement of high-quality, sustainable long-term financial results;
• Targeted financial performance which supports maintenance of investment grade credit ratings to allow for competitive access to funding;
• Maintenance of effective policies, procedures, guidelines, compliance standards and controls, training and oversight to guide the business practices and risk-taking activities of all employees in support of CWB’s reputation, and adherence to all legal and regulatory obligations; and,
• Risk Appetites for key risk types are established based on both quantitative and qualitative risk types by ERM as the second line of defence, endorsed by senior management and ultimately approved by the Board Risk Committee.

CWB Financial Group 2016 Annual Report 57
Risk Management Governance Structure
The foundation of our enterprise-wide risk management framework is a governance framework which includes a robust committee structure and a comprehensive set of corporate policies and limits approved by the Board of Directors or its committees, as well as
supporting corporate standards and operating guidelines. This enterprise-wide risk management framework is governed through a hierarchy of committees and individual responsibilities as outlined in Figure 6.
Figure 6 – Enterprise-Wide Risk Management Framework
Chief ExecutiveOf�ce
GroupCredit RiskCommittee
Credit Capital
Operational• Regulatory• Technology• People
MarketLiquidityFunding
GroupALCO
GroupCapital RiskCommittee
GroupOperational
RiskCommittee
GroupDisclosure
Committee
Board RiskCommittee
Executive RiskCommittee
Board of Directors
Board AuditCommittee
Reputational
Business andSupport Areas
Enterprise RiskManagement (ERM)
InternalAudit
1st Line of Defence 2nd Line of Defence 3rd Line of Defence
Chief Risk Of�cer
Board of Directors – Responsible for supervising management and the business of CWB. The Board, either directly or through its committees, is responsible for oversight in the following areas: strategic planning, risk appetite, identification and management of risk, capital management, promoting a culture of integrity, internal controls, evaluation of senior management and succession planning, public disclosure and corporate governance.
Board Risk Committee – Assists the Board in fulfilling its oversight responsibilities in relation to CWB’s identification and management of risk, adherence to corporate risk management policies and procedures, and compliance with risk-related regulatory requirements. Prior to formation of this committee, its responsibilities were owned either by the full Board or other committees of the Board. The Board Risk Committee includes a loan adjudication panel.
Board Audit Committee – Assists the Board in fulfilling its oversight responsibilities for the integrity of CWB’s financial reporting, effectiveness of CWB’s internal controls and the performance of its internal and external audit functions.
Chief Executive Officer – Directly accountable to the Board for all of CWB’s risk-taking activities. The Chief Executive Officer is supported by the Executive Risk Committee and its subcommittees, as well as ERM.
Chief Risk Officer – Directly accountable to the Chief Executive Officer. As head of ERM, the Chief Risk Officer is responsible for providing independent review and oversight of enterprise-wide risks and leadership on risk issues, developing and maintaining a risk management framework which includes key risk metrics and risk policies and fostering a strong risk culture across the enterprise. The Chief Risk Officer reports functionally to the Board Risk Committee.
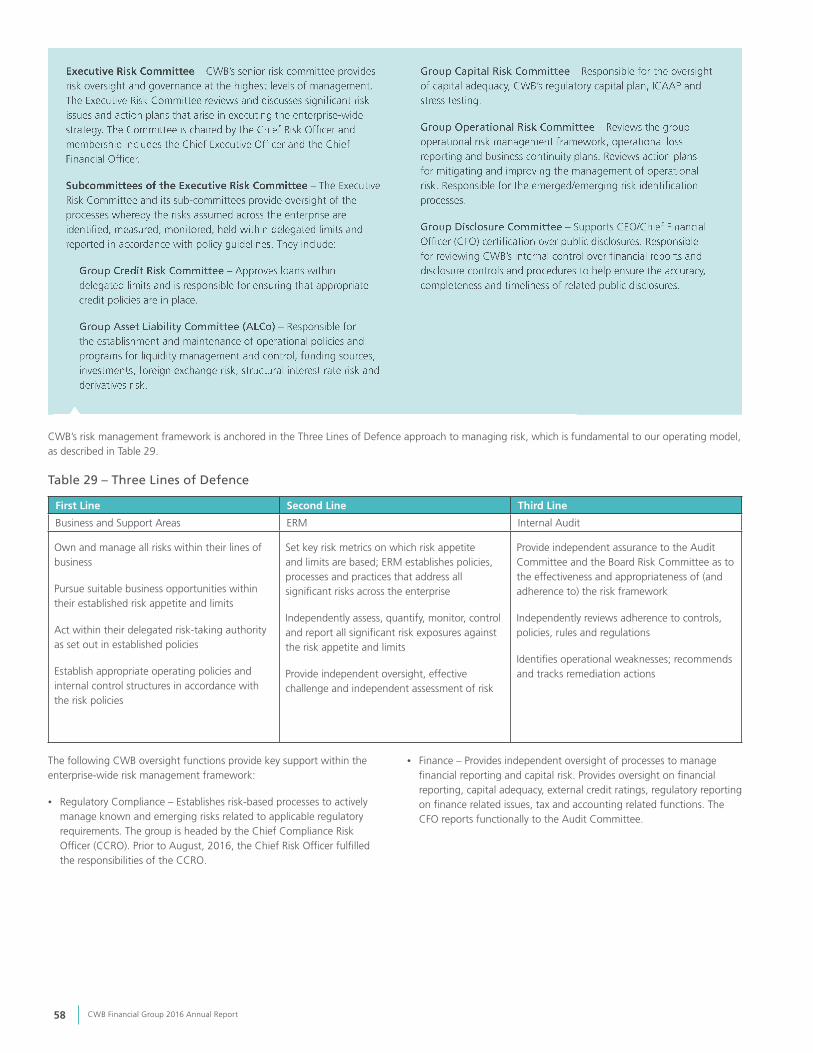
CWB Financial Group 2016 Annual Report58
CWB’s risk management framework is anchored in the Three Lines of Defence approach to managing risk, which is fundamental to our operating model, as described in Table 29.
Table 29 – Three Lines of Defence
First Line Second Line Third Line
Business and Support Areas ERM Internal Audit
Own and manage all risks within their lines of business
Pursue suitable business opportunities within their established risk appetite and limits
Act within their delegated risk-taking authority as set out in established policies
Establish appropriate operating policies and internal control structures in accordance with the risk policies
Set key risk metrics on which risk appetite and limits are based; ERM establishes policies, processes and practices that address all significant risks across the enterprise
Independently assess, quantify, monitor, control and report all significant risk exposures against the risk appetite and limits
Provide independent oversight, effective challenge and independent assessment of risk
Provide independent assurance to the Audit Committee and the Board Risk Committee as to the effectiveness and appropriateness of (and adherence to) the risk framework
Independently reviews adherence to controls, policies, rules and regulations
Identifies operational weaknesses; recommends and tracks remediation actions
The following CWB oversight functions provide key support within the enterprise-wide risk management framework:
• Regulatory Compliance – Establishes risk-based processes to actively manage known and emerging risks related to applicable regulatory requirements. The group is headed by the Chief Compliance Risk Officer (CCRO). Prior to August, 2016, the Chief Risk Officer fulfilled the responsibilities of the CCRO.
• Finance – Provides independent oversight of processes to manage financial reporting and capital risk. Provides oversight on financial reporting, capital adequacy, external credit ratings, regulatory reporting on finance related issues, tax and accounting related functions. The CFO reports functionally to the Audit Committee.
Executive Risk Committee – CWB’s senior risk committee provides risk oversight and governance at the highest levels of management. The Executive Risk Committee reviews and discusses significant risk issues and action plans that arise in executing the enterprise-wide strategy. The Committee is chaired by the Chief Risk Officer and membership includes the Chief Executive Officer and the Chief Financial Officer.
Subcommittees of the Executive Risk Committee – The Executive Risk Committee and its sub-committees provide oversight of the processes whereby the risks assumed across the enterprise are identified, measured, monitored, held within delegated limits and reported in accordance with policy guidelines. They include:
Group Credit Risk Committee – Approves loans within delegated limits and is responsible for ensuring that appropriate credit policies are in place.
Group Asset Liability Committee (ALCo) – Responsible for the establishment and maintenance of operational policies and programs for liquidity management and control, funding sources, investments, foreign exchange risk, structural interest rate risk and derivatives risk.
Group Capital Risk Committee – Responsible for the oversight of capital adequacy, CWB’s regulatory capital plan, ICAAP and stress testing.
Group Operational Risk Committee – Reviews the group operational risk management framework, operational loss reporting and business continuity plans. Reviews action plans for mitigating and improving the management of operational risk. Responsible for the emerged/emerging risk identification processes.
Group Disclosure Committee – Supports CEO/Chief Financial Officer (CFO) certification over public disclosures. Responsible for reviewing CWB’s internal control over financial reports and disclosure controls and procedures to help ensure the accuracy, completeness and timeliness of related public disclosures.

CWB Financial Group 2016 Annual Report 59
REPORT ON PRINCIPAL RISKSWhile CWB’s operations are exposed to numerous types of risk, certain risks, identified as principal risks, have the greatest potential to materially impact operations and financial performance:
CREDIT RISK
Credit risk is the risk that a financial loss will be incurred due to the failure of a counterparty to discharge its contractual commitment or obligation to CWB.
Risk Overview
The main source of credit risk exposure for CWB results from granting loans and leases. CWB’s credit risk management culture reflects the unique combination of policies, practices, experience and management attitudes that support growth within chosen industries and geographic markets. Underwriting standards are designed to ensure an appropriate balance of risk and return, and are supported by established loan exposure limits in areas of demonstrated lending expertise. Concentration is measured against specified tolerance levels by geographic region, industry sector and product type. In order to minimize its potential loss
given default, the vast majority of loans are secured by tangible collateral. CWB’s approach to managing credit risk has proven to be very effective, as demonstrated by CWB’s relatively stable long-term average annual provision for credit losses and customarily low write-offs measured as a percentage of total loans.
Refer to the Loans and Credit Quality sections of this MD&A for additional information.
Risk Governance
The credit approval process is centrally controlled, with all significant credit requests submitted to Credit Risk Management for adjudication. Credit Risk Management is independent of the originating business. Requests for credit approval beyond the lending limit of the CEO are referred to the Group Credit Risk Committee or the Board Risk Committee’s loan adjudication panel.
Risk Management
CWB is committed to a number of important principles to manage credit exposures, which include:
• Oversight provided by the Board Risk Committee;
• Delegated lending authorities that are clearly communicated to lenders and other personnel engaged in the credit granting process;
• Credit policies, guidelines and directives which are communicated within all branches, business lines and to officers whose activities and responsibilities include credit granting and risk assessment;
• Appointment of personnel engaged in credit granting who are both qualified and experienced;
• A standard credit risk-rating classification established for all credits;
• A review at least annually of credit risk-rating classifications and individual credit facilities (except consumer loans and single-unit residential mortgages);
• Quarterly review of risk diversification by geographic area, industry sector and product measured against assigned portfolio limits;
• Ongoing development of credit analytics reporting to assess portfolio risks at a granular level;
• Pricing of credits commensurate with risk to ensure an appropriate financial return;
• Management of growth while maintaining the quality of loans;
• Early recognition of problem accounts and immediate action to protect the safety of CWB’s capital;
• Delegation of loans deemed to carry higher risks to a specialized loan workout group that performs an appropriate level of regular monitoring and close management;
• Independent reviews of credit evaluation, risk classification and credit management procedures by Internal Audit, which includes direct reporting of results to senior management, the CEO and the Audit Committee of the Board; and,
• Detailed quarterly reviews of accounts rated less than satisfactory. Reviews include a recap of action plans for each less than satisfactory account, the completion of a watch list report recording accounts with evidence of weakness and an impaired report covering loans that show impairment to the point where a loss is possible. A summary report of less than satisfactory accounts is reviewed on a quarterly basis by the Board Risk Committee.

CWB Financial Group 2016 Annual Report60
Credit Risk Concentration
Risk diversification is addressed by establishing portfolio limits by geographic area, industry sector and product. The policy is to limit loans to connected corporate borrowers to not more than 10% of CWB’s shareholders’ equity. Generally, CWB’s lending limit is $50 million for a single risk exposure. However, for certain quality
connections that confirm debt service capacity and loan security from more than one source, the limit is generally $100 million. CWB clients with larger borrowing requirements can be accommodated through loan syndications with other financial institutions.
Environmental Risk
While the day-to-day operations of CWB do not have a material impact on the environment, environmental risks include the risk of loss given default if a borrower is unable to repay loans due to environmental cleanup costs, and the risk of damage to CWB’s reputation resulting from the same. In order to manage these risks, and to help mitigate CWB’s overall impact on the environment, CWB evaluates potential environmental risks as part of its credit granting process. If potential environmental risks are identified that cannot be resolved to CWB’s satisfaction, the application will be denied.
Reports on environmental inspections and findings are provided quarterly to the Board Risk Committee. Where financing is provided, Internal Audit will sample test loan files to ensure environmental studies required as a condition of financing are in place, including review for a transmittal letter from the author of the environmental study indicating that it may be relied upon for financing purposes.
Portfolio Quality
CWB’s strategy is to maintain a quality, secured and diversified loan portfolio by engaging experienced personnel who provide a hands-on approach in credit granting, account management and timely action when problems develop. Lending is targeted to small- and medium-sized businesses, and to individuals. Relationship banking and “knowing your client” are important tenets of effective account management. Earning an appropriate financial return for the level of risk is also fundamental. Geographic diversification of the loan portfolio outside of Western Canada is achieved through National Leasing’s representation across all provinces of Canada, residential mortgages underwritten and serviced by Optimum in select regions of Ontario and Atlantic Canada, participation in syndicated lending facilities primarily led by other Canadian banks, and increasingly through CWB Maxium and CWB Franchise Finance.
For additional information, see the Loans and Credit Quality sections of this MD&A.

CWB Financial Group 2016 Annual Report 61
MARKET RISK
Market risk is the impact on earnings and economic value of equity resulting from changes in financial market variables such as interest rates and foreign exchange rates. CWB’s Market Risk is primarily comprised of structural interest rate risk on the balance sheet, and liquidity and funding risk. A smaller amount of market risk relates to investment risk in the relatively small securities portfolio, and foreign exchange.
Risk Overview
Market risk arises when extending loans, taking deposits and making investments. The most material market risks for CWB are those related to changes in interest rates. CWB does not have a trading book; it does not undertake market activities such as market making, arbitrage or proprietary trading and, therefore, does not have direct risks related to those activities. A diversified cash and securities portfolio is maintained
that is primarily comprised of high-quality debt instruments, with some exposure to preferred shares. These instruments are subject to price fluctuations based on movements in interest rates and volatility in financial markets. CWB liquidated its holdings of common equities in 2016 and has no plans to re-establish this portfolio. CWB has limited direct exposure to foreign exchange risk.
Risk Governance
Market risk is managed in accordance with the approved market risk policy and the corresponding operational policies. As the first line of defence, Treasury owns and manages the market risk on a daily
basis. ALCo provides tactical and strategic direction and is responsible for ongoing oversight, and reviews and endorses the operational policies.
Subcategories of Market Risk
Interest Rate Risk
Interest rate risk is the impact on earnings and economic value of equity resulting from changes in interest rates.
Structural interest rate risk arises when changes in interest rates affect the cash flows, earnings and values of assets and liabilities. The objective of structural interest rate risk management is to maintain high-quality earnings, maximize sustainable product spreads and maintain an appropriate balance between earnings volatility and economic value volatility while keeping both within their respective risk appetite limits.
Structural Interest Rate Risk arises due to the duration mismatch between our assets and liabilities. Adverse interest rate movements may cause a reduction in earnings; and/or a reduction in the economic value of CWB’s assets; and/or an increase in the economic value of CWB’s liabilities. Structural interest rate risk is primarily comprised of duration mismatch risk and product embedded option risk. Duration mismatch risk arises when there are differences in the scheduled maturity, repricing dates or reference rates of assets, liabilities and derivatives. The net duration mismatch, representing residual assets funded by common shareholders’ equity, is managed to a target profile through interest rate swaps and CWB’s cash and securities portfolio. Product embedded option risk arises when product features allow customers to alter scheduled maturity or repricing dates. Product embedded options include loan prepayment, deposit redemption privileges and committed rates on unadvanced mortgages.
Variation in market interest rates can affect net interest income by altering cash flows and spreads. Variation in market interest rates can also affect the economic value of a bank’s assets, liabilities, and off-balance sheet (OBS) positions. Thus, the sensitivity of a bank’s economic value to fluctuations in interest rates is an important consideration of shareholders, management and regulators. The economic value of an instrument represents an assessment of the present value of its expected net cash flows, discounted to reflect market rates. By extension, the economic value of CWB’s equity can be viewed as the present value
of CWB’s expected net cash flows, defined as the expected cash flows on interest-sensitive assets minus the expected cash flows on interest-sensitive liabilities plus the expected net cash flows on OBS positions. In this sense, the economic value perspective reflects one view of the sensitivity of net worth to fluctuations in interest rates.
Management of structural interest rate risk is a balancing act between short-term income volatility and volatility in the long-term value of CWB’s equity. Treasury manages the economic value of the banking book to a “benchmark duration” which reflects this trade-off. Benchmark duration is recommended by Treasury and approved by ALCo. The benchmark duration considers an appropriate trade-off between:
• earnings volatility and volatility in the economic value of CWB’s equity;
• risk and return (e.g. increasing duration increases the exposure to rising interest rates, but also enables an interest income pick-up from a positively sloping yield curve); and,
• expected interest rate movements.
While management of the benchmark duration is the responsibility of the first line of defence (recommended by Treasury and approved by ALCo) and detailed in the operational policies, it is important that the resulting risk exposures stay within CWB’s risk appetite.

CWB Financial Group 2016 Annual Report62
Risk Metrics
Structural interest rate risk is measured using simulations, earnings sensitivity and economic value sensitivity analysis, stress testing and gap analysis, in addition to other traditional risk metrics.
• Earnings at Risk - Earnings at risk (EaR) is defined as the potential reduction in net interest income due to adverse interest rate movements over a one-year horizon. It is measured both against stress scenarios historically observed (historical simulation or historical Value at Risk (VaR)) and standard parallel interest shocks (interest rate sensitivity).
• Economic Value of Equity at Risk - Economic value of equity at risk (EVaR) is defined as the potential reduction in economic value of CWB’s equity due to adverse interest rate movements. This is not an earnings measure, but rather a value measure; and it is also measured against both stress scenarios historically observed (historical simulation or historical VaR) and standard parallel interest shocks (interest rate sensitivity).
CWB’s Interest Rate Risk Exposures
Exposure to interest rate risk is controlled by managing the size of the static gap positions between interest sensitive assets and interest sensitive liabilities for future periods. This is supplemented by historical VaR for economic value of CWB’s equity, estimated by applying historical interest rate scenarios to interest sensitive assets and interest sensitive liabilities. These analyses are supplemented by stress testing of the asset liability portfolio structure, duration analysis and dollar estimates of net interest income sensitivity for periods of up to one year after Treasury hedging activity. The interest rate gap is measured at least monthly. Note 26 to the consolidated financial statements shows the gap position at October 31, 2016 for select time intervals.
The analysis in Note 26 is a static measurement of interest rate sensitivity gaps at a specific point in time, and there is potential for these gaps to change significantly over a short period. The impact on earnings from changes in market interest rates will depend on both the magnitude of and speed with which interest rates change, as well as the size and maturity structure of the cumulative interest rate gap position and the management of those positions over time.
The one-year and under cumulative gap represented 3.5% of total assets at October 31, 2016, compared to negative 3.5% one year ago, while the one-month and under gap was 0.8%, compared to negative 1.5% a year earlier.
Interest rate risk is managed to ensure sustainable earnings over time, balancing the impact on current year earnings against changes in economic value at risk over the life of the asset and liability portfolios.
The estimated sensitivity of net interest income to a change in interest rates is presented in Table 30. The amounts represent the estimated change in net interest income over the time period shown resulting from a one percentage point change in interest rates. The estimates are based on a number of assumptions and factors, which include:
• A constant structure in the interest sensitive asset liability portfolio;
• Floor levels for various deposit liabilities;
• Interest rate changes affecting interest sensitive assets and liabilities by proportionally the same amount and applied at the appropriate repricing dates; and,
• No early redemptions.
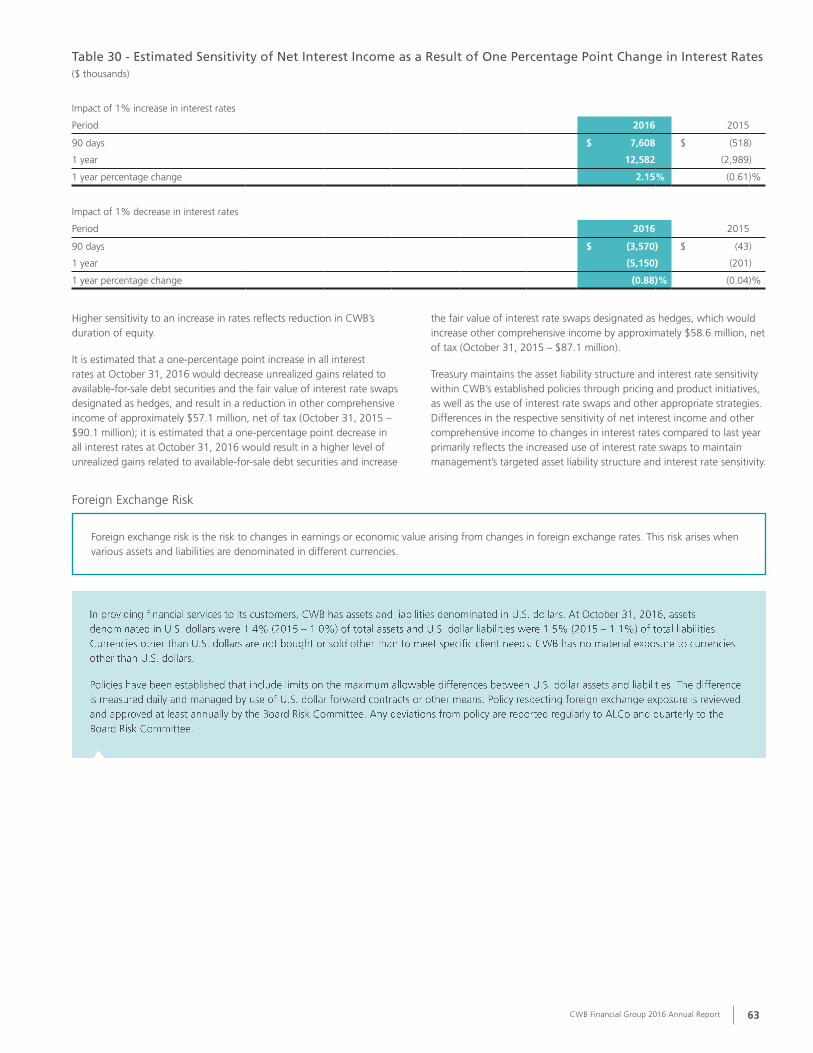
CWB Financial Group 2016 Annual Report 63
Table 30 - Estimated Sensitivity of Net Interest Income as a Result of One Percentage Point Change in Interest Rates($ thousands)
Impact of 1% increase in interest rates
Period 2016 2015
90 days $ 7,608 $ (518)
1 year 12,582 (2,989)
1 year percentage change 2.15 % (0.61)%
Impact of 1% decrease in interest rates
Period 2016 2015
90 days $ (3,570) $ (43)
1 year (5,150) (201)
1 year percentage change (0.88)% (0.04)%
Higher sensitivity to an increase in rates reflects reduction in CWB’s duration of equity.
It is estimated that a one-percentage point increase in all interest rates at October 31, 2016 would decrease unrealized gains related to available-for-sale debt securities and the fair value of interest rate swaps designated as hedges, and result in a reduction in other comprehensive income of approximately $57.1 million, net of tax (October 31, 2015 – $90.1 million); it is estimated that a one-percentage point decrease in all interest rates at October 31, 2016 would result in a higher level of unrealized gains related to available-for-sale debt securities and increase
the fair value of interest rate swaps designated as hedges, which would increase other comprehensive income by approximately $58.6 million, net of tax (October 31, 2015 – $87.1 million).
Treasury maintains the asset liability structure and interest rate sensitivity within CWB’s established policies through pricing and product initiatives, as well as the use of interest rate swaps and other appropriate strategies. Differences in the respective sensitivity of net interest income and other comprehensive income to changes in interest rates compared to last year primarily reflects the increased use of interest rate swaps to maintain management’s targeted asset liability structure and interest rate sensitivity.
Foreign Exchange Risk
Foreign exchange risk is the risk to changes in earnings or economic value arising from changes in foreign exchange rates. This risk arises when various assets and liabilities are denominated in different currencies.
In providing financial services to its customers, CWB has assets and liabilities denominated in U.S. dollars. At October 31, 2016, assets denominated in U.S. dollars were 1.4% (2015 – 1.0%) of total assets and U.S. dollar liabilities were 1.5% (2015 – 1.1%) of total liabilities. Currencies other than U.S. dollars are not bought or sold other than to meet specific client needs. CWB has no material exposure to currencies other than U.S. dollars.
Policies have been established that include limits on the maximum allowable differences between U.S. dollar assets and liabilities. The difference is measured daily and managed by use of U.S. dollar forward contracts or other means. Policy respecting foreign exchange exposure is reviewed and approved at least annually by the Board Risk Committee. Any deviations from policy are reported regularly to ALCo and quarterly to the Board Risk Committee.

CWB Financial Group 2016 Annual Report64
Liquidity And Funding Risk
Liquidity risk is the risk that CWB cannot meet a demand for cash or fund its financial obligations in a cost efficient or timely manner as they become due. These financial obligations can arise from withdrawals of deposits, debt maturities, and commitments to provide credit.
Risk Overview
CWB maintains a sound, prudent and conservative approach to managing exposure to liquidity risk, including targeting a contingency planning horizon under stressed operating conditions that may be caused by company-specific or market-wide stress scenarios. The contingency planning horizon and related liquidity and funding management strategies comprise an integrated liquidity risk management program designed to ensure that CWB manages liquidity risk within an appropriate threshold.
CWB’s key risk mitigation strategies include:
• an appropriate balance between the level of risks CWB undertakes and the corresponding cost of risk mitigation that considers the potential impact of extreme but plausible events;
• broad funding access, including preserving and growing a reliable base of core deposits and continual access to diversified sources of funding;
• a comprehensive group-wide liquidity contingency plan that is supported by a pool of unencumbered high-quality liquid assets and marketable securities that would provide assured access to liquidity in a crisis; and,
• the maintenance of a liquidity position to manage current and future liquidity requirements while also contributing to the flexibility, safety and soundness of CWB under times of stress.
Refer to the Liquidity Management section of this MD&A for additional information.
Risk Governance
Liquidity management is centralized to better facilitate the effective management of liquidity risk. The Board Risk Committee approves market risk management policies and delegates liquidity risk authorities to senior management. As the first line of defence, Treasury is responsible for managing the liquidity and funding
risk. ALCo oversees the treasury function and provides tactical and strategic guidance. ERM, as the second line of defence, is responsible for independent oversight.

CWB Financial Group 2016 Annual Report 65
Risk Management
CWB has a comprehensive liquidity risk management policy. The key elements of managing liquidity risk for CWB include the following:
• Policies – Liquidity risk management policies establish targets for minimum liquidity, set the monitoring regime, and define authority levels and responsibilities. Policies are reviewed at a minimum annually by ALCo, Executive Risk Committee and the Board Risk Committee. Limit setting establishes acceptable thresholds for liquidity risk;
• Monitoring – Trends and behaviours regarding how clients manage their deposits and loans are monitored to determine appropriate liquidity levels. Active monitoring of the external environment is performed using a wide range of sources and economic barometers;
• Measurement and modelling – CWB’s liquidity model measures and forecasts cash inflows and outflows, including any cash flows related to applicable off-balance sheet activities over various risk scenarios;
• Reporting – Treasury oversight of all significant liquidity risks that support analysis, risk measurement, stress testing, monitoring and reporting to both ALCo and the Board Risk Committee;
• Stress testing – CWB performs liquidity stress testing on a regular basis to evaluate the potential effect of both systemic and company-specific (idiosyncratic) disruptions on CWB’s liquidity position. Liquidity stress tests consider the effect of changes in funding assumptions, depositor behaviour and the market behaviour of liquid assets. CWB stress tests liquidity as per guidance
from OSFI as described in the Liquidity Adequacy Requirement. Stress test results are reviewed by ALCo and considered in making liquidity management decisions. Liquidity stress testing has many purposes, including, but not limited to:
• helping the Board Risk Committee and senior management understand the potential behavior of various positions on CWB’s balance sheet in circumstances of stress; and,
• facilitating the development of effective funding, risk mitigation and contingency plans.
• Contingency planning – A liquidity contingency plan is maintained that defines a liquidity event and specifies the desired approaches for analyzing and responding to actual and potential liquidity events. The plan outlines an appropriate governance structure for the management and monitoring of liquidity events, processes for effective internal and external communication, and identifies potential countermeasures to be considered at various stages of an event;
• Funding diversification – CWB actively manages the diversification of its deposit liabilities by source, type of depositor, instrument and term. Supplementary funding sources currently include securitization, capital market issuance and whole loan sales; and,
• Core liquidity – CWB maintains a pool of highly liquid, unencumbered assets that can be readily sold, or pledged to secure borrowings, under stressed market conditions or due to company-specific events.
CWB has remained in compliance with OSFI’s Liquidity Coverage Ratio (LCR) and the Net Cumulative Cash Flow monitoring tool, since its introduction on January 1, 2015.
Contractual Obligations
CWB enters into contracts in the normal course of business that give rise to commitments of future minimum payments that affect the liquidity position. In addition to the obligations related to deposits and subordinated debentures discussed in the Deposits and Liquidity
Management sections of this MD&A, as well as Notes 13, 17, 21 and 30 of the consolidated financial statements, contractual obligations outstanding at October 31, 2016 are disclosed in Table 31.
Table 31 - Contractual Obligations($ thousands)
Within 1 Year
1 to 3Years
4 to 5Years
More than5 Years Total
Lease commitments $ 13,205 $ 23,754 $ 20,487 $ 34,582 $ 92,028
Purchase obligations for operating and capital expenditures 2,909 5,792 364 108 9,173
October 31, 2016 $ 16,114 $ 29,546 $ 20,851 $ 34,690 $ 101,201
October 31, 2015 $ 17,054 $ 22,682 $ 19,428 $ 40,479 $ 99,643
Credit Ratings
CWB’s ability to efficiently access capital markets funding on a cost-effective basis is partially dependent upon the maintenance of satisfactory credit ratings. Such credit ratings, accompanied with a stable or positive
outlook, increase the breadth of clients and investors able to participate in various deposit and debt offerings, while also lowering CWB’s overall cost of capital.
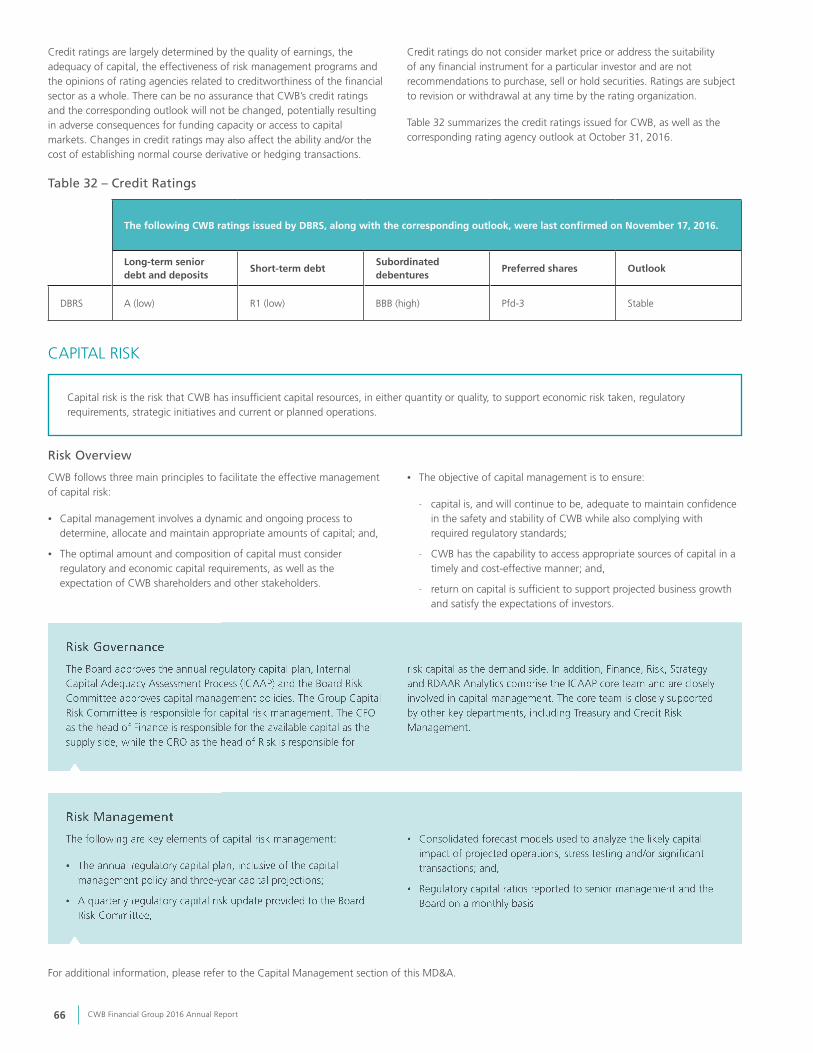
CWB Financial Group 2016 Annual Report66
Credit ratings are largely determined by the quality of earnings, the adequacy of capital, the effectiveness of risk management programs and the opinions of rating agencies related to creditworthiness of the financial sector as a whole. There can be no assurance that CWB’s credit ratings and the corresponding outlook will not be changed, potentially resulting in adverse consequences for funding capacity or access to capital markets. Changes in credit ratings may also affect the ability and/or the cost of establishing normal course derivative or hedging transactions.
Credit ratings do not consider market price or address the suitability of any financial instrument for a particular investor and are not recommendations to purchase, sell or hold securities. Ratings are subject to revision or withdrawal at any time by the rating organization.
Table 32 summarizes the credit ratings issued for CWB, as well as the corresponding rating agency outlook at October 31, 2016.
Table 32 – Credit Ratings
The following CWB ratings issued by DBRS, along with the corresponding outlook, were last confirmed on November 17, 2016.
Long-term senior debt and deposits
Short-term debtSubordinated debentures
Preferred shares Outlook
DBRS A (low) R1 (low) BBB (high) Pfd-3 Stable
CAPITAL RISK
Capital risk is the risk that CWB has insufficient capital resources, in either quantity or quality, to support economic risk taken, regulatory requirements, strategic initiatives and current or planned operations.
Risk Overview
CWB follows three main principles to facilitate the effective management of capital risk:
• Capital management involves a dynamic and ongoing process to determine, allocate and maintain appropriate amounts of capital; and,
• The optimal amount and composition of capital must consider regulatory and economic capital requirements, as well as the expectation of CWB shareholders and other stakeholders.
• The objective of capital management is to ensure:
- capital is, and will continue to be, adequate to maintain confidence in the safety and stability of CWB while also complying with required regulatory standards;
- CWB has the capability to access appropriate sources of capital in a timely and cost-effective manner; and,
- return on capital is sufficient to support projected business growth and satisfy the expectations of investors.
Risk Governance
The Board approves the annual regulatory capital plan, Internal Capital Adequacy Assessment Process (ICAAP) and the Board Risk Committee approves capital management policies. The Group Capital Risk Committee is responsible for capital risk management. The CFO as the head of Finance is responsible for the available capital as the supply side, while the CRO as the head of Risk is responsible for
risk capital as the demand side. In addition, Finance, Risk, Strategy and RDAAR Analytics comprise the ICAAP core team and are closely involved in capital management. The core team is closely supported by other key departments, including Treasury and Credit Risk Management.
Risk Management
The following are key elements of capital risk management:
• The annual regulatory capital plan, inclusive of the capital management policy and three-year capital projections;
• A quarterly regulatory capital risk update provided to the Board Risk Committee;
• Consolidated forecast models used to analyze the likely capital impact of projected operations, stress testing and/or significant transactions; and,
• Regulatory capital ratios reported to senior management and the Board on a monthly basis.
For additional information, please refer to the Capital Management section of this MD&A.

CWB Financial Group 2016 Annual Report 67
OPERATIONAL RISK
Operational risk is the risk of loss resulting from human error, inadequate or failed processes, systems or controls, or external events. There are three main subsets of operational risk: regulatory risk, people risk and technology risk. Other types of operational risk include cybersecurity risk and reputation risk.
Risk Overview
Operational risk is inherent in all of CWB’s business activities including banking, trust, wealth management and, up to May 1, 2015, insurance operations, and is embedded in processes that support the management of principal risks such as credit, liquidity, market, capital and reputational risk. CWB is exposed to operational risk from internal business activities, external threats and outsourced business activities. Its impact can be financial loss, loss of reputation, loss of competitive position, regulatory penalties, or failure in the management of other risks. While operational risk cannot be completely eliminated, proactive operational risk management is a key strategy to mitigate this risk. The primary financial measure of operational risk is actual losses incurred. CWB incurred no
material losses related to operational risk in 2016 or 2015.
The regulatory framework requires certain amounts of capital to be allocated to support operational risk. CWB uses the Standardized approach to measure operational risk. CWB has a group-wide Operational Risk Management Framework to ensure that all employees understand their responsibilities with respect to operational risk management. The Operational Risk Management Framework encompasses a common language of risk coupled with programs and methodologies for identification, measurement, control, and management of operational risk. This is supported by specific operational risk training for all staff.
Risk Governance
Business and support areas as the first line of defence are fully accountable for the management and control of operational risks to which they are exposed. The Group Operational Risk Committee has responsibility for operational risk, with oversight by the Board Risk Committee, the Executive Risk Committee and senior management.
ERM, as the second line of defence, is responsible for the continual enhancement of the Group Operational Risk Framework and supporting policies. The Board Risk Committee has ultimate oversight and approves the Group’s Operational Risk Management Framework.
Risk Management
Following is a summary of strategies and factors that assist with the effective management of operational risk:
• Management remains close to operations, which helps to facilitate effective internal communication and operational control;
• Surveys on employee engagement and corporate culture;
• Communication of, and specific training related to, the importance of effective operational risk management to all levels;
• Management that is very engaged with promoting CWB’s operational risk tolerance and appetite; and,
• Ongoing enhancement of group-wide operational risk management processes.
Key elements of the Operational Risk Management Framework include:
• Common definitions of operational risk - CWB incorporates standard risk terms and certain key operational risk definitions as part of its Group Operational Risk Management Framework and supporting policies.
• Risk assessments - Risk control self-assessments are utilized throughout CWB with the objective to proactively identify key operational risk exposures and assess whether appropriate risk-mitigating internal controls are in place and operating effectively. Action plans may result where additional strategies are identified to reduce risk exposure.
• Operational risk reporting - Loss data monitoring is important to maintain awareness of identified operational risks and to assist management in taking constructive action to reduce exposures to future losses.
Additional key components include:
• implementation of policies and procedural controls appropriate to address identified risks (including segregation of duties and other fundamental checks and balances);
• continual enhancements to fraud prevention processes, policies and communication;
• established “whistleblower” processes and employee code of conduct;
• maintenance of an outsourcing management program;
• at least annual assessment and benchmarking of business insurance;
• human resource policies and processes to ensure staff are adequately trained for the tasks for which they are responsible and to enable retention and recruitment;
• a Regulatory Compliance team focused on key regulatory compliance areas such as privacy, anti-money laundering, anti-terrorist financing and consumer regulations;

CWB Financial Group 2016 Annual Report68
• use of technology that incorporates automated systems with built-in controls and active management of configuration and change management along with information security management programs;
• enhanced focus on data quality as an important and strategic asset;
• effective project management processes supported by a designated committee comprised of representatives of senior management; and,
• continual updating and testing of procedures and contingency plans for disaster recovery and business continuity (including pandemic planning).
Subcategories of Operational Risk
Regulatory Compliance Risk
Regulatory compliance risk is the risk of negative impact to business activities, earnings or capital, regulatory relationships or reputation as a result of non-compliance with applicable regulatory requirements.
The businesses operated by CWB are highly regulated through laws and regulations that have been put in place by various federal and provincial governments and regulators. Changes to laws and regulations, including changes in their interpretation or implementation, could adversely affect CWB. CWB’s failure to comply with applicable laws, regulations, industry codes or regulatory expectations could result in sanctions, financial penalties and costs associated with litigation that could adversely impact earnings and damage reputation. Although most sources of regulatory risk are outside of management’s direct control, CWB takes what it believes to be reasonable and prudent measures designed to support compliance with governing laws and regulations.
Over the past several years, the intensity of supervisory oversight of all federally regulated Canadian financial institutions has increased significantly in terms of both regulation and new standards. This includes amplified supervisory activities, an increase in the volume of
regulation, more frequent data and information requests from regulators, and shorter implementation time frames for regulatory requirements, including the Basel III capital and liquidity standards. Certain regulations may also impact CWB’s ability to compete against both non-OSFI and other OSFI regulated entities. Effective management of regulatory risk and compliance in the current environment requires, and is expected to continue to require, considerable internal resources and the active involvement of senior management and the Board.
Notwithstanding the additional resources, the volume, pace and implementation of new and amended regulations and standards increases the risk of unintended consequences and non-compliance for all regulated entities. CWB has intensified its efforts for regulatory compliance risk management. A number of initiatives are underway to further its compliance risk management capabilities.
People Risk
People risk is the risk that CWB is not able to attract and retain sufficient qualified employees to implement its strategies and/or achieve its objectives.
Competition for qualified employees in CWB’s key markets remains apparent, reflecting the general level of economic activity and the needs of other financial services participants within and outside CWB’s geographic footprint.
CWB intends to continually attract and retain sufficient qualified employees to successfully execute against its strategic direction. Inability to maintain an appropriate staff complement would adversely affect CWB’s ability to achieve its strategic objectives.
Technology Risk
Technology risk is related to the operational performance, confidentiality, integrity and availability of our information, systems and infrastructure.
CWB is highly dependent upon information technology and supporting infrastructure, such as voice, data and network access. In addition to internal resources, various third parties provide key components of the infrastructure and applications. Disruptions in information technology and infrastructure, whether attributed to internal or external factors, and including potential disruptions in the services provided by various third parties, could adversely affect the ability of CWB to conduct regular
business and/or deliver products and services to clients. Ongoing diligence is required to ensure systems are secure from threats. Implementation of CWB’s new core banking system reduces technology risk compared to the legacy system; however, CWB currently has a number of other technology projects underway which increase risk exposure related to information systems and technology.

CWB Financial Group 2016 Annual Report 69
Cybersecurity Risk
Cybersecurity risk is related to the ongoing threat that systems and their data may be attacked, damaged or subject to unauthorized access.
CWB manages cyber security risk by ensuring appropriate technologies, processes and practices are effectively designed and implemented to help prevent, detect and respond to threats as they emerge and evolve. CWB relies upon a complete suite of advanced controls to protect itself and its customers from attack and has partnered with leading third-party service
providers to provide counsel and support should the need arise. CWB regularly tests the completeness and effectiveness of its cybersecurity program and, through ongoing vigilance, has not experienced a cybersecurity event of any materiality.
Reputation Risk
Reputation risk is the consequence of not managing risks effectively and cannot be considered in isolation from other risks.
Negative public opinion can result from actual or alleged misconduct in any number of activities, either on the part of employees or external partners, but often involves questions about business ethics and integrity, competence, corporate governance practices, quality and accuracy of financial reporting disclosures, or quality of products and service.
Negative public opinion could adversely affect CWB’s ability to attract and retain clients and/or employees and could expose CWB to litigation and/or regulatory action. Responsibility for governance and management of
reputation risk falls to all CWB employees, including senior management and the Board.
All directors, officers and employees have a responsibility to conduct their activities in accordance with the CWB Group’s personal conduct policies and in a manner that minimizes reputational risk. In addition to members of senior management, the Legal, Strategy and Investor Relations, and Regulatory Compliance departments are particularly involved in the management of reputation risk.
OTHER RISK FACTORSIn addition to the risks described above, other risk factors, including those below and those identified in the forward-looking statements section, may adversely affect CWB’s businesses and financial results.
General Business and Economic Conditions
The majority of CWB’s business is conducted in Western Canada, with a growing business presence in Ontario. Accordingly, CWB’s overall financial performance is impacted by general business and economic conditions across the country. Several factors that could impact general business and economic conditions in CWB’s markets include, but are not limited to, changes in: short-term and long-term interest rates; energy and other commodity prices; real estate prices; adverse global economic events and/or elevated economic uncertainties; inflation; exchange rates; levels of consumer, business and government spending; levels of consumer, business and government debt; and consumer confidence.
Level of Competition
CWB’s performance is impacted by the intensity of competition in the markets in which it operates. Client retention may be influenced by many factors, including relative service levels, the prices and attributes of products and services, changes in products and services, and actions taken by competitors.
Accuracy and Completeness of Information on Clients and Counterparties
CWB depends on the accuracy and completeness of information about customers and counterparties. In deciding whether to extend credit or enter into other transactions with clients and counterparties, CWB may rely on information furnished by them, including financial statements, appraisals, external credit ratings and other financial information. CWB may also rely on the representations of clients and counterparties as to the accuracy and completeness of that information and, with respect to financial statements, on the reports of auditors. CWB’s financial condition
and earnings could be negatively impacted to the extent it relies on financial statements that do not comply with standard accounting practices, that are materially misleading, or that do not fairly present, in all material respects, the financial condition and results of operations of the customer or counterparties.
Ability to Execute Growth Initiatives
As part of its long-term corporate strategy, CWB intends to continue growing its business through a combination of organic growth and strategic acquisitions. The ability to successfully grow its business will be dependent on a number of factors, including identification of accretive new business or acquisition opportunities, negotiation of purchase agreements on satisfactory terms and prices, approval of acquisitions by regulatory authorities, securing satisfactory regulatory capital and financing arrangements, and effective integration of newly acquired operations into the existing business. All of these activities may be more difficult to implement or may take longer to execute than management anticipates. Further, any significant expansion of the business may increase the operating complexity and divert management’s attention away from established or ongoing business activities. Any failure to successfully manage acquisition strategies could have a material adverse impact on CWB’s business, financial condition and results of operations.
Adequacy of CWB’s Risk Management Framework
The Risk Management Framework is made up of various processes and strategies for managing risk exposure. Given the structure and scope of its operations, CWB is primarily subject to credit, market (mainly interest rate), liquidity, operational, reputation, regulatory, environmental, and other risks. There can be no assurance that the framework to manage risks, including the framework’s underlying assumptions and models, will be effective under all conditions and circumstances. If the risk management framework proves ineffective, CWB could be materially affected by unexpected financial losses and/or other harm.
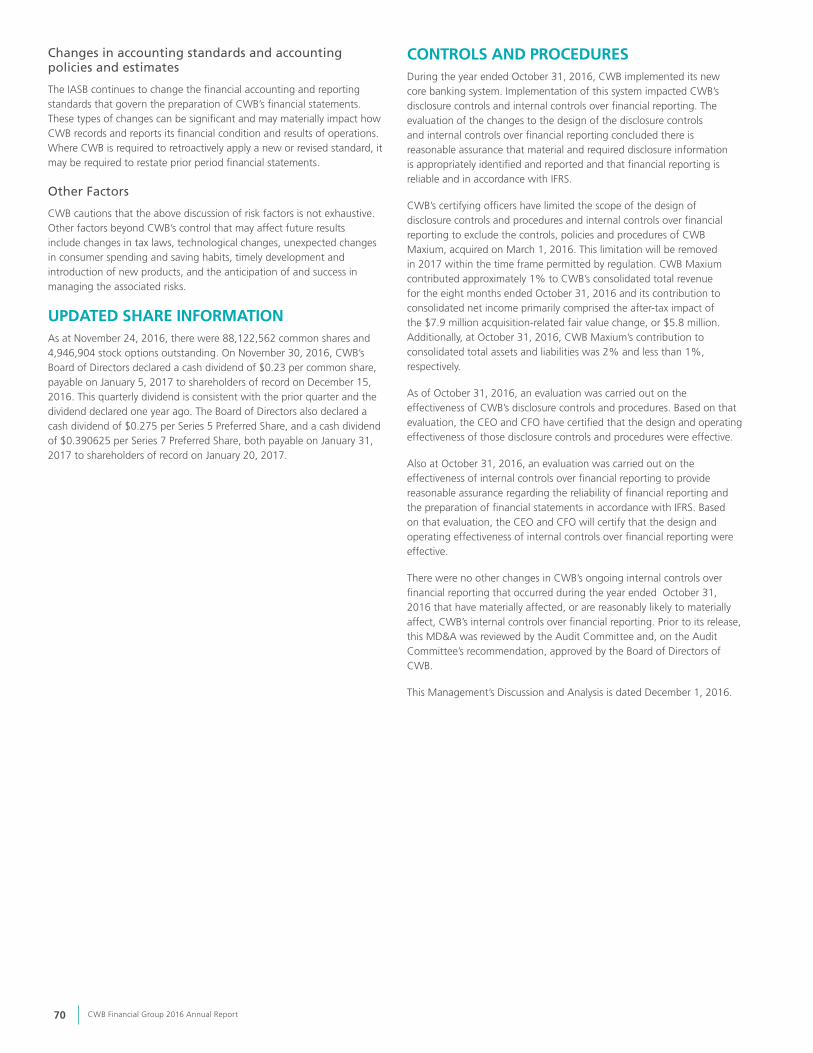
CWB Financial Group 2016 Annual Report70
Changes in accounting standards and accounting policies and estimates
The IASB continues to change the financial accounting and reporting standards that govern the preparation of CWB’s financial statements. These types of changes can be significant and may materially impact how CWB records and reports its financial condition and results of operations. Where CWB is required to retroactively apply a new or revised standard, it may be required to restate prior period financial statements.
Other Factors
CWB cautions that the above discussion of risk factors is not exhaustive. Other factors beyond CWB’s control that may affect future results include changes in tax laws, technological changes, unexpected changes in consumer spending and saving habits, timely development and introduction of new products, and the anticipation of and success in managing the associated risks.
UPDATED SHARE INFORMATIONAs at November 24, 2016, there were 88,122,562 common shares and 4,946,904 stock options outstanding. On November 30, 2016, CWB’s Board of Directors declared a cash dividend of $0.23 per common share, payable on January 5, 2017 to shareholders of record on December 15, 2016. This quarterly dividend is consistent with the prior quarter and the dividend declared one year ago. The Board of Directors also declared a cash dividend of $0.275 per Series 5 Preferred Share, and a cash dividend of $0.390625 per Series 7 Preferred Share, both payable on January 31, 2017 to shareholders of record on January 20, 2017.
CONTROLS AND PROCEDURESDuring the year ended October 31, 2016, CWB implemented its new core banking system. Implementation of this system impacted CWB’s disclosure controls and internal controls over financial reporting. The evaluation of the changes to the design of the disclosure controls and internal controls over financial reporting concluded there is reasonable assurance that material and required disclosure information is appropriately identified and reported and that financial reporting is reliable and in accordance with IFRS.
CWB’s certifying officers have limited the scope of the design of disclosure controls and procedures and internal controls over financial reporting to exclude the controls, policies and procedures of CWB Maxium, acquired on March 1, 2016. This limitation will be removed in 2017 within the time frame permitted by regulation. CWB Maxium contributed approximately 1% to CWB’s consolidated total revenue for the eight months ended October 31, 2016 and its contribution to consolidated net income primarily comprised the after-tax impact of the $7.9 million acquisition-related fair value change, or $5.8 million. Additionally, at October 31, 2016, CWB Maxium’s contribution to consolidated total assets and liabilities was 2% and less than 1%, respectively.
As of October 31, 2016, an evaluation was carried out on the effectiveness of CWB’s disclosure controls and procedures. Based on that evaluation, the CEO and CFO have certified that the design and operating effectiveness of those disclosure controls and procedures were effective.
Also at October 31, 2016, an evaluation was carried out on the effectiveness of internal controls over financial reporting to provide reasonable assurance regarding the reliability of financial reporting and the preparation of financial statements in accordance with IFRS. Based on that evaluation, the CEO and CFO will certify that the design and operating effectiveness of internal controls over financial reporting were effective.
There were no other changes in CWB’s ongoing internal controls over financial reporting that occurred during the year ended October 31, 2016 that have materially affected, or are reasonably likely to materially affect, CWB’s internal controls over financial reporting. Prior to its release, this MD&A was reviewed by the Audit Committee and, on the Audit Committee’s recommendation, approved by the Board of Directors of CWB.
This Management’s Discussion and Analysis is dated December 1, 2016.