manager of emerging managers overview - surs 10- 5 050213_surs... · manager of emerging managers...
TRANSCRIPT

1
Changing the Face of the Investment Management Industrysm
www.progresinvestment.com
Manager of Emerging Managers OverviewInvestment Excellence and Diversity with the SURS/Progress Relationship
Presented to:The Board of Trustees and Investment StaffState Universities Retirement System of Illinois
Progress Presenters:
Thurman White, Jr.Chief Executive Officer
Mona WilliamsExecutive Vice President
May 2, 2013
Exhibit 10

2Changing the Face of the Investment Management Industrysm
Discussion Overview
Who We Are: A Snapshot View of Progress
History and Our Role in the SURS/Progress Relationship
The Business Case for Investment Excellence and Diversity
SURS’ Emerging Manager Success Stories
Conclusion: How We Define Success
Appendix
Progress SURS Portfolios (as of 3/31/13)
Professional Biographies
.PROPRIETARY AND CONFIDENTIAL: NOT FOR DISTRIBUTION OR REPRINTCopyright © 2013 Progress Investment Management Company, LLCThe information contained in this presentation is confidential and legally privileged information intended only for the use of the individual or entity.
Exhibit 10

3Changing the Face of the Investment Management Industrysm
Who We Are | A Snapshot View of Progress
Independent, 100% employee-owned MWBE-certified Registered Investment Adviser.
$7.5 billion in AUM as of March 31, 2013.
Pioneer and leading manager of emerging managers: 22 years.
What differentiates our firm and benefits SURS:
- Alpha Focus: Fiduciary mindset. Performance matters.
- People: Experienced and committed employee-owners.
- Depth and Breadth of Experience: 22 years - different asset classes, customized client investment models, hired/fired over 125 emerging managers and graduated 35 managers to direct hire assignments.
- Knowledge Advantage: Manager due diligence and selection. Portfolio construction and risk management. Manager assistance to mitigate emerging manager business and investment risks/empower managers.
- Organizational Scale/Capacity/Resources: Intellectual capital, research database, due diligence, systems and analytic tools, client reporting and monitoring oversight to manage multiple mandates. Capacity for growth.
- Culture: Bold vision for “change”, empowerment and inclusion. Value-centric leadership model to set high performance expectations.
- Consultative and Adaptive to a Broad Range of Client Needs: Extension of staff and responsive high touch service. Knowledgeable about various public policy requirements and environments.
- Non-Investment Alpha: Thought leader. Share “best practices” with all stakeholders: clients, managers, consultants and MWBE brokers.
MissionWe craft innovative alpha strategies by discovering, developing, combining and empowering dynamic teams of highly skilled investment professionals to deliver excellence for all stakeholders.
VisionTo be the company most known for “Changing the Face of the Investment Management Industry”
ValuesExcellence
Integrity
Leadership
Diversity
Teamwork
Exhibit 10

4Changing the Face of the Investment Management Industrysm
$0
$1
$2
$3
$4
$5
$6
$7
$8
1990
1991
1992
1993
1994
1995
1996
1997
1998
1999
2000
2001
2002
2003
2004
2005
2006
2007
2008
2009
2010
2011
2012
2013
$ Bi
llions
Asset Growth
Our Clients, Assets and Products | $7.5 Billion
As of March 31, 2013 ($ in Millions)
PublicCalifornia Public Employees’ Retirement SystemCalifornia State Teachers’ Retirement SystemCounty Employees’ and Officers’ Annuity & Benefit Fund of Cook CountyIllinois Municipal Retirement Fund*
Los Angeles City Employees’ Retirement System Maryland State Retirement and Pension SystemMilwaukee County Employees’ Retirement SystemNew York City Employees’ Retirement System*
New York City Board of Education Retirement SystemNew York City Fire Department Pension FundNew York City Police Pension FundNew York City Teachers’ Retirement SystemNew York State Common Retirement FundNew York State Teachers’ Retirement FundPublic School Teachers’ Pension & Retirement Fund, ChicagoState of Connecticut Retirement Plans and Trust Funds*
State Universities Retirement System of Illinois*
Virginia Retirement System
CorporateAON CorporationBank of AmericaCVS Caremark CorporationThe Boeing Company* Ford Motor CompanyGeneral Electric Pension Trust*PPL Corporation
Endowments, Foundations, Taft-Hartley and Faith-BasedBoard of Pensions, Evangelical Lutheran Church in AmericaThe Boulé FoundationLaborers’ District Council Construction Industry Pension FundMassachusetts Bay Transportation Authority Retirement Fund*
W.K. Kellogg Foundation
Notes
* Multiple-Strategy Clients
Exhibit 10

5Changing the Face of the Investment Management Industrysm 5Changing the Face of the Investment Management Industrysm
Relationship History and Our Role as SURS’ Manager of Emerging Managers
The SURS/Progress partnership began in 1995 with an initial allocation of $5 million in a single asset class.
Since that time the relationship has evolved in size and across asset classes and today totals $488 million, invested in U.S. Equities All Cap Core, U.S. Fixed Income, and International Equities.
Historically we have funded 67 highly-qualified, diverse managers to manage assets on behalf of SURS: 18 African American-owned firms, 13 Latino American-owned firms, 6 Asian American-owned firms, 20 woman-owned firms, 9 emerging firms (prior to 96-006) and 1 Native American-owned firm.
Today we fund 19 firms: 6 African American-owned firms; 4 Latino American-owned firms; 3 Asian American-owned firms; 6 woman-owned firms.
We Provide Alpha, Diversity and Diversification:− Portfolios that are constructed to achieve both performance and policy objectives− An efficient and cost effective way to access Emerging Manager talent− An evergreen approach that provides asset opportunities to newer, younger and smaller firms − Graduation or direct hire opportunities to more mature, established and developed firms− Manager assistance and coaching to all firms at critical stages of their development− Best practices and relevant information: Progress-sponsored conferences, forums, symposiums,
roundtables, webinars and colloquiums, accessible to clients and managers
Exhibit 10

6Changing the Face of the Investment Management Industrysm
Providing Diversification Through a Single Point of Contact
SURS Benefits
Enhance risk-adjusted returns
Conduct robust due diligence
Manage tracking error
Reduce monitoring load
Mitigate business risk
Streamline hiring and firing
Provide business assistance and coaching
Identify the best, most talented and promising MFDV firms in the industry today, focusing initially on smaller firms that are often excluded from direct hire consideration; serve as a portfolio complement to SURS’ Manager Diversity Program;
Construct our U.S. Equity, Fixed Income, and International Equity portfolios using prudent processes and high fiduciary standards. Actively manage and monitor these portfolios with the policy objectives and program goals in mind;
Provide hands-on manager assistance to develop graduation-ready candidates that, over time, have demonstrated a capacity to become viable, long-term partners from which SURS can source direct hire candidates;
Create an “evergreen” platform, giving new firms the opportunity to participate in the spaces vacated by graduated firms;
Remain focused on the two measures of a successful program: excess alpha generation and successful graduates; we have built our business by demonstrating these two things are not mutually exclusive.
Exhibit 10

7Changing the Face of the Investment Management IndustrysmCONFIDENTIAL: NOT FOR DISTRIBUTION OR REPRINT
Why Emerging Managers Continue to be a Strong, Diversified Source of Alpha
Characteristics:
Small, entrepreneurial and independent firms promote return, not fee, driven cultures and decisions
Alignment of personal, professional and economic interests
Absence of bureaucracy allows them to move quickly
New product launch advantages –quicker to market
Performance Advantage:
Greater returns for early stage investors: Research indicates that younger funds outperform older funds by up to 250 bps (annualized)
Smaller firms have demonstrated a performance advantage during both bull and bear periods
Limiting opportunity set to large firms can eliminate as much as 40% of top quintile performers
Trading and liquidity advantage: Smaller positions allow emerging managers to trade efficiently and with less market impact
Capacity advantages
Exhibit 10

8Changing the Face of the Investment Management Industrysm
The Evolution of the Emerging Manager Industry
Global firms, global products, global clients
DefinitionMinority, women and emerging firms; <$10B; RIAs in public markets
Dynamic definition will influence industry direction
Exclusively WMBE; <$500M; independent
Small; predominantly traditional public market asset classes
Few; not well known or visible
Few formal programs
Single product firms; dominant shareholder ownership; manual processes
Entrance of mainstream players as service providers and minority stake “partners” further confirms the value proposition
From opportunistic to formalized programs across the country
Multi product firms; expanded asset classes including alternatives; shared ownership models; savvy strategic partners; leverage technology
Robust; in addition to public markets, now includes alternative strategies—PE, RE, HFs and Infrastructure
Will continue to expand as alpha value proposition is recognized across asset classes
Continued influx of market participants offering products demanded by the market
Global acceptance and institutionalization of programs as part of overall investment strategy
1990 2013 Forward
Universe
EM Service Providers
Plan Sponsor Programs
EM Profile
Exhibit 10

9Changing the Face of the Investment Management IndustrysmCONFIDENTIAL: NOT FOR DISTRIBUTION OR REPRINT
The Progress Proprietary Database | Examining the Opportunity Set of Managers
Size and Style Matrix
Manager Researchand Focus List (Strategies)
Total Universe1,937
ResearchList 286
Buy List
128
Funded
List
97
As of March 31, 2013
AUM All Unknown Emerging WomenAfrican
AmericanLatino
American AsianMinority (Other)
Main stream
Veteran/ Disabled
Native American
Women + Minority
0-50 398 127 141 44 50 16 10 1 2 1 650-100 65 6 41 9 1 1 7100-500 392 19 237 74 21 11 26 4500-1,000 188 9 120 21 21 2 12 2 11,000-2,000 263 17 178 16 21 5 7 3 4 4 82,000-5,000 367 32 263 24 21 13 13 15,000 and Above 264 12 94 12 16 10 120Grand Total 1937 222 1074 200 150 48 66 6 137 2 5 27
Asset Class All Unknown Emerging WomenAfrican
AmericanLatino
American AsianMinority (Other)
Main stream
Veteran/ Disabled
Native American
Women + Minority
Fixed Income Core 88 5 44 7 12 7 2 1 7 4Fixed Income Core Plus 23 1 9 1 2 2 2 1 4 1Fixed Income High Yield 47 4 20 8 3 1 3 1 7 1Fixed Income Other 108 9 60 13 13 4 1 7 5Large Cap or All Cap 314 28 206 35 9 6 10 0 16 0 0 7Large Cap Grow th 181 13 95 29 23 4 7 1 6 5Large Cap Value 167 12 106 16 13 4 4 8 1 1 2Mid Cap Core 36 2 20 7 5 1 1 0Mid Cap Grow th 57 3 27 9 11 1 4 2 2Mid Cap Value 47 1 26 2 9 2 4 1 3SMID Cap Core 21 3 10 3 2 2 1SMID Cap Grow th 46 4 34 4 1 2 1 0SMID Cap Value 24 1 15 3 5 0Small Cap Core 82 11 46 14 4 2 2 3 1Small Cap Grow th 122 13 68 13 11 3 8 1 4 3Small Cap Value 112 7 72 6 10 3 4 7 1 2Micro Cap Core 9 1 7 1 0Micro Cap Grow th 11 2 9 0Micro Cap Value 8 2 4 1 1 0Other Equity 174 59 63 4 5 5 36 1 1 0Hedge Fund 52 6 29 3 5 2 2 4 1 6International/Global Equity 166 18 91 20 10 5 8 1 7 7Alternatives 42 17 13 2 1 1 2 5 28Grand Total 1937 222 1074 200 150 48 66 6 137 2 5 27
SpecificationsAUM less than $10 BillionWoman- and minority-ownedAt least 51% independently-ownedRegistered Investment Advisors
Notes:− Emerging: Male Caucasian of non minority descent− Unknown: Not yet qualified but in our system
Exhibit 10

10Changing the Face of the Investment Management IndustrysmCONFIDENTIAL: NOT FOR DISTRIBUTION OR REPRINT
Widespread and Growing Utilization of Emerging Managers
Above is a representative list of known U.S. Pension Plans that have committed assets to emerging manager strategies:
1199 SEIU Employees Benefit and Pension Funds
Alameda County Employees’ Retirement Association
Arkansas Teacher Retirement System
Bank of America Corporation
Boeing Company, The
Boulé Foundation
California Public Employees’ Retirement System
California State Teachers’ Retirement System
Chicago Policemen’s Annuity & Benefit Fund
Chicago Teachers’ Pension Fund
City of Kansas City Employees’ Retirement System
City of Philadelphia Board of Pensions and Retirement
Coca Cola Master Retirement Trust
Contra Costa County Employees’ Retirement Association
Cook County Employees’
Detroit General Retirement System
District of Columbia Retirement Board
Exelon Corporation
GE Asset Management
Illinois Municipal Retirement Fund
Illinois State Board of Investment
Indiana Public Employees’ Retirement Fund
Liberty Mutual Retirement Benefit Plan
Los Angeles City Employees’ Retirement System
Los Angeles County Employees Retirement Association
Maryland State Retirement & Pension System
Massachusetts Bay Transportation Authority Ret. Fund
Michigan Department of Treasury
Minnesota State Board of Investment
Municipal Employees’ Annuity & Benefit Fund of Chicago
New York City Board of Education Retirement System
New York City Employees’ Retirement System
New York City Fire Department Pension Fund
New York City Police Pension Fund
New York State Common Retirement Fund
New York State Teachers’ Retirement System
Ohio Public Employees Retirement System
Oregon Public Employees Retirement Fund
Pennsylvania Public School Employees’ Retirement System
Pennsylvania Treasury Department, The
PG&E Corporation
PPL Services Corporation
Public School Teachers’ Pension & Retirement Fund of Chicago
San Antonio Fire & Police Pension Fund
San Francisco City & County Employees’ Retirement System
San Joaquin County Employees’ Retirement Association
Seattle City Employees’ Retirement System
Shell Oil Company
State of Connecticut Retirement Plans & Trust Funds
State Universities Retirement System of Illinois
Teacher Retirement System of Texas
Teachers’ Retirement System of the City of New York
Teachers’ Retirement System of the State of Illinois
Verizon Communications, Inc.
W.K. Kellogg Foundation
Exhibit 10

11Changing the Face of the Investment Management IndustrysmCONFIDENTIAL: NOT FOR DISTRIBUTION OR REPRINT
11Changing the Face of the Investment Management Industrysm
Plan Sponsor Diversity Scoring Model | Overview
Self-diagnostic tool to achieve plan excellence in the areas of plan diversity and inclusion
Targeted for public pension plans but can be customized for corporations, foundationsand endowments
Highlights best practices holistically
Practice (40%)Increase usage of Emerging, MWBE managers and broker/dealers
Policy (25%)Integration of Emerging Manager Practice as fundamental aspect of plan policy
Performance (15%)Value-add from usage of Emerging, MWBE managers and broker/dealers
Governance/People (15%)Diversity among plan governing body and key staff decision-makers
Other (5%)Outreach, best practice sharing, legislative compliance, etc.
40%
25%
15%
15%
5%
0 5025 30 35 40 455 10 15 20
Percentage WeightingCategoryDiversity Scoring Model
Exhibit 10

12Changing the Face of the Investment Management IndustrysmCONFIDENTIAL: NOT FOR DISTRIBUTION OR REPRINT
12Changing the Face of the Investment Management Industrysm
Plan Sponsor Diversity Scoring Model | Methodology
Poor Below Average Average Above Average Outstanding Sub1 2 3 4 5 Weight
Practice (40%) 2.001 Total AUM allocated to MWBE Managers ($mm) $0-500 $500-1000 $1000-1500 $1500-2000 >$2000 0.13 2 Total AUM allocated to MWBE Managers as % of Plan Assets 0-5% 5-10% 10-15% 15-20% >20% 0.13 3 YOY % Growth in AUM allocated to MWBE Managers 0-5% 5-10% 10-15% 15-20% >20% 0.13 4 Active AUM allocated to MWBE Managers ($mm) $0-500 $500-1000 $1000-1500 $1500-2000 >$2000 0.13 5 Active AUM allocated to MWBE Managers as % of Plan Assets 0-5% 5-10% 10-15% 15-20% >20% 0.13 6 Total # of MWBE Managers (Including MOM Managers) 0-5 5-10 10-15 15-20 >20 0.13 7 Total # of MWBE Managers as % of All Plan External Managers 0-5% 5-10% 10-15% 15-20% >20% 0.13 8 Average AUM per MWBE Manager ($mm) $0-50 $50-100 $100-150 $150-200 >$200 0.13 9 # of Asset Classes managed by MWBE Managers 0-2 2 3 4 >4 0.13
10 Commissions paid to MWBE Broker/Dealers ($mm) $0-1 $1-3 $3-5 $5-10 >$10 0.13 11 Commissions paid to MWBE Broker/Dealers as % of annual commissions paid $0-5 $5-10 $10-15 $15-20 >$20 0.13 12 Fixed Income Market Value Traded using MWBE ($mm) $0-500 $500-1000 $1000-1500 $1500-2000 >$2000 0.13 13 Fixed Income Market Value Traded using MWBE as % of all Fixed Income Traded 0-5% 5-10% 10-15% 15-20% >20% 0.13 14 # of MWBE Direct Hires (Excl. MOM Portfolio Managers) 0-1 1-3 3-5 5-10 >10 0.13 15 # of MWBE Direct Hires as % of External Managers 0-5% 5-10% 10-15% 15-20% >20% 0.13
Policy (25%) 1.2516 Use of MWBE managers as part of Investment Policy No Explicit Policy Stated Policy Written Policy Metric Driven Metric Driven w/ Reporting 0.25 17 Use of Emerging Managers as part of Investment Policy No Explicit Policy Stated Policy Written Policy Metric driven Metric Driven w/ Reporting 0.25 18 Use of MWBE B/D as part of Investment Policy No Explicit Policy Stated Policy Written Policy Metric driven Metric Driven w/ Reporting 0.25 19 Use of MWBE Vendors as part of Plan Policy No Explicit Policy Stated Policy Written Policy Metric driven Metric Driven w/ Reporting 0.25 20 Age of Defined MWBE/Emerging Manager Program (Years) 0-1 1-3 3-5 5-10 >10 0.25
Performance (15%) 0.7521 % MWBE Managers Outperforming Benchmarks <30% 30-40% 40-50% 50-60% >60% 0.19 22 % MWBE Equity Managers Outperforming Benchmarks <30% 30-40% 40-50% 50-60% >60% 0.19 23 % MWBE Fixed Income Managers Outperforming Benchmarks <30% 30-40% 40-50% 50-60% >60% 0.19 24 % MWBE Alternative Asset Managers Outperforming Benchmarks <30% 30-40% 40-50% 50-60% >60% 0.19
Governance/Staff (15%) 0.7525 % Minority Board Composition 0-5% 5-10% 10-15% 15-20% >20% 0.08 26 # Minority Board Composition 0-2 2 3 4 >4 0.08 27 % Female Board Composition 0-5% 5-10% 10-15% 15-20% >20% 0.08 28 # Female Board Composition 0-2 2 3 4 >4 0.08 29 % Minority Executive/Investment Staff 0-5% 5-10% 10-15% 15-20% >20% 0.08 30 # Minority Executive/Investment Staff 0-2 2 3 4 >4 0.08 31 % Female Executive/Investment Staff 0-5% 5-10% 10-15% 15-20% >20% 0.08 32 # Female Executive/Investment Staff 0-2 2 3 4 >4 0.08 33 Minority/Female Recruiting Efforts or Internship Programs No Explicit Policy Stated Policy Written Policy Metric driven Metric Driven w/ Reporting 0.08
Other (5%) 0.2534 State Legislation No Legislation Legislation in Process Signed Legilslation Signed Legislation w/ guidelines Enforced Legislation 0.05 35 Active MWBE trade organization relationships (Toigo, NASP, etc.) 0-2 2 3 4 >4 0.05 36 Targeted Investment Consultant MWBE Objectives No Explicit Policy Stated Policy Written Policy Metric driven Metric Driven w/ Reporting 0.05 37 Targeted Investment Consultant Emerging Manager Objectives No Explicit Policy Stated Policy Written Policy Metric driven Metric Driven w/ Reporting 0.05 38 Annual Direct Outreach Events for MWBE 0-2 2 3 4 >4 0.05
Score: 5.00 Grade:
$ in M illions
Sub Category
(100%) A+
Exhibit 10

13Changing the Face of the Investment Management IndustrysmCONFIDENTIAL: NOT FOR DISTRIBUTION OR REPRINT
13Changing the Face of the Investment Management Industrysm
Our methodology and the current results reveal that diversity as an explicit policy at the legislative level, combined withsweeping plan sponsor level inclusion practices, lead to higher diversity scores
- Plan Sponsor A = 4.11/5.00 (82%)
- Plan Sponsor B = 4.40/5.00 (88%)
- Plan Sponsor C = 3.99/5.00 (80%)
- Plan Sponsor D = 4.07/5.00 (81%)
Plan Sponsor Diversity Scoring Model |Hypothetical Example
Summary of Sub-Categories BENCHMARK Plan A Plan B Plan C Plan DPractice (40%) 2.00 1.71 1.79 1.68 1.65
1 Total AUM allocated to MWBE Managers ($ value; % of total; YOY% Growth; AUM Per Manager, # of Asset Classes) 0.67 0.56 0.59 0.64 0.562 Total MWBE Managers and Direct Hires (absolute number; % of total) 0.53 0.53 0.53 0.43 0.533 Active AUM allocated to MWBE Managers ($ value; % total) 0.27 0.16 0.27 0.16 0.164 Commissions and Fixed Income Market Value Traded using MWBE Broker/Dealers ($ value; % of total) 0.53 0.45 0.40 0.45 0.40
Policy (25%) 1.25 1.25 1.25 1.15 1.255 Use of Emerging Managers, MWBE managers, MWBE B/D, MWBE Vendors as part of Policy 1.25 1.25 1.25 1.15 1.25
Performance (15%) 0.75 0.45 0.45 0.45 0.456 % MWBE Managers Outperforming Benchmarks By Asset Class (Equity, Fixed, Alternatives) 0.75 0.45 0.45 0.45 0.45
Governance/Staff (15%) 0.75 0.57 0.73 0.58 0.577 Minority/Female Board Composition, Executive/Investment Staff, and Recruting Efforts 0.75 0.57 0.73 0.58 0.57
Other (5%) 0.25 0.14 0.18 0.13 0.158 State Legislation 0.05 0.05 0.05 0.05 0.059 Direct Out Reach Programs and Active MWBE trade organization relationships (Toigo, NASP, etc.) 0.10 0.05 0.09 0.04 0.06
10 Targeted Investment Consultant MWBE/Emerging Manager Objectives 0.10 0.04 0.04 0.04 0.04
Total Score: 5.00 4.11 4.40 3.99 4.07
100.0% 82.3% 88.0% 79.9% 81.4%A+ B B+ B- B
Data Sources: Illino is Plan Sponsors 2011 Reports to General Assembly, Annual Financial Reports, and Investment Plans
Grade:
Exhibit 10

14Changing the Face of the Investment Management IndustrysmCONFIDENTIAL: NOT FOR DISTRIBUTION OR REPRINT
14Changing the Face of the Investment Management Industrysm
SURS Emerging Manager Success Stories
Successful Incubations:
• Ativo Capital Management
Robust Pipeline of Potential Graduation-ready Candidates:
• New Century Advisors
• LM Capital
• Garcia Hamilton & Associates
• Ambassador CapitalManagement
New “Funded Manager” Hires on the Horizon:
• Ramirez Capital Management
• Herndon Capital Management
• Holland Capital Management
• Brown Capital Management
• Strategic Global Advisors
Exhibit 10

15Changing the Face of the Investment Management IndustrysmCONFIDENTIAL: NOT FOR DISTRIBUTION OR REPRINT
15Changing the Face of the Investment Management Industrysm
Strategic Ideas and Opportunities | 2013 and Beyond
Progress will continue to work with SURS to develop and implement strategies that create more opportunities for emerging managers and broker/dealers. We will:
Identify new emerging manager ideas and funding opportunities across the equity, international and fixed-income asset classes
Facilitate new manager and new product supply through:
−The development of new vehicles
−Targeted outreach to affinity groups in order to stimulate the “diverse manager” pipeline
−Coaching emerging firms to bring new products to market
Encourage increased use of minority and women-owned brokers by:
−Providing regular information to all SURS managers on MWDV brokerage firms and their capabilities
−Assisting with a SURS best practices study on MWDV firms and their capabilities in order to provide all asset managers with tools that can be used in order to assess and, therefore, increase utilization of MWDV brokerage firms
Work with SURS to convene forums for dialogue and communication between emerging asset managers and broker dealers
Exhibit 10

16Changing the Face of the Investment Management IndustrysmCONFIDENTIAL: NOT FOR DISTRIBUTION OR REPRINT
Conclusion: How We Define Success
PartnerRelative fund out-performanceNon-investment alphaMore diversity among investmentmanagers in multi-asset classesResponsive client serviceGood community partner/vendor relationships
Satisfied clients and managersThought leader and innovator“Lifeline” to young firmsDo well by doing goodDevelop strong community and diversity partnershipsEmployee growth and share in rewards
SURS
ProgressOpportunityRelative portfolio out-performanceShare best practices – business and investmentGraduate into direct hire assignments
Manager
Exhibit 10

Progress/SURS Portfolios
Exhibit 10

18Changing the Face of the Investment Management Industrysm
Asset Allocation – SURS U.S. Equity
Preliminary As of March 31, 2013
Port fol io Marke t
Value ($mm)
% of Por t fol io
Por t fol ioS tatus
AH Lisanti Capital Growth, LLC Woman New York, NY $226 6.10% Small Growth $14
Manager Profi le, A l location, and Status:
Manager Ownership Type Locat ion*F i rm AUM
($mm)% of F i rm
AUM Product
Good
Fortaleza Asset Management, Inc. Latino Am., Woman Chicago, IL $151 15.51% Large Growth $23 8.03% Good
4.71% Monitor
Bowling Investments Woman Cincinnati, OH $401 13.00% Large Core $52 17.82%
6.54% Good
Hahn Capital Management Woman San Francisco, CA $618 8.34% Mid Core $52 17.63%
$35 12.00% Watch
GW Capital, Inc. Asian Am. Bellevue, WA $2,298 0.83% SMID Value $19
Graham & Dodd Fund, LLC Latino Am. New York, NY $155 22.66% Large Value
$45 15.26% GoodHolland Capital Management African Am. Chicago, IL $2,788 1.60% Large Growth
Good
Herndon Capital Management African Am. Atlanta, GA $7,561 0.70% Large Value $53 18.02% Good
Total Fund : $293 100.00%
Note : Includes cash.
*as of 12/31/2012
Exhibit 10

19Changing the Face of the Investment Management Industrysm
Portfolio Performance – SURS U.S. Equity
Preliminary as of March 31, 2013
4.21 0.34
3.86 - - -
3.75 - - -
3.75 - - -
3.96 - - -
3.96 - - -
5.10 - - -
4.49 - - -
4.25 - - -
3.92 - - -
3.92 - - - -
Note: Returns are Preliminary. (*) Annualized for periods 1 year and longer. The Net of Fees returns prior to 2004 were based on the highest fee methodology. From 2004 and thereafter, the net returns are based on actual fees. Returns reflect the reinvestment of dividends and earnings. Index performance includes the reinvestment of dividends and earnings.Past performance is no guarantee of future results.
- 5.38 - - - -Russe l l 3000 Index 11.08 11.37 11.08 14.59 12.98
0.94 0.82 -1.33 -0.50 - -0.2212.48 - 5.16 05/01/2008 0.27 0.82
- - - -
S tate Universi t i e s Re t i rement System of I l l inoi s (NET )
4.19 11.90 12.31 11.90 13.26
0.25
Russe l l 3000 Index 11.08 11.37 11.08 14.59 12.98 - 5.38 -
0.82 1.06 0.82 -0.94 -0.02 - 13.65 12.96 - 5.63 05/01/2008 0.27
- - - - -
S tate Universi t i e s Re t i rement System of I l l i noi s (GROSS)
4.19 11.90 12.43 11.90
- 3.90
Russell Midcap Index 12.96 16.21 12.96 17.29 - - 11.94
0.89 1.62 2.78 1.62 -0.30 - 14.58 16.99 - - 15.84 01/24/2011
- - - - -
Hahn Capi tal Management M/C 5.14 14.58 18.99
- 1.12
Russell 2500 Value 13.35 18.05 13.35 21.17 14.16 - 7.98
1.12 1.19 0.61 1.19 -0.43 1.7314.54 20.74 15.89 - 9.10 05/01/2008
- - - - -
GW Capi tal , Inc. SMID/V 5.61 14.54 18.66
- -0.19
Russell 2000 Growth 13.20 13.71 13.20 14.52 14.74 - 8.09
1.72 2.89 -1.56 2.89 0.12 2.5316.09 14.64 17.27 - 7.90 05/01/2008
- - - - -
AH Li sant i Capi tal Growth, LLC S/G 6.82 16.09 12.15
- 4.53
Russell 1000 Value 12.31 14.03 12.31 18.77 12.74 - 3.92
0.15 -1.17 -2.73 -1.17 -6.42 1.2511.14 12.35 13.99 - 8.45 05/01/2008
- - - - -
Herndon Capi tal Management L/V 4.11 11.14 11.30
- -3.62
Russell 1000 Value 12.31 14.03 12.31 18.77 - - 15.98
-1.41 -1.57 -1.90 -1.57 -5.04 - 10.74 13.73 - - 12.36 05/28/2010
- - - - -
Graham & Dodd Fund, LLC L/V 2.55 10.74 12.13
- 0.13
Russell 1000 Growth 9.54 8.09 9.54 10.09 13.06 - 15.57
-0.34 0.76 1.03 0.76 -0.68 0.5110.30 9.41 13.57 - 15.70 01/14/2010
- - - - -
Hol land Capi tal Management L/G 3.41 10.30 9.12
- -1.17
Russell 1000 Growth 9.54 8.09 9.54 10.09 13.06 - 6.32
-0.16 0.09 0.47 0.09 -0.08 -0.039.63 10.01 13.03 - 5.15 05/01/2008
- - - - -
For taleza Asse t Management, Inc. L/G 3.59 9.63 8.56
- -2.03
Russell 1000 10.96 11.09 10.96 14.41 - - 12.09
01/24/2011 0.35 -0.73 0.34 0.13 -
S inceIncep
Bow l ing Investments L/C 11.30 10.36 11.30 14.54 - - 10.06
3Month
6Month YTD
1Year
3Year
5Year
1Year
3Year
5Year
S inceIncept
Incept .Date
1Month
Cumulative Performance (%): Annualized Returns*: Period Ending March 2013 Annualized Excess Returns*
Manager S ty le1
Month3
Month6
Month YTD
Exhibit 10

20Changing the Face of the Investment Management Industrysm
Asset Allocation – SURS Non U.S. Equity
Preliminary as of March 31, 2013
Manager Profi le, A l location, and Status:
Manager Ownership Type Locat ion*F i rm AUM
($mm)% of F i rm AUM
ProductPort fol io Marke t
Value ($mm)% of
Por t fol ioPort fol ioS tatus
Brown Capital Management, Inc. African Am. Baltimore, MD $4,438 0.49% International Equity $22 14.91% Good
Cheswold Lane Asset Management, LLC Woman West Conshohocken, PA
$160 14.00% International Equity $22 15.34% Good
Herndon Capital Management African Am. Atlanta, GA $7,561 0.35% International Equity $27 18.26% Watch
John Hsu Capital Group, Inc. Asian Am. New York, NY $497 4.09% International Equity $20 13.93% Watch
Sky Investment Counsel Inc. Asian Am., Woman Toronto, Ontario, $1,780 1.10% International Equity $20 13.38% Good
Strategic Global Woman Newport Beach, CA $441 8.01% International Equity $35 24.16% Good
Total Fund : $146 100.00%
Note : Includes cash.
*as o f 12/31/2012
Exhibit 10

21Changing the Face of the Investment Management Industrysm
Portfolio Performance – SURS Non U.S. Equity
Preliminary as of March 31, 2013
4.35
-
-
-
-
-
-
-
-
1Year
3Year
5Year
S inceIncept
Incept .Date
1MonthManager S ty le
1Month
3Month
6Month YTD
Cumulative Performance (%): Annualized Returns*: Period Ending March 2013 Annualized Excess Retu rns*
1.67 - 4.45
MSCI EAFE Index 0.88 5.24 12.19 5.24 11.81 5.49
2.96 05/01/2008 2.54 4.65 4.35 6.78
S inceIncept
Brown Capi tal Management, Inc. INT/EQ 3.42 9.59 16.84 9.59 18.59 7.16 -
3Month
6Month YTD
1Year
3Year
5Year
-2.16 1.32 2.03 -0.46 - 0.175.03 - 6.33 10/20/2009 1.96 1.32
- - -
Cheswold Lane Asse t Management, INT/EQ 2.84 6.56 10.03 6.56 13.84
- -1.49 - - - -
6.85 4.12 - -1.42 05/01/2008 -0.05
- - - -
Herndon Capi tal Management INT/EQ 0.20 2.90 6.16 2.90
5.49 - 6.16 - - -MSCI EAFE Index 0.88 5.24 12.19 5.24 11.81
-
John Hsu Capi tal Group, Inc. INT/EQ -1.14 -0.04 9.59 -0.04 5.63 2.28 -
- - - - - -
-0.29
MSCI EAFE Index 0.25 3.28 9.37 3.28 8.88 4.89 - -1.13
-0.38 -3.21 -0.38 -2.03 -0.77 -
- - - -
Sky Investment Counse l Inc. INT/EQ -1.00 0.66 4.33 0.66
5.49 - -1.49 - - -
-6.18 -3.21 - 1.51
MSCI EAFE Index 0.88 5.24 12.19 5.24 11.81
0.02 05/01/2008 -2.02 -5.28 -2.60 -5.28
-5.98
MSCI EAFE Index 0.88 5.24 12.19 5.24 11.81 - - 16.74
-4.58 -7.86 -4.58 -5.58 - - 6.23 - - 10.76 11/22/2011 -1.88
5.42 4.85 - 3.31
MSCI EAFE Index 0.88 5.24 12.19 5.24 11.81
1.82 05/01/2008 -0.54 0.13 0.09 0.13
-
S trategic Global INT/EQ 0.34 5.37 12.28 5.37 17.23 10.34 -
- - - - - -
-2.28 -0.99 -0.16 0.19 - 2.255.68 - 0.76 05/01/2008 -0.14 -0.99
- - - -
S tate Universi t i e s Re t i rement System of I l l i noi s - Non-US (GROSS)
0.74 4.25 9.91 4.25 11.65
5.49 - -1.49 - - -
S tate Universi t i e s Re t i rement System of I l l i noi s - Non-US (NET )
0.74 4.25 9.78 4.25 11.26
5.49 - -1.49 - - -MSCI EAFE Index 0.88 5.24 12.19 5.24 11.81
12.19 5.24 11.81
-2.41 -0.99 -0.55 -0.26 - 1.805.23 - 0.31 05/01/2008 -0.14 -0.99
- - - -
- - - -
Note: Returns are Preliminary. (*) Annualized for periods 1 year and longer. The Net of Fees returns prior to 2004 were based on the highest fee methodology. From 2004 and thereafter, the net returns are based on actual fees. Returns reflect the reinvestment of dividends and earnings. Index performance includes the reinvestment of dividends and earnings.Past performance is no guarantee of future results.
5.49 - -1.49 - - -MSCI EAFE Index 0.88 5.24
Exhibit 10
22Changing the Face of the Investment Management Industrysm
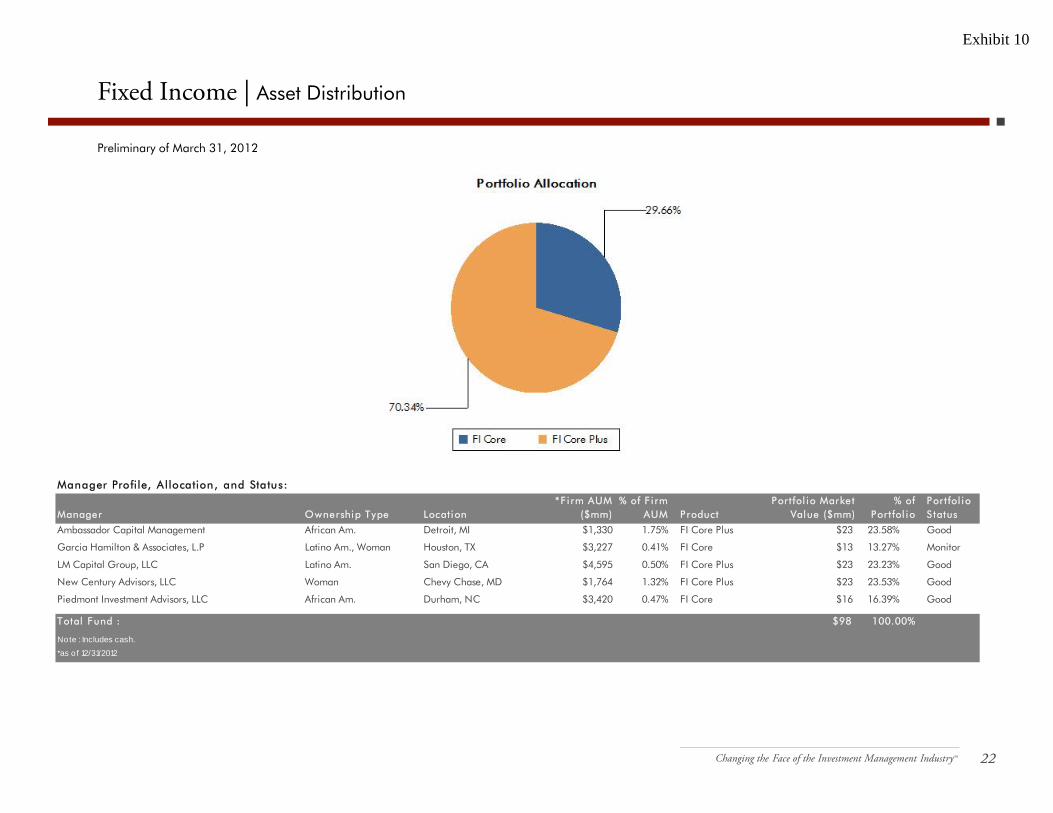
Fixed Income | Asset Distribution
Preliminary of March 31, 2012
*as o f 12/31/2012
16.39% Good
Total Fund : $98 100.00%
Note : Includes cash.
$23 23.53% Good
Piedmont Investment Advisors, LLC African Am. Durham, NC $3,420 0.47% FI Core $16
New Century Advisors, LLC Woman Chevy Chase, MD $1,764 1.32% FI Core Plus
Monitor
LM Capital Group, LLC Latino Am. San Diego, CA $4,595 0.50% FI Core Plus $23 23.23% Good
23.58% Good
Garcia Hamilton & Associates, L.P Latino Am., Woman Houston, TX $3,227 0.41% FI Core $13 13.27%
Por t fol io Marke tValue ($mm)
% of Port fol io
Port fol ioS tatus
Ambassador Capital Management African Am. Detroit, MI $1,330 1.75% FI Core Plus $23
Manager Profi le, A l location, and Status:
Manager Ownership Type Locat ion*F i rm AUM
($mm)% of F i rm
AUM Product
Exhibit 10

23Changing the Face of the Investment Management Industrysm
Portfolio Performance – SURS Fixed Income
Preliminary as of March 31, 2013
FI/C+ 0.15 0.42 6.08 7.14 0.35
0.08 0.10 5.54 5.62 - - -
0.08 0.10 5.54 5.30 - - -
0.08 0.10 5.54 5.62 - - -
0.08 0.10 5.54 5.62 - - -
0.08 0.10 5.54 5.62 - - -
0.08 0.10 5.54 5.62 - - -
0.08 0.10 5.54 5.62 - - -- - - -
Note: Returns are Preliminary. (*) Annualized for periods 1 year and longer. The Net of Fees returns prior to 2004 were based on the highest fee methodology. From 2004 and thereafter, the net returns are based on actual fees. Returns reflect the reinvestment of dividends and earnings. Index performance includes the reinvestment of dividends and earnings.Past performance is no guarantee of future results.
Barclays Capi tal U.S .Aggregate -0.12 -0.12 3.79 - -
0.62 0.53 1.66 0.80 - 0.836.34 - 6.45 05/01/2008 0.11 0.53
- - - -
S tate Universi t i es Re t i rement System of I l l i noi s - F i xed (NET )
0.19 0.41 0.72 0.41 5.45
Barclays Capi tal U.S .Aggregate -0.12 -0.12 3.79 - -
0.74 0.53 2.04 1.26 - 1.326.80 - 6.94 05/01/2008 0.11 0.53
- - - -
S tate Universi t i es Re t i rement System of I l l i noi s - F i xed (GROSS)
0.19 0.41 0.84 0.41 5.83
1.49 1.11 - 0.78
Barclays Capital U.S.Aggregate -0.12 -0.12 3.79 - -
6.40 05/01/2008 0.03 0.46 0.50 0.46
-
P iedmont Investment Advi sors, LLC FI/C 0.11 0.34 0.60 0.34 5.28 6.65 -
1.45
Barclays Capital U.S.Aggregate -0.12 -0.12 3.79 - - - - -
0.62 0.58 0.62 1.58 1.68 - 5.37 7.22 - 7.07 05/01/2008 0.11
- - - -
New Century Advi sors, LLC FI/C+ 0.19 0.50 0.68 0.50
2.16 1.16 - 1.16
Barclays Capital U.S.Aggregate -0.12 -0.12 3.79 - -
6.78 05/01/2008 0.22 0.48 0.93 0.48
-
LM Capi tal Group, LLC FI/C+ 0.30 0.36 1.03 0.36 5.95 6.70 -
2.16
Barclays Capital U.S.Aggregate -0.12 -0.12 3.79 - - - - -
0.82 1.70 0.82 4.44 2.11 - 8.23 7.65 - 7.46 10/20/2009 0.06
- - - -
Garcia Hami l ton & Associates, L.P FI/C 0.14 0.70 1.80 0.70
1.40 0.54 - 1.52
Barclays Capital U.S.Aggregate -0.12 -0.12 3.79 - -
S inceIncept
Ambassador Capi tal Management 0.23 0.23 5.19 - 05/01/2008 0.07 0.32 0.35
3Month
6Month YTD
1Year
3Year
5Year
1Year
3Year
5Year
S inceIncept
Incept .Date
1Month
Cumulative Performance (%): Annualized Returns*: Period Ending March 2013 Annualized Excess Returns*
Manager S ty le1
Month3
Month6
Month YTD
Exhibit 10

Professional Biographies
Exhibit 10

25
Professional Biographies
Thurman V. White, Jr. » President and Chief Executive Officer (1992)Thurman is responsible for the vision and values of Progress, as well as leadership to achieve all the firm’s operational, financial and strategic goals. He chairs the Management Committee and serves asa voting member of the Investment Committee. From 1992 to 1994, Thurman served as chief operating officer of Progress, with day-to-day oversight of the firm’s operations, and he was responsible fordeveloping and maintaining several key client relationships during a time of rapid business growth. From 1994 to 2001, Thurman served as managing director, where he took on a variety of seniorleadership responsibilities, including product development, new business development and client retention. He served as the firm’s product manager, leading its private-equity fund-of-funds strategy forinvestment in emerging private-equity partnerships. In 2000, he led the firm’s effort on behalf of CalPERS to manage a $40 million venture capital fund making direct investment in emerging investmentmanagement firms, and placing assets to manage with those firms from a $1 billion pool. In 2001, Thurman was named president of Progress. In 2004, he guided senior management as it teamed with anoutside investor in a successful management buyback of the firm, at which time he also became CEO. Since the management buyback, Thurman has piloted the firm as it has continued its steady growthin assets under management, expanded the firm’s employee ownership and implemented a values-centric leadership model. Thurman has had previous line management and operating companyexperience with profit/loss responsibility, as well as public policy experience at the state legislative and federal agency levels.
Thurman earned a bachelor of arts in public and international affairs from the Woodrow Wilson School at Princeton University, a master’s degree in communications from Stanford University and alaw degree from Boalt Hall, University of California, Berkeley. He has been a member of the California Bar since 1981.
Alex Hsiao » Chief Investment Officer (2006)Alex leads the investment team, overseeing all investment and fund-related activities at Progress, including quantitative evaluation, monitoring of manager performance, portfolio monitoring andanalysis, manager selection and communication. He chairs the Investment Committee and is a voting member. He is also a member of the Management Committee. Prior to joining Progress, heserved as the treasurer and chief investment officer of The California Endowment in Los Angeles. While there, he managed a portfolio of approximately $4 billion in various traditional equity, fixed-income and alternative investment strategies. Prior to his work with The California Endowment, Mr. Hsiao worked for Bankers Trust in Hong Kong, where he managed a staff of 10 and served as arisk management analyst. Later, as vice president of Fixed Income, he managed a $2 billion proprietary debt portfolio focused on undervalued assets throughout Asia.
Alex earned a bachelor of science in managerial economics from the University of California, Davis and a master of business administration from the University of California, Irvine.
Jose Balagot » Deputy Chief Investment Officer (1996)As a member of the firm's Portfolio Management team, Jose leads the firm's manager research function and is involved in client portfolio construction, monitoring and rebalancing. He is a votingmember of the Investment Committee and a member of the Management Committee. Prior to joining Progress, Jose was an international equity analyst for Bailard, Biehl and Kaiser, where he wasresponsible for database design, returns forecasting, performance measurement, attribution analysis and asset allocation modeling. Previously, he was an economic consultant for DRI/McGraw-Hill,building econometric forecasting models and market planning systems for Fortune 500 companies.
Jose earned both bachelor of arts and master of science degrees in economics at the University of California, Santa Cruz.
Mona S. Williams » Executive Vice President (2000)Mona is responsible for the creation and implementation of new business development strategies, with specific emphasis on plan sponsors in the public, corporate and foundation/endowment areasnationwide. Under her leadership, her team develops all new client relationships and manages the firm’s existing client and consultant relationships. Mona is a member of the Progress Board ofDirectors, serves on the Management Committee and is a voting member of the Investment Committee. Prior to joining Progress, she was director of marketing for Albriond Capital Management,where she was responsible for new business development, client service and client retention. She also served as the director of marketing for Capital Insight Brokerage. Her earlier experienceincludes positions in the institutional equities department of Bear Stearns and in the retail division of Merrill Lynch.
Mona earned a bachelor of arts degree from the University of California, Berkeley. She is a board member of the National Association of Securities Professionals.
Beverly Pasley-Harrison » Chief of Administration and Operations (1999)Beverly oversees the Compliance, Administration and Operations functions of the firm. She is a current member of the Management Committee. Beverly has extensive experience in the financial servicesindustry. She began her career working on the institutional-trading desk at Bateman Eichler, Hill Richards in Southern California, which resulted in a relationship with a major asset management firm innorthern California. She eventually left Los Angeles to pursue what became a 10-year-long tenure in San Francisco with RCM Capital Management as a portfolio and research assistant. Subsequently,she joined Harris Bretall Sullivan & Smith as its director of operations, Gardner Rich & Co. as managing director and Cazenave & Co. as vice president and principal.
Beverly earned a bachelor of science degree in business administration at the California State University, Long Beach. Beverly is a member of the Society and Corporate Compliance and Ethics.
Exhibit 10

26
Caroline L. Tsao » Senior Vice President, Investments (2011)As a member of the firm’s senior investment team, Caroline is involved in investment research, multi-manager fund construction, and other portfolio management and investment-related activities.Caroline is a voting member of the Portfolio Management and Monitoring Team and the Investment Committee. Caroline has over fifteen years of investment management and financial servicesexperience. Prior to joining Progress, Caroline spent six years at Charles Schwab Investment Management, where she was a managing director and portfolio manager for U.S., non-U.S. andbalanced multi-manager mutual funds. In addition to conducting market- and style-cycle research, she was responsible for leading, managing, and proactively evaluating and monitoring theinvestment performance and risk/reward characteristics of the funds. Earlier in her career, Caroline was a fund manager at General Motors Asset Management, where she oversaw U.S. and non-U.S. equity products in a manager-of-managers structure. Caroline began her career as an analyst with GE Capital’s Financial Management Program.
Caroline earned a bachelor of arts degree in history from Duke University and a master of business administration degree from The Wharton School, University of Pennsylvania.
Laura K. Nickols » Vice President, Investments (1993)Laura is responsible for conducting research on funded and prospective managers, preparing research reports and making manager recommendations. Furthermore, she assists in the monitoring,analysis and evaluation of funded accounts. Laura is a voting member of the Investment Committee. Prior to joining Progress, she was a senior analyst at the University of California, Berkeley, in theBenefit Programs department. Previously, she was a consultant/analyst at William M. Mercer Asset Planning, where she was responsible for investment style analysis, asset allocation studies,manager search/analysis, and performance measurement and evaluation. She began her investment career at Callan Associates as an investment analyst.
Laura earned a bachelor of arts degree from the University of California, Santa Cruz, and a master of business administration degree in finance from Golden Gate University.
Justin Eagan, CFA » Vice President, Investments (2012)Justin is responsible for conducting manager research on funded and prospective managers specializing in large and small cap domestic equity strategies. His primary focus is to find promisingemerging manager strategies for the Progress platform and to monitor and manage a portfolio of our funded managers. Prior to joining Progress, Justin was Vice President and Senior InvestmentManager Research Analyst at Morgan Stanley Smith Barney where he performed research and due diligence on mutual funds and separately managed accounts for Morgan Stanley's retail wrapchannel investment programs covering domestic/global/international equity, fixed income and real estate securities strategies. Previously, he was at Deutsche Bank and JP Morgan as a ProductManager and Portfolio Associate. He began his career at Morgan Stanley Dean Witter.
Justin earned a master of business administration in finance from St. John’s University and a bachelor of science degree in accounting from Southern Connecticut State University. Justin is a CFAcharter holder.
Christina Wang, CFA » Assistant Vice President and Associate Portfolio Manager (2009)Christina is responsible for manager sourcing, research and monitoring, performance measurement and evaluation, portfolio analytics, risk analysis, and research tools development. Prior to joiningProgress, she was a Database Manager and Research Analyst at Freeman Associates Investment Management. She was responsible for database construction and monitoring, quantitative modelanalysis and research projects. Before joining Freeman, Christina worked at the Business and Economic Research Center at Middle Tennessee State University. She was responsible for themodeling of local economic leading indicators and other regional economic projects.
Christina earned a master of economics degree from Middle Tennessee State University and a bachelor of arts degree in finance from Southwest University of Finance and Economics. Christina iscurrently pursing a PhD in economics at Middle Tennessee State University and is a CFA charter holder.
Tung Ming » Senior Research Analyst (2001)Tung is responsible for assisting and supporting the Progress Investment team with respect to manager research and portfolio analytics. Prior to serving as an Investment Analyst, Tung was aPortfolio Accountant with Progress where he was responsible for fund accounting, calculating performance and monitoring compliance.
Tung earned a bachelor of arts degree in finance from the University of Maryland at College Park.
Janice M. Osugi, CFA » Senior Research Analyst (2012)Janice is responsible for manager sourcing, research and monitoring, and supporting the analysis and evaluation of funded accounts. Janice has over 13 years of investment management andfinancial services experience. Prior to joining Progress, she was senior investment analyst for the Jewish Community Federation where she performed key roles in investment evaluation andoversight, promoting fiduciary best-practices for $3 billion assets. Before the JCF, she spent eight years at Credit Suisse Private Banking where she was responsible for investment analysis, assetallocation, risk modeling, and performance measurement for her clients.
Janice earned a bachelor of arts degree in economics from the University of California at Berkeley and is a CFA charter holder.
Professional Biographies
Exhibit 10

27
Adrienne E. Gaines » Senior Vice President, Strategic Client Relations and Marketing (2010)Adrienne is responsible for strategic relationship management and business development in the public fund market. Additionally, she works with the Progress team on sales strategy, new productdevelopment, and the establishment of new distribution channels, namely Taft-Hartley. Prior to joining Progress, Adrienne was founder and Managing Member of AMA Advisors, an independently-owned strategic advisory and consulting firm directed toward investment managers. From 2001 to 2007, Adrienne was a partner at the Yucaipa Companies where she held a variety of leadershippositions. Before Yucaipa, Adrienne was a Managing Director at Pacific Corporate Group, a private equity advisory and investment management firm.
Adrienne has over 25 years of experience in investor relations, corporate affairs, marketing and business development. She has been professionally active in the investment community her entirecareer and has developed an extensive global network in the institutional investment industry.
Marcus L. Alexis » Senior Vice President, Marketing & Client Service (2013)Marcus is responsible for strategic relationship management and business development in the endowment, foundation and corporate markets. Additionally, he works with the Progress team on salesstrategy, new product development, and the establishment of new distribution channels. Prior to joining Progress, Marcus was a director of relationship management at Bank of Montreal AssetManagement. Prior to his work at Bank of Montreal, Marcus managed the private equity fund-of-funds client service team at Russell Investments; managed the western region consultant relationseffort for Wellington Management Company and held business development roles at Allianz Global Investors and Bankers Trust Company. Overall, Marcus has 20 years of experience in institutionalbusiness development, client service and consultant relations. In addition to his work with U.S. based investors, he has experience marketing and servicing plan sponsors and consultants domiciledin Canada, the U.K., the Caribbean and Australia.
Marcus earned a bachelor of arts degree from Stanford University and a master of business administration degree from the Kellogg School of Management at Northwestern University.
Jason Miles » Vice President, Strategy (2013)Jason is responsible for enhancing the firms’ overall growth strategy via the marketing and client service group including positioning, product development, research and process improvement. Jasonhas over 14 years of experience executing global growth strategies for both private and public companies. He has significant experience in investment banking and capital market transactionsincluding private placements, mergers, acquisitions, and joint ventures. Prior to joining Progress, Jason was vice president of mergers and acquisitions at Bank of America where he focused oncorporate development transactions involving large financial institutions and service providers. Previously, Jason was a senior associate and founding member of Viant Capital, where he focused ontransaction execution for emerging growth clients and strategic acquirers. Before Viant Capital, he was an associate and founding member of the Private Equity Placements Group at Banc ofAmerica Securities. Jason began his career as an analyst in the Private Capital Markets Group at Robertson Stephens. In the aggregate, Jason has closed over 90 strategic capital transactionstotaling over $7 billion.
Jason earned a bachelor of arts degree in corporate finance from Morehouse College where he was a Roothbert Scholar and a master of business administration degree with concentrations infinance and entrepreneurial management from The Wharton School, University of Pennsylvania.
Linda D. Cornett » Assistant Vice President, Marketing and Client Service (2004)Linda is responsible for all aspects of internal client service. Linda’s team ensures that all client and consultant reports are delivered accurately and on time. She is responsible for completingRequests for Proposals, assisting with the production of marketing materials, client presentations and updating commercial databases. Prior to joining Progress, Linda spent 13 years at State StreetCorporation where she was an assistant vice president, client relationship management. Linda is a founding member and current acting president of the National Association of SecuritiesProfessionals, San Francisco Chapter.
Linda earned a bachelor of science degree in business administration from the University of Phoenix.
Professional Biographies
Exhibit 10

28
Sabrina Brutus, CCEP » Vice President, Operations and Manager Compliance (2011)Sabrina is responsible for ensuring that the company’s middle office operations and manager compliance procedures are rigorously applied in order to prevent violations of client guidelines andfederal securities laws. She works closely with Investments, Marketing and Client Service, Finance and the CCO to mitigate operational risk for both the company and the managers. She is alsoresponsible for monitoring legal and ethical business practices as defined by the SEC and other governing bodies.
Prior to joining Progress, Sabrina served as chief compliance officer at Bivium Capital Partners, where she was responsible for leading the firm’s compliance efforts, including designing andimplementing internal controls, policies and procedures to assure compliance with applicable local, state and federal laws and regulations and third-party guidelines; administering the Code of Ethics;monitoring sub-advisers for compliance with portfolio and client investment guidelines; conducting compliance training; performing initial and continuing due diligence of sub-advisers, including on-site visits; managing audits and investigations into regulatory and compliance issues; and responding to requests for information from regulatory bodies. Sabrina was also responsible for the dailyoperations of the firm.
Sabrina earned a bachelor of arts degree in english with a concentration in business administration from Rutgers, The State University of New Jersey. She is a member of the National Association ofSecurities Professionals, the National Society of Compliance Professionals, the Society of Corporate Compliance and Ethics, and is a Certified Compliance and Ethics Professional.
Rita Cai » Controller (2004)Rita is responsible for all finance and accounting operations at Progress, including financial planning, internal controls and treasury functions. She is also heavily involved with both clients and submanagers regarding fees, contracts and other financial arrangements. Rita is a member of the Management Committee. Prior to joining Progress, Rita was a senior finance manager at Outsource, aventure investment company focused on infrastructure development projects in Asia. Previously, she was director of operations for Global Vision Technology, where she made a major contribution tothe development and growth of a venture capital subsidiary during her nine years with the company. Prior to moving to the U.S., she worked as director of administration for the five-star Holiday InnYangtze Hotel, where she managed a staff of 15 and was responsible for budgeting and cost accounting.
Rita earned a bachelor of science degree in finance from Chongqing University and a master of business administration degree in finance and accounting from Regis University.
Hilda Wong » Assistant Vice President, Fund Administration (2005)Hilda primarily focuses on all aspects of investment operations, including fund account reconciliation, performance calculation and maintenance of fund transition in the accounting system. She alsoacts as a liaison between Progress, sub managers and custodians. Prior to Progress, she spent eight years in managing portfolio accounting and performance evaluation for the high-net-worth-individual accounts of Shuman & Schneider Investment Counsel. She then moved to Kaspick & Company (a subsidiary of TIAA-CREF) to serve as a portfolio-reporting analyst. Responsible for trustaccounting, client appraisal and performance reporting for the planned-giving services of colleges, universities and other non-profits and foundations. She has been in the investment portfolio/fundaccounting business since 1993, beginning her career as an operations analyst with The Boston Company Asset Management, (a subsidiary of Mellon Financial Corporation). Afterwards, she joinedGamboa & Company as a portfolio accountant, providing support of daily trading, monthly reconciliation, appraisal, performance and capital gains reporting of individual accounts.
Hilda earned a bachelor of science degree in business administration and accounting from San Francisco State University.
Richa Sharma » Director of Information Technology (2006)Richa is responsible for all of the information technology-related initiatives at Progress, including projects and operations. Richa provides technical design and architecture guidance, as well asmanagement for information-technology projects.Richa has vast experience in software development; she has led a variety of complex software projects for large, multinational organizations. Hercore strengths include software-requirements design and development; configuration management; project management; and quality management.
Richa earned a bachelor of science degree in mathematics and a master of computer applications degree, both at Himachal Pradesh University in India.
Professional Biographies
Exhibit 10