managing and scheduling inbound material receiving at a
TRANSCRIPT

Managing and Scheduling Inbound
Material Receiving at a Distribution Center
by
David 0. Jackson
B.A. Engineering SciencesDartmouth College, 1997
Submitted to the Sloan School of Management and theDepartment of Civil and Environmental Engineering in partial fulfillment of the
Requirements for the degrees of
Master of Business Administrationand
Master of Science in Civil and Environmental Engineering
In conjunction with the Leaders for Manufacturing Program at theMassachusetts Institute of Technology
June 2005
© Massachusetts Institute of Technology, 2005. All Rights Reserved.
Signature of AuthorSloan School of Management
Department of Civil and Environmental Engineering4 May 6, 2005
Certified byni-iinie Gallien, Thesis Supervisor
J. Spencer Standish Career Development Professor
Certified by_____________________D6vid Simchi-Levi, Thesis Supervisor
Professor of Civil and Environmental Engineering & Engineerinj ystems
Accepted by___David Capodilupo,-Executive 7'irector of Masters Program
Sloan School of Management
Accepted byAndrew Whitle, Chairman,'ipatmental Committee on Graduate Studies
Department of Civil and Environmental EngineeringMASSACHUSETTS INSTnIJTE
OF TECHNOLOGY
SEP 0 1 2005
S1 #-"t r"$ A% r"% 1 r-* ̂ "

-A
This page intentionally left blank.
2

Managing and Scheduling Inbound
Material Receiving in a Distribution Center
by
David 0. Jackson
Submitted to the MIT Department of Civil and Environmental Engineering and tothe Sloan School of Management on May 6, 2005 in Partial Fulfillment of the
Requirements for the Degrees of Master of Science in Civil and EnvironmentalEngineering and Master of Business Administration
Abstract
In any distribution system the processing of inbound material has significant indirectimpact upon the customer experience. The inbound process encompasses all the steps toget a product into the distribution center (DC). It starts with the inventory andprocurement policies and ends with the product being in a physical storage location at theDC. In order for a product to be sold to a customer it must first be brought through thisinbound process (with the exception of drop shipping) and therefore it is important forthis to be completed in a timely and predictable manner.
However, from the perspective of a given distribution center within a network, there issignificant variability of product arriving at the facility. The need to get product intoinventory quickly and predictably must be balanced with the significant challenges ofhandling this variability. The variability can come from a variety of upstream sources:the procurement policies, the vendors/manufacturers, or the inbound transportationproviders. At one facility in the Amazon network the day to day standard deviation ofvariability was approximately 15-30% of units. This variability must be handledefficiently at the facility while balancing all of the other operational goals of thedistribution center.
The goal of this research is to analyze the inbound system at one online distributor -Amazon.com - to measure the inbound variability and to perform an investigation intomethods for handling the inbound variability to the distribution center. This research isapplicable to any distribution company looking to manage outbound service levelsthrough improvements on the inbound system. This thesis will focus on two keypractical methods for handling the variability in the inbound product arrival: 1.management and scheduling of the labor workforce (labor supply) and 2. managing therelease of work into the distribution center (work demand).
Thesis Supervisor: Jeremie GallienTitle: J. Spencer Standish Career Development Professor
Thesis Supervisor: David Simchi-LeviTitle: Professor, Civil and Environmental Engineering
3

Acknowledgements
This project could not have been done without the support and help of many people at
Amazon.com. I want to thank Tim Collins for making the internship possible and for
always making sure that that I was getting all of the support which I needed. Mike
Parsley in Campbellsville, KY provided tremendous guidance and support throughout the
entire project. He spent countless hours with me making sure I understood how things
really worked. Mo Sayegh, Brent Poole, and Arthur Valdez all provided great support
and ideas. Shane Cameron was a great partner in helping to figure out what inbound
improvements could be done. I also want to thank Jeff Wilke for his support of the
Leaders for Manufacturing program.
My MIT advisors have taken great time to help guide me through this process. Professor
Jeremie Gallien has helped me navigate through the challenges of the inbound problem
and has provided me with many of the analytical roots of the ideas presented here.
Professor Cynthia Barnhart helped get me started with her thoughts on inbound logistics
and Professor Simchi-Levi has provided his guidance throughout the process. Thank you
all!
I would also like to thank the Leaders for Manufacturing Program for its support in this
work. Don Rosenfield has so much of this possible through his tireless management of
the program. Countless classmates have helped me by talking with me on the phone,
providing insights and keeping me excited about the work that I was doing.
David Jackson
Cambridge, MA May 2005
4
Table of Contents
1. Introduction..................................................................................................................... 8
1.1. Problem Statem ent .............................................................................................. 8
1.2. Prior Research................................................................................................. 9
1.3. Overview of Research...................................................................................... 9
1.4. Sum m ary of Findings.................................................................................... 10
1.5. Overview of this Thesis ................................................................................. 11
2. Am azon Background and Operations ................................................................... 12
2.1. The Am azon Business.................................................................................... 12
2.2. The Am azon Distribution System .................................................................. 13
2.3. Overview of Larger Inbound process ............................................................ 15
2.4. The Am azon Fulfillm ent Center (FC)........................................................... 18
2.5. Overview of Inbound FC processes............................................................... 18
2.6. The im portance of inbound operations .......................................................... 25
3. M ethodology of Research...................................................................................... 26
3.1. M easuring Custom er im pact from inbound ................................................. 26
3.2. Inbound Cycle Tim e ..................................................................................... 29
3.3. Inbound Variability........................................................................................ 32
3.4. Two Types of Solutions ................................................................................. 32
3.5. The U se of M odels........................................................................................ 33
4. M easuring Inbound V ariability at the FC ............................................................. 34
4.1. Sources of V ariability ................................................................................... 34
4.2. M easuring the Variability of Product Arrivals .............................................. 35
5. Handling V ariability through Flexible Labor ........................................................ 40
5.1. Literature Review ........................................................................................... 40
5.2. Analysis of Flexible Labor at the DC ............................................................ 41
5.3. A Sim ple M odel - A Daily Analysis ................................................................ 42
5.4. A M ore Sophisticated Look .......................................................................... 46
5.5. Flexible Labor Conclusions .......................................................................... 49
6. Inbound W ork Scheduling ...................................................................................... 50
5

6.1. Literature R eview ........................................................................................... 50
6.2. Considerations for Work Release at the FC.................................................. 52
6.3. T ruck Scheduling ........................................................................................... 54
6.4. Inbound Work scheduling conclusions........................................................ 59
7. Application to other Distribution Facilities .......................................................... 61
7.1. Dimensions for consideration ........................................................................ 61
7.2. Considerations for Flexible Labor versus Work Scheduling......................... 62
8 . C o n clu sio n s............................................................................................................... 6 5
9 . R eferen ces ....................................................................................................... ....... 6 7
List of Figures
Figure 1: Inbound and Outbound Supply Chain........................................................... 14
Figure 2: FC Inbound Process Overview...................................................................... 20
Figure 3: Inbound Detailed Process Diagram from Truck Arrival to Ready for Stow..... 22
Figure 4: FC Organizational Structure........................................................................... 24
Figure 5: Inbound tim eline............................................................................................. 29
Figure 6: Inbound Cycle Time for Shipments missing customer ship date................... 31
Figure 7 Example Plot of Time of Day of Work Arrival............................................... 42
Figure 8: Sample Simulation Output of Scenario 1 ..................................................... 44
Figure 9: Generalization of Flexible Workforce vs. Work Scheduling ......................... 64
List of Tables
Table 1: Potential Customer metrics by inventory type................................................ 27
Table 2: Product Arrivals by Day of Week ................................................................... 37
Table 3: Receive Process Path Breakdown.................................................................... 38
Table 4: Coefficient of Variation by Day of Week...................................................... 38
Table 5: Receive Process Path Productivity Variability............................................... 39
6

Table 6: Daily Work Arrival Simulation Scenarios...................................................... 43
Table 7: Cycle time impact of flexible labor (staffing to 100% of expected arrivals) ..... 47
Table 8: Cycle time impact of flexible labor (staffing to 90% of expected arrivals) ....... 47
Table 9: Scenario 1 Distribution of priority of items on trucks.................................... 56
Table 10: Scenario 2 Distribution of priority of items on trucks................................... 57
7

1. Introduction
In any distribution system the processing of inbound material has significant indirect
impact upon the customer experience. The inbound process encompasses all the steps to
get a product physically into a state where it can fulfill customer demand. It starts with
the inventory and procurement policies and ends with the product being physically in the
distribution center. In order for a product to be sold to a customer it must first be brought
through this inbound process (with the exception of drop shipping, which is not discussed
in this paper) and therefore it is important for this to be completed in a timely and
predictable manner.
However, from the perspective of a given distribution center within a network, there is
significant variability of product arriving at the facility. The need to get product into
inventory quickly and predictably must be balanced with the significant challenges of
handling this variability. The variability can come from a variety of upstream sources:
the procurement policies, the vendors/manufacturers, or the inbound transportation
providers. At one facility in the Amazon network the day to day standard deviation of
variability was approximately 15-30% of units. This variability must be handled
efficiently at the facility while meeting all of the other operational goals of the
distribution center.
1.1. Problem Statement
The goal of this research is to analyze the inbound system at one online distributor -
Amazon.com - to measure the inbound variability and to perform an investigation into
methods for handling the inbound variability to the distribution center. This analysis will
be driven primarily from the perspective of a manager at a node within the distribution
network. This research is applicable to any distribution company looking to manage
outbound service levels through improvements on the inbound system. This paper will
focus on two key practical methods for handling the variability in the inbound product
arrival: 1. management and scheduling of the labor workforce (labor supply) and 2.
managing the release of work into the distribution center (work demand).
8

1.2. Prior Research
In distribution space, significant research has been done on networks optimization and
network design. This encompasses location of facilities, inventory management, tier
design, and more. Within warehousing, there has been significant research around
optimizing the facility for picking paths, storage schemes, and stow paths. Bartholdi and
Hackman (2003) provide an excellent overview of warehousing. However, there is little
prior research focusing on inbound operational improvements within a distribution
center.
This paper discusses two operational solutions for improving inbound processing:
providing a flexible labor force and scheduling inbound product into the facility. There
has been much prior research within these two areas, but applied to other operational
environments. Models for determining flexible labor have been discussed in the
literature as well as case studies. There is an extensive body of research for production
scheduling algorithms and appointment processes. A full literature review in these areas
is discussed within their respective chapters within this thesis.
1.3. Overview of Research
This research was conducted while on site for six months at an Amazon.com fulfillment
center (FC). The data collected is based solely upon the observations at this facility,
however the analytical methods are meant to be applicable to distribution centers across
the Amazon network and at other firms.
The research consisted of several steps:
1. Map and understand the flows of the inbound system
2. Understand how inbound impacts outbound customer service metrics such as
customer on-time shipments.
3. Measure the variability at the FC - the key challenge for inbound operations
managers
4. Analyze and model two key potential improvements
9
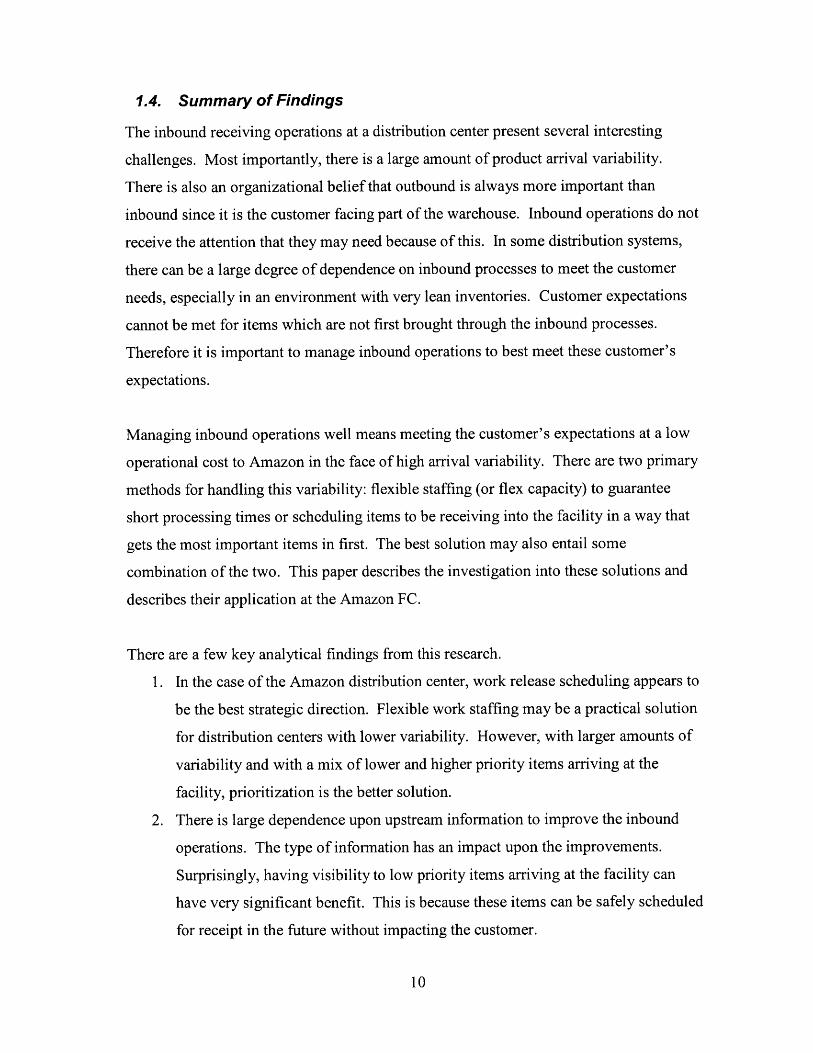
1.4. Summary of Findings
The inbound receiving operations at a distribution center present several interesting
challenges. Most importantly, there is a large amount of product arrival variability.
There is also an organizational belief that outbound is always more important than
inbound since it is the customer facing part of the warehouse. Inbound operations do not
receive the attention that they may need because of this. In some distribution systems,
there can be a large degree of dependence on inbound processes to meet the customer
needs, especially in an environment with very lean inventories. Customer expectations
cannot be met for items which are not first brought through the inbound processes.
Therefore it is important to manage inbound operations to best meet these customer's
expectations.
Managing inbound operations well means meeting the customer's expectations at a low
operational cost to Amazon in the face of high arrival variability. There are two primary
methods for handling this variability: flexible staffing (or flex capacity) to guarantee
short processing times or scheduling items to be receiving into the facility in a way that
gets the most important items in first. The best solution may also entail some
combination of the two. This paper describes the investigation into these solutions and
describes their application at the Amazon FC.
There are a few key analytical findings from this research.
1. In the case of the Amazon distribution center, work release scheduling appears to
be the best strategic direction. Flexible work staffing may be a practical solution
for distribution centers with lower variability. However, with larger amounts of
variability and with a mix of lower and higher priority items arriving at the
facility, prioritization is the better solution.
2. There is large dependence upon upstream information to improve the inbound
operations. The type of information has an impact upon the improvements.
Surprisingly, having visibility to low priority items arriving at the facility can
have very significant benefit. This is because these items can be safely scheduled
for receipt in the future without impacting the customer.
10

1.5. Overview of this Thesis
Chapter 2 of this paper provides an overview of Amazon and its operations. It is
important to understand this context since different distribution networks can function
quite differently. Chapter 3 describes the methodology of this research and how the
inbound system relates to customer metrics. Chapter 4 presents a numerical analysis of
actual variability at the Amazon FC which is a key input for the models in the following
sections.
The next two chapters present the two potential types of solutions. Chapter 5 discusses
models for analyzing a flexible labor force and the benefits of this. Chapter 6 discusses
the challenges of inbound scheduling in this context. This section then shows a linear
optimization model which helps to estimate the potential benefits from scheduling, then
discusses this solution. The broader application of the research findings are discussed in
Chapter 7.
11
2. Amazon Background and Operations
The bulk of this research was conducted while on-site at an Amazon.com fulfillment
center and the analysis focuses on an actual Amazon facility. While the models and
research presented here have general application it is important to first understand the
specific distribution system of Amazon and how the models developed to fit this. Later
in this paper we will discuss the factors that are important to consider when analyzing
other distribution systems.
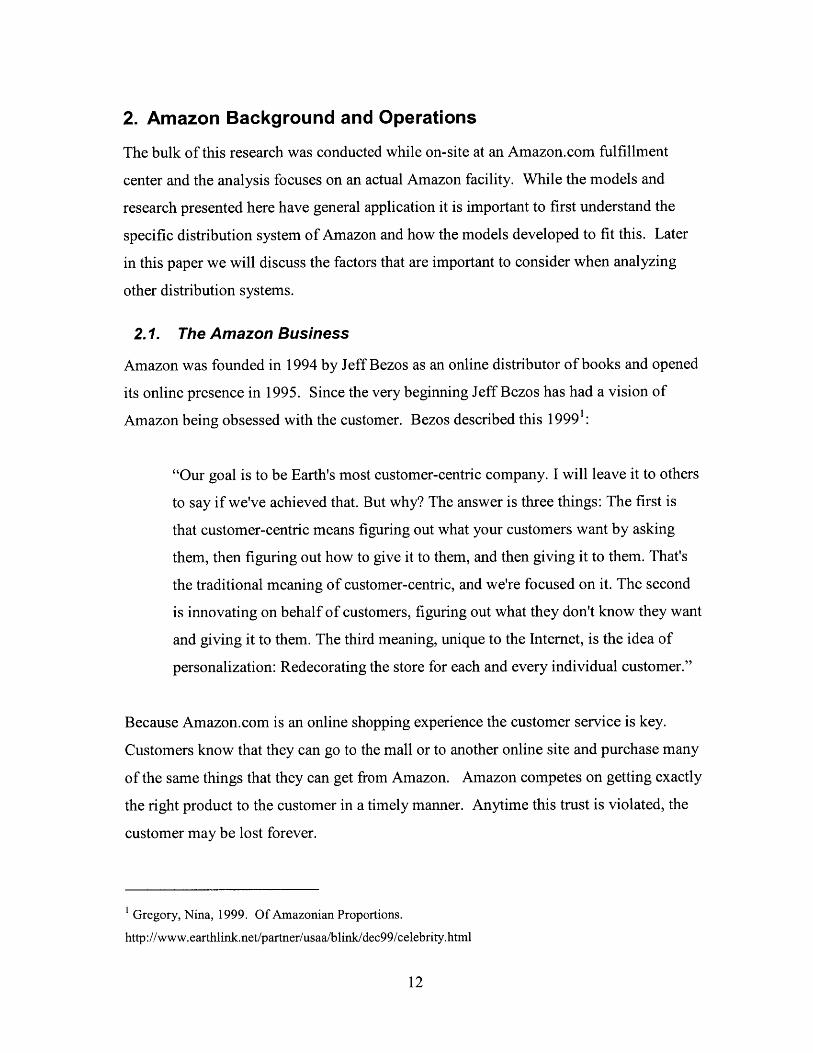
2.1. The Amazon Business
Amazon was founded in 1994 by Jeff Bezos as an online distributor of books and opened
its online presence in 1995. Since the very beginning Jeff Bezos has had a vision of
Amazon being obsessed with the customer. Bezos described this 19991:
"Our goal is to be Earth's most customer-centric company. I will leave it to others
to say if we've achieved that. But why? The answer is three things: The first is
that customer-centric means figuring out what your customers want by asking
them, then figuring out how to give it to them, and then giving it to them. That's
the traditional meaning of customer-centric, and we're focused on it. The second
is innovating on behalf of customers, figuring out what they don't know they want
and giving it to them. The third meaning, unique to the Internet, is the idea of
personalization: Redecorating the store for each and every individual customer."
Because Amazon.com is an online shopping experience the customer service is key.
Customers know that they can go to the mall or to another online site and purchase many
of the same things that they can get from Amazon. Amazon competes on getting exactly
the right product to the customer in a timely manner. Anytime this trust is violated, the
customer may be lost forever.
'Gregory, Nina, 1999. Of Amazonian Proportions.
http://www.earthlink.net/partner/usaa/blink/dec99/celebrity.html
12
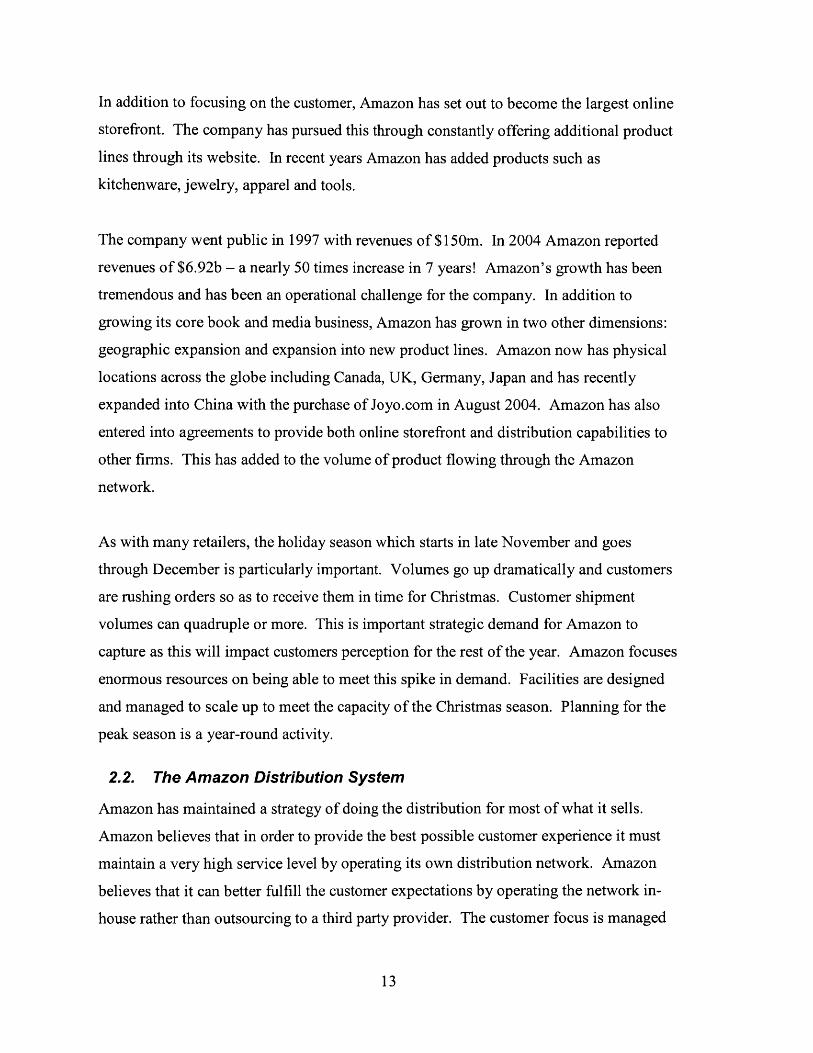
In addition to focusing on the customer, Amazon has set out to become the largest online
storefront. The company has pursued this through constantly offering additional product
lines through its website. In recent years Amazon has added products such as
kitchenware, jewelry, apparel and tools.
The company went public in 1997 with revenues of $150m. In 2004 Amazon reported
revenues of $6.92b - a nearly 50 times increase in 7 years! Amazon's growth has been
tremendous and has been an operational challenge for the company. In addition to
growing its core book and media business, Amazon has grown in two other dimensions:
geographic expansion and expansion into new product lines. Amazon now has physical
locations across the globe including Canada, UK, Germany, Japan and has recently
expanded into China with the purchase of Joyo.com in August 2004. Amazon has also
entered into agreements to provide both online storefront and distribution capabilities to
other firms. This has added to the volume of product flowing through the Amazon
network.
As with many retailers, the holiday season which starts in late November and goes
through December is particularly important. Volumes go up dramatically and customers
are rushing orders so as to receive them in time for Christmas. Customer shipment
volumes can quadruple or more. This is important strategic demand for Amazon to
capture as this will impact customers perception for the rest of the year. Amazon focuses
enormous resources on being able to meet this spike in demand. Facilities are designed
and managed to scale up to meet the capacity of the Christmas season. Planning for the
peak season is a year-round activity.
2.2. The Amazon Distribution System
Amazon has maintained a strategy of doing the distribution for most of what it sells.
Amazon believes that in order to provide the best possible customer experience it must
maintain a very high service level by operating its own distribution network. Amazon
believes that it can better fulfill the customer expectations by operating the network in-
house rather than outsourcing to a third party provider. The customer focus is managed
13

at the individual fulfillment centers through close attention to customer oriented metrics
such as on-time shipments.
Amazon provides the fulfillment services through a network of fulfillment centers around
the globe. Amazon maintains five distribution centers in the US, and several
international locations. These facilities perform the following primary value-add
functions:
* Respond quickly to customer orders
* Group items together for multi-item customer orders
* Value added services (e.g. gift wrapping)
Many decisions across the distribution system are centrally managed at Seattle
headquarters. These decisions include inventory placement, inventory policies, vendor
orders and customer order management. However, each distribution center is
responsible for efficiently managing receiving inbound product and shipping outbound
product for customer orders. Below is a simple diagram of the distribution system from
the perspective of the FC.
Figure 1: Inbound and Outbound Supply Chain
Inbound Outbound
Inbound Trans. Outbound Trans.
Provider Provider
Goods DeliveryD e
Vendor Amazon.com Customer
Vendor Customer
Orders Orders
14
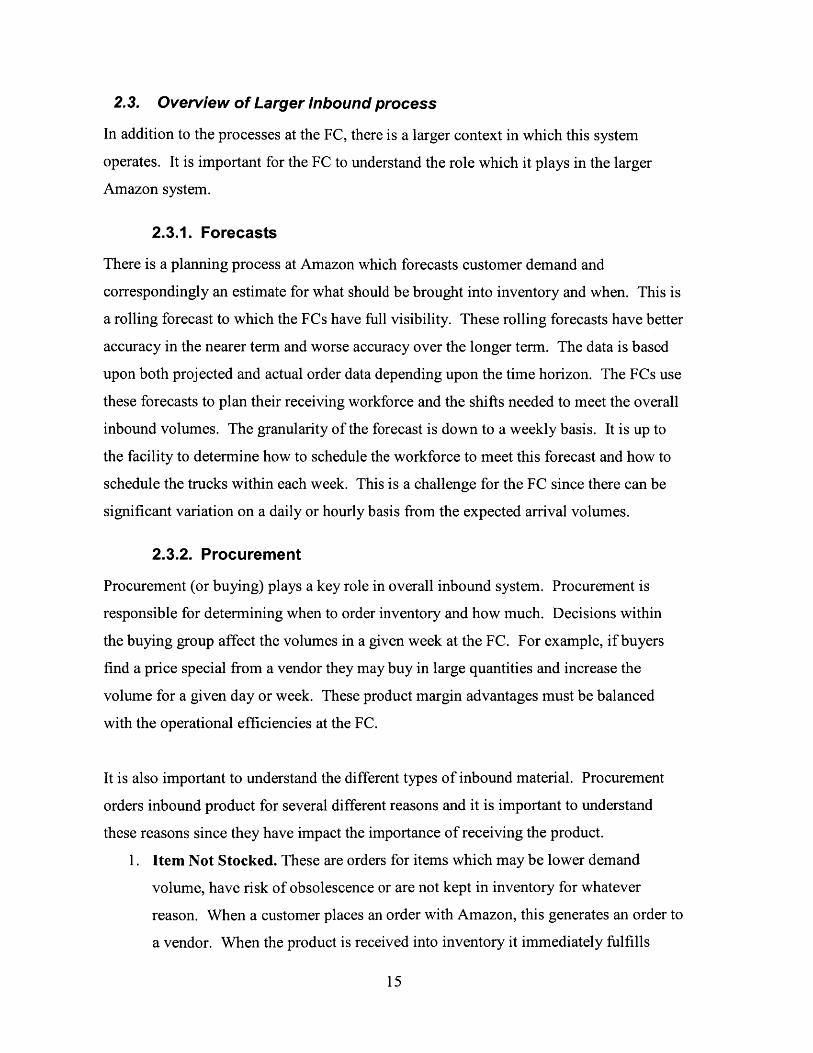
2.3. Overview of Larger Inbound process
In addition to the processes at the FC, there is a larger context in which this system
operates. It is important for the FC to understand the role which it plays in the larger
Amazon system.
2.3.1. Forecasts
There is a planning process at Amazon which forecasts customer demand and
correspondingly an estimate for what should be brought into inventory and when. This is
a rolling forecast to which the FCs have full visibility. These rolling forecasts have better
accuracy in the nearer term and worse accuracy over the longer term. The data is based
upon both projected and actual order data depending upon the time horizon. The FCs use
these forecasts to plan their receiving workforce and the shifts needed to meet the overall
inbound volumes. The granularity of the forecast is down to a weekly basis. It is up to
the facility to determine how to schedule the workforce to meet this forecast and how to
schedule the trucks within each week. This is a challenge for the FC since there can be
significant variation on a daily or hourly basis from the expected arrival volumes.
2.3.2. Procurement
Procurement (or buying) plays a key role in overall inbound system. Procurement is
responsible for determining when to order inventory and how much. Decisions within
the buying group affect the volumes in a given week at the FC. For example, if buyers
find a price special from a vendor they may buy in large quantities and increase the
volume for a given day or week. These product margin advantages must be balanced
with the operational efficiencies at the FC.
It is also important to understand the different types of inbound material. Procurement
orders inbound product for several different reasons and it is important to understand
these reasons since they have impact the importance of receiving the product.
1. Item Not Stocked. These are orders for items which may be lower demand
volume, have risk of obsolescence or are not kept in inventory for whatever
reason. When a customer places an order with Amazon, this generates an order to
a vendor. When the product is received into inventory it immediately fulfills
15

outstanding customer demand. Receiving this type of product directly impacts the
customer and therefore is very important. Amazon has implemented "cross-dock"
like functionality for these items and the receiving process is largely the same.
2. Item out of Stock. This is an item that is normally stocked but is currently out of
stock across the network. Receiving the product will immediately increase
availability on the website - customers will then be able to place orders for that
product. In some cases these may be "hot" products for which demand was much
higher than forecasted. Receiving quickly may or may not have a significant
impact upon availability and meeting demand.
3. Stocking a Product for the first time. These are either new products or ones
that were not previously stocked but due to increased demand are brought into
inventory. Receiving new products into inventory may or may not impact product
availability as this may be determined by a product offering or release date. For
example, new DVD releases have a release date, before which Amazon may not
sell it.
4. Normal Stock-up. These are generally longer lead time orders placed for
inventory that will increase current stock levels (cycle stock). At no point during
the vendor fulfillment cycle is the inventory unavailable in inventory. Receiving
this into inventory has no impact upon product availability or filling current
customer demand.
2.3.3. Inbound Visibility
In addition to a forecast, the FCs gets some visibility to the projected inbound volumes
based upon data provided by vendors and inbound transportation providers (carriers).
Some vendors provide data to Amazon at the time that a shipment is shipped from the
vendor - and Advanced Shipment Notice (ASN). These vendors may provide varying
amounts of data ranging from very detailed lists of product items and quantities to a less
detailed list of POs or total weight of the shipment. This is also the data which provides
carton level detail used in the LP receive process. Because Amazon receives shipments
from so thousands of vendors, there is a wide range of data quality across these vendors.
16

Additionally some carriers provide shipment data about what deliveries they will have for
a given Amazon FC and when it is likely to be ready for delivery. Ideally this data is
cross matched with the data transmitted from the vendor to get a complete picture of each
shipment. When data cannot be cross-referenced then Amazon knows only the carrier
data about the shipment (if anything at all). Different carriers have different data
capabilities, but generally this does not include detail about the product. Carriers will
commonly have the Bill of Lading information electronically which includes the shipper,
weight, destination and pickup and delivery times. With this mixture of data quality it is
very difficult for the FC to know the details of what is arriving for a given day.
2.3.4. Future Visibility Improvements
In the future there are likely to be improvements in inbound visibility at the FC. Amazon
is working hard with its vendors and carriers to provide better visibility to arrivals.
Because Amazon works with so many vendors across so many product lines this is a
difficult and long-term process. For example, toy manufacturers do not use the same EDI
standards as book distributors and this makes the process time consuming for the IT
organization. Amazon continues to work with its largest volume suppliers to improve the
inbound data, but additional visibility will not solve all the challenges of inbound. Better
visibility increases the lead-time which Amazon can react to arrival variability, but does
not solve the problem of how to best meet the customer service metrics.
There is also much talk in industry about RFID in the supply chain and the coordination
that this technology will enable. With Wal-mart pushing the adoption of standards, many
consumer product vendors are already being pushed towards adoption. In the near-term
this likely means putting tags on cases and palettes. This must be coupled with better
data exchange about the contents of these cases and palettes, which is largely the same
effort as what is already being done at Amazon to get better inbound visibility.
There are several barriers to adoption of RFID. Tag cost estimates today are between
$0.10 and $0.30 and could fall to $0.05 by 20072. The cost of the RFID reader
2 Based upon talks at MIT by given by David Brock, Sanjay Sarma of the MIT Auto-ID center.
17

infrastructure is significant, though this depends upon the type of deployment. These
capital expenditures will only be warranted if there is significant cost reduction. With
thin margins in distribution, it is unlikely low value items will be tagged in the near term.
It may not make sense to tag a $10 paperback book if a good portion of the margin
simply goes to the tag. In order for adoption to occur the tag costs must be shared and
multiple parties in the supply chain must benefit from the additional information
available. Even if everything arriving the FC were tagged, operations managers would
still have to determine how to optimally process everything. Labor requirements could
be reduced for inbound receiving at the FC, but not eliminated completely. Processes
such as sorting/preparation, checking for damage, and stowing will not go away.
Managers must still determine how best to schedule and manage inbound operations.
2.4. The Amazon Fulfillment Center (FC)
The FC can be logically divided into two parts: inbound and outbound. The inbound side
of the FC is responsible for getting items off of a truck and into a bin location within the
warehouse. The outbound side is responsible for picking items from inventory for
customer orders and putting them on the truck for shipment.
The focus of this research is on the inbound side of the fulfillment center. The primary
goal is to analyze ways to better manage inbound operations to better meet customer
service levels. This requires a good understanding of what is happening on the inbound
system. In this paper we will largely ignore the outbound side of the FC and assume that
if the inbound processes are able to get the item into the bin "on time", then the service of
the inbound system is complete.
2.5. Overview of Inbound FC processes
The Amazon FC receives a combination of deliveries from full truck carriers (TL), less
than truckload carriers (LTL) and package carriers (parcel). The different types of
carriers have different internal processes which affect how and when the product arrives
at the FC. Additionally, Amazon pays for the freight in some cases while the vendor
pays the freight in other cases. This mixture means that Amazon has varying amounts of
control over the carriers who are delivering.
18

It is worth understanding the differences between the types of trucks arriving at the FC.
Full trucks are loaded at the origin (vendor site) and are driven directly to the Amazon FC
to be unloaded. The contents of the trailer are not touched en-route and the arrival time at
the FC largely depends upon the departure time from the origin. There is some flexibility
in arrival schedule, but this is largely limited to delaying a full truck delivery by a few
hours. In some cases, full trucks are containers which are coming longer distances - via
ocean or rail - and the truck delivery is only the final leg of the shipment. In this case,
Amazon likely has more control over the delivery since it is sitting in a storage location at
the ocean or rail carrier yard.
LTL trucks arriving at the FC carry a mix of shipments from multiple vendors. LTL
carriers will pickup a partial truck load at the vendor location, then haul it to the nearest
"hub" or carrier sort location. Shipments are commonly one or more pallets. These
pallets are routed through the carrier network and combined with other shipments through
the LTL carrier network at the nearest hub to the FC. The transit time has variability
associated to how quickly the item moves through the carrier network. High volume
LTL carriers have regularly scheduled deliveries and are commonly scheduled around the
sort times at the hub. The process for parcel carriers is very similar, except that the unit
being shipped for a parcel carrier is a single box.
The FC control over the shipment begins with the appointment process and ends when
the item has been stowed in a bin. Below is a diagram of the elements of the inbound
processes at the FC.
19

Figure 2: FC Inbound Process Overview
Trailers waiting
Carrier for unload
shipments for 1. Appointmentdelivery Prc/s___\7
2. Unload 3. Receive 4. Stow
Ready forNot Yet Stow
Received
(NYR) \
In the Bin -ready for
customer orders
The FC Inbound process is composed of four sequential tasks:
1. Appointment Process. A carrier contacts the FC with a shipment that they have
ready for delivery. The FC looks at the overall schedule for arrivals and
schedules the truck for the earliest available slot. Most appointments are granted
on a first-call, first-serve basis and are for a 2 hour window. In a few cases there
may be specific instructions that the load is high priority and it will be scheduled
as soon as possible. Additionally, some carriers have a standing appointment and
will deliver whatever freight they have available for that day (or few days,
depending upon how often the standing appointment is for).
2. Truck Unload. There are two unload types: Live and Drop. Live unloads must
be done while the truck driver is waiting and usually there is a penalty for not
unloading the truck within a certain time period - usually 2 hours. Drop loads are
trailers which are left by the trucking company. The FC has flexibility as to when
they will unload these trailers, though there is usually a one day limit to this. In
20

most cases a trucking company will come daily to drop a full trailer and pick up
an empty one.
3. Receive Process. This process identifies the individual product that is delivered.
This includes reconciling with what has been ordered from the vendor and
checking for damages or other problems. In some cases the receive process
includes re-packaging the product, sorting or other operations which prep the
product for re-sale to the customer. There are several different types of receive
processes geared towards different types and volumes of product arriving on a
given shipment. For example a pallet of a single type of product can be received
in bulk versus cases that arrive with many different types of books in it.
4. Stow Process. Stowing is the physical movement of the product to the correct
storage bin for the product. There are many different storage types and this
effects the details of the stow process. For example, individual books are stowed
in random locations at the discretion of the stower (the book is put wherever there
is space and this is entered into the warehouse management system). Pallets are
stowed in locations directed by the warehouse system and therefore have to be
routed correctly through the warehouse.
This overall process is similar to many other distribution centers, though there is some
difference in the details and how the processes are managed.
2.5.1. More about Truck Appointment Scheduling
All truck scheduling is handled directly by the FC. Headquarters plays a role in setting
up the carrier relationships, however, each FC is responsible for all day to day
scheduling. A portion of carriers have a standing appointment with the FC. The carrier
delivers daily (or every few days) and does not have to call ahead to the FC. These
carriers typically have higher volumes of product and are electronically integrated to
provide shipment data a day or so ahead of time. In some cases carriers drop truck
trailers at the FC and pickup an empty. The FC has the flexibility to unload the trailer as
needed and does not have to coordinate with the carrier. Typically the only limitation is
that the truck must be unloaded before the carrier returns with the next trailer.
21

For carriers which do not have a standing appointment, there is a manual phone or fax
process. The carrier will fax a copy of the Bill of Lading along with any other shipment
information and the receive clerk at the FC will call back with an appointment time.
Typically the clerk has an estimate of the volume by product line (i.e., books or kitchen)
for the shipment. Based upon the schedule for other shipments that day and the inbound
capacity, the clerk will decide what day and slot to give to the carrier. There are many
other factors for this decision, however, much of this is wrapped up in the "tacit"
knowledge of the receive clerk and others who work in the receive operations.
2.5.2. More about the Receive Process
Below is a diagram which illustrates the details from truck appointment to ready to stow.
This does not include the stow process.
Figure 3: Inbound Detailed Process Diagram from Truck Arrival to Ready for Stow
Plett Palettes for Redrop
Dropped Pallets NYR
trailer Dropped
Shipments
Truck
Arrive
Case NYR
Live Determine
unloadunload Rec Case Prob SolvePrb m
LP NYR
Rambo Ready for Stow
Ramb NYR
Proces Rambo
Assortment NYR Problem
Rambo ProbSolve Queue
Some of the complexity in the above system is due to the variety of type product which
Amazon receives. Because Amazon sells products which vary so widely in size,
packaging, and order quantities, the FCs have created specialized processes which handle
22

these more efficiently. It is also important to note that different facilities in the Amazon
network have variations in the receive processes. Below is a brief description of the
different individual processes.
1. Assortments/Preparation. In some cases Amazon must repackage or pre-
process items before it can be re-sold to the customer. For example, many toys
are sold as "various" colors by the manufacturer, whereas Amazon sells the toy on
the website by specific color. Upon delivery from the manufacturer, Amazon
must sort the toy by colors and repackage them for sale. Other examples include
repackaging fragile items, breaking down bulk packaging or re-wrapping items
for safety (i.e. sharp tools).
2. Palette Receive. If a palette arrives with all the same product on it, it can be
palette received in bulk. A receiver may check one or more of the cases, but will
not open every box to check the contents. This is one of the most efficient receive
process since it takes a small amount of time to receive large quantities of
product.
3. Case Receive. Products that arrive in small quantities or with a few items to a
case are processed through case received. Each case is checked individually as a
part of the process.
4. License Plate (LP) Receive. This process takes advantage of EDI (electronic
data interchange) data sent by the shipper ahead of time. Each container in the
shipment has a bar-code attached which identifies the contents. Amazon does not
have to check each individual item and this reduces receiving labor. Amazon uses
LP receive with its largest vendors and is continuing to expand this program since
it saves receiving costs.
5. Rambo/Each Receive. This process is for books and media which arrives mixed
in a box. A box may have a mix of 20 books, each of which must be checked and
scanned.
2.5.3. Organization Structure
It is helpful to understand the organization structure within the FC in order to understand
the incentives around inbound receiving. Within the FC there is an organization structure
23

reporting up to the GM. The specifics of this vary between different facilities, however,
the basic structure is the same.
Figure 4: FC Organizational Structure
Facility GM
R e v p s MS r .In b u n O s Mr S O u tb un d O p s M g r S r. C h an g e M g r
Receive Ops Mgr RSR (Stow) Ops Mg
Area Manager - Shift A Area Manager - Shift A
Area Manager - Shift B Area Manager - Shift B
The Sr. Inbound Operations Manager is responsible for overseeing all inbound processes
and resources. Operations Managers oversee a set of processes across all shifts. Area
Managers (AM) are the floor managers who are responsible for all resources on a given
shift.
In addition to the FC organization structure, there is a team located at headquarters which
is responsible for processes in common across all facilities. These teams (called 2 Pizza
Teams) are responsible for designing and building software systems for the processes,
process engineering and support for the managers at each of the facilities. There is a
corporate team responsible for inbound receiving operations.
2.5.4. Inbound Metrics and Daily Plan
Based upon a combination of forecasts, inbound visibility and scheduled trucks, the Ops
Managers and Sr. Ops Managers create a daily work plan. The plan sets throughput goals
for the day based upon the labor capacity, current queue sizes and other inputs.
Additionally, based upon historical performance, productivity goals are set for each
24
process. Area managers are held accountable for meeting the goals of this plan of the
processes which they manage. The key process metrics are: Safety, Quality, Costs
(productivity) and Throughput.
Safety is measured as incidents, either lost-time or not. Anytime a worker complains of
an injury or other safety incident this is reported and tracked. There are several quality
metrics, though most are a derivative of inventory quality. For example, receivers are
measured for the number of incorrect items that they report into the warehouse
management system. If they count the wrong quantity, miss an item, etc. this is tracked
back to the receiver and to the area manager. Audits are performed by an independent
quality organization and metrics are tracked for each department within the warehouse.
Cost are primarily tracked through productivity of each worker, process area and shift.
Amazon has a custom developed system which tracks the hours each person is working
and provides summary statistics to managers. Operators are able to see productivity
numbers down to the hour and these are closely watched by senior managers.
Inbound managers are also currently responsible for keeping within backlog targets. For
receive, the key backlog measures are the Not yet Received (NYR) queue and the stow
queue. These are monitored carefully throughout the day and if the queues are getting
larger or smaller than an expected band, the facility may call overtime, shift resources
within the facility or ask for volunteers who would like to go home early.
2.6. The importance of inbound operations
Inbound operations are important to Amazon for two primary reasons:
1. Customer impact
2. Costs to Amazon
The FC faces a classic trade-off between customer service and operational cost. The only
reason to bring inventory inbound is to fulfill customer demand (outbound). To bring
down cycle times and process inbound product means improving the customer experience
indirectly. However, the FC faces the challenge of large arrival variability and high costs
25

to guarantee a short cycle time. The challenge for Amazon and other distribution
networks is to balance the service of the inbound system with the costs. Receiving is a
highly labor intensive process and therefore must be carefully planned.
3. Methodology of Research
This research was conducted while on-site at an Amazon fulfillment center. The primary
goal is to understand how best to process inbound product at the FC while balancing
operation costs and service to the customer. Based upon the nature of this problem, there
emerged two primary methods for improving this trade-off. These are 1) a flexible
workforce to guarantee a short inbound cycle time and 2) scheduling of inbound items to
best meet the customer requirements. This research focuses on these two primary
alternate methods for improving inbound operations and understanding the customer
service impact from these methods. The end-goal is not to present a detailed operational
improvement, but to recommend a longer term, strategic direction which the FCs should
pursue to achieve the best customer service for a given cost. These solutions must
consider future changes in technology and better information availability (like RFID).
This section first discusses metrics for understanding customer impact of inbound and a
discussion of the reasons that the two primary solution spaces were chosen for
investigation.
3.1. Measuring Customer impact from inbound
Measuring impact of inbound processing on the customer experience turns out to be
challenging at Amazon. This is mostly because the inbound and outbound order cycles
are kept completely separate in two different IT systems. Customer orders are not
directly associated to inventory until the inventory is in the facility. Customer service
metrics such as "order shipped on-time" percentages are calculated against outbound
orders only. Attributing a missed ship date to inbound processing problems is
challenging.
In spite of this, there are some potential metrics that could be used to measure
performance. The relevant customer oriented metric also depends upon which type of
26
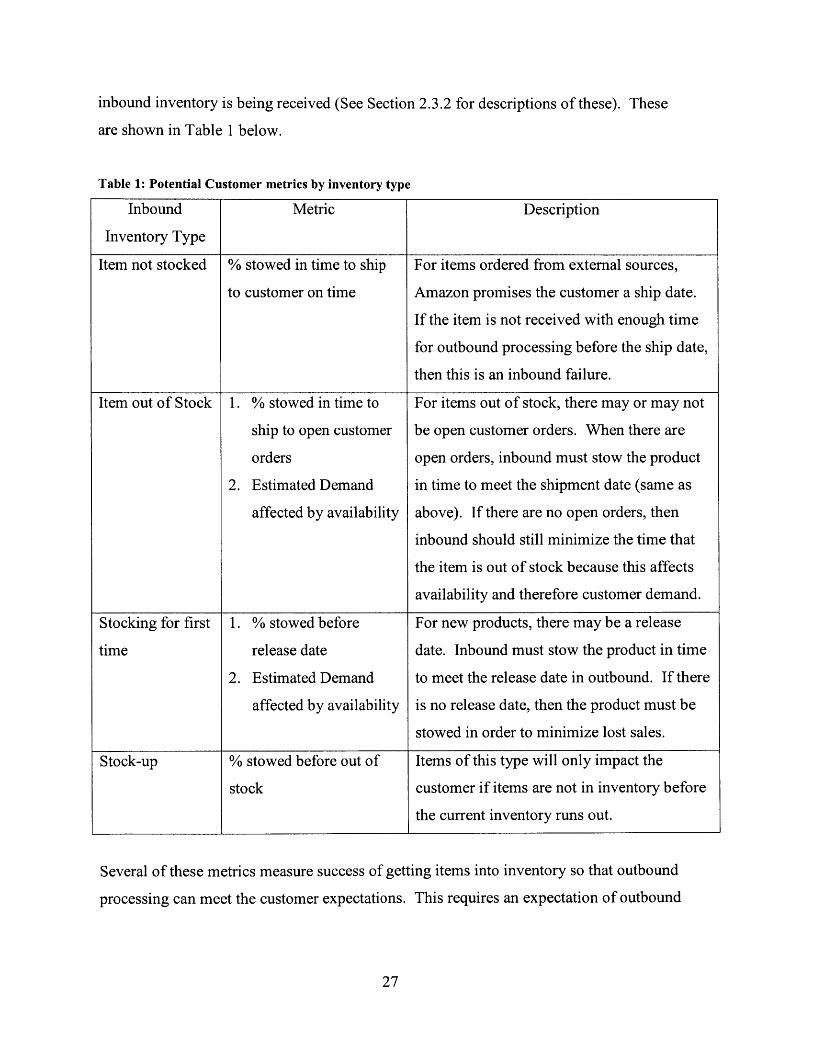
inbound inventory is being received (See Section 2.3.2 for descriptions of these). These
are shown in Table 1 below.
Table 1: Potential Customer metrics by inventory type
Inbound Metric Description
Inventory Type
Item not stocked % stowed in time to ship For items ordered from external sources,
to customer on time Amazon promises the customer a ship date.
If the item is not received with enough time
for outbound processing before the ship date,
then this is an inbound failure.
Item out of Stock 1. % stowed in time to For items out of stock, there may or may not
ship to open customer be open customer orders. When there are
orders open orders, inbound must stow the product
2. Estimated Demand in time to meet the shipment date (same as
affected by availability above). If there are no open orders, then
inbound should still minimize the time that
the item is out of stock because this affects
availability and therefore customer demand.
Stocking for first 1. % stowed before For new products, there may be a release
time release date date. Inbound must stow the product in time
2. Estimated Demand to meet the release date in outbound. If there
affected by availability is no release date, then the product must be
stowed in order to minimize lost sales.
Stock-up % stowed before out of Items of this type will only impact the
stock customer if items are not in inventory before
the current inventory runs out.
Several of these metrics measure success of getting items into inventory so that outbound
processing can meet the customer expectations. This requires an expectation of outbound
27

cycle time. Items must be stowed with enough time for the outbound processes to be able
to ship the item on time.
From the above metrics we measure anything that fails "due to inbound". This includes
everything upstream from stow and does not indicate whether the FC itself was
responsible for the customer impact. For example if an "item not stocked" arrives at the
FC after the expected ship date to the customer, then there is nothing that the FC can do
to meet the customer expectations. Inbound processing can try to minimize how late the
item is, but cannot prevent it from being late.
In order to use these metrics for FC processes, there must be an expectation of cycle-time
for the inbound FC processing. For example, an item arrives at the FC two days in
advance of when it needs to be stowed, but it takes three days to be processed. Is this an
FC failure? This depends upon whether we expect the FC processes to take less than
three days for this item.
There are two types of inventory shown in Table 1 when a product needs to be received
in order to update the availability on the web-site and this also presents difficulty for
measuring this impact. This is similar to a shelf stock-out in a retail store. For an online
retailer, the product availability is determined by what the user sees on the web-site about
the availability for the product. For example, the item may be listed as "out of stock"
until the item is received at the FC. The customer impact of inbound includes the lost
sales from customers who would like to order this item, but find it is out of stock (in
reality it is more complicated than this for Amazon since availability may change from
"2-4 weeks" to "24 hours" upon receipt and this may impact whether or not the customer
orders).
Another challenge for these metrics is that the volume of data is tremendous and not
readily available in the above formats. For the sake of this research it is necessary to try
to find a simpler way of estimating customer impact. While Amazon may want to look
28

into these types of detailed operational metrics in the future, for this investigation we will
try to simplify.
3.2. Inbound Cycle Time
Inbound cycle time looks like a good proxy for the customer impact of FC inbound
processing. The larger inbound cycle is shown below:
Figure 5: Inbound timeline
Inbound timeline
Vendor CycleTime (CT) Inbound Trans CT Inbound FC CT Outbound FC CT
Amazon Placesorder with Vendor Vendor Ships Shipment Available FC Stows item, FC ships to
for delivery to available for customerAmazon FC outbound
From this diagram we can deduce that the customer impact of inbound is related to the
cycle time of each process. If the inbound FC cycle time is very long, then this will be
more likely to have an impact upon the customer. While this depends somewhat upon the
make-up of the items going through the process at that time, this generally seems to hold
true. Trying to measure the relationship between cycle time and customer impact was the
first task for this research.
We can look at the inbound cycle times for historical shipments which missed customer
shipment dates. Then we can deduce that if the cycle time were reduced to a certain level
that this would eliminate the misses. This data is shown in
29

Figure 6 is representative of a sample of data manually collected at two FCs during a two
week (non-peak) period.
30
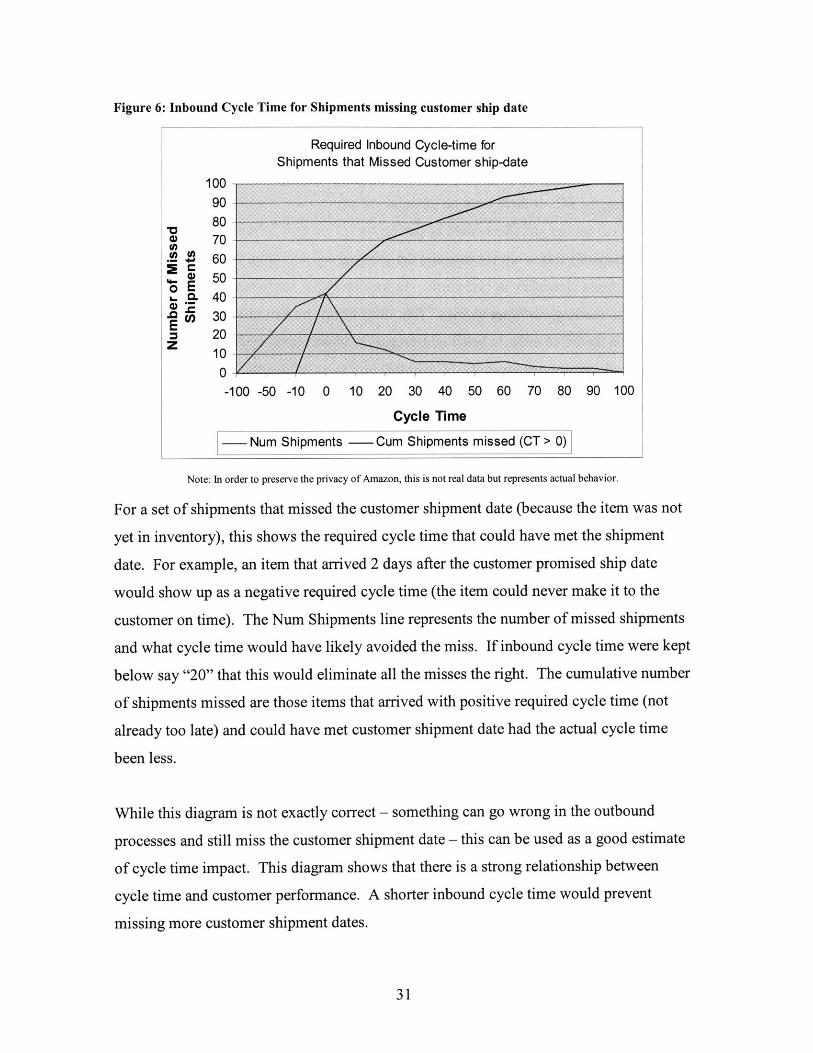
Figure 6: Inbound Cycle Time for Shipments missing customer ship date
Required Inbound Cycle-time forShipments that Missed Customer ship-date
100 -
908070
U) 6050o E
.L 40
30z 20
100-100 -50 -10 0 10 20 30 40 50 60 70 80 90 100
Cycle Time
Num Shipments - Cum Shipments missed (CT > 0)
Note: In order to preserve the privacy of Amazon, this is not real data but represents actual behavior.
For a set of shipments that missed the customer shipment date (because the item was not
yet in inventory), this shows the required cycle time that could have met the shipment
date. For example, an item that arrived 2 days after the customer promised ship date
would show up as a negative required cycle time (the item could never make it to the
customer on time). The Num Shipments line represents the number of missed shipments
and what cycle time would have likely avoided the miss. If inbound cycle time were kept
below say "20" that this would eliminate all the misses the right. The cumulative number
of shipments missed are those items that arrived with positive required cycle time (not
already too late) and could have met customer shipment date had the actual cycle time
been less.
While this diagram is not exactly correct - something can go wrong in the outbound
processes and still miss the customer shipment date - this can be used as a good estimate
of cycle time impact. This diagram shows that there is a strong relationship between
cycle time and customer performance. A shorter inbound cycle time would prevent
missing more customer shipment dates.
31

3.3. Inbound Variability
The inbound system consists of a series of operations with queues between them. The
queues are maintained primarily to have a buffer of work to absorb the variability of
work arriving the FC. If there were no inbound variability then there would be no need to
maintain these queues and there could be perfect one-piece flow of items through to the
bin. Unfortunately this is not the case and the growing and shrinking buffers from this
variability create variability in cycle time. As we saw above, cycle time is a key
ingredient to meeting customer metrics. This study begins by first quantifying the
variability at the FC in order to better understand the impact upon cycle time - the
primary challenge for managing the FC inbound processes efficiently.
3.4. Two Types of Solutions
There are two primary methods for improving customer service from inbound. As
described in Section 3.2, cycle time is a good proxy for customer service. Cycle times
can be kept short for all inbound items or items can be scheduled through the inbound
process so that expected customer shipment dates are not missed.
1. Flexible Labor. Since the inbound processes are highly labor intensive the
throughput capacity depends directly upon the current size of labor force. If there
is flexibility in bringing in additional workers, calling overtime, pulling from
other parts of the facility, etc, then this can be used to keep a consistently low
cycle time. Keeping a low cycle time will eliminate missed customer shipment
dates due to excessive inbound processing time.
2. Work Scheduling. Instead of processing everything through the inbound
processes in a short cycle time, work can be released into the system in a way
which processes the most important items first. This can optimally use a given
labor capacity so as to best meet the dates which customers expect their
shipments.
These two types of solutions are explored in the following chapters. This goal of the
research is to use a few models to estimate and compare the relative benefits of the two
approaches. This will provide enough background for a decision to be made between the
32

two. Then detailed development can proceed for the chosen solution type. Chapter 5
discusses the use of flexible labor and Chapter 6 discusses inbound work scheduling.
3.5. The Use of Models
There are several alternative methods for predicting the benefits of these two types of
changes to the inbound system. This investigation focused on several simple, analytical
models which are a good first-order approximation of the benefits. These models can be
done in a spreadsheet using simple Monte-Carlo methods and Mixed Integer Linear
programming. These methods were not the most precise or comprehensive, but were
practical for making the high-level decision at hand.
One important tool under consideration was whether to develop a discrete event
simulation that represented the whole inbound system at the FC. This simulation could
have been based upon the flow of product though the system and historical measures of
inputs, process productivity, and output performance (among others). This
comprehensive model could then be used to try different types of improvements and
measure the outcome.
A simulation model may be useful in the future, but was not warranted for this research
for several reasons. First, the effort required to develop this detailed model was
significant. The inbound system is complex (as described in Section 2.5) with many
subtleties that could be difficult to capture in this type of model. For example, managers
make many dynamic decisions such as when to send workers home early because they
know that few shipments are coming in for the rest of the day. These subtleties are
difficult to capture in a simulation model and it is hard to know which ones can be fairly
excluded or not. Second, the benefits of a comprehensive simulation are not clear. If
simpler models can be used to arrive at the same conclusion then this model is not
needed. This research focused on models that approximated and compared the benefits
of the two types of solutions (Flexible Labor and Work Scheduling) and not a whole
universe of solutions. Because of this, specific models focused upon the benefits of these
solutions were employed.
33

4. Measuring Inbound Variability at the FC
As described above in Chapter 3, variability is a key element to the performance of
inbound processing at the FC. In order to understand how this might be managed, it is
important to first measure it and understand it. This section describes and quantifies the
variability at a single FC over several weeks within the Amazon network.
4.1. Sources of Variability
There are several upstream sources of daily variability of arrivals at a facility. These
include:
" Procurement. Many products are ordered through automated buying policies.
The vendor orders are in response to customer demand or low stocking levels.
Variability in demand patterns will translate into upstream variations.
" Vendor order fulfillment lead-times. Vendors have different order fill lead-
times and variability. Even if ordering is done to smooth inbound material flow,
there is some variability in how quickly a vendor will respond to an order.
Different vendors have very different variability in their fulfillment times.
* Inbound Transportation. There is variability in the carrier networks as to how
long products will take to be delivered to the FC. This is different for different
types of carriers (LTL, TL, Parcel) as well as for each carrier.
Figure 5: Inbound timeline, in section 3.2 shows the inbound cycle for items coming
through the larger inbound process. Each link in the inbound chain introduces variability
which impacts the arrivals at the FC.
Additionally there are other sources of variability at the FC which affects the ability to
process the inbound product.
* Product mix. Depending upon the type of product arriving inbound the labor
required to receive and stow that product may vary. There also may be labor
shortages for people who can do certain kinds of receive processes.
34

* Packaging. Depending upon how the vendor packages items, it may take more or
less labor to complete the receive process. This also depends upon the size of the
vendor order as it can be much faster to receive items in bulk than many single
unique items.
" Quality. If there are quality or accuracy problems with the shipment then the
labor content can be much higher than expected.
" Productivity Rates. Different people will have different labor rates on different
days. This is partly due to the product mix, but also due to the makeup of the
workforce that is on a given shift.
" Absenteeism. Not all workers show up when they are expected and this affects
the FCs ability to process inbound shipments.
4.2. Measuring the Variability of Product Arrivals
There are many possible ways of looking at the variability of what is arriving at an FC:
" Variability of actual inbound arrivals as compared to forecast
" Overall variability of FC arrivals in units of product
" Variability of labor content of the product arriving
* Variability of receiving rates for different resources
" Variability in different time measures: monthly, weekly, daily, hourly
We measure some of these below.
4.2.1. Forecast Accuracy
An FC typically looks at a forecast for inbound units and plans the operation based upon
this. The forecasts are provided on a weekly basis and project inbound volumes for a
number of months into the future. The operations manager at the FC will generally use a
4 week aggregate for next month and the two week out forecast for planning purposes.
The two week number is the last chance to determine the exact labor size requirements.
Understanding the variability from the forecast is important because this is another source
of variation introduced into the manager's planning.
35

In the Amazon network, the monthly aggregate variability from forecast is on average
~4.5% and the weekly variability is ~9%. The corresponding standard deviation of error
is ~5.3% and ~10.6% respectively. This is based upon total units of product actually
received measured against the original operating forecast. Not surprisingly the forecast
becomes less accurate the more narrow the time window. Since the forecast is only given
on a weekly basis there is no daily forecast as to what will arrive the FC. Instead there is
visibility to actual product that will arrive based upon supplier and carrier information
about shipments en-route to the FC.
From the perspective of the Inbound FC operations the most important forecast is 2
weeks out. There is flexibility within this time frame to change the headcount and
therefore capacity of the inbound system. After the two week forecast, there is less
flexibility and is usually overtime or letting people go home early.
4.2.2. Variability of Actual arrivals - Weekly Cycle
Actual arrivals to the FC are very cyclical in nature, mostly driven by the operational
cycles of the vendors and transportation providers. For example Mondays and Tuesdays
account for a lower volume of deliveries since carrier networks generally do not operate
in the same manner over the weekend. The largest volumes come on Wednesday and
Thursday with limited deliveries on Saturday. This pattern makes it hard to measure the
exact variability since there is a cyclical nature to it. Therefore to do this analysis we
look at the variability across the same day of week across several weeks. The table
below shows the percentage of units that arrive across the days of the week at one
facility. This is for a period of several weeks in June-July of 2004, but is a fair measure
for most of the year since it represents the cycle of upstream vendors and transportation
providers (except perhaps parts of the peak season when transportation providers can get
backlogged).
36

Table 2: Product Arrivals by Day of Week
Avg % of total units for
Day of Week the week Coefficient of Variation
Sun 1.30% 2.236
Mon 17.37% 0.361
Tue 17.31% 0.156
Wed 21.51% 0.101
Thu 21.70% 0.132
Fri 18.32% 0.171
Sat 2.49% 0.421
We see there is a pattern to the volume of arrivals across the days of the week. This also
shows that the variation is not constant for each day. The highest volume days represent
the lowest variability (which is a good thing!), but that some days have higher variability
than others - most notably Mondays. Generally there should be no deliveries on a
Sunday, however, one week of accepting deliveries pushed the coefficient of variance up
in this sample.
It is also important to note that the FCs do some smoothing of arrivals in order not to go
over the capacity of the dock. If a carrier requests a delivery on a day that the facility
already has very high delivery volumes, the carrier may be asked to come the following
day. The totals above may be influenced some by this smoothing and therefore may not
represent the "natural variability" of the system. However, during most of the year
(which is when these measurements were taken), there is adequate facility capacity to
handle most of the requested deliveries and therefore for the purpose of this analysis we
will ignore this.
4.2.3. Variability of Labor Content
If the mixture of product arriving the FC were fixed then the labor content would be
closely proportional to the volume. However, there is significant mixture in the type of
product arriving, the packaging and therefore the processing time required to get the
product into an inventory location. This causes variability in the labor required to
process the material.
37

Which receive process path that the product must go through is the largest determinant of
labor required to process the product. Daily variations in the volumes across the different
process paths help to understand this. If we assume the queues are worked in equal
proportion to what is arriving the facility then these rates should directly represent the
variability of the items arriving. This is not necessarily a good assumption since queues
may grow or shrink to handle this variability. However, it is difficult to get the exact data
to fully measure arrival variability and this is the closest available.
Table 3: Receive Process Path Breakdown
% Assortments/
% Each % LP %Case % Pallet Prep
Avg 35.2% 20.0% 12.6% 32.2% 10.6%
Stdev 10.8% 12.5% 7.9% 16.5% 7.3%
Another measure of labor content variability is the overall receive productivity
variability. Since the different process paths have different receive productivity rates and
the variability in product mixture will show up in the labor required to receive these
items. This measure also includes the variability of rates at which different receivers
work. Over a several month period the total daily productivity coefficient of variability is
-0.22. This also has a weekly cyclical nature and the chart below shows this.
Table 4: Coefficient of Variation by Day of Week
Day of Week of Receive CV
Mon 0.305
Tue 0.197
Wed 0.147
Thu 0.134
Fri 0.173
Sat 0.347
Total 0.224
This data represents the overall system variability of productivity on a daily basis. To
fully understand the internal operational variability, it is worth also measuring the
productivity variability within a process path. This is summarized below:
38
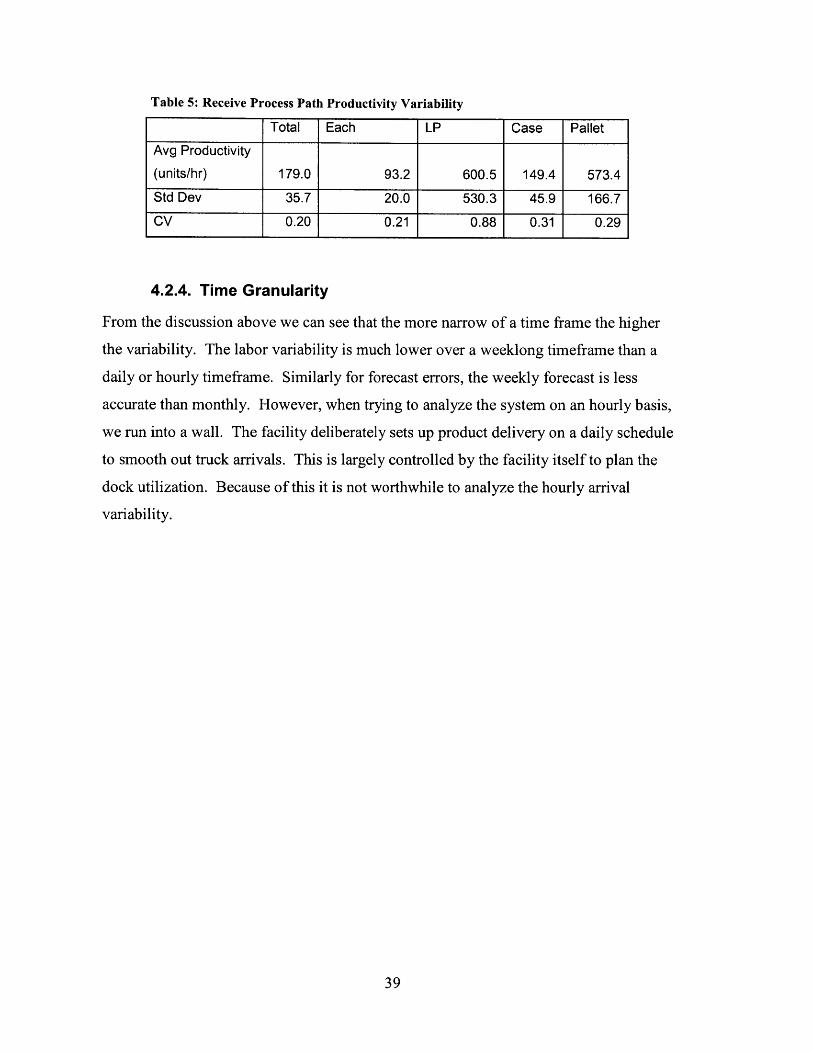
Table 5: Receive Process Path Productivity Variability
Total Each LP Case Pallet
Avg Productivity
(units/hr) 179.0 93.2 600.5 149.4 573.4
Std Dev 35.7 20.0 530.3 45.9 166.7
CV 0.20 0.21 0.88 0.31 0.29
4.2.4. Time Granularity
From the discussion above we can see that the more narrow of a time frame the higher
the variability. The labor variability is much lower over a weeklong timeframe than a
daily or hourly timeframe. Similarly for forecast errors, the weekly forecast is less
accurate than monthly. However, when trying to analyze the system on an hourly basis,
we run into a wall. The facility deliberately sets up product delivery on a daily schedule
to smooth out truck arrivals. This is largely controlled by the facility itself to plan the
dock utilization. Because of this it is not worthwhile to analyze the hourly arrival
variability.
39

5. Handling Variability through Flexible Labor
The benefit of having a flexible labor staff is to be able to scale the workforce to meet the
variability of the labor content of the product arriving the FC. Since inbound receiving is
a highly labor intensive function, then the throughput of the system is nearly linear to the
size of the workforce. If the workforce could scale instantaneously to the work arriving,
then cycle times could be short and constant. There would be no need to distinguish what
items are more important than others since all items could be processed in a reasonable
timeframe.
Unfortunately, there is a delay in being able to change the size of the workforce as well as
other practical management limitations to being able to do this. Scaling quickly is a
challenging problem and prior to implementation it is important to understand the
theoretical benefits. This goal of this analysis is to explore the benefits of labor force
flexibility on cycle times.
5.1. Literature Review
There has been a lot of research in the area of medium-term workforce staffing and short-
term workforce scheduling. This has been explored mostly using LP and MILP models
to determine the optimal staffing and workforce decisions. Pinker and Larson (2003)
introduce a model for tactical staffing decisions between full-time employees, overtime
and contingent labor in an environment of labor demand uncertainty. The model
objective is to minimize cost and backlog and tests different timing of demand
information available. A key conclusion is that demand information and labor flexibility
go hand in hand. This builds upon the work of several prior publications including
Abraham (1986) and Berman and Larson (1994). Berman and Larson (1994) present an
optimization for determining the optimal sized labor pool of temporary workers.
Legato and Monaco (2004) address labor scheduling at a marine terminal. They
decompose the problem into long-term planning and daily planning and create
mathematical models for both horizons taking into consideration the work arrival
40

variability. Bard (2004) explores multiple labor skill levels and the scheduling problem
in the context of a US Postal Distribution centers. There is similarity
Another area of research has been in contract arrangements with temporary staffing
agencies. Milner and Pinker (2001) explore contract arrangements with "labor supply"
providers. The paper investigates how to construct a contract which coordinates the firm
and the agency.
5.2. Analysis of Flexible Labor at the DC
This analysis addresses the short-term labor scheduling problem in the context of inbound
operations at a distribution center. In this context many workers are cross-trained so only
total labor capacity is considered and not a multi-skilled workforce. It is also assumed
that all labor supply is internally managed and contracting with an external agency is not
examined.
Rather than adapting one of the models already proposed in literature, this thesis makes
an estimation of the scale of labor flexibility required in order to meet the demand
uncertainty and guarantee a certain processing time. The models presented are simpler
and do not account for the complexities of queuing theory or dynamic decision making.
However, these models are very useful at giving an estimate of the order of magnitude of
flexibility and do not require as sophisticated a data set to run.
5.2.1. Daily cycle of arrivals
There is a natural daily cycle for inbound deliveries and this drives how labor should be
scheduled. This is based upon the nature of the carrier networks feeding into the facility.
41

Figure 7 Example Plot of Time of Day of Work Arrival
Arrival Distribution
350 -
300
250
S200 -- _ Mon Arrivals
-- 0 Tues Arrivals150
100
50
08 8 8 8 8 8 8 8 8 8 8 8eN if 0 66d & ~ c N0 0 d
Time of Day
Note: This is not real data, but only an attempt to show graphically they arrival cycle at the facility
Flexible labor scheduling must react to this pattern of arrivals. In order to process all
material in say a 12 hour window, there must always be enough labor to handle the total
area under the curve over the prior 12 hours. There are two models presented below
which provide a rough estimation of the labor flexibility required to meet a certain cycle
time.
5.3. A Simple Model - A Daily Analysis
To get a first pass at this analysis we break the problem into day sized chunks. We
assume that we need enough labor each day to process all that day's arrivals and this
guarantees a cycle time for all items of less than one day. By the time the workers go
home, all material has been put into the bin and that at the start of each day the there is no
queue. We need enough flex-up labor capacity to handle the variability in daily work
42

arrival. We also assume that there are no other facility capacity constraints and that labor
hours are the only determinant of being able to process inbound product.
The variability of required labor depends directly on the total daily variability in work
arrival and the productivity of the workforce. We already have two measurable random
variables to give us this estimate:
" A - the total daily quantity of arrivals. (units)
" P - the daily productivity rate to process product. (units/hour)
See Section 4.2 "Measuring the Variability of Product Arrivals" for the estimates of these
numbers. This is based upon a several week sample during the non-peak season. The
absolute numbers will change throughout the year, but this gives a reasonable
approximation of the scale of flexibility in the workforce required.
The best way to get an estimate of the total work variability is to do a simple Monte-
Carlo simulation which estimates the total labor content from the estimates of these two
variables. We set up the simulation with the following different numbers in order to get a
rough sense of the difference across different days of the week.
Table 6: Daily Work Arrival Simulation Scenarios
Arrivals (A) Productivity (P) Daily Work
Scenario Arrivals Arrival Average Productivity Average Total Lower Upper
Avg (# Coeff (uph) Coeff of (man- Work Bound Bound
units/ of Var Var hours/ CV 5% 95%
day) day)
1. Best 60,000 0.1 179 0.2 350 0.26 238 511
Guess
2. Worst 60,000 0.36 179 0.305 372 4.4 126 780
Case
3. Best 60,000 0.1 179 0.1 339 0.14 265 424
Case
43

Figure 8: Sample Simulation Output of Scenario 1
Labor Hours
0.05 500
0.04 400
-n
- 0.03 300 (D
.2 200
0.01 -10
0.00 0200.00 300.00 400.00 500.00 600.00
(hours)
Each estimate above is based upon 10,000 trials with normal distributions for both the
Arrivals and Productivity rates. We can see that the forecasted distribution is not normal
and has a longer tail on the high end.
Scenario 1 is the best estimate of what the actual variability with the other two showing
better and worse cases. The worst case scenario is based upon observed data for a series
of Mondays. The best case is the lowest observed daily variability in both productivity
and arrivals.
In order to meet the daily variability 90% of the time the workforce would have to be
able to flex up to the 95% upper bound and down to the 5% lower bound. In order not to
have to let permanent staff go the permanent workforce would have to be around this 5%
lower bound - 238 hours in scenario 1. Then the facility would need access to up to 273
additional (flexible) man-hours on a daily basis. This is more than 100% flex in the
workforce! Even in the best case scenario flexing from 5% to 95% would require a 60%
flex-up workforce.
44
Having a workforce that could meet these flex requirements would cap inbound cycle
times to less than 1 day. Actual cycle time averages would be more like day or less.
We can use this estimate of cycle time to estimate the impact upon customer shipment
date and therefore understand the impact that a flexible workforce has upon servicing the
customer.
5.3.1. Limits of this model
This model is a simplification of the dynamic environment of inbound. Managers have a
certain amount of information one day ahead of time, the morning of, and during the day.
This model does not capture this, however, assumes that a manager knows enough
roughly one shift ahead of time to judge how much labor is required. For example, the
manager could wait until late in the day to see how much has arrived before determining
the size of the night shift. Since most of the product arrives during the day, this is a
reasonable assumption for Amazon.
This model also does not account for the queuing theory utilization rates and how they
effect processing times. This model assumes utilization rates of 100% and no waiting on
inbound material. Queuing theory would suggest that this is an unreasonable assumption;
however, given the nature of arrivals at Amazon this is not so unreasonable. Arrivals
happen in a variable pattern throughout the day, but shifts could be staggered so that
work buffers are built in the morning, when there are lots of arrivals, then worked down
in the late afternoon and evening, when there are fewer arrivals. Queues would be empty
when workers go home, but they could have been large during the day. Because of this
pattern of arrivals (and not a random arrival pattern such as a Poisson process), queuing
theory does not directly apply.
The model also assumes that there is no inventory carry over from day to day. This
limitation is addressed in the next model which takes a week-long estimate of cycle
times.
45

5.4. A More Sophisticated Look
While the above model is good for getting a sense of the scale of labor flexibility needed,
the inbound world is a little more complex. We assumed above that each day is
independent and that the goal was to process all arrivals each day. We will now look at
another model which relaxes these assumptions. This model below will give us a rough
estimate of the cycle time benefits of varying degrees of labor flexibility.
5.4.1. The Model
The model looks at week sized chunks and unfinished work is carried over from day to
day. It takes as input a fixed labor capacity and a flexible labor capacity for each day of
week. The fixed labor capacity represents labor that you are going to pay for no matter
what. If you have guaranteed certain workers an 8 hour day, then sending these workers
home is wasted labor. The Flex labor is labor which is optional and for which there is no
penalty for using none, some or all of it. Historical Arrival rates and Productivity rates
are used as the basis for the random Arrival quantity and Productivity variables. The
model is a Monte Carlo simulation with following:
Inputs:
F - Weekly forecast for that week. This is the number that managers would use to plan
their workforce 2 weeks out.
S - Starting units in the queue (NYR)
A~j - Historical average volume of arrivals (%) for day of week (DOW) i
A, i - Historical Coefficient Var. of Arrivals for DOW i
P - Historical Average productivity
Pcv i - Historical CV of Productivity for DOW i
PLj - Fixed Labor capacity for DOW i. This is the permanent workforce.
FLj - Flexible Labor capacity for DOW i.
PLc - Hourly cost of permanent labor
FLc - Hourly cost of Flex Labor
Random Variables:
Ai ~ N(Ai*F, Acvi * Api* F) - Arrival of material (units) for day of week i.
46

Pi ~ N(Pp, PCV i) - Inbound productivity for day of week i
Outputs:
C - Total Labor cost. This only includes hourly workers and does not accommodate for
any additional costs of managing or maintaining the flexible labor.
CT - Estimated Average cycle time for all the items received that week. This calculation
is simplified by estimating that if something is processed on the same day that it arrives,
it has a .5 day CT and if an item is processed the following day it has a 1.5 CT, etc.
E41 - the % estimated received product that week to have a cycle time of less than 1 day
The model takes the permanent and flex labor capacity for each day of the week and
determines how much of the flex labor is required for a given day. The goal of the model
is to determine cycle time and the total labor cost as a function of how much labor
flexibility there is. Both CT and E<1 are measures for cycle time management.
5.4.2. Results
Below are sample results for a set of runs each with 2,000 trials. These are with a
permanent staff of 100% of the forecasted daily workload and with varying levels of
permanent staff.
Table 7: Cycle time impact of flexible labor (staffing to 100% of expected arrivals)
Flex Percentage 0 10% 20% 30% 40%
C (Avg) $ 20,112 $21,226 $21,828 $22,115 $22,304
CT (Avg) 0.73 0.62 0.57 0.54 0.53
E41 (Avg) 77.36 88.30 93.36 95.96 97.43
The following is with a staffing level of 90% of forecasted daily workload.
Table 8: Cycle time impact of flexible labor (staffing to 90% of expected arrivals)
Flex Percentage 11% 22% 33%
C (Avg) $19,639 $20,644 $21,120
CT (Avg) 0.73 0.63 0.57
E.1 (Avg) 77.29 87.02 93.30
47
From these examples and many other runs of the model, we can make a few observations:
1. There is cost benefit from staffing below the expected volume, but this requires a
corresponding increase in flexibility in the workforce. Staffing below expected
volumes means that you are less likely to pay the full-time workers for times
when there is not enough work for them to do. However, the lower the permanent
staff, the higher the percent flexibility is required to maintain the same level of
cycle time performance.
2. The total daily labor capacity above the expected work content is the primary
determinant of cycle time. If we can staff up to 10% above the expected work
content then this provides good cycle time benefit. However, there are
diminishing returns to this additional capacity about 30%.
3. From the model we can find an "efficient frontier" which represents the optimal
tradeoff in permanent labor and flex labor and minimize the labor cost for a given
cycle time.
5.4.3. Limitations
There are a few additional considerations and limitations:
" The model does not consider the intra-day challenges of managing the inbound
queues. It assumes that if there is enough labor, then the system can always be
managed effectively to process product through the queues. This is a reasonable
assumption and the reasons why are described in Section 5.3.1.
" The model operates on a weekly basis and does not consider NYR across weeks.
The starting NYR partially accounts for this. Week to week NYR can be well
managed since there could be a flexible weekend shift as well. This shift could
also be flexible and responsible for zeroing the queues.
* It is likely that there is an additional "fixed" cost of managing the flex workforce.
This is not included in the model but can easily be added to the cost estimate
depending upon the facility.
" The model treats all workers the same. It may be the case that a flex staff may
have lower productivity rates.
48

While this model has some short-comings, it confirms what the first model also shows.
In order to handle the highly variable environment at the Amazon.com FC, there is a
tremendous amount of flexible labor required.
5.5. Flexible Labor Conclusions
Overall, flexible labor would be a challenging solution in the context of Amazon.com.
From both of the models presented here, there is a large amount of flexibility required to
reduce cycle time significantly. These models only operated at a relatively granular
"daily" level and achieving better future improvement down to an hourly cycle times
would be even more difficult. Flexible labor would have to be on the magnitude of 100%
to achieve a cycle time performance of less than one day (probably around 1 day) and
workers would have to be on-call with only a few hours notice. It is practically difficult
for an FC to achieve this magnitude of flexibility.
Additionally it is hard to justify the management challenges of a highly variable
workforce when it is not clear how important it is to receive the items on a given day.
For example, is it worth brining in a dozen overtime workers to process all the rest of the
inbound material? This largely depends upon whether it is important to receive those
items or not. This leads to the discussion of prioritization in the next section.
Flexible labor may be a viable solution for a distribution facility with lower amounts of
variability for product arrivals and productivity rates. Other locations may be able to
practically achieve the flexibility required to meet required cycle times. This is also
dependant upon the availability of a flexible workforce in the location of the facility.
49

6. Inbound Work Scheduling
We see from the above analysis we found that a flexible workforce requires an enormous
amount of flexibility in order to reduce cycle times. In this case it is unlikely that labor
flexibility is a practical solution. An alternative is to control the release of inbound
product into the facility so that the high priority items are processed first. Rather than
reducing cycle time for all items, we can design an inbound processing system which
minimizes cycle time for those items that need to be processed in a shortest time.
6.1. Literature Review
Operations scheduling is well studied in the last few decades. This has been researched
in many different contexts and the most relevant to the inbound scheduling of work are
listed below (Nahmias pp. 356-357):
1. Job Shop Scheduling - Scheduling work in a job shop across a set of machines.
2. Dynamic Scheduling - Scheduling can be analyzed either as static or dynamic.
Dynamic scheduling continually determines over time which item to schedule
next.
3. Vendor Scheduling - This is most investigated in the context of JIT
manufacturing for scheduling of inbound deliveries to meet the need of a just-in-
time manufacturing system.
4. Personnel Scheduling - scheduling of labor. This is largely the same as the labor
scheduling problem discussed in Chapter 4 above.
Elements of each of these types of scheduling problems are present in the scheduling of
inbound material to the FC. The goal of scheduling is to optimize one or more aspects of
the system performance. Some of the objectives include (Nahmias pp 360-361):
5. Meet the order/item due date
6. Minimize costs
7. Minimize WIP
The nature of the scheduling problem commonly is a trade-off between customer service
(meeting the due date) and costs (either production costs or inventory holding costs).
50
Several work sequencing rules have been studied which are relevant to this problem
(Nahmias pp 363-400).
1. FIFO
2. Shortest Processing Time
3. Earliest Due Date
4. Critical Ratio - defined as Processing time / ( Due date - Current Time)
Portugal and Robb (2000) describe situations when production scheduling models are
applicable. They conclude in many cases sophisticated algorithms are not necessary in a
production environment. The cases when they are warranted is in long-cycle time and
job shop environments.
Kreipl and Pinedo (2004) discuss medium term planning Supply Chain models and how
they can work with short-term production scheduling systems. They found it difficult to
create a single framework which captures both problem areas.
Additionally the work release or work sequencing problem is partly an appointment
problem since a primary mechanism for controlling the arrival of product at the FC is
through an appointment process with the transportation carriers. The appointment
problem has been well studied especially as related to health care. This is a problem of
granting an appointment for a scarce resource under dynamic conditions. Mondschein
and Weintraub (2003) explore this problem as related to waiting service times. Tugba and
Veral (2003) provide an excellent overview of the research that has been done around
appointment scheduling in healthcare.
In general, very little has been written specifically about inbound scheduling at
warehouses or distribution centers. There are some proprietary software providers who
have done work on truck scheduling algorithms though it is not clear how effective or
widely used these are.
51

6.2. Considerations for Work Release at the FC
Below is a simple representation of an inbound prioritization system at a DC. This
system would determine priority and sequence items to be received.
Figure 9: Prioritization Process
Inbound freight - DC Inbound Cycle Time (CT)
inventory type TItem availableTruck Arrives for Customer
Item NotStocked High Priority (guaranteed Order
Item out of short CT)
First time Standard Priority (average CT)
stocking item
Normal Low Priority (possibly long CT)Stock-up
There are a number of dimensions to the inbound system that are worth discussing before
introducing any analytical models. There are practical considerations for how scheduling
can be done which determine how the problem should be framed.
6.2.1. Priority of items arriving the FC
In order for a prioritization scheme to be successful there needs to be a mix of high and
low priority products arriving at the DC. We can look upstream from the DC to get a
better picture of what is arriving. Section 2.3.2 "Procurement" describes the different
types of inventory which is arriving at the facility at Amazon. These types of inventory
range from items not stocked, ordered from a vendor to fill an open customer order, to
normal stock-up, which is cycle stock arriving the FC.
These different categories of inbound product do not in themselves indicate a priority,
however, they do show that there may be a wide range of importance for the inbound
product. The inventory models used for predictive ordering will have a re-order point
based upon the past lead-time and variability of the product from that vendor. One half
of the time a given product will arrive with a lead-time less than expected. If there is a
high degree of variability in the upstream lead-times then items will arrive with a wide
52

distribution of priority. Items which happen to reach the FC well in advance of being
needed are low priority; items which arrive late will have a high priority.
Inbound items which are demand driven may or may not have a smaller distribution of
priority. Similarly for New Products this distribution depends upon procurement
processes and the vendor. But, in order for prioritization to be successful there would
need to be a mixture of product priority arriving at the facility.
6.2.2. Units of Work Scheduling
An added dimension of complexity is to determine what units should be scheduled.
Distribution works with several aggregated or dis-aggregated work units ranging from a
whole truck to a single box. Typical production scheduling algorithms for discrete
manufacturing occurs only at the end product level and does not have this added
complexity. Receiving operations may process items at various levels.
Additionally, there is a cost to physically sorting inbound items to prioritize and this must
be balanced against the benefits of the prioritization. It may not be worthwhile to sort
through an entire truck of items to find the single one of high importance if it is just
easier to process the whole truck. Much of this analysis focuses on scheduling and
sequencing of whole trucks or of shipments, which are major chunks of a truck.
6.2.3. Timing of Scheduling and Scheduling Flexibility
Scheduling trucks means working with the transportation provider to mutually agree
when they will deliver to the DC. Traditionally this scheduling is done a day or so in
advance of the delivery. There may be limited information about the relative priority of
the items for a given truck at the time that scheduling needs to be done with the carrier.
The transportation providers have limitations to their flexibility which adds a constraint
to the ability to sequence trucks. Many transportation providers also may have standing
arrangements with the DC since they delivery such high volumes. For example, some
carriers will deliver each day at noon. This arrangement may pose some challenge to
53

sequencing, though not insurmountable. Inbound scheduling at the truck level would
need to take into account the operational setup of the carrier network.
There are different limitations for scheduling at other units of work. For example, when
considering scheduling pallets, there are challenges as to how and where to store the
pallets in the facility. Full flexibility would mean always being able to pick out the next
pallet to work on, however this may not be practical since the pallet may be blocked or in
a farther away location.
6.2.4. Information Availability and Quality
A key to prioritization is to have advance knowledge of what is arriving at the facility in
the IT systems. The information is dependant upon both the vendor and transportation
provider. The vendor provides information on "what" the shipment is and the
transportation provider identifies what shipment is available for delivery and when. In
the case of Amazon.com getting all this can be a challenge since there are thousands of
inbound vendors. Not all vendors have the systems to provide good quality advance data.
Inbound scheduling must take into account this availability of information.
6.3. Truck Scheduling
We start with an analysis of truck scheduling to better understand the benefits of this.
The advantages of scheduling trucks versus other work units are clear: trucks can fairly
easily be sequenced at the facility through the appointment process. There is no
additional cost to physically sort the inbound products.
To begin, we assume that we have perfect information ahead of time about all shipments
arriving. We can construct a static mixed integer linear program to determine the optimal
day to schedule each truck in order to get as many items into inventory by its due date.
This model provides a theoretical upper-bound estimate of the potential benefits of better
truck scheduling, though the actual problem is a dynamic scheduling problem.
6.3.1. Optimization Formulation
Decision variables: Aj = Boolean of whether truck j is scheduled for day i
54
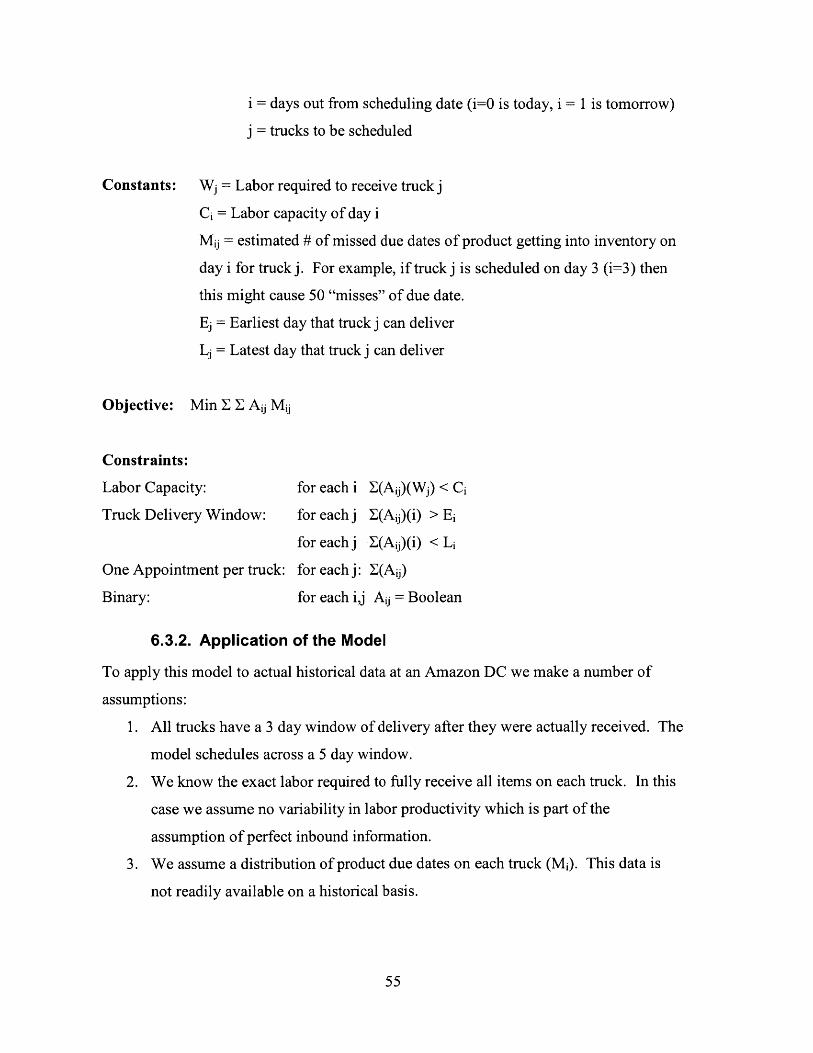
Constants:
Objective:
i = days out from scheduling date (i=0 is today, i = 1 is tomorrow)
j = trucks to be scheduled
Wj= Labor required to receive truck jCi = Labor capacity of day i
Mij = estimated # of missed due dates of product getting into inventory on
day i for truck j. For example, if truck j is scheduled on day 3 (i=3) then
this might cause 50 "misses" of due date.
Ej = Earliest day that truck j can deliver
Lj = Latest day that truck j can deliver
Min E Z Aij Mj
Constraints:
Labor Capacity:
Truck Delivery Window:
One Appointment per truck:
Binary:
for each i
for each j
for each j
for each j:
for each i,j
Y-(Aij)(Wj) -< Ci
E(Aij)(i) > Ei
E(Aij)(i) < Li
Y.(Aij)
Aij = Boolean
6.3.2. Application of the Model
To apply this model to actual historical data at an Amazon DC we make a number of
assumptions:
1. All trucks have a 3 day window of delivery after they were actually received. The
model schedules across a 5 day window.
2. We know the exact labor required to fully receive all items on each truck. In this
case we assume no variability in labor productivity which is part of the
assumption of perfect inbound information.
3. We assume a distribution of product due dates on each truck (Mi). This data is
not readily available on a historical basis.
55

4. We use planned workforce size to determine the inbound receiving capacity.
Many workers are cross trained on all inbound process paths so we assume only a
total capacity constraint and assume managers can allocate resources dynamically
across specific receive processes.
5. We schedule trucks only to a day level granularity (not hourly).
The third assumption above is the most significant. Actual data is not available, but we
can come up with a reasonable set of distributions for all trucks based upon the
knowledge of the types of inventory that is coming inbound. We can use estimates of the
percentage of items going to fill open customer orders, percentage of new products, etc to
give us ballpark figures. We can then run this model using a variety of distributions to
understand the sensitivity to this input.
6.3.3. Results
Below are a set of scenarios which demonstrate the nature of the model. All are run
using actual truck data for a given week (except Mi). This includes scheduling roughly
30 trucks per day (some full, some partial). This data set was from a non-peak time of
year. This analysis was not re-run on other sets of arrival data, but rather extensive
sensitivity analysis was performed to understand the relevant input variables. The actual
data represented a starting point that was then adjusted to see what inputs had the most
impact upon the performance of the system.
Scenario 1: All trucks have some items with immediate due dates
We assume the same fixed distribution of dues dates for items on each truck (Mi). The
distribution is shown below.
Table 9: Scenario 1 Distribution of priority of items on trucks
Due Date (in the future) 0 1 2 3 4 5 6+Density of Due Date 0% 30% 30% 20% 10% 10% 0%
Cumulative 0% 30% 60% 80% 90% 100% 100%
In this scenario 30% of items in all trucks need to be received within 1 day and another
30% need to be received within 2 days. All items must be received within 5 days in order
56

not to miss a due date. This is the same distribution for all trucks. Running the
optimization on this scenario this results in 5,869 missed item due dates.
Scenario 2: One truck per day has low priority items
Table 10: Scenario 2 Distribution of priority of items on trucks
Due Date (in the future) 0 1 2 3 4 5 6+Density - Low priority 0% 0% 0% 0% 20% 40% 40%truckCumulative - Low Priority 0% 0% 0% 0% 20% 60% 100%truckDensity - High priority 0% 30% 30% 20% 10% 10% 0%truckCumulative - High priority 0% 30% 60% 80% 90% 100% 100%truck I I I I I I IWe have one low priority truck which has items with a due date 4 days in the future. All
other trucks are the same as scenario 1. Solving this results in 3,165 missed due dates.
Scenario 3: Three trucks per day with low priority items
Using the same due date distributions as scenario 2 but assuming 3 trucks per day with
lower priority items, we find another dramatic improvement. This results in only 79
missed dues dates.
Across these three scenarios we find a dramatic improvement by having some low
priority trucks. To reach nearly zero due date misses only requires 10% of the trucks to
be have items of lower priority.
The primary constraint pushing trucks into the future is labor capacity on a given day. If
there is enough labor to process all trucks available on a given day, then no trucks are
pushed out and no due dates are missed. On the days when there is excess capacity, then
it is possible to receive all trucks including both the high and lower priority items and no
due dates are missed. Workers may go home early and everything is in inventory.
However, on days that there is more product available than what the facility can handle
then the model starts to push off the lowest priority trucks. The lowest priority trucks
then become the "buffer" of work for those days when there is excess capacity. There
only needs to be a small number of trucks with due dates in the future for the model to
show significant benefit to this sort of scheduling.
57

6.3.4. Conclusions from the Model
This model is a simplification in a number of ways. It assumes perfect information of
arrivals ahead of time and that trucks can easily be scheduled as needed. In spite of these
simplifications, the model demonstrates a clear principle: having a few trucks with only
low priority items and with scheduling flexibility enables significant system benefits. If
scheduling is done dynamically and not a static optimization algorithm, many of the
benefits can still be realized. As long as low priority trucks are the ones being pushed off
from one day to the next, these is less likelihood of missing due dates. In a distribution
network where most inbound orders are stock-up inventory, there is likely to be a
significant distribution of priority (depending upon the variability of vendor lead-times)
and therefore it is likely that more than 10% of trucks contain lower-priority items.
This also suggests that knowing what trucks have low priority items with future due dates
is important information. If there is limited information about the content of some trucks,
this may not matter if the facility knows about a few trucks with lower priority items.
Having limited information about some trucks does not prevent scheduling from having
benefit.
6.3.5. Limits of this Model
There are several limits to this model which need to be acknowledged. This is not to say
that the current iteration of the model does not yield useful results. We should be careful
to acknowledge the limits and not to draw inappropriate conclusions.
Imperfect information. This model assumes that we have perfect visibility to
what is on each truck, and the priority to every item. This model yields the
optimal solution given this perfect information. However, if the information used
for the planning turns out to be quite different than actual arrivals, this has impact
upon the performance of the system. There are several reasons that this
simplifying assumption is appropriate at this stage. First, in the long-run, inbound
visibility will improve and it is appropriate for the solution to take advantage of
this. Second, even if there isn't perfect visibility, there is a lot of reasonable
prediction that can be done. For example, based upon historical data, Amazon
58
can predict how much labor it should take to receive product from a certain
vendor. While Amazon may not have the exact data of what is on the truck,
reasonable approximations can be made.
* Dynamic Model. Instead of a static run of the model, many of the decisions at
the FC are made in an ongoing basis. We looked at the planning process as if it
were a one-time optimization. While the model is static, this is reasonable for
approximating the benefit of work scheduling. This gives an upper bound and is
useful for comparing with flexible labor. The model indicates that if the FC could
schedule and process everything just right, what would be the benefit. This is the
sort of approximation that is helpful from this model.
* Equal weight of all 'misses". There may be certain type of misses that must be
avoided versus other types which are less important. For example, a customer
who is already waiting several weeks for a product and who is in jeopardy of
missing the shipment date may be less important than a "miss" for someone who
has paid extra to receive the shipment next day. This would be an operationally
useful consideration for when the FC actually goes to work scheduling. At this
time, this is a complexity that we do not need to worry about since it is not likely
the factor that would sway the decision between flexible labor and work
scheduling.
This model is a great simplification of the inbound system, however, it is adequate to
determine the correct long-term direction for inbound. In order to further investigate the
details of work scheduling, more sophisticated models would have to be developed.
These should handle the dynamics of the system, account for differing amounts of
inbound information and appropriately determine the priority of trucks arriving.
However, this analysis is beyond the scope of this research.
6.4. Inbound Work scheduling conclusions
This work scheduling analysis used only a single static optimization model to show that
there are large potential benefits from sequencing and scheduling trucks. When
comparing this to using flexible labor capacity, we find that work scheduling appears to
59
be a better solution. Flexible labor must scale tremendously in order to guarantee most
items are received within a day, whereas scheduling trucks can fairly easily guarantee
that the important items are received within a day. Less important items will have a
longer cycle time, but this is acceptable since this does not have an impact upon the
customer experience.
We also conclude that there are two keys to seeing significant benefit from scheduling
trucks:
1. Trucks with only low priority items exist and can be identified ahead of time
2. These trucks have some degree of scheduling flexibility (i.e. they can be
scheduled up to a number of days in the future)
Trucks are the most attractive unit of scheduling for the FC. Generally, the larger the
work unit, the less sorting is required. Scheduling individual packages would require
significant resources to sort and prioritize. Finding the largest work unit which can be
practically scheduled is important to the decision. In the case of the Amazon FC, it
appears likely that trucks are the best sort point.
The lessons above can also logically be applied to sub-truck work units. For example, if
a single truck contains multiple shipments - a less than truckload shipment (LTL) - one
may be high priority and the other a low priority. The facility can stage low priority
shipments in a holding area at the facility and schedule the release of shipments rather
than only scheduling at the truck level.
60

7. Application to other Distribution Facilities
The analysis above is useful for Amazon in determining what strategic direction may be
best for inbound operational improvements at the FC. It is interesting to consider how
applicable this analysis is for other distribution facilities within other firms. For nodes in
a distribution network facing a similar situation as Amazon, work scheduling may be a
good solution. The key characteristics which drive to this solution are:
" Large variability of inbound arrivals
" High labor content for receiving operations
" Inbound processing which has significant and measurable impact upon outbound
customer service
Below is a discussion of the generalization of the findings from this research. There are
many different dimensions for firms to consider when looking at ways of improving
inbound logistics to the DC. These dimensions are discussed in a generalized form to
help others consider how to approach the challenges of inbound.
7.1. Dimensions for consideration
Firm Strategy. Amazon considers operations a key advantage in their customer
interaction. The service of the fulfillment center directly impacts the customer
experience. This is a key strategic competitive advantage for Amazon. And since
inbound logistics and processing at the FC has direct impact on the customer experience
it is critical for Amazon to address this.
The importance of focusing on inbound partly depends upon the strategy of the firm and
how integral distribution operations are to the firm strategy. For a manufacturer doing its
own distribution, DC operations may not be the key strategic advantage (and in this case
the firm may want to consider a 3-PL which may consider some of these inbound
operations improvements). For manufacturers or other firms there may also be more
opportunity to drop ship or other options for meeting certain customer service
requirements.
61

Customer impact of inbound. In some distribution networks, nearly all inbound
inventory is stock-up. Depending upon the procurement policies, in theory there should
be relatively little product arriving which is very high priority. This means that there is
much less customer impact from improving inbound operations. The product is almost
always already in inventory and better cycle time or scheduling would have little impact
upon this.
Inventory holding costs. The primary driver for Amazon is not inventory holding costs,
but the customer service. For industries distributing high-value products this may be
different. The advantages of processing inbound material more quickly may have an
impact upon inventory turns and this may be a larger driver than the customer experience.
This may push the DC towards reducing cycle times for all inbound items.
Inbound Variability. The amount and nature of variability in the inbound system is a
determinant of the value of improvement. For systems with large swings in product
arrival, having a prioritization mechanism (or labor flexibility) is important. For facilities
distributing product with consistent demand and small amounts of variability in labor
required to receive, this may not be as important to the operation. Implementing a
prioritization scheme may not provide much impact on the system.
Other Options. There may be other practical solutions for different distribution systems.
For example, focusing on cross-docking may be a better customer and company benefit
than the solutions discussed here. This depends upon the nature of the network and what
is being distributed.
7.2. Considerations for Flexible Labor versus Work Scheduling
If a firm faces inbound characteristics similar to Amazon, then inbound improvements at
the FC may provide significant opportunity. A flexible labor force and work scheduling
are two primary solutions which the firm should consider - including combinations of the
62

two. There are key dimensions which would drive the distribution center towards one or
the other of these solutions, which are described below.
Distribution of priority of inbound items. A wide distribution of priority would
suggest a work prioritization scheme. If all items arriving at the facility are roughly the
same priority then there is little benefit from scheduling. This is an additional operational
process with small benefit. On the other hand, if some items are arriving and need to be
received within minutes or hours in order to meet customer requirement, then there is
significant benefit from scheduling these items.
Ability to sort. In some cases it is nearly impossible to physically sort through inbound
items to determine which items are high priority. In this case it is more reasonable to
process all items rather than expend the labor to find the high priority items. With a high
cost to sort, flex labor may be the more attractive solution.
Availability of upstream information. Scheduling cannot be done without some degree
of upstream information. As pointed out earlier in this paper, information may not be
complete for all items all of the time, but must at least cover a good portion of the
material arriving at the DC. It especially must cover low priority items and high priority
items in order for scheduling to be effective. Without a certain degree of information,
scheduling is not an option.
Amount of Variability. If the inbound variability is relatively low, then flex labor is a
more feasible solution. On the other hand, with very high variability and high labor
content, flex labor quickly becomes too impractical. In these cases, work scheduling may
be the only efficient solution.
Below is a summary of the considerations which push towards flex labor or work
scheduling. For a given distribution center, the optimal solution lies somewhere along
this continuum.
63

Figure 10: Generalization of Flexible Workforce vs. Work Scheduling
Solution Selection
Flexible Labor Force
" Narrow priority distribution of arrivals
" Less upstream information
* Sorting is difficult
* Lower Variability
Work Scheduling
* Wide priority distribution of arrivals
* More upstream information
* Sorting is easier
* Higher Variability
64

8. Conclusions
Much emphasis at Amazon and other companies has been placed on the outbound side of
the distribution center. Outbound is clearly important since it has the most direct impact
upon the customer experience. However, as distribution systems run leaner and more
like cross-dock operations, inbound processing can have significant impact upon
customer service.
It is important for inbound processing to begin to measure itself against the same
customer metrics that the outbound systems do. This can be challenging when the
inbound and outbound order cycles are largely separate. Traditionally, IT systems for
managing customer orders are separate from the systems managing supplier orders and
inbound transportation. Customer metrics are also typically measured only on the
outbound cycle. In order best drive the right behavior for inbound processes, customer
service metrics should be developed on the inbound side as well. The same cost and
service trade-offs that apply to outbound should be used for inbound as well. This will
coordinate both parts of the organization by using the same goal.
In the future, RFID and other technologies may enable better inbound data. However,
Amazon still needs to electronically integrate with vendors and transportation providers
to receive this data ahead of time. As seen with bar-codes, making it easier to collect the
data does not mean that it is done or that it is exchanged easily between organizations.
Simply putting an RFID tag on items will not solve many of the challenges of managing
inbound operations. RFID may increase inbound productivity rates, which will be very
beneficial, but this will not solve the challenges of meeting customer service.
Additionally, RFID adoption will start with high value items and work its way down to
lower value items, such as books. It is unlikely that Amazon will have high-quality
visibility to all inbound items anytime soon, whether enabled by RFID or other means.
This research has explored using flexible labor and inbound work prioritization in order
to better meet customer service. The analysis has shown that inbound prioritization is the
65

best way to proceed for Amazon and that significant benefit can be achieved by focusing
on scheduling trucks. Scheduling of trucks can theoretically lower missed expected
customer ship dates while incurring a minimum cost. Trucks can be relatively easily
"sorted" through the appointment and drop trailer process. In the longer-term palette
level sorting should also be investigated.
In order to achieve the benefits of truck prioritization, Amazon must continue to push for
additional upstream visibility. This information should focus on getting visibility about
what is "low priority" as well as what is high priority. While this is counter-intuitive,
there are significant benefits to knowing when a truckload arrives that has items, which if
pushed off for a couple of days will not impact any customers. This allows the truck to
be used as filler work when arrivals are slow, or to be pushed off when more important
items need priority. Having both this scheduling flexibility and the information of what
is on this truck is very valuable.
The optimal inbound solution will likely include a combination of some labor force
flexibility along with inbound scheduling. It is well worth having some flexibility in
order to process high priority items through inbound. Further analysis should be done to
measure the variability of high-priority items arriving and what labor flexibility is needed
to accommodate this. Information systems should also be developed to help managers
see the priority of items arriving and to make good scheduling decisions.
66

9. References
Aberdeen Group, 2004. RFID in the Consumer Industries, Being a Winner not aFollower. March 2004.
Abraham, K., 1986. Flexible staffing arrangements. In: Hart, R.A. (Ed.), Employment,Unemployment and Labor Utilization. Unwin Hyman Inc., USA, pp. 288-312.
Bard, Jonathan F., 2004. Staff Scheduling in High Volume Service Facilities withDowngrading. IIE Transactions (2004) 36, pp 985-997
Bartholdi, John J. III, Steven T. Hackman, 2003. Warehouse and Distribution Science;Release 0.30; http://www.warehouse-science.com. May 22, 1998; revised March 23,2003.
Berman, 0., Larson, R.C., 1994. Determining optimal pool size of a temporary call-inwork force. European Journal of Operational Research 1 (73), 55-64.
Cayirli, Tugba, Emre Veral, 2003. Outpatient Scheduling in Health Care: A Review ofLiterature. Production and Operations Management; Winter 2003; 12, 4; ABI/INFORMGlobal pg. 519.
Gumus, Mehmet, 2004. Cross-docking and its implications in location distributionsystems. Journal ofBusiness Logistics, Vol. 25, No. 2, 2004 pg. 199.
Kreipl, Stephan, Michael Pinedo, 2004. Planning and Scheduling in Supply Chains: AnOverview of Issues in Practice. Production and Operations Management. Spring 2004;13, 1; ABI/INFORM Global pg. 77
Krishnamurthy, Sandeep, 2002. Case #1 - Amazon.com - A Business History. Toappear in E-commerce Management: Texts and Cases.http://www.swcollege.com/marketing/krishnamurthy/first edition/case updates/amazonfinal.pdf
Legato, Pasquale, M. Flavia Monaco, 2004. Human Resources Management at a MarineContainer Terminal. European Journal of Operations Research; 156 (2004) pp. 769-781.
Mahmoodi, Farzad, G. E. Martin, 1994. Optimal Supplier Delivery Scheduling to JITBuyers. Logistics and Transportation Review; Dec. 1994; 30, 4; ABI/INFORM Globalpg. 353
Maruyama, Kaz, Mike Nolan, David Jackson 2004. Applying Innovation andEntrepreneurship Frameworks to the RFID Industry and Selected Ventors. Workingpaper for MIT Sloan class 15.351 taught by Professor Michael Cusumano.
67
Milner, Joseph M., Edieal Pinker, 2001. Contingent Labor Contracting Under Demandand Supply Uncertainty. Management Science. Aug 2001: 47, 8, pg 1046
Mondschein, Susana V, Gabriel Y Weintraub, 2003. Appointment Policies in ServiceIndustries: A Critical Analysis of the Economic Framework. Production and OperationsManagement; Summer 2003; 12, 2; ABI/INFORM Global pg. 266
Nahmias, Steven. Production and Operations Analysis. 2nd ed. Irwin 1993.
Pinker, Edieal J, Richard C. Larson, 2003. Optimizing the Use of Contingent Laborwhen Demand is Uncertain. European Journal of Operations Research; 144 (2003) pp.39-55
Portugal, Victor, David J. Robb, 2000. Production Scheduling Theory: Just Where Is ItApplicable? Interfaces. 30:6 November-December 2000 pp. 64-76
Roberti, Mark, 2004. Tag Cost and ROI RFID Journal, Feb 16, 2004http://www.rfidjoumal.com/article/articleview/796/l/2/Thompson, Gary M., 1997. Labor Staffing and Scheduling Models for ControllingService Levels. Naval Research Logistics, Vol 44 (1997): pp. 719-740
68