managing globaltransitions - fakulteta management · dhirajsharma 29 technology,...
TRANSCRIPT


Managing Global TransitionsInternational Research Journal
editor
Mitja Ruzzier, University of Primorska,Slovenia
associate editors
Boštjan Antoncic, University of Primorska,Slovenia
Roberto Biloslavo, University of Primorska,Slovenia
Štefan Bojnec, University of Primorska,Slovenia
Evan Douglas, Sunshine State University,Australia
Robert D. Hisrich, Thunderbird School ofGlobal Management, usa
Anita Trnavcevic, University of Primorska,Slovenia
Zvone Vodovnik, University of Primorska,Slovenia
editorial board
Zoran Avramovic, University of Novi Sad,Serbia
Terrice Bassler Koga, Open Society Institute,Slovenia
Cene Bavec, University of Primorska, SloveniaJani Beko, University of Maribor, SloveniaAndrej Bertoncelj, University of Primorska,
SloveniaHeri Bezic, University of Rijeka, CroatiaVito Bobek, University of Maribor, SloveniaBranko Bucar, Pace University, usa
Suzanne Catana, State University of New York,Plattsburgh, usa
David L. Deeds, University of Texas at Dallas,usa
Jeffrey Ford, The Ohio State University, usa
Ajda Fošner, University of Primorska, SloveniaWilliam C. Gartner, University of Minnesota,
usa
Tim Goddard, University of Prince EdwardIsland, Canada
Noel Gough, La Trobe University, AustraliaAndrás Inotai, Hungarian Academy
of Sciences, HungaryMuhammad Ishtiaq Ishaq, Global Institute
Lahore, PakistanHun Joon Park, Yonsei University, South KoreaŠtefan Kajzer, University of Maribor, Slovenia
Jaroslav Kalous, Charles University,Czech Republic
Maja Konecnik, University of Ljubljana,Slovenia
Leonard H. Lynn, Case Western ReserveUniversity, usa
Monty Lynn, Abilene Christian University, usa
Neva Maher, Ministry of Labour, Family andSocial Affairs, Slovenia
Massimiliano Marzo, University of Bologna,Italy
Luigi Menghini, University of Trieste, ItalyMarjana Merkac, Faculty of Commercial
and Business Sciences, SloveniaKevin O’Neill, State University of New York,
Plattsburgh, usa
David Oldroyd, Independent Educational Ma-nagement Development Consultant, Poland
Susan Printy, Michigan State University, usa
Jim Ryan, University of Toronto, CanadaHazbo Skoko, Charles Sturt University,
AustraliaDavid Starr-Glass, State University of New
York, usa
Ian Stronach, Manchester MetropolitanUniversity, uk
Ciaran Sugrue, University of Cambridge, uk
Zlatko Šabic, University of Ljubljana, SloveniaMitja I. Tavcar, University of Primorska,
SloveniaNada Trunk Širca, University of Primorska,
SloveniaIrena Vida, University of Ljubljana, SloveniaManfred Weiss, Johan Wolfgang Goethe
University, GermanyMin-Bong Yoo, Sungkyunkwan University,
South KoreaPavel Zgaga, University of Ljubljana, Slovenia
editorial office
University of PrimorskaFaculty of Management KoperCankarjeva 5, si-6104 Koper, SloveniaPhone: ++386 (0) 5 610 2021
E-mail: [email protected]
Managing Editor: Alen JežovnikEditorial Assistant: Tina AndrejašicCopy Editor: Alan McConnell-DuffCover Design: Studio Marketing jwt
Text Design and Typesetting: Alen Ježovnik

Managing Global TransitionsInternational Research Journal
volume 10 · number 1 · spring 2012 · issn 1854-6935
Table of Contents
3 Does Technology Lead to Better Financial Performance?A Study of Indian Commercial Banks
Dhiraj Sharma
29 Technology, Wealth and Modern Management of Technology
Slavko DolinšekPeter Štrukelj
51 Competitiveness of Frontier Regions and TourismDestination Management
Ksenija Vodeb
69 Human Capital Constraints in South Africa:A Firm-Level Analysis
Ewert P. J. KleynhansJohannes Riaan Labuschagne
87 Corporate Leverage and Financial Decisionin the Indian Textile Industry
Ramachandran AzhagaiahSelvaraj Sathia
115 Abstracts in Slovene


Does Technology Lead to Better FinancialPerformance? A Study of Indian
Commercial Banks
Dhiraj Sharma
It has been a matter of debate whether Technology provides better fi-nancial results and improves productivity. The present paper attemptsto study the inter-group comparison of financial performance of Indianbanks by classifying the banks on the basis of usage of Technology. Fur-ther, for the purpose of temporal comparison, the period for the studyhas been divided into two parts, i. e. low technology induction periodand high technology induction period. Findings of the paper show thatthe fully it oriented banks are financially better off than the partiallyit oriented banks. Moreover, the performance of almost all the banksunder study has tremendously improved in the high technology induc-tion period. However, for the Indian banking industry, the correlationbetween Technology induction and financial productivity is negativethough statistically insignificant and low.
Key Words: it productivity paradox, information technology, financialperformance, indian banks, spread and burden ratios
jel Classification: o33, g21, m15
Introduction
For decades, it has been a matter of debate whether Technology/Infor-mation Technology (it) provides better financial results. To date thereis no conclusive evidence that spending on it improves financial perfor-mance. The scholars call it the ‘it Productivity Paradox.’ The term ‘para-dox’ indicates a negative correlation between it investments and produc-tivity. Morrison and Berndt (1990) found that additional it investmentscontributed negatively to financial productivity. They concluded that theestimated marginal benefits of investment in it are less than the esti-mated marginal costs. On similar lines, studies by Strassman (1990) andDos Santos, Peffers and Mauer (1993) have also concluded that there is aninsignificant correlation between it spending and profitability measures,which means it spending is unproductive.
Dr Dhiraj Sharma is an Assistant Professor at the School ofManagement Studies, Punjabi University, India.
Managing Global Transitions 10 (1): 3–28
4 Dhiraj Sharma
There are, on the other hand, studies which show that there is nocorrelation between it investment and financial productivity (Loveman1994; Barua et al. 1991). Jordan and Katz (1999) found that even the mostsuccessful banks offering Internet banking were able to serve only a rel-atively small share of their customer base with it channels. Thus, it wasdifficult to determine whether Internet banking has a significant impacton bank performance. And there are studies which have found signifi-cant contributions from it toward financial growth (Lichtenberg 1995;Brynjolfsson and Hitt 1996). Most of these firm-level studies have beenrestricted to the manufacturing sector (that too, outside India), in largepart owing to lack of firm-level data from the service sector.
There are studies which have drawn on the statistical correlation be-tween it spending and profitability or stock value for their analyses andthey have concluded that the impact of it on productivity is positive((Brynjolfsson 1993; Wilson 1993). It is apparent that most of the stud-ies relating to the contribution of it towards productivity have been re-stricted to the manufacturing industry. The problem is particularly rele-vant to the banking industry, which is the focus of the present study. InIndia, there are not many studies that have focused on it contribution inthe banking sector. Mariappan (2006) found that the it revolution hasbrought stunning changes in the business environment. No other sectorhas been influenced by advances in technology as much as banking andfinance, as a result, the Indian banking has a totally new face today. Sim-ilarly, Kamakodi (2007) examines how computerization has influencedthe banking habits and preferences of Indian bank customers and whatfactors influence these preferences. He found that change of residence,salary account and non-availability of the technology based services werethe three main reasons for shifting to another bank. Further in the tech-nology direction, Patnaik (2004) found that shared atms are taking placeand they are mutually beneficial. This mushrooming new dimension ofshared atms has increased the non-interest income of the banks. This isthe most popular e-channel and widely used in all the bank groups. Pauland Mukherjee (2007) explained that cash management in atms is a newconcept which facilitates the banks to source cheaper funds and serve itsclients more efficiently.
Many studies have also highlighted the importance of customer sat-isfaction and the management of customer relations in the success ofbanking business (Singh 2004; Krishnaveni, Prabha and Divya 2006;Mishra and Jain 2007; Raveendra 2007; Sharma, Kaur and Sharma 2007;
Managing Global Transitions

Does Technology Lead to Better Financial Performance? 5
Sharma and Dhanda 2007; Singh and Kabirai 2007; Thakur 2007; Up-pal and Kaur 2007; Uppal 2008; Vanniarajan and Nathan 2008). Theprocess of economic liberalization and financial sector reforms has un-derlined the importance of customer-focus by the banks (Shanker 2004).The main bottlenecks to the superior services are the untrained humanresource and the lagging technology (Thakur 2007).
Yet, there have been a number of studies which have focused on thefinancial performance and efficiency of the banks in the recent past. Thestudies reveal that the profitability of Indian banks has increased sincethe second generation banking reforms and, among the several bankgroups, the foreign and private sector banks are performing well as com-pared to the public and nationalized banks in India (Sarkar, Sarkar andBhaumik 1998; Muniappan 2002; Sooden and Bali 2004; Aggarwal 2005;Arora and Verma 2005; Bhaskar 2005; Madhavankutty 2007; Uppal andKaur 2007; Kumar and Sreeramulu 2008).
Another significant area which has emerged recently and been ex-plored by the researchers is that of risk management in the banks. Mad-havankutty (2007) concludes that the banking system in India has at-tained enough maturity and is ready to address prudential managementpractices as comprehensively as possible. Similarly, Mohan (2003) high-lights the need for each bank to have in place the technical systems andmanagements processes necessary not only to identify the risks associ-ated with its activities, but also to effectively measure, monitor and con-trol npa (Non Performing Asset) levels. While operations, capital andrisk management, technological innovations and customer satisfactionwill be the drivers of growth, it is going to be the corporate governancewhich will lead Indian banking to match best business practices on theglobal level (Aggarwal 2007; Lal 2007). Padwal (2004) stresses the needof integrating business development planning with a clear it/is roadmap. Malhotra and Singh (2005) describe the key risks associated withthe adoption of banking technology. it allows the banking industry toestablish a direct link to the customers. Similarly, Habbar (2004) empha-sizes that managing technology is a key challenge for the Indian bankingindustry. Banks have enhanced their networks and communication in-frastructure to reap the full benefits of computerization. E-banking is fastcatching up. There is a great need for trust, privacy and confidentiality.Only sound corporate governance would lead to effective and meaning-ful banking (Lakhsmi Naraynan 2004). Narayanasami (2005) states thatIndian banking is in a better position with respect to technology, capital
Volume 10 · Number 1 · Spring 2012

6 Dhiraj Sharma
adequacy, credit management, risk bearing capacity, international com-petitiveness and contribution to the national economy. For global com-petition, Indian banks will have to gear up to meet stringent prudentialcapital adequacy norms under Basel i and ii accords (Subbaroo 2007).
objectives and scope of the study
The specific objective of the present paper is to study the inter-groupcomparison of the financial performance of Indian commercial banks byclassifying the banks on the basis of usage of Technology. The study of thefinancial performance of banks has been carried out from the year 1996
to the year 2008. The total time period for the study has been dividedinto two periods: Low Technology Induction Period and High Technol-ogy Induction Period. The period from the years 1997–1998 to 2000–2001has been taken as India’s Low-technology Era while the High-technologyEra is considered to have been be effectively started from 2001 afterwards.During the period 1996–1997 to 2000–2001, the technological applica-tions in the Indian banking sector were not very developed and mature.Moreover, new private sector banks started entering the Indian bankingindustry in a big way from the year 1996. The technological boost onlycame after the implementation of the it Act. The Indian governmentgave its assent to the Act in October 2000 but the Information Technol-ogy Act, which is a comprehensive legislation for it applications in thebusiness, became effective only after 2001. The Act has brought the struc-ture, legal validity and authenticity for transacting and making paymentsonline. Hence, the period after 2001 has been termed as the High Tech-nology Induction Period. Another reason for assuming such a period asthe High Technology Period is that in India e-banking services started infull-swing only from 2001 onwards.
research methodology
The financial performance of a bank can be measured in a number ofways. The Operational Profitability is the most widely used indicator tojudge the financial position of a business. For measuring the profitabil-ity of commercial banks, various banking and financial ratios have beencomputed. To measure the extent of a technology induction quantita-tively, technology index was formulated for each bank group. An averagefigure based on atms, Fully Computerised Branches, Internet BankingBranches, Mobile Banking Branches and Tele-banking Branches for eachbank for each year starting from 1996–1997 till 2007–2008 has been com-
Managing Global Transitions
Does Technology Lead to Better Financial Performance? 7
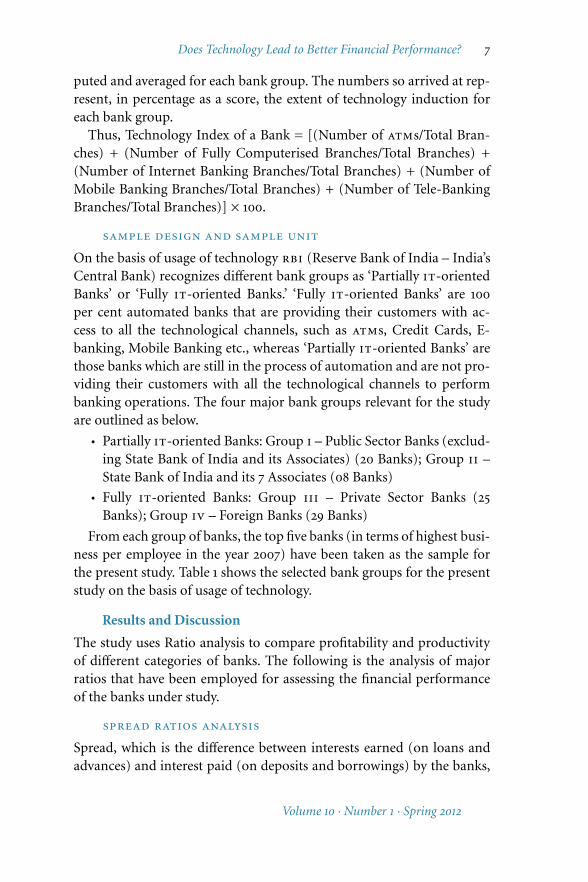
puted and averaged for each bank group. The numbers so arrived at rep-resent, in percentage as a score, the extent of technology induction foreach bank group.
Thus, Technology Index of a Bank = [(Number of atms/Total Bran-ches) + (Number of Fully Computerised Branches/Total Branches) +(Number of Internet Banking Branches/Total Branches) + (Number ofMobile Banking Branches/Total Branches) + (Number of Tele-BankingBranches/Total Branches)] × 100.
sample design and sample unit
On the basis of usage of technology rbi (Reserve Bank of India – India’sCentral Bank) recognizes different bank groups as ‘Partially it-orientedBanks’ or ‘Fully it-oriented Banks.’ ‘Fully it-oriented Banks’ are 100
per cent automated banks that are providing their customers with ac-cess to all the technological channels, such as atms, Credit Cards, E-banking, Mobile Banking etc., whereas ‘Partially it-oriented Banks’ arethose banks which are still in the process of automation and are not pro-viding their customers with all the technological channels to performbanking operations. The four major bank groups relevant for the studyare outlined as below.
• Partially it-oriented Banks: Group i – Public Sector Banks (exclud-ing State Bank of India and its Associates) (20 Banks); Group ii –State Bank of India and its 7 Associates (08 Banks)
• Fully it-oriented Banks: Group iii – Private Sector Banks (25Banks); Group iv – Foreign Banks (29 Banks)
From each group of banks, the top five banks (in terms of highest busi-ness per employee in the year 2007) have been taken as the sample forthe present study. Table 1 shows the selected bank groups for the presentstudy on the basis of usage of technology.
Results and Discussion
The study uses Ratio analysis to compare profitability and productivityof different categories of banks. The following is the analysis of majorratios that have been employed for assessing the financial performanceof the banks under study.
spread ratios analysis
Spread, which is the difference between interests earned (on loans andadvances) and interest paid (on deposits and borrowings) by the banks,
Volume 10 · Number 1 · Spring 2012

8 Dhiraj Sharma
table 1 Selected Bank Groups on the basis of usage of technology
Partially it-oriented Banks Fully it-oriented Banks
Group i
Public Sector BanksGroup ii
State Bank of Indiaand Associates
Group iii
Private Sector BanksGroup iv
Foreign Banks
Punjab National-Bank (pnb)
State Bank of India(sbi)
hdfc Bank Standard CharteredBank
Canara Bank (cb) State Bank of Hy-derabad (sboh)
icici Bank Citi Bank
Bank of India (boi) State Bank of Patiala(sbop)
uti Bank (NowAxis Bank )
hsbc Bank
Union Bank ofIndia (ubi)
State Bank of Tra-vancore (sbot)
Jammu & KashmirBank
abn Amro Bank
Bank of Baroda(bob)
State Bank ofBikaner & Jaipur(sbobj)
Federal Bank Deutsche Bank
plays a major role in determining the operational profitability of banks.Table 2 reveals the Spread Ratios of the Indian Commercial Banks. In-terest rates in Indian banking sector has declined from the low to hightechnology period.
Thus, the spread of banks have declined because of lower interest ratesin the recent years. In the low-technology era, the maximum average in-terest earned as a percentage of average assets was 9.74% in the case ofGroup iv banks, and in the high-technology era, the maximum averageinterest earned as a percentage of average assets was 7.62% in the case ofGroup ii banks.
In the low technology era, the maximum average spread as a percent-age of average assets was 3.43% in the case of Group iv (foreign) banks,and in the high-technology era the maximum average spread as a per-centage of average assets was 3.34% again in the case of Group iv banks.Overall, the t-test exhibits insignificant difference in the means of thetwo periods for the Indian banking industry.
burden ratios analysis
Burden is defined as the difference between non-interest expenditure andnon-interest income of the banks. Burden is usually taken in the negativesense since non-interest expenses tend to exceed non-interest income inthe banking industry.
Managing Global Transitions

Does Technology Lead to Better Financial Performance? 9
table 2 Spread Ratios of Indian commercial banks
Group Average Spread Ratios
ie%aas ip%aas s%aas
Group i X1 9.24 6.36 2.87
X2 7.30 4.44 2.85
Mean Gap 1.94 1.92 0.02
se 0.80 0.75 0.19
t-value 3.89 4.09 0.13
los ** ** —
Group ii X1 8.90 6.01 2.91
X2 7.62 4.59 3.04
Mean Gap 1.28 1.41 0.13
se 0.58 0.68 0.28
t-value 3.50 3.30 0.72
los ** ** —
Continued on the next page
Table 3 reveals the Burden Ratios of Indian Commercial Banks. Likethe Spread, the average burden has also decreased from 2.14% to 1.81 %for the Indian banking industry. In the low-technology era, the maxi-mum Burden as a % of Average Total Assets was 2.80% in the case ofGroup iv banks, and the minimum average Burden as a% of AverageAssets was 0.99% in the case of Group iii banks. In the high-technologyera, the maximum Burden as a Percentage of Average Assets was 2.18%in the case of Group ii banks, and the minimum Burden as a Percent-age of Average Assets was 1.06% in the case of Group iii banks. Thereis a decline in the Burden as a Percentage of Average Assets of Indianbanks, which is a positive sign. Overall, the t-test exhibits significant dif-ference in the means of the two periods at 1 % los for the Indian bankingindustry.
profitability ratios analysis
Profitability ratios measure the bank’s use of its assets and control ofits expenses to generate an acceptable rate of return. In other words,profitability ratios reveal the operational profitability of the banks understudy. As per table 4, the profits of Indian banks have increased signifi-cantly from the low technology era to the high technology era.
Volume 10 · Number 1 · Spring 2012

10 Dhiraj Sharma
table 2 Continued from the previous page
Group Average Spread Ratios
ie%aas ip%aas s%aas
Group iii X1 8.69 6.59 2.08
X2 6.25 4.12 2.11
Mean Gap 2.44 2.47 0.03
se 1.09 1.04 0.49
t-value 3.58 3.77 0.09
los ** ** —
Group iv X1 9.74 6.31 3.43
X2 6.69 3.34 3.34
Mean Gap 3.05 2.97 0.09
se 1.00 1.11 0.54
t-value 4.88 4.27 0.27
los ** ** —
Banking Industry Average X1 9.14 6.31 2.83
X2 6.96 4.12 2.81
Mean Gap 2.17 2.19 0.02
se 0.71 0.75 0.11
t-value 4.40 4.03 0.77
los ** ** —
notes ie%aas – Interest Earned as percent of Average Assets, ip%aas – Interest Paidas percent of Average Assets, s%aas – Spread as percent of Average Assets, X1 – Averagein Low-technology induction period, X2 – Average in High-technology induction pe-riod, se – Standard Error, los – Level of Significance; * mean is significant at the 0.05level, ** mean is significant at the 0.01 level. Computed from the data published by Per-formance Highlights of Indian Banks, Indian Bank Association, 1996–2008.
The t-test exhibits significant difference in the means of two periodsat 1 % los for the Indian banking industry. When we compare profits toaverage assets, the winners again are Foreign banks. The analysis of Av-erage Profitability Gap among various bank groups indicates that thereis little change in Group i to Group iii banks, but there is a huge changein Group iv banks (Foreign Banks).
Technology and Financial Performance
This section highlights the impact of technology and its various channelson banks’ performance and productivity.
Managing Global Transitions

Does Technology Lead to Better Financial Performance? 11
table 3 Burden Ratios of Indian commercial banks
Group Average Burden Ratios
nie%aas nii%aas b%aas
Group i X1 3.55 1.07 2.48
X2 3.24 1.25 1.99
Mean Gap 0.31 0.18 0.49
se 0.41 0.39 0.15
t-value 1.22 0.73 5.28
los — — **
Group ii X1 3.68 1.37 2.31
X2 3.58 1.40 2.18
Mean Gap 0.10 0.03 0.13
se 0.20 0.32 0.35
t-value 0.80 0.14 0.60
los — — —
Continued on the next page
fully computerized branches as a percentage
of total branches
The ratio of computerized branches as a Percentage of total branchesin the new private sector and foreign banks is 100 % in both the Low-technology induction period and the High-technology induction period(table 5).
But this ratio was lowest in the case of Group i banks in the low tech-nology era, i. e. 18.16%; however this ratio increased to 81.42% on an av-erage at the end of the high technology period. In the case of sbi groupbanks this ratio increased to 97.14% from 76.75% average in the Low-technology induction period. In the high-technology induction periodthis ratio is more consistent in Group ii banks (where cv is only 2.67 %).
atms as a percentage of total branches
atm is the most popular e-channel and the maximum bank customersuse this e-channel. The ratio of atms as a Percentage of Total Branchesincreased very sharply in all the bank groups in the high-technology in-duction period (table 6). In the high-technology induction period thisratio is more consistent in Group i banks (where cv is only 11.90 %).However, the maximum rise is observed in Group iv banks and similar
Volume 10 · Number 1 · Spring 2012

12 Dhiraj Sharma
table 3 Continued from the previous page
Group Average Burden Ratios
nie%aas nii%aas b%aas
Group iii X1 2.71 1.73 0.99
X2 2.92 1.86 1.06
Mean Gap 0.21 0.13 0.07
se 0.42 0.43 0.26
t-value 0.78 0.50 0.45
los — — —
Group iv X1 5.39 2.59 2.80
X2 4.79 2.77 2.02
Mean Gap 0.60 0.18 0.79
se 0.35 0.21 0.22
t-value 2.72 1.34 5.69
los * — **
Banking Industry Average X1 3.83 1.69 2.14
X2 3.63 1.82 1.81
Mean Gap 0.20 0.13 0.33
se 0.16 0.23 0.11
t-value 1.73 1.27 4.95
los — — **
notes nie%aas – Non-Interest Expenditure as percent of Average Assets, nii%aas– Non-Interest Income as percent of Average Assets, b%aas – Burden as percent of Av-erage Assets, X1 – Average in Low-technology induction period, X2 – Average in High-technology induction period, se – Standard Error, los Level of Significance; * mean issignificant at the 0.05 level, ** mean is significant at the 0.01 level. Computed from thedata published by Performance Highlights of Indian Banks, Indian Bank Association,1996–2008.
is the case of Group iii banks. Overall, in the Indian Banking Industry,this ratio has increased from average 44.82% in the low-technology in-duction period to 82.63 % in the High-technology induction period.
internet banking branches as a percentage
of total branches
In India, after atms, Internet banking is the biggest and most populartechnological channel for banking operations. This ratio represents theextent of branches providing internet banking services.
Table 7 shows that Group iii banks have an average of 36.64 pc against
Managing Global Transitions

Does Technology Lead to Better Financial Performance? 13
table 4 Profitability Ratios of Indian commercial banks
Group Average Profitability Ratios
np%ti np%td np%aas
Group i X1 3.75 0.44 0.39
X2 10.21 1.01 0.86
Mean Gap 6.46 0.57 0.48
se 1.49 0.16 0.14
t-value 6.93 5.67 5.29
los ** ** **
Group ii X1 5.86 0.77 0.60
X2 9.50 1.00 0.86
Mean Gap 3.64 0.24 0.26
se 1.29 0.16 0.12
t-value 4.50 2.39 3.41
los ** * **
Continued on the next page
industry’s meager 3.31 pc, 12 times lesser in the low-technology induc-tion period having numerous variations. In the High-technology in-duction period also, bank groups have gained this ratio to a great ex-tent, and Group iii banks have the highest 74.68 pc average, whereasindustry records just 14.87 pc average. Quite clearly, partially it-orientedbanks have the biggest distance from fully it-oriented banks, nearly 6
to 7 times, which is noteworthy. The huge gap confirms an impressivegrowth in internet banking all through the high-technology inductionperiod, where Group iii banks tops with 38.09 pc expansion and Groupiv follows. Although partially it-oriented banks witness an 11 to 15 pcgrowth, this is still not enough, since fully it-oriented banks are 6 to 7
times ahead of these banks and this gap is quite high. Overall, the high-technology induction period has lesser variations and is more stable sta-tistically.
mobile banking branches as a percentage
of total branches
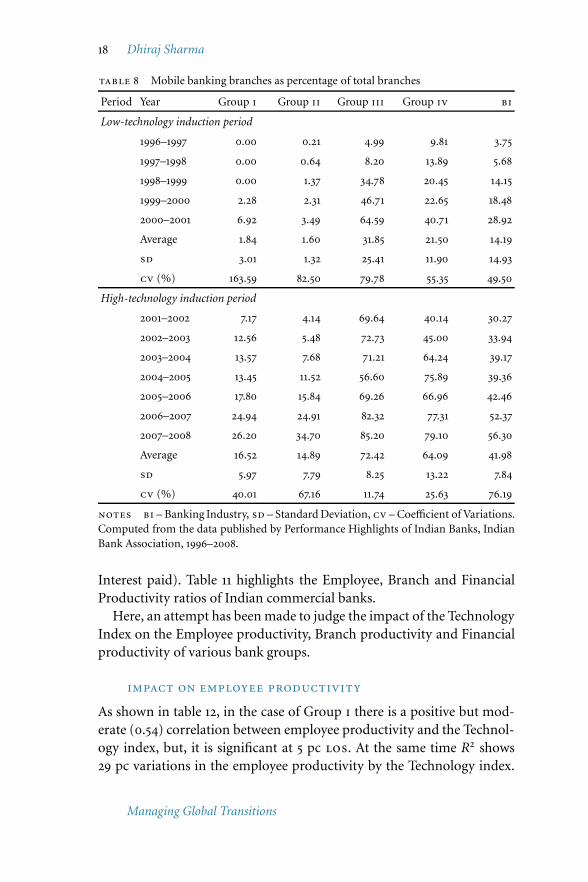
In India, Mobile banking – also known as sms Banking – is used mainlyfor balance checking, billing and other account related information bythe customers. Table 8 clearly reveals that Group iii banks are far aheadof other bank groups in terms of Mobile banking branches in both the
Volume 10 · Number 1 · Spring 2012

14 Dhiraj Sharma
table 4 Continued from the previous page
Group Average Profitability Ratios
np%ti np%td np%aas
Group iii X1 10.48 1.46 0.64
X2 13.00 1.52 0.78
Mean Gap 2.52 0.06 0.14
se 3.41 0.44 0.31
t-value 1.18 0.22 0.71
los — — —
Group iv X1 4.60 1.00 0.62
X2 14.46 2.37 1.32
Mean Gap 9.86 1.36 0.70
se 6.56 1.17 0.68
t-value 2.40 1.87 1.63
los * — —
Banking Industry Average X1 6.17 0.91 0.56
X2 11.79 1.47 0.95
Mean Gap 5.62 0.56 0.39
se 1.72 0.25 0.17
t-value 4.31 2.84 2.79
los ** * *
notes np%ti – Net Profit as percent of Total Income, np%td – Net Profit as percentof Total Deposits, np%aas – Net Profit as percent of Average Assets, X1 – Average inLow-technology induction period, X2 – Average in High-technology induction period,se – Standard Error, los Level of Significance; * mean is significant at the 0.05 level,** mean is significant at the 0.01 level. Computed from the data published by Perfor-mance Highlights of Indian Banks, Indian Bank Association, 1996–2008.
low and the high technology induction period. The high technology in-duction period shows improvement in the case of all bank groups, wherethe winners are fully it oriented banks (Group iii and Group iv banks).The growth is also statistically consistent and steadier in the case of fullyit oriented banks.
tele-banking branches as a percentage
of total branches
Tele-banking provides the access to limited banking operations throughtelephone. Table 9 reveals that the average share of tele-banking branches
Managing Global Transitions

Does Technology Lead to Better Financial Performance? 15
table 5 Fully computerized branches as a percentage of total branches
Period Year Group i Group ii Group iii Group iv bi
Low-technology induction period
1996–1997 5.50 18.90 100.00 100.00 56.10
1997–1998 9.91 36.12 100.00 100.00 61.50
1998–1999 13.12 87.91 100.00 100.00 75.25
1999–2000 16.82 90.67 100.00 100.00 76.87
2000–2001 32.82 92.30 100.00 100.00 81.28
Average 18.16 76.75 100.00 100.00 73.72
sd 10.16 27.14 0.00 0.00 8.53
cv 55.94 35.36 0.00 0.00 11.57
High-technology induction period
2001–2002 63.23 93.25 100.00 100.00 89.12
2002–2003 74.72 94.27 100.00 100.00 92.24
2003–2004 88.13 96.92 100.00 100.00 96.26
2004–2005 92.24 98.11 100.00 100.00 97.58
2005–2006 92.12 100.00 100.00 100.00 98.03
2006–2007 97.74 100.00 100.00 100.00 99.43
2007–2008 81.42 97.43 100.00 100.00 94.71
Average 84.22 97.14 100.00 100.00 95.34
sd 11.99 2.60 0.00 0.00 3.61
cv 14.23 2.67 0.00 0.00 3.78
notes bi – Banking Industry, sd – Standard Deviation, cv – Coefficient of Variations.Computed from the data published by Performance Highlights of Indian Banks, IndianBank Association, 1996–2008.
as a percentage of total branches is more than that of fully it-orientedbanks in both the low and high technology induction periods. The coef-ficient of variations (cv) is also less in the case of fully it-oriented banksin both the low and high technology induction periods, which denotessteadier growth.
technology index
The values as given in table 10 represent in percentage the extent oftechnology induction for each bank group. The it index provides interms of a score or a number the usage of technological channels suchas atms, Mobile banking, Tele banking and Internet banking by various
Volume 10 · Number 1 · Spring 2012

16 Dhiraj Sharma
table 6 atms as a percentage of total branches
Period Year Group i Group ii Group iii Group iv bi
Low-technology induction period
1996–1997 2.20 2.80 25.00 41.74 17.93
1997–1998 4.65 4.98 40.33 79.12 32.27
1998–1999 14.19 6.91 84.29 83.52 47.22
1999–2000 21.22 9.15 64.13 99.41 48.47
2000–2001 22.90 10.75 42.35 129.49 51.37
Average 15.74 7.94 57.75 97.88 44.82
sd 8.30 2.52 20.70 22.80 8.55
cv 52.73 31.73 35.84 23.29 19.07
High-technology induction period
2001–2002 35.11 12.41 52.19 117.24 54.23
2002–2003 36.52 14.28 51.65 175.64 69.52
2003–2004 37.45 15.25 82.15 274.13 102.24
2004–2005 40.01 20.45 88.35 170.31 79.78
2005–2006 46.88 26.65 85.66 199.10 89.57
2006–2007 47.21 28.90 80.33 231.27 96.92
2007–2008 40.92 20.77 72.65 210.21 86.13
Average 40.58 19.81 73.28 196.84 82.63
sd 4.83 6.28 15.39 49.72 16.51
cv 11.90 31.70 21.00 25.25 19.98
notes bi – Banking Industry, sd – Standard Deviation, cv – Coefficient of Variations.Computed from the data published by Performance Highlights of Indian Banks, IndianBank Association, 1996–2008.
bank groups. In the Technology index the maximum score is obtained byGroup iii (Fully it oriented banks) banks in the Low-technology induc-tion period, and in the High-technology induction period the highestTechnology Index goes to foreign banks. The lowest technology index, inboth the periods, is of partially it oriented banks (Group i and Group ii
banks).
Impact of Technology Index on Banks’ Productivity
Productivity is a ratio of input and output. A bank’s productivity is basedon employees’, branch and financial productivity. Employee productivityis an important part of total productivity, which comprises per employee
Managing Global Transitions

Does Technology Lead to Better Financial Performance? 17
table 7 Internet banking branches as percentage of total branches
Period Year Group i Group ii Group iii Group iv bi
Low-technology induction period
2001–2002 7.90 8.14 72.98 45.58 7.58
2002–2003 15.09 15.62 80.81 47.22 8.59
2003–2004 16.11 16.47 77.90 51.94 9.82
2004–2005 17.38 17.99 62.88 70.01 12.37
2005–2006 20.74 18.39 74.23 77.37 14.81
2006–2007 23.70 25.27 79.25 80.54 36.07
2007–2008 25.07 39.40 82.45 84.10 57.75
Average 17.99 20.18 75.78 62.25 44.05
sd 5.75 6.15 6.50 13.27 10.71
cv (%) 33.82 45.66 8.70 25.14 72.02
High-technology induction period
2001–2002 35.11 12.41 52.19 117.24 54.23
2002–2003 36.52 14.28 51.65 175.64 69.52
2003–2004 37.45 15.25 82.15 274.13 102.24
2004–2005 40.01 20.45 88.35 170.31 79.78
2005–2006 46.88 26.65 85.66 199.10 89.57
2006–2007 47.21 28.90 80.33 231.27 96.92
2007–2008 40.92 20.77 72.65 210.21 86.13
Average 40.58 19.81 73.28 196.84 82.63
sd 4.83 6.28 15.39 49.72 16.51
cv 11.90 31.70 21.00 25.25 19.98
notes bi – Banking Industry, sd – Standard Deviation, cv – Coefficient of Variations.Computed from the data published by Performance Highlights of Indian Banks, IndianBank Association, 1996–2008.
productivity means units of production by an individual in terms of de-posits and credits. A Bank Employee’s productivity will be judged fromBusiness per Employee. [Business per Employee = (Deposits per Em-ployee + Credit per Employee)] and a bank branch’s productivity canbe calculated through Business per Branch. [Business per Branch = (De-posits per Branch + Credit per Branch)]. Branch productivity, a crucialfactor of total productivity, evaluates branch level productivity meansproportionate production of the bank’s per branch deposits and cred-its. Financial Productivity is depicted by the Spread (Interest earned less
Volume 10 · Number 1 · Spring 2012
18 Dhiraj Sharma
table 8 Mobile banking branches as percentage of total branches
Period Year Group i Group ii Group iii Group iv bi
Low-technology induction period
1996–1997 0.00 0.21 4.99 9.81 3.75
1997–1998 0.00 0.64 8.20 13.89 5.68
1998–1999 0.00 1.37 34.78 20.45 14.15
1999–2000 2.28 2.31 46.71 22.65 18.48
2000–2001 6.92 3.49 64.59 40.71 28.92
Average 1.84 1.60 31.85 21.50 14.19
sd 3.01 1.32 25.41 11.90 14.93
cv (%) 163.59 82.50 79.78 55.35 49.50
High-technology induction period
2001–2002 7.17 4.14 69.64 40.14 30.27
2002–2003 12.56 5.48 72.73 45.00 33.94
2003–2004 13.57 7.68 71.21 64.24 39.17
2004–2005 13.45 11.52 56.60 75.89 39.36
2005–2006 17.80 15.84 69.26 66.96 42.46
2006–2007 24.94 24.91 82.32 77.31 52.37
2007–2008 26.20 34.70 85.20 79.10 56.30
Average 16.52 14.89 72.42 64.09 41.98
sd 5.97 7.79 8.25 13.22 7.84
cv (%) 40.01 67.16 11.74 25.63 76.19
notes bi – Banking Industry, sd – Standard Deviation, cv – Coefficient of Variations.Computed from the data published by Performance Highlights of Indian Banks, IndianBank Association, 1996–2008.
Interest paid). Table 11 highlights the Employee, Branch and FinancialProductivity ratios of Indian commercial banks.
Here, an attempt has been made to judge the impact of the TechnologyIndex on the Employee productivity, Branch productivity and Financialproductivity of various bank groups.
impact on employee productivity
As shown in table 12, in the case of Group i there is a positive but mod-erate (0.54) correlation between employee productivity and the Technol-ogy index, but, it is significant at 5 pc los. At the same time R2 shows29 pc variations in the employee productivity by the Technology index.
Managing Global Transitions

Does Technology Lead to Better Financial Performance? 19
table 9 Tele banking branches as percentage of total branches
Period Year Group i Group ii Group iii Group iv BI
Low-technology induction period
1996–1997 0.00 0.01 5.77 10.71 0.97
1997–1998 0.00 0.33 9.18 16.67 1.62
1998–1999 0.00 0.63 23.19 27.27 1.77
1999–2000 2.78 1.26 42.89 28.18 1.85
2000–2001 5.74 1.75 38.28 42.14 2.14
Average 1.70 0.80 23.86 24.99 1.67
sd 2.56 0.70 16.68 12.07 0.43
cv (%) 150.59 87.50 69.91 48.30 25.75
High-technology induction period
2001–2002 8.84 2.27 46.26 45.58 3.29
2002–2003 10.91 4.05 65.86 43.89 3.63
2003–2004 11.44 5.28 57.58 40.09 5.48
2004–2005 13.32 6.29 49.75 63.83 7.41
2005–2006 18.48 8.24 41.92 44.53 10.31
2006–2007 22.84 16.50 47.93 58.46 22.93
2007–2008 23.30 20.80 50.20 61.70 31.34
Average 15.59 9.06 51.35 51.15 18.84
sd 5.31 5.03 8.70 9.44 7.38
cv (%) 37.11 70.75 16.88 19.11 83.48
notes bi – Banking Industry, sd – Standard Deviation, cv – Coefficient of Variations.Computed from the data published by Performance Highlights of Indian Banks, IndianBank Association, 1996–2008.
In Group ii there is a high positive correlation (0.95) between employeeproductivity and the Technology index, and it is also significant at 1 pclos. R2 shows 90 pc variations in the dependent variable due to the Tech-nology index. In Group iii banks there is a moderate correlation of 0.59between the independent variable and dependent variable. But it is sig-nificant at 1 pc los. R2 (0.34) shows that others factor have more im-pact on Group iii productivity than that of the Technology index. In themodern era, Group iv has a high correlation between employee produc-tivity and the Technology index. Coefficient of determination shows 57
pc variations in employee productivity index. Overall, the Technologyindex of the Indian banking industry has a positive correlation of 0.97
Volume 10 · Number 1 · Spring 2012

20 Dhiraj Sharma
table 10 it Index
Period Year Group i Group ii Group iii Group iv BI
Low-technology induction period
1996–1997 22.00 30.29 40.45 48.41 38.29
1997–1998 38.73 38.94 46.79 49.40 41.51
1998–1999 39.05 40.80 53.48 51.62 41.65
1999–2000 39.98 41.25 55.52 52.83 42.14
2000–2001 41.34 42.03 57.58 57.29 43.20
Average 36.22 38.66 50.83 51.91 41.36
sd 8.01 4.82 7.08 3.48 1.84
cv (%) 22.11 12.47 13.93 6.70 4.45
High-technology induction period
2001–2002 42.01 43.89 58.61 57.69 43.97
2002–2003 44.31 44.88 61.51 60.76 44.39
2003–2004 44.60 45.75 60.29 59.10 44.72
2004–2005 45.86 46.66 58.44 69.60 45.40
2005–2006 48.08 47.70 59.73 59.52 45.96
2006–2007 49.11 48.80 62.72 65.55 46.98
2007–2008 50.22 49.10 64.40 66.23 48.30
Average 46.31 46.68 60.81 62.63 45.24
sd 2.61 2.10 1.73 4.58 1.11
cv (%) 5.72 4.62 2.87 7.38 2.45
notes bi – Banking Industry, sd – Standard Deviation, cv – Coefficient of Variations.Computed from the data published by Performance Highlights of Indian Banks, IndianBank Association, 1996–2008.
with employee productivity and it is significant at 1 pc los. R2 indicates0.94 pc impact of it on employee productivity. If we compare the im-pact of it with all the groups we conclude that Group ii banks (Fully it
oriented banks) are more influenced by technology induction.
impact on branch productivity
In the case of Group i banks, there is a positive and very high correlation(0.99) between branch productivity and the Technology index (table 12).The coefficient of determination also shows 98 pc variations in the de-pendent variable due to the Technology index and it is significant at 1 pclos.
Managing Global Transitions

Does Technology Lead to Better Financial Performance? 21
Similarly, in Group ii banks the correlation between the dependentvariable and independent variable is also very high (0.98) and is also sig-nificant at 1 pc los. R2 shows 96 pc variations in the dependent variabledue to the independent variable. The correlation between employee pro-ductivity and the Technology index in Group iii banks is positive butmoderate (0.56). The effect of other factors is 69 pc. The correlation issignificant at 5 pc los. In Group iv banks there is high correlation (0.91)and it is also significant at 1 pc los. The coefficient of determination in-dicates that 82 pc variations have been caused by the Technology index.Overall, the Indian banking industry also has a very high coefficient ofcorrelation and determination i. e. 0.98 and 0.96. In conclusion, we cansee that the effect of it on branch productivity is highest on Group i andGroup ii banks (Partially it oriented banks) and lowest on Group iii
banks (Fully it oriented banks).
impact on financial productivity
Group i has a positive but very low correlation (0.11) between the depen-dent variable and independent variable. The coefficient of correlation isalso statistically not significant (table 12). R2 shows positive but negligi-ble variations in the financial productivity. In Group ii banks there is anegative but low correlation (–0.05) between financial productivity andthe Technology index. The coefficient of determination is also negligible(0.02) in this group and R is insignificant. In the same manner, in Groupiii banks the coefficient of correlation between two variables is also neg-ative but low (–0.24). The coefficient of determination shows only 5 pcvariations in the financial productivity of banks due to technology. For-eign banks like private sector banks have almost the same coefficient ofcorrelation – negative but low (–0.27). The coefficient of determinationshows only 7 pc variations in the financial productivity of banks due totechnology.
Overall, for the banking industry, the correlation between financialproductivity and Technology index is low and negative (–0.45) and it isinsignificant. The coefficient of determination indicates that the effect ofother factors is more than the effect of Technology in financial produc-tivity. These factors may be liberalization of interest rates, managerialeffectiveness, internal and external policies of the banks, and so on. Fi-nally, we can conclude that the effect of it on financial productivity ofbanks is negative, though not much. Only in the case of Group i banksis it positive, but that too is very low.
Volume 10 · Number 1 · Spring 2012

22 Dhiraj Sharma
table11
Pro
duct
ivit
yra
tios
ofIn
dian
com
mer
cial
ban
ks
Gro
up
Var
iabl
eE
mpl
oyee
Pro
duct
ivit
yB
ran
chP
rodu
ctiv
ity
Fin
anci
alP
rodu
ctiv
ity
Ave
rage
d/e
c/e
bus
/ed
/bc
/bbus
/bie
%aa
sip
%aa
ss%
aa
s
Gro
upi
X1
0.83
0.39
1.22
13.88
6.48
20.36
9.24
6.36
2.87
X2
2.60
1.55
4.15
27.80
17.06
44.86
7.30
4.44
2.85
Mea
nG
ap1.77
1.16
2.93
13.91
10.58
24.50
1.94
1.92
0.02
se
1.19
0.65
1.82
6.25
5.63
11.85
0.80
0.75
0.19
t-va
lue
2.37
2.83
2.56
3.55
2.99
3.30
3.89
4.09
0.13
los
**
***
***
****
—
Gro
upii
X1
0.79
0.39
1.18
18.16
8.86
27.02
8.90
6.01
2.91
X2
1.91
1.18
3.09
38.13
23.36
61.50
7.62
4.59
3.04
Mea
nG
ap1.12
0.79
1.91
19.98
14.50
34.48
1.28
1.41
0.13
se
0.41
0.47
0.76
7.02
8.79
13.03
0.58
0.68
0.28
t-va
lue
4.37
2.68
4.02
4.07
2.63
3.98
3.50
3.30
0.72
los
***
****
***
****
—
Gro
upiii
X1
5.22
2.69
7.92
76.03
38.82
144.85
8.69
6.59
2.08
X2
5.31
4.17
9.48
141.15
111.14
252.29
6.25
4.12
2.11
Mea
nG
ap0
.09
1.48
1.57
65.12
72.32
137.44
2.44
2.47
0.03
se
0.75
0.38
1.05
35.50
27.01
62.08
1.09
1.04
0.49
t-va
lue
0.18
6.32
2.38
2.93
4.14
3.49
3.58
3.77
0.09
los
—**
**
****
****
—
Gro
upiv
X1
3.78
2.44
6.23
299
.49
193.66
493.15
9.74
6.31
3.43
X2
5.62
4.44
10.06
493.99
394.25
888.24
6.69
3.34
3.34
Managing Global Transitions

Does Technology Lead to Better Financial Performance? 23
Mea
nG
ap1.84
2.00
3.83
194.50
200
.63
395.09
3.05
2.97
0.09
se
0.73
0.53
1.22
101.69
91.98
191.67
1.00
1.11
0.54
t-va
lue
4.04
6.02
5.02
3.05
3.49
3.29
4.88
4.27
0.27
los
****
***
****
****
—
Ban
kin
gIn
dust
ryA
vera
geX
12.65
1.47
4.13
101.84
61.95
171.34
9.14
6.31
2.83
X2
3.86
2.83
6.69
143.51
136
.45
311.72
6.96
4.12
2.81
Mea
nG
ap1.21
1.36
2.56
41.67
74.50
140
.38
2.17
2.19
0.02
se
0.62
0.55
1.17
9.90
8.79
18.67
0.71
0.75
0.11
t-va
lue
3.52
3.05
3.31
3.22
2.87
3.06
4.40
4.03
0.77
los
***
***
**
****
—
notes
X1
–av
erag
ein
low
-tec
hn
olog
yin
duct
ion
peri
od,
X2
–av
erag
ein
hig
h-t
ech
nol
ogy
indu
ctio
npe
riod
,d
/e–
Dep
osit
per
Em
ploy
ee,c
/e–
Cre
dit
per
Em
ploy
ee,bus
/e–
Bu
sin
ess
per
Em
ploy
ee,d
/b–
Dep
osit
per
Bra
nch
,c
/b–
Cre
dit
per
Bra
nch
,bus
/b–
Bu
sin
ess
per
Bra
nch
,ie
%aa
s–
Inte
rest
Ear
ned
aspe
rcen
tof
Ave
rage
Ass
ets,
ip%aa
s–
Inte
rest
Paid
aspe
rcen
tof
Ave
rage
Ass
ets,
s%aa
s–
Spre
adas
perc
ent
ofA
vera
geA
sset
s,*
Mea
nis
sign
ifica
nt
atth
e0
.05
leve
l,**
Mea
nis
sign
ifica
nt
atth
e0
.01
leve
l.C
ompu
ted
from
the
data
publ
ish
edby
Perf
orm
ance
Hig
hlig
hts
ofIn
dian
Ban
ks,
Indi
anB
ank
Ass
ocia
tion
,1996
–2008.
table12
Impa
ctof
Tech
nol
ogy
Inde
xon
prod
uct
ivit
yof
ban
kgr
oups
Gro
up
Em
ploy
eeP
rodu
ctiv
ity
Bra
nch
Pro
duct
ivit
yFi
nan
cial
Pro
duct
ivit
yTo
talP
rodu
ctiv
ity
RR2
RR2
RR2
RR2
Gro
upi
0.54*
0.29
0.99
**0
.98
0.11
0.01
0.68*
0.46
Gro
upii
0.95*
*0
.90
0.98*
*0
.96
–0.05
0.02
0.80
**0
.64
Gro
upiii
0.59
*0
.34
0.56
*0
.31
–0.24
0.05
0.58*
0.33
Gro
upiv
0.76
**0
.57
0.91*
*0
.82
–0.27
0.07
0.90
**0
.81
Indi
anB
anki
ng
Indu
stry
0.97*
*0
.94
0.98*
*0
.96
–0.45
0.20
0.95*
*0
.90
notes
*M
ean
issi
gnifi
can
tatt
he0
.05
leve
l(1-
taile
d),*
*Mea
nis
sign
if.a
tth
e0
.01
leve
l(1-
taile
d).R
–co
effici
ento
fcor
rela
tion
,R2
coeffi
cien
tofd
eter
min
atio
n.
Volume 10 · Number 1 · Spring 2012

24 Dhiraj Sharma
impact on total productivity
In the case of Group i banks, the coefficient of correlation between theTechnology index and total productivity of banks is positive though notvery high, but significant at 5 pc los (table 12). The coefficient of deter-mination shows 46 pc variations in the total productivity due to tech-nology. In Group ii, the correlation between the total productivity andthe Technology index is high (0.80), but the variations in the total pro-ductivity are 64 pc, which are moderate. The coefficient of correlation issignificant at 1 pc los. In the case of Group iii banks, the correlationbetween total productivity and the Technology index is moderate, andthe impact of other factors on total productivity is more than the it. Thecorrelation is significant at 5 pc los. There is a high correlation betweentotal productivity and the Technology index in the case of Group iv.The coefficient of determination indicates that there are 81 pc variationsin total productivity due to Technology. The coefficient of correlation issignificant at 5 pc los. Overall, the Indian banking industry is highly af-fected by the Technology index. The correlation between the dependentvariable and it is high. The Indian banking industry is only 10 pc affectedby the other factors, which indicates that it is 90 pc affected by it. TheR is significant at 1 pc los. Finally, we can conclude that among all thebank groups the highest effect of it is on Group ii and Group iv banks,and the lowest effect of it is on Group iii banks.
Concluding Remarks
In the present study, it is found that the partially it oriented banks areless profitable than the fully it oriented banks. However, in terms ofoverall productivity and profitability their performance is gradually im-proving over the recent years. Foreign banks are on the top in terms ofthe overall productivity and profitability parameters (which supports thefindings of Sarkar et al, 1998). Analyzing further, it is found that sbi andassociate banks (Partially it oriented banks) are ranked second after theforeign Banks (Fully it oriented banks) in terms of the spread ratios, butthey have higher Burden ratios, which makes them less profitable as com-pared to the Private Banks. The Private Banks (Fully it oriented banks)are more profitable as they have the lowest financial burden in the twoperiods. Moreover, they have a high proportion of non-interest incomeand a comparatively low level of non-interest expenditure ratios as com-pared to the sbi group of banks. The Interest earned ratios are decliningover the years for all groups of banks because over the last few years rbi
Managing Global Transitions

Does Technology Lead to Better Financial Performance? 25
(Central bank) has pursued the policy of lowering the interest rates. Still,foreign Banks were able to have highest Interest earned ratios in the lowtechnology era as compared to the Indian Banks. In the high technologyperiod, the sbi group has the highest Interest earned ratio. The Interestearned ratio for the Indian Banks has almost been the same across allthe categories. The Interest paid ratio is the lowest for the foreign Banks(followed by private sector banks) in the high technology era. This can beattributed to the effective and efficient fund management by these banksthrough which they were able to raise funds at lower costs and use themfor profitable avenues. In terms of the financial performance analysis, thefindings of the present study support, to a large extent, the findings of thestudies by Sarkar, Sarkar and Bhaumik 1998; Shanmugam and Das 2004;Uppal and Kaur 2007; and Kumar and Sreeramulu 2008.
Overall, for the banking industry, the correlation between financialproductivity and the Technology index is low and negative and statis-tically insignificant. The co-efficient of determination indicates that theeffect of other factors is more than the effect of Technology on financialproductivity. These factors may be liberalization of interest rates, man-agerial effectiveness, risk management, internal and external policies ofthe banks and so on. Finally, we can conclude that the effect of it onfinancial productivity of banks is negative, though not much. Only inthe case of Group i banks is it positive, but that too is very low. There-fore, there is no conclusive and coherent evidence that technology leadsto better financial performance. However, it is safe to say that the variousbanking parameters of productivity and profitability have significantlyimproved in the high technology induction era. From the analysis, thewinners emerging are Fully it oriented banks. Foreign banks are at thetop, followed by Private Banks. From the Partially it oriented banks, sbiand its associates are performing better than other public sector banks.Overall, the Indian banking sector has performed well on various frontsin the recent years.
References
Aggarwal, S. 2007. ‘Indian Banking: Achieving Excellence via Good Gov-ernance.’ Bankers Conference Proceedings, November: 66–71.
Arora, U., and R. Verma. 2005. ‘Banking Sector Reforms and PerformanceEvaluation of Public Sector Banks in India.’ Punjab Journal of BusinessStudies 1 (1): 11–25.
Aggarwal, M. 2005. ‘Liberalization’s Effect on Operational Productivity ofCommercial Banks in India.’ iba Bulletin 27 (6): 33–40.
Volume 10 · Number 1 · Spring 2012

26 Dhiraj Sharma
Barua, A., C. Baily, T. Kriebel, and T. Mukhopadhyay. 1991. ‘InformationTechnology and Business Value: An Analytical and Empirical Investi-gation.’ Working Paper, University of Texas, Austin, tx.
Bhaskar, P. V. A. 2005. ‘Trends towards Universal Banking with StrategicAlliances.’ iba Bulletin 27 (3): 8–11.
Brynjolfsson, E. 1993. ‘The Productivity Paradox of Information Technol-ogy.’ Communications of the acm 35 (7): 66–7.
Brynjolfsson, E., and L. Hitt. 1996. ‘Paradox Lost? Firm-Level Evidence onthe Returns to Information Systems Spending.’ Management Science42 (4): 541–58.
Dos Santos, B. L., K. G. Peffers, and D. C. Mauer. 1993. ‘The Impact ofInformation Technology Investment Announcements on the MarketValue of the Firm.’ Information Systems Research 4 (1): 1–23.
Habbar, R. 2004. ‘Building Trust in E-Banking.’ Vinimaya 24 (3): 14–23.Jordan, J., and J. Katz. 1999. ‘Banking in the Age of Information Technol-
ogy.’ Regional Review 9 (2): 39–50.Kamakodi, N. 2007. ‘Customer Preferences on E-Banking Services: Under-
standing through a Sample Survey of Customers of Present Day Banksin India.’ Banknet Publications 4:30–43.
Krishnaveni, R., and D. D. Prabha. 2006. ‘Insight into the Internal ServiceQuality Perceptions of Bank Employees.’ Prajnan 34 (2): 165–72.
Kumar, S., and M. Sreeramulu. 2008. ‘Employees’ Productivity and Cost:A Comparative Study of Banks in India During 1997 to 2008.’ ReserveBank of India Occasional Papers 28 (3): 35–50.
Lakhsmi Naraynan, P. 2004. ‘Corporate Governance of Banks.’ iba Bul-letin 26 (7): 14–7.
Lal, R. C. 2007. ‘Banking Transformation through it in India.’ Journal ofCommerce and Trade 2 (2): 46–8.
Loveman, G. W. 1994. ‘An Assessment of the Productivity Impact of Infor-mation Technologies.’ In Information Technology and the Corporationof the 1990s: Research Studies, edited by T. J. Allen, and M. S. Scott Mor-ton: 84–110. Cambridge, ma: mit Press.
Lichtenberg, F. 1995. ‘The Output Contributions of Computer Equipmentand Personnel: A Firm Level Analysis.’ Economics of Innovation andNew Technology 3 (4): 201–17.
Madhavankutty, G. 2007. ‘Indian Banking: Towards Global Best Practices’.’Bankers Conference Proceedings, November: 84–6.
Malhotra, P., and M. Singh. 2005. ‘New Revaluation in the Indian BankingIndustry: Internet Banking.’ Punjab Journal of Business Studies 1 (1):75–86.
Mariappan, V. 2006. ‘Changing the Way of Banking in India.’ Vinimaya 26
(2): 26–34.
Managing Global Transitions

Does Technology Lead to Better Financial Performance? 27
Mishra, J. K., and M. Jain. 2007. ‘Constituent Dimensions of CustomerSatisfaction: A Study of Nationalized and Private Banks.’ Prajnan 35
(4): 390–8.
Mohan, R. K. 2003. ‘Transformation in Indian Banks.’ iba Bulletin 25 (3):1–14.
Morrison, C. J., and E. R. Berndt. 1990. ‘Assessing the Productivity of In-formation Technology Equipment in the us Manufacturing Indus-tries.’ National Bureau of Economic Research Working Paper 3582, Na-tional Bureau of Economic Research, Cambridge, ma.
Muniappan, G. P. 2002. ‘Indian Banking: Paradigm Shift – A Regular Pointof View.’ iba Bulletin 24 (3): 151–5.
Narayanasami, T. S. 2005. ‘Rural Lending: A Commercial Venture for AllClasses of Banks.’ iba Bulletin 27 (6): 5–8.
Paul, J., and A. Mukherjee. 2007. ‘Retail Banking, atms and Supply ChainManagement in Banking: A Study of Two Banks’.’ Prajnan 35 (1): 47–60.
Padwal, S. M. 2004. ‘Data Warehousing and crm in Banking.’ Vinimaya25 (1): 19–30.
Patnaik, S. 2004. ‘Shared atms – The Way Forward.’ iba Bulletin 26 (12):24–7.
Raveendra, P. V. 2007. ‘Customer Relationship Management in FinancialServices.’ Banknet Publications 4:57–67.
Sarkar J, S. Sarkar, and S. K. Bhaumik. 1998. ‘Does Ownership always Mat-ter? Evidence from the Indian Banking Industry.’ Journal of Compara-tive Economics 26 (2): 262–81.
Shanmugam, K. R, and A. Das. 2004. ‘Efficiency of Indian commercialBanks during the reform period.’ Applied Financial Economics 14:681–86.
Sharma, R. D., G. Kaur, and J. Sharma. 2007. ‘Customer Delight: A Roadto Excellence for Banks.’ nice Journal of Business 2 (2): 1–2.
Shanker, A. G. 2004. ‘Customer Service in Banks.’ iba Bulletin 26 (8): 5–8.
Sharma, T., and S. Dhanda. 2007. ‘Perceptions of Customer Value: An Em-pirical Study.’ Indian Management Studies Journal 11 (2):15–48.
Singh, S. 2004. ‘An Appraisal of Customer Service of Public Sector Banks.’iba Bulletin 26 (8): 30–3.
Singh, D., and S. Kabiraj. 2007. ‘it and crm Applications in Indian Re-tail Banks.’ Paper presented at the Banknet’s Third International BankTech Summit, 10 October, Mumbai, India.
Sooden, M., and M. Bali. 2004. ‘Profitability in the psbs in India in thePre and Post Reform Period.’ Indian Management Studies Journal 8 (2):69–91.
Volume 10 · Number 1 · Spring 2012

28 Dhiraj Sharma
Strassman, P. A. 1990. The Business Value of Computers. New Canaan, ct:Information Economics Press.
Subbaroo, P. S. 2007. ‘Changing Paradigm in Indian Banking.’ Gyan Man-agement 1 (2): 151–60.
Thakur, R. K. 2007. ‘Delivering Superior Customer Service.’ Bankers Con-ference Proceedings, November: 44–7.
Uppal, R. K. 2008. ‘Customer Perception of E-Banking Services of IndianBanks: Some Survey Evidence.’ The icfai Journal of Bank Management7 (1): 63–74.
Uppal, R. K., and R. Kaur. 2007. ‘Indian Banking Industry: ComparativePerformance Evaluation in the Liberalized and Globalized Era.’ GyanManagement 1 (2): 3–24.
Vanniarajan, T., and S. M. Nathan. 2008. ‘Performance Only Measurementof Service Quality and Customer Satisfaction in Indian CommercialBanking.’ Punjab Journal of Business Studies 3 (2): 1–16.
Wilson, D. 1993. ‘Assessing the Impact of Information Technology on Or-ganizational Performance.’ In Strategic Information Technology Man-agement, edited by R. Banker, R. Kauffman, and M. A. Mahmood: 471–514. Harrisburg, pa: Idea.
Managing Global Transitions

Technology, Wealth and ModernManagement of Technology
Slavko DolinšekPeter Štrukelj
In the paper, we propose somewhat different conceptualizations oftechnology, of a fundamental relationship between technology andwealth in a society, of technological capability, and of management oftechnology. We based our proposed conceptualizations on the currentgeneral and relevant technological practice. In order to infer these con-ceptualizations, we studied today’s largest companies worldwide in dif-ferent production and technology sectors as well as some general re-porting on technology from technology-oriented media. These funda-mental conceptualizations may be of interest to all those who are practi-cally or theoretically concerned with technology, wealth, technologicalcapability and management of technology, and who want to compre-hend the essence of technology and its relations to phenomena, such aswealth and management (‘to get the big picture’). At the end, we ex-plain why there is a need in modern companies to manage technologiesand what a new paradigm of management of technology is, i. e. whatnew challenges and trends a modern management of technology has toface.
Key Words: technology, wealth, technological capability, managementof technology, technology trends
jel Classification: i31, j30, m10, o3
Introduction
The paper is about the fundamental relationship between technology,wealth, technological capability and management.
Technology is a phenomenon that most people intuitively regard asrather important for their lives and purposes. ‘Technology has a pro-found impact on our lives. On the one hand it is the source of many ben-efits and most of our wealth. On the other it is disturbingly disruptive. Toharness it effectively calls for pervasive understanding, managerial skill
Dr Slavko Dolinšek is a Professor at the Faculty of Management,University of Primorska, Slovenia.
Peter Štrukelj is a Lecturer at the Faculty of Management, Universityof Primorska, Slovenia.
Managing Global Transitions 10 (1): 29–49

30 Slavko Dolinšek and Peter Štrukelj
and good luck’ (Van Wyk 2004, 10). Yet despite this, it seems that peoplegenerally do not have a clear idea (concept) of what technology really isand how it is connected to our lives and purposes. Van Wyk points outthat there is a growing need in our society for a better understandingof technology: ‘We need a simple, comprehensive grasp of technology.We need to understand at the macro level how technology is composed,how it evolves and how it interacts with other systems’ (p. 6). Despite thedeciding impacts of technology on our lives, ‘our understanding of tech-nology is poorly structured. Technological knowledge has not undergonethat profound simplification that marks the development of most fieldsof knowledge as they grow to maturity’ (p. 10). From a scientific pointof view, it is therefore our first task, quite strangely, to convincingly de-termine and explain what technology is, before we can actually go anyfurther in analyzing and understanding technology in its connection toother related phenomena, such as wealth and management. If we con-sider some of the most relevant and acknowledged literature on technol-ogy and management of technology, we find that relevant and acknowl-edged authors (e. g. Burgelman et al., 1998; Khalil, 2000; Van Wyk, 2004;Zeleny 1986) define technology somewhat differently and that there is nogenerally accepted definition of technology among these authors (also ingeneral, there are numerous and quite diverse definitions and concep-tions of technology). In the past few years, a few scholars have searchedfor a fundamental theoretical structure that underpins all technology –and there is a growing need for this structure. ‘This search could possi-bly yield one of the most significant conceptual foundations for the 21stcentury. Such a fundamental structure would materially improve our un-derstanding of technology, enhance our ability to manage it better, andincrease our effectiveness in formulating public policy in this area’ (VanWyk 2004, 13).
In the practice of technology management, there is also evidence ofthe need for better theoretical structure. ‘Most corporate managers willadmit to being blindsided by new technology. Rare indeed is the chiefexecutive officer who systematically maps the global technological land-scape and who knows where to expect definitive developments [. . .] Inthe world of investments, monies flow in and out of technology-basedcompanies more on the basis of fashion than on the basis of rationaltechnology analysis’ (Van Wyk 2004, 14).
According to the International Association for the Management ofTechnology (iamot), technology is a large and growing part of every
Managing Global Transitions

Technology, Wealth and Modern Management of Technology 31
manager’s daily experience – managers develop technology, use tech-nology, buy technology and sell technology. Fusfeld (1978) pointed outthat in general, key management decision makers have inadequate back-ground and ability to make judgments and forecasts in the area of tech-nology. And without that ability, their options in utilizing technology incorporate strategy are severely limited. Many executives, venture capital-ists, and entrepreneurs know of corporate success in which technologyhad played a dominant role. Many dream of technology being turnedinto a profit and these dreams are motivated by real-life successes. Fus-feld stresses that, despite the obvious role of technology in very successfulenterprises, technological issues are only occasionally explicitly includedin typical corporate strategy reviews, and only rarely are they among theregular inputs to corporate planning and development. Technology isaddressed in strategic plans only implicitly, except in the case of specialendeavors which are outside the main lines of production – new andjoint business ventures, licensing, and acquisitions. Tesar et al. (2003, 5–10) stress that managers have to understand the technological side of thebusiness just as well as the marketing side and they need to properly co-ordinate technical and marketing competencies in firms. Burgelman etal. (1998, 1) pointed out that ‘strategic management of technology andinnovation is a young field and the domains of different, partly overlap-ping concepts are still somewhat in flux.’
The main purpose of the paper is thus to provide a general under-standing of what technology is (and how it is connected to wealth ina society), what is a technological capability, what is management oftechnology and what are the main challenges of the modern practice ofmanaging technologies. In each of these fundamental elements, we firstpresent what relevant authors have said about these elements, and thenwe propose, based on our research and analysis of the current generaland relevant technological practice, our own conceptualizations of theseelements. These fundamental conceptualizations may be of interest toall those who are practically or theoretically concerned with technology,wealth, technological capability and management of technology.
How to Conceptualize Technology
Our review of literature on the theory of technology and management oftechnology shows (as is generally the case in modern social sciences) thatthere is no single definite, clear, convincing and generally accepted def-inition or conception of what technology actually is. Leading academic
Volume 10 · Number 1 · Spring 2012

32 Slavko Dolinšek and Peter Štrukelj
authors in management of technology propose the following conceptu-alizations of technology.
Khalil (2000, 1–2), for example, says that ‘technology can be definedas all the knowledge, products, processes, tools, methods, and systemsemployed in the creation of goods or in providing services [. . .] it iscommon to think of technology in terms of hardware, such as machines,computers, or highly advanced electronic gadgets. However, technologyembraces a lot more than just machines. There are several technologicalentities besides hardware, including software and human skills.’ Zeleny(in Khalil 2000, 2) proposed a conception that any technology consistsof three interdependent, codetermining, and equally important compo-nents:
• Hardware: The physical structure and logical layout of the equip-ment or machinery that is to be used to carry out the required tasks.
• Software: The knowledge of how to use the hardware in order tocarry out the required tasks.
• Brainware: The reasons for using the technology in a particular way.This may also be referred to as the know-why.
Khalil also stresses that in addition to the above three components,a fourth one must be considered independently, for it encompasses alllevels of technological achievements, and that is know-how: ‘The learnedor acquired knowledge of or technical skill regarding how to do thingswell. Know how may be a result of experience, transfer of knowledge, orhands-on practice. People acquire technical know-how by education ortraining or by working closely with an expert in a certain field.’ Khalilconcludes that it is ‘only when knowledge is practically implemented tocreate new things, operate a system, or provide a service that we enter therealm of technology.’
Van Wyk (2004, 23), for example, suggests that ‘technology is compe-tence, created by people, and expressed in devices, procedures and hu-man skills [. . .] devices, procedures and human skills reflect the threeconstituent elements that combine to form a unit of technology – a tech-nology entity.’ Van Wyk links technology to developed capability, i. e.ways and means for taking action. However, technology is not concernedwith the ultimate ends of the action. Van Wyk emphasizes the artificialnature of technology; technology is man-made, meaning that it does notoccur spontaneously in nature.
Burgelman et al. (1998, 2), on the other hand, say that ‘technology
Managing Global Transitions

Technology, Wealth and Modern Management of Technology 33
refers to the theoretical and practical knowledge, skills, and artifacts thatcan be used to develop products and services as well as their productionand delivery systems. Technology can be embodied in people, materials,cognitive and physical processes, plant, equipment, and tools.’
A Proposed New Conceptualization of Technology
If we study the above cited definitions and conceptions of technology,we can conclude that these definitions and conceptions are basically dif-ferent from one another, yet they have certain similarities and commonthemes (knowledge, skills, artifacts, processes, methods). Since these def-initions and conceptions are a result of theoretical work, the most im-portant theoretical question in this respect is whether these conceptionsadequately and correctly conceptualize current technological practice,i. e. our current practical experience with technology. In order to answerthis question properly, it is necessary to study where (in which organiza-tions/institutions) the term technology is most commonly used, wheretechnology is regarded as very important or even decisive for achievingpurposes of organizations, and how the term technology is used (whatdo people mean when they speak of technology) in these organizations.
Our experience with technology shows that it is in companies thatproduce commodities where the term technology is most commonlyused, where it is regarded as very important or even decisive for achiev-ing purposes of these companies. Our experience with technology alsoshows that technology is being invented, developed and used predomi-nantly (but not exclusively) in companies that produce commodities. Itis therefore necessary to be acquainted with how the term technology isbeing used in these companies, and what is meant by technology whenthis term is used by these companies.
For the purpose of becoming acquainted with how the term technol-ogy is being used in modern companies, we used companies’ annual re-ports and technology related documents available on companies’ webpages. In the first round, we studied some of the largest companies inthe following technologically most advanced manufacturing sectors: en-ergy, nanotechnology, biotechnology, information technology, electron-ics, robotics and aerospace. Our study shows that in these companies,technology refers to:
• methods, techniques, procedures, processes, activities of produc-tion (see for example ExxonMobil 2009, 2008; iRobot 2009; Nano-phase 2010; amgen 2010),
Volume 10 · Number 1 · Spring 2012

34 Slavko Dolinšek and Peter Štrukelj
• machines and devices by means of which processes of productionare carried out (see for example ExxonMobil 2009, 2008; amgen
2010),
• devices (systems) and their processes that are included as compo-nents in final products (see for example iRobot 2009; Boeing 2009;Microsoft 2009; Sony 2010).
Examples of methods of production are cogeneration, directional dril-ling (ExxonMobil 2009), molecular fingerprinting (ExxonMobil 2008),surface treatment and coating processes, physical vapor synthesis, nano-arc synthesis (Nanophase 2010), genetic engineering utilizing restrictionenzymes, polymerase chain reaction, cell culture, gel electrophoresis,protein electrophoresis, mass spectrometry, dna sequencing and com-puterized imaging, X-ray crystallography (amgen 2010).
Examples of machines and devices by means of which processes ofproduction are carried out are: land-based drilling rig, microscope(ExxonMobil 2009), thermocycler, dna microarrays (amgen 2010),middleware platforms (Microsoft 2009).
Examples of devices (systems) and their processes that are includedas components in final products are: lithium-ion battery separator film(ExxonMobil 2008), code bases, modules, signal processing, laser scan-ners, cameras, optical sensors, payloads, interfaces, controllers, plat-forms, manipulators, algorithms (iRobot 2009), remote vision systems,refueling pods, hose drum units, digital cockpits (Boeing 2009), cloudcomputing ecosystems, natural user interfaces, file formats, program-ming interfaces, protocols, automated reasoning, adaptation, human-computer interaction (Microsoft 2009), lenses, close-proximity wirelesstransfer, image processing engine (Sony 2010).
In the second round, we then studied:
• world largest companies in 2010 (Fortune 2010b),
• world largest financial companies in 2010 (Fortune 2010b), and
• us largest service companies in 2010 (Fortune 2010a),
• general public reporting on technology and its development (Tech-nology Review (2011) and New Scientist – Technology).
Our study shows that in these companies and in this general publicreporting, technology refers to:
• machines and devices that are used in manufacturing (processing),storing and delivering of material products, energy and informa-tion,
Managing Global Transitions

Technology, Wealth and Modern Management of Technology 35
• processes (with the use of machinery and devices) of manufacturing(processing), storing and delivering material products, energy andinformation,
• devices and their processes that are included as components in finalproducts,
• advanced functional materials,
• most generally, devices that people and organizations use in theiractivities.
This is our proposed conceptualization of technology that is derivedfrom our study of current general and relevant technological practice,and not from past uses of the term ‘technology’ (etymological conceptu-alization) or from a recombination of numerous diverse definitions andconceptualizations of technology at present.
Our conceptualization of technology is similar to the above cited def-initions and conceptualizations of technology by different academic au-thors. What is most specific in our conceptualization is the third elementof technology: devices (systems) and their processes that are included ascomponents in final products. This element is not explicitly present inthe above cited conceptualizations; however, it might be implicitly in-cluded.
All the above cited conceptualizations by different academic authorsstress knowledge and skills as necessary elements of technology. Ourstudy of both the world’s largest as well as the technologically most ad-vanced companies shows that these companies do not immediately referto technology as knowledge or skills, but they rather speak of techno-logical or technical expertise, technical knowledge, technical skills whenthey refer to knowledge and skills. Also, when companies explain howtheir technologies work, they provide knowledge on these technologies.However, machines, devices and processes of production (manufactur-ing, storage and delivery) would not function as such if the knowledgeand skills to use them rationally, purposefully, effectively, productivelywere lacking. Knowledge and skills are fundamental to consistently usemachines, devices and processes of production rationally and effectively.Knowledge and skills to rationally and effectively use technology are anecessary presupposition of technology. Without knowledge and skills,machines, devices and processes of production would be just some un-known, unuseful, arbitrary and coincidental processes and pieces of ma-terial.
Volume 10 · Number 1 · Spring 2012

36 Slavko Dolinšek and Peter Štrukelj
According to our conceptualization, technology does not refer to toolsor accessories as such, but only to one part of tools or accessories – i. e.machines and devices. Machines and devices not only enable and makeour work easier (like tools in general), but they perform some work (ex-ecute functions) themselves (thus replacing or complementing humanlabor), and this distinguishes them from tools or accessories that do notperform any work by themselves (e. g. a simple knife, a pencil, a ham-mer). Technology also does not equal equipment for production as such,because technology is only one part of this equipment – again machines,devices and their processes, and not buildings or furniture.
According to our conceptualization, technology also does not refer toprocesses or procedures of activity or work as such, but only to pro-cesses of one part of our activity or work – i. e. manufacturing (process-ing), storing and delivering material products, energy and information,whereby machines and devices are being used.
Technology and Wealth in a Society
Khalil (2000, xix) states that technology has always been intertwinedwith society’s progress and it has been linked to improvements in stan-dards of living: ‘The human aspiration for a better life increasingly de-pends upon technology and its effects on all aspects of life’ (Khalil 2000,xix). Today’s pace and scope of technological change are having profoundeffects on every human institution. Technology has enabled humans toachieve unprecedented change in their way of life.
We propose to say that a principal relationship between technologyand wealth is that by inventing, developing technologies, by using themand by advancing, improving them, we can:
• produce existing goods more efficiently,
• produce more goods,
• produce better goods,
• produce new goods,
• save labor (though development, maintenance and advancement oftechnology requires labor) and increase leisure/spare time,
• make labor easier,
• improve goods,
• make activities easier,
• enable new activities.
Managing Global Transitions

Technology, Wealth and Modern Management of Technology 37
This is the essential possibility of technology in relation to wealth. Wecan do all of the above with technology. Development, use and advance-ment of technology/-ies can mean our greater dominance and powerover nature; it can mean our greater dominance and control of our ma-terial life conditions. Technological advancement can be decisive for thebetter quality of our lives. Technology can empower people.
However, whether this essential possibility of technology is realized andto what extent it is realized, depends on the availability of material re-sources, people’s will and their ingenuity, skills and capabilities to de-velop, use and advance technology. Also, if technology is developed, usedand advanced in a particular society, then whether this essential possibil-ity of technology is realized and to what extent it is realized depends onthe principles of the socio-economic order in that society in which tech-nology is developed, used and advanced.
For example, in capitalism (the present predominating global socio-economic order), technology is being constantly invented and existingtechnology constantly advanced.¹ In capitalism, by inventing, develop-ing, designing technologies, by using them and by advancing, improvingthem, existing commodities are produced more efficiently, more com-modities are produced, better commodities are produced (though not allcommodities tend to be better, because there are necessarily different lev-els of purchasing power – those with the highest purchasing power tendto get the best quality commodities), new commodities are produced,commodities are improved (by including technology as a component infinal products), activities are made easier and new activities are enabled.
However, in capitalism, the essential possibility of technology in sav-ing labor and increasing leisure/spare time or in making labor easieris not realized. In capitalism, technology is not invented, used and ad-vanced in order to save labor as such and to increase leisure/spare timeas such, but to save paid labor and thereby to decrease labor costs. Anecessary consequence of constant technological invention and advance-ment in capitalism is increasing unemployment (saving paid labor inproducing commodities, less and less workers are needed to produce thesame amount of commodities) and employing new workers at the sametime, because new technologies create new production processes (andnew markets) where new workers are needed (technological change isthe chief source of new profitable areas). In capitalism, these two oppo-site tendencies in the technology-labor relation are in force all the time,not just in times of (increasing) profits, but also in times of crises.
Volume 10 · Number 1 · Spring 2012

38 Slavko Dolinšek and Peter Štrukelj
Also, in capitalism, essential possibilities of technology and thereforeits contribution to wealth are only in part realized. Rubinstein (1931) ex-plained this in the following manner:
Capitalism, in developing machine production, pursues the pur-pose not of developing the means of production, but of increasingthe profits. Therefore, capitalism introduces a new machine onlywhen the difference between the price of this machine and the costof labor that it replaces is sufficiently large to secure an averageprofit and successful competition in the market. Already at the com-mencement of capitalist development we find a number of caseswhen inventions or improvements in machinery were either entirelyheld in abeyance or they were utilized not in the country where theywere originated, because labor in that country happened to be socheap that the adoption of the machine was unprofitable and unde-sirable to the capitalists [. . .] Unemployment, under capitalism, isthe inevitable consequence of technical progress, and in its turn, itchecks the further development of technical progress, the introduc-tion of new machines, and the application of new scientific methodsin industrial practice [. . .] These tendencies to check and obstructtechnical, and consequently also scientific development, becomeparticularly pronounced in the final monopoly stage of capitalism[. . .] Under capitalism, the adoption of technical achievements isalways considerably below the extent possible under a given level ofscientific and technical development [. . .] real application of tech-nical discoveries lags far behind the already possible developmentof the forces of production [. . .] To begin with, these tendenciesof monopoly capitalism, by hindering the growth of the forces ofproduction, clip the wings of scientific creative activity, technicalinitiative, and inventiveness. A huge portion of scientific work, thelabour of many years, is practically wasted finding no applicationin industry, in life, in reality. [. . .] Already the present state of sci-ence and technique secures such a gigantic growth of the forces ofproduction as modern capitalism is unable to realize.
The German scientific group GegenStandpunkt (1983) also explainedthat technology in capitalism is not developed and used in productionof commodities in order to make labor easier, but in order to make pro-duction more cost-effective for entrepreneurs. By using new technolo-gies (machines and devices) and thus by new divisions of labor, the same
Managing Global Transitions

Technology, Wealth and Modern Management of Technology 39
commodities can be produced cheaper, as long as additional expendi-tures for ‘technical progress’ are compensated by saved wages. By meansof rationalization of his company, a capitalist increases the productivityof labor and at the same time takes care for dismissing or not employinga part of the workers.
In capitalism, substitution of labor through technology thus has theadvantage of increasing productivity of labor. But this substitution alsohas disadvantages. By means of introducing machines and automatiza-tion into the labor process, a man becomes more and more dependent ontechnical apparatus. This dependence then manifests itself in substantialshifts in the cost-structure of a company; by means of substituting la-bor through technology, a share of proportional costs (wages) inside thecompany’s total costs decreases, while fixed costs of growing installationssubstantially increase. Thereby, a company becomes more inflexible –the lower price-limit is very high due to increased and high fixed costs.A company can therefore get into troubles if its sales decrease (even ina slight manner) for a longer period of time – in that case, a companycannot cover its fixed costs any more.
To sum up, how and to what extent a technology contributes to wealthin a society depends on the principles of the socio-economic order inthat society, in which technology is developed, used and advanced. Thesesocio-economic principles determine the contribution of technology towealth in each particular society. And since each socio-economic order isgoverned by different socio-economic laws, technology then differentlyand to a different extent contributes to wealth in each particular (past,present, or any possible future) socio-economic order.
Technological Capability
In 1987, the National Research council stated the following: ‘Manage-ment of technology links engineering, science and management disci-plines to plan, develop, and implement technological capabilities to shapeand accomplish the strategic and operational objectives of an organi-zation’ (National Research Council 1987, 9). Technological capability isone of the central elements in the practice of technology management.Theory in management of technology should therefore pay sufficient at-tention to this phenomenon and provide some satisfying results. Basedupon convincing conceptualization of technology, the most importantconcept in management of technology has to be developed, i. e. techno-logical capability.
Volume 10 · Number 1 · Spring 2012

40 Slavko Dolinšek and Peter Štrukelj
In the literature on management of technology, the concept of techno-logical capability is often used in different contexts. However, as with thecase of general conceptualization of technology, the concept of techno-logical capability also lacks one definite, clear, convincing and generallyaccepted conceptualization. Zedtwitz and Jin (2004) point out that thedefinition of technological capability is varied in perspective, depend-ing on the aims of the researchers. Lall, for example, defined techno-logical capability broadly as ‘the entire complex of human skills (en-trepreneurial, managerial and technical) needed to set up and operateindustries efficiently over time’ (Lall in Zedtwitz and Jin 2004, 2). Hedefined technological capability in the narrow sense as the capability toexecute all the technical functions entailed in operating, improving andmodernizing the firm’s productive facilities. It is categorized to the in-vestment tc, the production tc, and linkages tc according to the func-tions (Lall in Zedtwitz and Jin 2004, 2). Kim pointed out that in the de-veloping countries ‘technological capability’ could be used interchange-ably with ‘absorptive capacity’ (Kim in Zedtwitz and Jin 2004, 2): ab-sorbing existing knowledge, assimilating it, and in turn generating newknowledge. Zedtwitz and Jin (2004, 2–3) themselves define technologicalcapability as the capability to make effective use of the technical knowl-edge and skills, not only in the effort to improve and develop the prod-ucts and processes, but also to improve the existing technology and togenerate new knowledge and skills, in response to the competitive busi-ness environment.
Our Proposed Conceptualization of Technological Capability
Based upon our conceptualization of technology (see above), we proposethe following conceptualization of technological capability: technologi-cal capability refers to our capability (capacity) to use technologies (aswell as knowledge and skills necessary for their proper use) in a way thatcontributes to effective and successful achievement of our purposes.
Technology can be either a purpose itself or some of our means bywhich we achieve some other purposes, or both. Our experience withtechnological practice shows that usually, technology is not a purpose byitself, but is invented, developed, used and advanced in order to achievesome other purposes (e. g. making work easier, increasing productivity,producing or consuming new products, improving services). And only inthis respect (using technology as a means to achieve some purpose), doesit make sense to speak of our technological capability, i. e. our compe-
Managing Global Transitions

Technology, Wealth and Modern Management of Technology 41
tence/capacity to purposefully use technology. However, if we were not touse technology to achieve some purpose, then it would not make muchsense to speak of our technological capability in this respect, but ratherof how successful we are at achieving this purpose by using some othermeans (non-technological).
Technological capability is not the same as technology or as knowledgeand skills of how to use a technology in order to produce a desired prod-uct. Technological capability is our competence/capacity to purposefullyuse technology and the necessary knowledge and skills.
Technological capability refers both to individuals and organiza-tions/institutions – an individual as well as an organization/institutioncan have a technological capability. According to the National ResearchCouncil (1987), it is the technological capability of organizations that isrelevant to management of technology. In the following, we will thusfocus on the technological capability of organizations.
The technological capability of an organization refers to managingtechnologies (and technological knowledge and skills) in a way that guar-antees effective and successful achievement of the purposes of an orga-nization, where technology plays an important role. And since our expe-rience with technology shows that technology is being invented, devel-oped, used and advanced predominantly (but not exclusively) in compa-nies, technological capability usually (but not exclusively) refers to suc-cessful management of technologies in companies. The technological ca-pability of companies refers to the competence/capacity of companies touse technologies (as well as the knowledge and skills necessary for theirproper use) in a way that consequentially guarantees value maximiza-tion and profits for investors. Janeš and Dolinšek (2007, 1411) stated that‘the technological capability of the company is the ability to effectivelyand successfully exploit the management of technology knowledge.’ Andsince management of technology is a rather broad managerial practice(it covers many activities, functions and tasks in a modern corpora-tion), then technological capability must also be a rather broad concept.Technological capability is much more than technology itself or techni-cal knowledge on how to use certain machines, devices and processes toproduce a desired product. According to our conceptualization, techno-logical capability does not refer to machines or devices, in the sense thatthese would have technological capabilities (machines and devices havefunctions and different levels of performance), but it refers to organiza-tions, especially to companies (and also to states) in the present economy.
Volume 10 · Number 1 · Spring 2012

42 Slavko Dolinšek and Peter Štrukelj
They have and they develop technological capabilities. The technologi-cal capability of an organization is thus a managerial and organizationalcategory – and not a mathematical, physical, biological, psychological orany other category.
In the following, we present a particular theoretical case, where tech-nological capability is conceptualized in a much more narrowed, tech-nical sense than ours. Gallon et al. (1995), namely, explain technologicalcapabilities as ‘technical capabilities providing direct support to the (cre-ation of) product or service portfolio with unique value to customers.’These capabilities are then divided into:
• applied science capabilities (fundamental know-how derived frombasic research),
• design and development capabilities (disciplines employed in con-verting a product idea into an operational reality),
• manufacturing capabilities (capabilities employed in, or directlysupporting, established manufacturing or operations).
Gallon et al. (1995) stress that ‘in modern organizations, the large ma-jority of the capabilities that are critical to organizations are either tech-nological or market interface capabilities. Most core competencies relyon technological and market interface capabilities. Technical competen-cies are especially important because they are more frequently able tocross market boundaries and can provide the basis for significant prod-uct superiority. In most organizations, only few areas of technical ex-pertise have the right attributes to be worthy of the term core technicalcompetency and even fewer have been developed by these companies tothe level of excellence that is necessary to give them broad strategic value.’
Managing Technology
According to Khalil (2000, 51), technology is very important in interac-tions between the individual, society, and nature. Technological advanceshave major effects on each of these entities and are, in turn, influenced bythem. Management of technology (hereafter, mot) involves developingand understanding these relationships and dealing with them in a ra-tional and effective manner. In 1987, the National Research council statedthe following: ‘Management of technology links engineering, science andmanagement disciplines to plan, develop, and implement technologicalcapabilities to shape and accomplish the strategic and operational ob-jectives of an organization’ (National Research Council 1987, 9). Khalil
Managing Global Transitions

Technology, Wealth and Modern Management of Technology 43
(2000, 7) also says that management of technology is ‘an interdisciplinaryfield that integrates science, engineering, and management knowledgeand practice [. . .] Managing technology implies managing the systemsthat enable the creation, acquisition and exploitation of technology. It in-volves assuming responsibility for creating, acquiring, and spinning outtechnology to aid human endeavors and satisfy customers’ needs.’
Based on the above conceptualizations of technology and technolog-ical capability, we propose the following conceptualization of manage-ment of technology: management of technology is organizing, coordi-nating and leading the use/handling of technology (and technologicalknowledge and skills) in an organization. Management of technology in-volves the following basic activities:
• planning of the use of technology,
• identification, selection and acquisition of technology,
• preparation and introduction of the use of technology,
• implementation, installation and control of the use of technology,
• motivating and maintaining the use of technology.
If an organization uses technology to achieve its purposes and goals,there is a need for effective management of technology in such an orga-nization. An individual human itself does not manage technology anddoes not have the need to manage technology – it only uses (effectivelyor ineffectively) technology to achieve some purpose or goal. Technologyis managed only in organizations where technology is being used, andmanagement of technology is only one part of the general managementof an organization. However, organizations in different socio-economicorders have different purposes/goals and management of technology inorganizations depends on these particular purposes/goals, and also onthe principles of each particular socio-economic order in which organi-zations are operative.
Management of technology is management of an effective and pur-poseful use of technology in an organization. Based on our conceptual-ization of technological capability (see above), management of technol-ogy is thus also developing and advancing the technological capabilitiesof organizations. For example, Janeš and Dolinšek (2007, 1411) stated that‘technological capability of the company is the ability to effectively andsuccessfully exploit the management of technology knowledge.’
Some of the possible activities in the practice of mot are also:
• technology auditing,
Volume 10 · Number 1 · Spring 2012

44 Slavko Dolinšek and Peter Štrukelj
• scanning the technological environment and analyzing technologytrends,
• technology forecasting and technology foresight,
• formulation of technology strategy,
• technology transfer,
• technology development.
The Need for Managing Technology Today: A New Paradigm
According to Khalil (2000, 54), the efficient utilization of technologicalresources is a critical aspect of today’s management of corporations. Inthe modern way of life based on technology, the rational and produc-tive use of available technology, materials, skilled workers, information,intellectual assets, and financial resources is crucial in providing a com-petitive posture for corporations.
Burgelman et al. (1998, vii) simply state that technology and innova-tion must be managed, since this is generally agreed upon by manage-ment scholars and managers. ‘One key task of the general manager is toacquire, develop, and allocate an organization’s resources. Technology isa resource of paramount importance to many organizations in today’scompetitive environment; managing this resource for competitive ad-vantage entails integrating it with the firm’s strategy’ (p. 1). Managementof technology must be a part of a firm’s overall business strategy.
Our study of major companies in different material production sectors(e. g. energy, information technology, robotics) shows that innovative,advanced, leading-edge (possibly proprietary) technologies are today re-garded as a decisive source of competitive advantage and consequentiallyvalue maximization and profits (see for example ExxonMobil 2008, 2009;iRobot 2009, Microsoft 2009). Technology is regarded as an element un-derpinning success across all sectors of these companies.
According to the International Association for the Management ofTechnology (iamot), technology is a large and growing part of everymanager’s daily experience – managers develop technology, use technol-ogy, buy technology and sell technology (Van Wyk 2004, 84). Technolo-gies today are an integral factor that exerts influence upon all managerialdisciplines (finance, accounting, human resource management, market-ing, operations management).
The essence of today’s mot is in combining business managementwith science and engineering: a primary focus is on technologies in the
Managing Global Transitions

Technology, Wealth and Modern Management of Technology 45
whole business process – from strategic planning concerning investmentand development of new technologies to operative questions concerningdevelopment of products and technologies as well as their commercial-ization. A framework (model) of the technology management activitiesconsists of identification, selection, acquisition, the exploitation and pro-tection of technologies (Janeš and Dolinšek 2007, 1411).
mot is very important today due to unprecedented and fast techno-logical development. Managers daily face technological challenges, uponwhich they have to quickly and appropriately respond, and this requiresnew knowledge and brings new tasks. Research and development as wellas inventions are important elements for advancing technological devel-opment, yet still more important is exploitation and commercializationof existing technologies.
Khalil (2000, 54) states that ‘drastic changes in the business environ-ment in the third millennium are expected. There is a search for newparadigms that are suitable for this new environment. New paradigmsin management of technology are interdisciplinary – they draw uponknowledge from existing fields such as engineering, management, ac-counting, finance, economics, production, and political science.’ Thereare today very dynamic conditions for manufacturing and service orga-nizations, conditions dictated by changes in technology and by the globalbusiness environment. Major technological changes in the world’s econ-omy now include: rapid technological change and diffusion, increas-ing technological complexity, new computer-based service technologies,and globalization of technology-competition and markets. These requirechanges of the dominant paradigm by which the productive enterprise ismanaged. ‘Management of technology focuses upon how technologicalchange can be managed to improve the competitiveness of the businessenterprise. This focus is resulting in some major alterations in the man-agement paradigm by which competitive enterprises should be managed’(p. 66).
The modern practice of management of technology should take thefollowing trends into account:
• production economies of scope are equally important with economi-es of scale, and production automation should be appropriately bal-anced between hard and soft automation (depending upon productvolumes and product lifetimes),
• multi-core-technology product lines will have shorter product life-
Volume 10 · Number 1 · Spring 2012

46 Slavko Dolinšek and Peter Štrukelj
times and should be planned as generations of products (paced bythe most rapidly changing critical technology), and the organiza-tion must be flexibly organized for rapid and correct response,
• world markets and technology are now global, and enterprisesshould be globally based to ‘think globally and act locally’ (Khalil2000, 68–70).
Based on conclusions of the National Science Foundation workshopon management of technology, Khalil (2000, 73) stresses that rapidchange in technology will very likely intensify in the 21st century. Thefollowing changes are expected to occur:
• technological complexity is expected to increase,
• technology fusion will be more pronounced. Technologies from onediscipline will cross-fertilize technologies of other disciplines, thusenhancing the level of performance of technology,
• a diffusion of information and communication technology willcontinue into the future. Mergers and acquisitions of information-and communication technology firms are expected to increase,
• the emerging technologies, particularly molecular biology andcomputer information technology, will have a major impact on in-dustry and on all walks of life. Applications of genetic engineering,biotechnology and nanotechnology are expected to change existingindustries and create new markets. These emerging technologiesare expected to find many applications in the health industry, inagriculture, and in human and animal genetics,
• technology life cycles for high-tech industries are becoming muchshorter. This trend will continue in the future, enabling closer link-age and better harmonization of business and technology strategies.
Conclusions and Discussion
In the paper, we provided our conception of technology that is verysimilar to other predominating conceptions of technology in the (man-agement of technology) literature. However, some minor elements arepresent in our conception, which are not explicitly presented in otherconceptions. We also clearly stated what our empirical base was, uponwhich we conceptualized technology. A question to be further inves-tigated is whether our empirical criterion is whether we sufficient orshould add some other relevant empirical material and accordinglymodify our conception.
Managing Global Transitions

Technology, Wealth and Modern Management of Technology 47
In the paper, we explained a general and principal relationship be-tween technology and wealth in a society. While there is a lot of litera-ture on the relationship between technology and economic growth, thereis not so much literature on the fundamental relationship between tech-nology and capitalism (and its forms of wealth) or technology and real-socialism (and its forms of wealth) or between technology and anotherpast or possible future socio-economic order (and its forms of wealth).Economic growth is by itself a very abstract and dubious determination(organisms grow, while economic orders do not grow, but are instituted,executed, enforced, implemented), and in different socio-economic or-ders so called ‘economic growth’ means very different things.
Regarding our conception of technological capability, it should bestressed that this is only a proposed conception and that it is based onour previous conception of technology itself. Other researchers shouldexamine our conception of technological capability and verify if this con-ception convincingly grasps technological practice and technological ca-pability in modern companies. In their practice, companies and otherorganizations and institutions do not speak so much of technologicalcapability (as they do of technology), so an organization’s technologicalcapability is more of a theoretical concept in the mot academic field,albeit a fundamental one.
We live in a society of increasingly fast and various technologicalchanges and advancements, so the challenges for modern mot practiceare thus also constantly changing. In the paper, we have presented somegeneral and most notable challenges. However, this list could go on andon and could include more and more specific trends and challenges. Oneof the constant mot tasks is to scan, analyze and foresee such challenges.
Notes
1 Facts about rapid technological advancements in the last decades arestartling. To name only a few; there has been more information pro-duced since 1960 than during the previous 5,000 years and informationsupply available to us doubles every 5 years (Pritchett in Khalil 2000, 2–3).Gordon Moore, a cofounder of Intel Corporation, has predicted that mi-crochips will double in power and halve in price every 18 months (Isaacsonin Khalil 2000, 3). Subsequently, Intel succeeded in fulfilling this predic-tion.
References
amgen. 2010. ‘An Introduction to Biotechnology.’ http://wwwext.amgen.com/science/biotechnology_introduction.html
Volume 10 · Number 1 · Spring 2012

48 Slavko Dolinšek and Peter Štrukelj
Arnold, E., and B. Thuriaux. 1997. ‘Developing Firms’ Technological Capa-bilities. Technopolis Ltd.’ http://www.technopolis-group.com/.../094_Capabilities_970707.pdf
Bell, E. R. J., D. R. Kingham, and A. Powell. 1992. ‘Technology Audit:Methodology and Case Example.’ Paper presented at TechnologyTransfer and Implementation Conference (tti ’92), London, 6–8 July.
Bhutto, A. 2008. A Dynamic Technological Capability (dtc) Model for theNext Generation of Technology Evolution. Nottingham: The Notting-ham University Business School.
Boeing. 2009. ‘The Boeing Company 2009 Annual Report.’ http://www.envisionreports.com/ba/2010/27525ja10e/index.html
Burgelman, R. A., M. A. Maidique, and S. C. Wheelwright. 1998. Strate-gic Management of Technology and Innovation. 2nd ed. New York:McGraw-Hill / Irwin.
ExxonMobil. 2008. ‘2008 Summary Annual Report.’ Http://ir.exxonmobil.com/phoenix.zhtml?c=115024&p=irol-reportsAnnual.
———. 2009. ‘2009 Summary Annual Report.’ Http://ir.exxonmobil.com/phoenix.zhtml?c=115024&p=irol-reportsAnnual.
Fortune. 2010a. ‘Fortune 500: Our Annual Ranking of America’s LargestCorporations. Industries.’ Http://money.cnn.com/magazines/fortune/fortune500/2010/industries/.
———. 2010b. ‘Global 500: Our Annual Ranking of the world’s LargestCorporations.’ Http://money.cnn.com/magazines/fortune/global500/2010/full_list/.
Fusfeld, A. R. 1978. ‘How to Put Technology into Corporate Planning.’Technology Review 80 (6): 51–5.
Gallon, M. R., M. S. Harold, and D. Coates. 1995. ‘Putting Core Compe-tency Thinking into Practice.’ In Management of Technology: The Keyto Competitiveness and Wealth Creation, ed. T. M. Khalil, 235–47. NewYork: Irwin Mcgraw-Hill.
Garcia-Arreola, J. 1996. ‘Technology Effectiveness Audit Model: A Frame-work for Technology Auditing.’ Master’s thesis, University of Miami.
GegenStandpunkt. 1983. ‘Die Konkurrenz der Kapitalisten.’ http://www.gegenstandpunkt.com/vlg/konkurr/konkap.htm
iRobot. 2009. ‘Annual Report on Form 10-k.’ Http://investor.irobot.com/phoenix.zhtml?c=193096&p=irol-reportsannual.
Janeš, A., and S. Dolinšek. 2007. ‘Technology Audit Model (tam) and theImpact of Technology on Companies and Society.’ Paper presentedat the Seventh International Conference on ‘Enterprise in Transition,’Bol-Split, Croatia, 24–6 May.
Khalil, T. M. 2000. Management of Technology: The Key to Competitivenessand Wealth Creation. New York: Irwin Mcgraw-Hill.
Managing Global Transitions

Technology, Wealth and Modern Management of Technology 49
Lall, S. 1992. ‘Technological Capabilities and Industrialization.’ World De-velopment 20 (2): 165–86.
Microsoft. 2009. ‘Microsoft 2009 10-K Annual Report.’ http://www.microsoft.com/investor/reports/ar09/10k_dl_dow.html
Mohhamad, A. P., S. Razaee, F. Shayegh, and F. Torabi. 2010. ‘A Model ForTechnology Capability Assessment in r&d Centers.’ Paper presentedat the 14th International Oil, Gas & Petrochemical Congress, Teheran,19 May. http://www.microsoft.com/investor/reports/ar09/10k_dl_dow.html
Nanophase. 2010. ‘Technology.’ http://www.nanophase.com/technology/dispersion.aspx?
National Research Council. 1987. Management of Technology: The HiddenCompetitive Advantage. Washington: National Academy Press.
NewScientist. 2011. ‘Technology.’ http://www.newscientist.com/section/tech
Rubinstein, M. 1931. ‘Relations of Science, Technology, and EconomicsUnder Capitalism, and in the Soviet Union. Science at the Crossroads.’Paper presented at the International Congress of the History of Scienceand Technology, London, 29 June–3 July.
Rush, H., J. Bessant, and M. Hobday. 2007. ‘Assessing the TechnologicalCapabilities of Firms: Developing a Policy Tool.’ R&D Management 37(3): 221–36.
Sony. 2010. ‘Technology: Sony’s Technology Highlights.’ http://www.sony.net/SonyInfo/technology/
Technology Review. 2011. ‘Most Viewed.’ http://www.technologyreview.com/
Tesar, G., S. Ghosh, W. A. Steven, and T. Bramorski. 2003. Strategic Tech-nology Management: Building Bridges between Sciences, Engineeringand Business Management. London: Imperial College Press.
Van Wyk, R. 2004. Technology: A Unifying Code: A Simple and CoherentView of Technology. Cape Town: Stage Media Group.
Zedtwitz, M., and J. Jin. 2004. ‘The Process of Technological CapabilityDevelopment in the Mobile Telephone Manufacturing Sector: A Caseof Eastcom (China).’ Paper presented at iamot 2004, Washington, 3April.
Zeleny, M. 1986. ‘High Technology Management.’ Human Systems Man-agement 6:109–20.
Volume 10 · Number 1 · Spring 2012


Competitiveness of Frontier Regions and TourismDestination Management
Ksenija Vodeb
The competitiveness of border regions is often lower than the com-petitive ability of a country’s interior regions. Mostly being areas thatmark the end of one entity and the beginning of another, border regionsdemonstrate weaker economic performance. Tourism, as a method ofdevelopment, provides opportunities to develop tourism destinationsin places where tourism attractions and resources, and comparative andcompetitive advantages exist. This paper deals with models for assessingcompetitiveness in the field of tourism and destination managementas a vital element in achieving a higher level of competitiveness for atourism destination. Our research focuses on tourism supply providersin the border regions of Slovenia and Croatia. We assess their attitudeson tourism, regional competitiveness, and potential tourism destina-tions as the outcome of cooperation between the two countries. Resultsindicate the possibility of enhancing competitiveness through a strate-gic approach in planning and managing cross-border tourism destina-tions.
Key Words: tourism destination, competitiveness in tourism, tourismdestination management, cross-border cooperation
jel Classification: o10, m20
Introduction
There is no clear, standard definition of competitiveness or structuralapproach to understanding competition. According to Wei-Chang Hong(2008) there were published in refereed journals more than 4000 regularpapers regarding the competitiveness from 1985 to 2006.
Competitiveness is a concept present in the modern business opera-tions of all industries and sectors, and because of the indirect effect ithas on the profitability of business entities, it is the focus of study andanalysis for many researchers and professionals. Many authors seek todefine this concept and describe its regularities and basic characteris-tics to make it easier to understand and apply in practice. For example,Michael Porter (1996, 24; 1997, 38; 1998, 3), one of the greatest names in
Dr Ksenija Vodeb is an Associated Professor at the Faculty of TourismStudies, University of Primorska, Slovenia.
Managing Global Transitions 10 (1): 51–68

52 Ksenija Vodeb
this field who has, for decades, sought to penetrate the essential truth ofcompetitiveness, claims that competitiveness has become a central pre-occupation of the states and industries of every nation.
Porter’s generic competitive strategies (1996) were generally acceptedin the theory of competitiveness until Poon (1993) introduced the tourismpoint of view. She is rather critical with respect to Porter’s generic com-petitive strategies, since for her, these are inadequate tools to explorecompetitive success for tourism players. His analysis is, according toPoon, more applicable to the manufacturing sector than to services(Vanhove 2005).
All authors agree upon and venture from the same starting point:the changing environment. Research (Huang 2006; Jogaratham and Law2006; Jurowski and Olsen 1995) has shown the environment in the sphereof tourism and hospitality to be uncertain, unstable and highly change-able. Given this state of high complexity, organisations must activelystrive to carry out environmental scanning consistently. They must con-tinuously ask themselves: ‘What is happening around us, and how doesit affect our business?’ by collecting, analysing and interpreting data andinformation from political, socio-cultural, technological, environmentaland competitive organisational domains (Teare and Olsen 1999, 105).
Despite numerous studies on and much debate about the competitive-ness of tourism destinations, cross-border areas have been neglected forthe most part. Specific reasons do exist, however, as to why it is essentialto examine these regions more closely. These are (in our case) the abun-dance of tourism attractions in the observed area, the interest displayedby guests and tourism-supply providers, the level to which an integratedtourism product is interesting to third markets, and the opportunity ofvalorising borderland regions in compliance with the principles of sus-tainable tourism development.
Cross-border cooperation is of obvious importance for the mutualstrengthening of the tourism industries of neighbouring countries (Grun-dy-Warr and Perry 2001, 64).
In this paper, we take a look at the possibilities of cross-border collab-oration in enhancing the competitiveness of tourism destinations fromthe perspective of borderland tourism-supply providers.
Competitiveness Assessment Models
Because of the concept’s remarkable pervasiveness and complexity, itsactual occurrence will, to a substantial extent, depend upon the way it is
Managing Global Transitions

Competitiveness of Frontier Regions and Tourism Destination Management 53
assessed. Ritchie and Crouch (1993, 27ff) conclude that certain aggregatemeasurements can be applied in general economic management, but arenot very useful in analysing and managing international competitivenessin tourism. They report that studies on the factors used in defining andassessing the competitiveness of a country have uncovered the potentialimpact that these factors have on the ability of a country to compete onthe tourism market, and on enhancing its integrative abilities for inter-national competitiveness.
In Slovenia, competitiveness has been explored on the example oftourism and hotel companies (Nemec Rudež 2004, 45). Recently thecompetitive analysis for Slovenia as a destination was made using an in-tegrated model. The result shows that Slovenia is more competitive in itsnatural, cultural and created resources, but less competitive in the man-agement of tourism and, according to the integrated model, demandconditions, with both uncompetitive elements reducing the Sloveniantourism industry’s ability to add value (Gomezelj Omerzel and Mihalic2008).
Considering how interlaced tourism is with other activities and be-cause of a tendency to either neglect or over-emphasise the indirect ef-fects of tourism on the economy, some authors (Mihalic 2002, 2) callfor caution in assessing the tourism competitiveness of any country. Incurrent studies, the competitiveness, that is, the significance of tourismis analysed on the basis of physical indicators (number of overnights,number of guests), the tourist trade’s share in the domestic product, andthe importance of tourism for the country’s balance of payments. Theauthors point out the difficulty in defining the tourism sector, because itcomprises companies from various classes of the existing statistical clas-sification, and often what is analysed is only the performance of hotelcompanies, and not the competitiveness of tourism mediators and or-ganisers.
In an international setting, we can refer to Porter’s competitivenessmodel from 1990, which has had a huge impact in the economic lit-erature. His study is based on explaining why some companies in cer-tain branches or market segments are capable of successfully competingwith foreign rivals. Here, Porter distinguishes between the activities ofindividual companies and determinants, which he calls ‘national advan-tages.’ A company’s performance depends upon the existence of com-petitive advantages (e. g. lower production costs or product differentia-tion). Companies need to develop generic strategies based on either of
Volume 10 · Number 1 · Spring 2012

54 Ksenija Vodeb
the two determinants, while the selection of a strategy will be based onthe response of management to the five factors of competitiveness (FiveCompetitive Forces Analysis) – the power of customers and suppliers,the threat of potential entrants and substitutes, and rivalry among com-panies (Porter 1998, 314).
The World Economic Forum has provided the so-called wef model,which claims that every economy has, at its disposal, certain inputs orcompetitiveness factors, which, combined in a certain way, may generateuseful output. These competitiveness factors include (Mihalic 2002, 3):
• domestic economic power (macro economic indicators of the econ-omy),
• internationalisation (participation in international business),
• the government (support of government policies to competitive-ness),
• finances (capital market development, quality of financial services),
• infrastructure (level of development, adequacy),
• management (innovativeness, profitable business),
• science and technology (scientific and research abilities, the successof basic and applicative research),
• people (the availability and qualifications of the work force).
This model has not been applied to the field of tourism.The model of the greatest interest to us is the Calgary tourism com-
petitiveness model developed by Ritchie & Crouch (1993, 48) mentionedearlier. Their model focuses on the following competitiveness factors:
1. Destination Appeal – how appealing or unappealing a destinationis.
2. Destination Management – sales efforts and managerial efforts.
3. Destination Organisation – organisational structures, strategic al-liances.
4. Destination Information – information system, research.
5. Destination Efficiency – price-to-quality ratio, productivity.
The authors presented the model in 1993 in the form of a hypothesisand conducted tests. The model is still being perfected.
The authors underline the importance of information as a basis fordecision-making for tourism managers. Destinations that collect and use
Managing Global Transitions

Competitiveness of Frontier Regions and Tourism Destination Management 55
information efficiently are deemed to have the ability of improving theircompetitive positions.
The Calgary Tourism Competitiveness model (Ritchie and Crouch1993, 50) looks like this:
1. Destination prosperity = fn competitiveness (sector 1, sector 2,tourism . . .)
2. Tourism competitiveness (tc) = fn (how appealing or unappealinga destination is [Appeal])
(destination management [Mgmt])(destination organisation [Org])(destination information [Info])(destination efficiency [Effic])
3. Appeal = fn (appealing, unappealing destination) [Attract] [Deter]
4. Mgmt = fn (marketing efforts, managerial efforts)[Mktg] [Manager]
5. Org = fn (Destination Management abilities, strategic alliances)[dmo] [Alliance]
6. Info = fn (internal management information systems, researchabilities) [mis] [Research]
7. Effic = fn (integrative experience, productivity) [ioe] [Prod]
The Keyser-Vanhove model of tourism competitiveness provides agreater opportunity for including external factors, in particular, gov-ernment policies, into a competitiveness analysis. The general opinionamong economists today is that while tourism may contribute to increas-ing the wealth of a country, practical examples warn us that this is notalways necessarily so. This has to do with those destinations that are notsuccessful in transforming tourism into a profitable industry or manageto do so only in the short run. Vanhove (2005, 115) points out that bene-fits from tourism development depend upon the competitive position ofa country’s tourism sector on the international tourism market. That iswhy he believes the first step in analysing competitiveness to be an analy-sis of a country’s competitive position, which, in fact, involves analysingcomparative advantages (factors). This is about identifying factors suchas the vicinity of tourism generating markets, pristine nature, favourableprices, etc., which is followed by an analysis of tourism traffic indicatorsand an analysis of factors that are actually comparative advantages. Thesecond step involves analysing the below factors (Vanhove 2005, 73):
Volume 10 · Number 1 · Spring 2012

56 Ksenija Vodeb
• macro economic factors,
• supply factors,
• transport,
• demand factors,
• tourism policies.
This basis is used to identify the comparative advantages and weak-nesses of a destination or country.
Mihalic (2002, 5) points out that quantitative indicators such as thenumber of overnights and the number of guests cannot be the basis ofany serious economic analysis into the competitiveness and performanceof the tourist trade. The evidence she provides to support this is thediscrepancy between the foreign currency inflow index and the foreign-tourist overnights index, which shows that foreign currency inflow is,to a substantial extent, independent of the number of foreign-touristovernights. She goes on to prove that a difference exists between the in-dexes of revenue, profit and guest numbers, confirming her hypothesisthat tourism analysis cannot be based (exclusively) on physical-turnoverindicators, because of the ability of tourism companies to generate a sub-stantial part of their revenues from activities that are not directly relatedto tourists and tourist expenditure.
Tourism Destinations and Competitiveness
Destinations are defined as competitive tourism unities caught betweenmarkets and the needs of guests, local factors and companies or products(Bieger 2000, 35; Laws 1995, 56; Pechlaner 1999, 332; Kušen 2000, 314).
Magaš (2000, 58) defines a tourism destination as a spatial unit, ap-pealing in terms of tourism, which can be shaped as a tourism site,tourism resort, tourism area or tourism region. This definition is givenfrom a geographical perspective, whereas his definition from the contex-tual aspect of a tourism destination states (Magaš 1997, 21): A tourismdestination is an optimum combination of fixed and variable factors andopportunities for tourism activities aligned with market preferences andindependent of administrative boundaries.
A tourism destination, in its simplest terms, is a particular geographicregion within which the visitor enjoys various types of travel experiences(Goeldner and Ritchie 2006).
Ritchie and Crouch (in Pedro Bueno 1999, 322) argue that competi-tiveness in destinations depends on their capacity (knowledge) to createconditions for market competition among enterprises.
Managing Global Transitions

Competitiveness of Frontier Regions and Tourism Destination Management 57
Pechlaner (1999, 334), however, makes the point that only by creat-ing unique competitive advantages is it possible to convince tradition-ally oriented destinations in the advantages of globalisation: the opti-misation of organisation services, specialisation through cooperation,quality-offensive by suppliers and related industries, and lesser depen-dence on a small number of markets through internationalisation.
Determining a destination’s competitiveness entails determining gen-eral conditions such as marketplaces, locations and companies. It is be-coming clear, however, that destination competitiveness depends on theperspective of potential guests, and not on result-oriented indicators thatprovide only a view of the situation and offer very poor support to adestination’s development. Finally, destination appeal also depends onthe perspective of potential guests, making it necessary for a destinationto exhaust all opportunities possible in effectively entering the market-place and to impact on service quality by directly approaching serviceproviders (Pechlaner 1999, 337f).
Preferences and trends of the tourism market are highly changeablebut essential for the competitiveness of the destination. Campbell andHarald (2009) warned that there is an increasing demand for new prod-ucts in tourism. Lower cost no longer means low service and low quality.Attention has moved towards providing high quality products at a rea-sonable price. Tourism has become a mature industry with a focus onwhat the tourist wants and with the emphasis on innovation as an in-strument for creating new and memorable experiences.
The time for new a concept has come: the time for coopetition. It isbeyond the competition and cooperation that we used to know earlier. Itis an innovative approach in planning and organizing the tourism desti-nations, not only in border regions.
First introduced in 1995, coopetition is emerging as an importantmeans to facilitate economic growth through tourism. The definitionof this word is the need for cooperation among tourism destinationsin order to better market the tourism product effectively and meet thecompetition at the regional or global level (Edgell, Del Mastro, Smithand Swanson 2008).
Tourism Destination Management and Competitive Strategies
When speaking of destination management, we are referring to destina-tion management strategies, which are of great interest here and deserveto be looked at more closely.
Managing a destination as a combination of competitive products on
Volume 10 · Number 1 · Spring 2012

58 Ksenija Vodeb
the marketplace calls for a direct relationship with entrepreneurs con-cerned with supply, on the one hand, and with organisational and finan-cial preconditions, on the other, to facilitate the development of a com-petitive market and increase destination appeal (from the perspective ofpotential guests). Being different from the competition also guaranteesguest satisfaction (Pechlaner 1999, 337).
Swarbrook and Horner (2001, 64) point out the importance of des-tination management, the responsibilities of which are divided amongdifferent organisations. Each of these, depending on their competenciesand level of operations, contributes to achieving guest satisfaction in adestination. They include central government agencies, regional govern-ment agencies, associated public-private partnership organisations, pri-vate companies, and universities and faculties. Manete and Cerato (1999,187) define destination management as the organisation of tourism prod-ucts linked to market segments that are targeted based on tourism de-velopment strategies. Poon (1993, 288) argues that destinations shouldapply competitive strategies to accelerate the development of a new andsustainable tourism. These strategies involve:
• giving the environment top priority;
• placing tourism in a leading position;
• reinforcing distribution channels on the marketplace, and
• building a dynamic private sector.
The strategic approach is to ensure solutions with synergistic effects.When the strategic planning of a destination is grounded on the resourcebase that a given area possesses, in order to develop partnerships betweendifferent interest groups (the home public, government, industries) it isnecessary that we single out the advantages with which we are competingon the market, that is, which we provide to our market segment with anequivalent scale of attractions and appeal that the destination has to offer(Hunt 2000, 137).
Survey Results and Discussion
This survey was conducted within the framework of a doctoral disserta-tion on the topic ‘Tourism Management in Designing the Tourism Of-fering in Border Regions.’ We explore the attitudes of tourism supplyproviders in the borderland regions of Slovenia and Croatia, the so-calleddecision-makers, on matters of cross-border cooperation and increasing
Managing Global Transitions

Competitiveness of Frontier Regions and Tourism Destination Management 59
the competitiveness of the tourism offering by forming integrated jointtourism products.
The questionnaire consisted of 41 questions, some containing sec-ondary questions, making a total number of 65 variables.
The hypothesis tested in this research reads:
h1 The competitive ability of cross-border regions on the internationalmarket increases with the increase in the degree of cooperation.
The questionnaire contained ten contextual sets of questions used toassess the attitudes and opinions of our targeted respondents. A five-point Likert scale was employed for the measurement of notions.
The questionnaire used to collect data was self-administered. The sur-vey was simultaneously conducted in all seven borderland areas betweenSlovenia and Croatia according to the number of addresses of tourism-supply providers obtained over the Internet. The planned sample forCroatia consisted of 272 respondents. We collected 68 properly com-pleted questionnaires, giving a 25% response rate. The planned samplefor Slovenia consisted of 327 respondents. The response rate was 22. 6%with only 74 properly completed questionnaires collected. This fairly lowresponse rate is attributed to changes of addresses and activities, as wellas to a lack of interest for participating in the surveys, as we learned fromtelephone calls to most of the respondents who failed to send us a com-pleted questionnaire.
The questionnaire primarily targeted ‘small-scale’ tourism-supplyproviders (owners of hotels, restaurants, holiday-flats, motor-camps,private farms; tourism associations, cultural clubs; airports; nature parkmanagers; sports-equipment rentals in a destination, etc.). We foundtheir addresses on the Internet, as part of the tourism offering of indi-vidual regions. Addresses of all tourism-supply providers were taken intoconsideration providing they met the established criteria (being locatedin the border regions and providing any type of tourism offering).
The data analysis methods can be divided into two groups:
• data analysis using factor analysis, and
• basic statistical methods (descriptive statistical methods, mean val-ues and frequencies).
In factor analysis we explore the association among variables by seek-ing to reveal a new number of variables (smaller than the number mea-sured) representing that which is common to the variables examined. Inour case, the objective was to identify the variables affecting cross-border
Volume 10 · Number 1 · Spring 2012

60 Ksenija Vodeb
table 1 Data for Croatia – tourism in the destination
Item av 1 2 3 4 5
1. attitude on development 4.01 1.5 5.9 11.8 51.5 29.4
4. tourism’s impact on development 4.70 0 0 0 29.4 70.6
21. involvement of residents in decision-makingon tourism
4.30 0 1.5 1.5 61.8 35.3
22. tourism strategy 3.45 1.5 13.2 29.4 50 5.9
table 2 Tourism issues in the destination
Item av 1 2 3 4 5
3.1 too few attractions 2.88 11.8 32.4 22.1 23.5 10.3
3.2 traffic links 2.33 33.8 26.5 19.1 13.2 7.4
3.3 access to information 2.44 23.5 32.4 26.5 11.8 5.9
3.4. distinctiveness of the destination 2.51 23.5 29.4 25 16.2 5.9
3.5 identity 2.48 25 23.5 35.3 10.3 5.9
3.6 tourism services and facilities 3.11 11.8 22.1 23.5 27.9 14.7
3.7 negative attitude of residents 2 42.6 29.4 16.2 8.8 2.9
3.8 residents are not interested in being involvedin tourism
2.35 23.5 38.2 23.5 8.8 5.9
3.9 information not made available to residents 2.58 19.1 30.9 30.9 10.3 8.8
3.10 other 2.73 7.4 14.7 75 2.9 0
cooperation. We tested variable grouping and the number of factors untilan optimum result was achieved: the largest possible number of originalvariables in meaningful combinations and with high intercorrelations(over 0.40 in the factor matrix). Variables with the highest positive val-ues were attributed to individual factors.
A factor analysis was made of all questionnaires (142). The descriptivepart of data analysis was conducted separately for Slovene respondentsand for their Croatian counterparts to allow for a comparison of averagevalues.
We see that the item tourism’s impact on development has the high-est average value (av) (4.70), with 70.6% of responses having maximumvalues (highly positive). This indicates that respondents are aware of theextent to which tourism can facilitate development in their region, i. e.they see tourism as a method of development.
With regard to tourism issues in their destinations, respondents gave
Managing Global Transitions

Competitiveness of Frontier Regions and Tourism Destination Management 61
table 3 Assessing destination competitiveness using the Calgary model
Item av 1 2 3 4 5
34.1 appeal 4.32 0 0 4.4 58.8 36.8
34.2 management 2.92 4.4 30.9 30.9 29.4 4.4
34.3 organization 2.66 10.3 35.3 35.3 16.2 2.9
34.4. information 2.88 4.4 25 50 19.1 1.5
34.5 efficiency 3.01 2.9 32.4 29.4 30.9 4.4
table 4 Residents’ attitudes towards tourism
Item av 1 2 3 4 5
24.1 the operations of most companies are tourism-related
3.57 5.9 27.9 4.4 26.5 35.3
24.2 residents want more tourists 4.17 2.9 5.9 10.3 32.4 48.5
24.3 local residents are not tolerant towards tourists 1.60 61.8 22.1 11.8 2.9 1.5
24.4. residents see no promising outlook for theirinvolvement in tourism
2.05 44.1 26.5 11.8 14.7 2.9
24.5 regional competitiveness can be enhancedthrough cooperation
4.13 1.5 1.5 14.7 47.1 35.3
responses that differ highly, but show no substantial deviations. The itemservices and facilities of the tourism offering have the highest av (3.11).Interestingly, in most responses (42.6) the item negative attitude of resi-dents was rated as 1 (Not an issue at all). Generally speaking, not one ofthe items measuring Tourism Issues in the Destination showed any visibledeviations.
In assessing destination competitiveness according to the Calgarymodel, the highest av was measured for the item appeal (4.32), for which58.8% responded with a rating of 4 (Satisfied), and as many as 36.8%,with a rating of 5 (Fully satisfied). The item efficiency (av 3.01) shows32.4% of respondents to be dissatisfied. Some dissatisfaction is also evi-dent with the items management and organisation.
The highest av was measured for the item residents want more tourists(4.17), followed by regional competitiveness can be enhanced through coop-eration (4.13). Almost half (47.1%) of all respondents gave the latter itema rating of 4 (I largely agree). About 48.5% agree that residents want moretourists. The sharpest deviation was recorded for the item local residentsare intolerant towards tourists, with 61.8% of respondents opting for 1 (Istrongly disagree).
Volume 10 · Number 1 · Spring 2012

62 Ksenija Vodeb
table 5 Data for Slovenia – tourism in the destination
Item av 1 2 3 4 5
1. attitude on development 3.82 0 13.5 16.2 44.6 25.7
4. tourism’s impact on development 4.62 0 0 1.4 35.1 63.5
21. involvement of residents in decision-makingon tourism
4.18 0 1.4 6.8 63.5 28.4
22. tourism strategy 2.95 5.4 24.3 41.9 25.7 2.7
table 6 Tourism issues in the destination
Item av 1 2 3 4 5
3.1 too few attractions 2.83 18.9 18.9 33.8 16.2 12.2
3.2 traffic links 2.39 28.4 28.4 24.3 13.5 5.4
3.3 access to information 2.71 13.5 31.1 32.4 16.2 6.8
3.4. distinctiveness of the destination 3.01 6.8 31.1 29.7 18.9 13.5
3.5 identity 2.91 12.2 25.7 29.7 23 9.5
3.6 tourism services and facilities 3.06 9.5 31.1 20.3 21.6 17.6
3.7 negative attitude of residents 2.83 10.8 37.8 17.6 24.3 9.5
3.8 residents are not interested in being involvedin tourism
3.22 12.2 16.2 21.6 36.5 13.5
3.9 information not made available to residents 3.16 12.2 13.5 35.1 24.3 14.9
3.10 other 3.00 5.4 4.1 82.4 1.4 6.8
In this dimension, the results recorded are very similar to those ob-tained from Croatian respondents. With an av of 4.62, the item tourism’simpact on development ranks first, with as many as 63.5% reporting thisimpact to be highly positive. The lowest av was measured for the itemcooperation is planned for in the tourism strategy (2.79), testifying to thepoor knowledge of relevant information.
In measuring Tourism Issues in the Destination, no drastic departuresfrom the results of Croatian respondents were observed. Indeed, the re-sponses of the Slovene group are even more strongly divided, so thatwe cannot speak of having identified any particular problems. Sadly, thehighest av was measured for the item residents not interested in becominginvolved in tourism (3.22), yet 36.5% of respondents perceive this item asan important tourism issue in their destinations.
Similar results were obtained in this dimension in both groups. Theresponses of the Slovene group to the item destination appeal (an av of3.89, and 59.5% of respondents reporting their satisfaction) are very close
Managing Global Transitions
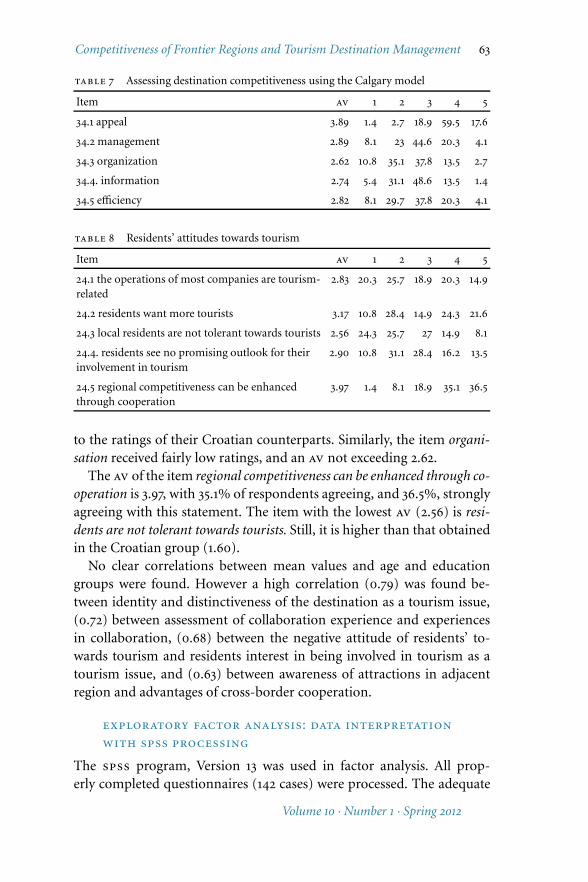
Competitiveness of Frontier Regions and Tourism Destination Management 63
table 7 Assessing destination competitiveness using the Calgary model
Item av 1 2 3 4 5
34.1 appeal 3.89 1.4 2.7 18.9 59.5 17.6
34.2 management 2.89 8.1 23 44.6 20.3 4.1
34.3 organization 2.62 10.8 35.1 37.8 13.5 2.7
34.4. information 2.74 5.4 31.1 48.6 13.5 1.4
34.5 efficiency 2.82 8.1 29.7 37.8 20.3 4.1
table 8 Residents’ attitudes towards tourism
Item av 1 2 3 4 5
24.1 the operations of most companies are tourism-related
2.83 20.3 25.7 18.9 20.3 14.9
24.2 residents want more tourists 3.17 10.8 28.4 14.9 24.3 21.6
24.3 local residents are not tolerant towards tourists 2.56 24.3 25.7 27 14.9 8.1
24.4. residents see no promising outlook for theirinvolvement in tourism
2.90 10.8 31.1 28.4 16.2 13.5
24.5 regional competitiveness can be enhancedthrough cooperation
3.97 1.4 8.1 18.9 35.1 36.5
to the ratings of their Croatian counterparts. Similarly, the item organi-sation received fairly low ratings, and an av not exceeding 2.62.
The av of the item regional competitiveness can be enhanced through co-operation is 3.97, with 35.1% of respondents agreeing, and 36.5%, stronglyagreeing with this statement. The item with the lowest av (2.56) is resi-dents are not tolerant towards tourists. Still, it is higher than that obtainedin the Croatian group (1.60).
No clear correlations between mean values and age and educationgroups were found. However a high correlation (0.79) was found be-tween identity and distinctiveness of the destination as a tourism issue,(0.72) between assessment of collaboration experience and experiencesin collaboration, (0.68) between the negative attitude of residents’ to-wards tourism and residents interest in being involved in tourism as atourism issue, and (0.63) between awareness of attractions in adjacentregion and advantages of cross-border cooperation.
exploratory factor analysis: data interpretation
with spss processing
The spss program, Version 13 was used in factor analysis. All prop-erly completed questionnaires (142 cases) were processed. The adequate
Volume 10 · Number 1 · Spring 2012

64 Ksenija Vodeb
table 9 Factor loading of individual items of cross-border cooperation dimensions
Item f1 f2 f3 f4
Cooperation and integrated tourism offering
13. considering collaboration 0.721
17. assessment of collaboration experience 0.710
16. experiences in collaboration 0.695
8. willingness to collaborate 0.649
18. ideas on integrated product 0.625
11. being part of an integrated product 0.595
7. advantages of cross-border cooperation 0.581
10. increasing business through cooperation 0.576
6. awareness of attractions in adjacent region 0.551
12. compatibility of tourism offerings 0.550
19. knowing potential strategic partners 0.541
28. being more competitive as part of integrated product 0.527
21. involving residents in decision-making regardingtourism
0.512
5. previous involvement in cooperation 0.497
24.5 enhancing regional competitiveness throughcollaboration in tourism
0.482
33.4 representing interests as a function of tourismorganizations
0.448
Continued on the next page
number of correlations in the database matrix justified choosing fac-tor analysis. The Bartlett Test, used to statistically test the existence ofcorrelation among variables, showed important correlations within thecorrelation matrix. The value of the Kaiser-Meyer-Olkin (kmo) Mea-sure of Sampling Adequacy was 0.814 for the variables selected. This isan excellent measure of sampling adequacy. The initial number of fac-tors was selected with regard to theory-based expectations. Because thefactors had not been empirically tested, their number was expected todrop. In choosing the number of factors, we took into account propervalue, the percentage of explainable variances, and the scree plot. Thescree plot showed that the possible number of factors ranged from twoto five; however, because of proper values higher than 1, four factorswere identified. For this number of factors and the final selection ofvariables, the explainable variances amount to 53.920%. Solutions us-
Managing Global Transitions

Competitiveness of Frontier Regions and Tourism Destination Management 65
table 9 Continued from the previous page
Item f1 f2 f3 f4
Residents
3.7 adverse attitude towards tourism 0.707
3.8 residents not interested in becoming involved intourism
0.702
24.4 residents see no promising outlook for theirinvolvement in tourism
0.617
24.3 tolerance of residents towards tourists 0.588
3.9 residents not informed on opportunities for becominginvolved in tourism
0.510
Assessing destination competitiveness
34.3 destination organization 0.635
34.2 destination management 0.562
34.4 destination information 0.558
34.5 destination efficiency 0.497
Functions of destination tourism organisations
33.3 marketing 0.528
33.1 developing ideas and destinations competitivenessstrategies
0.520
33.2 developing and shaping the offering 0.496
ing five, four and three factors were also tested, but did not give suchadequate results as the selected solution with four factors. In decidingwhich variables to keep, we were guided by the principle of commu-nalities values (above 0.4) and high factor loading coefficients (above0.3). The variables that remained are listed in table 9. The analysis pro-cess showed that it was necessary to exclude 25 variables of a total of 53(taken into account in this analysis – their total number is 65, but 12 wereprocessed descriptively) due to low communalities or low factor loadingcoefficients.
The four retained dimensions of cross-border cooperation (with 28
items), resulting as factors in the exploratory factor analysis are pre-sented in table 9. We have named the first dimension Cooperation andIntegrated Tourism Offering (f1); the second, Residents (f2); the third,Destination Competitiveness (f3), and the fourth, Functions of Destina-tion Tourism Organisations (f4).
The third (f3) and fourth (f4) factors, together with two items (28
Volume 10 · Number 1 · Spring 2012

66 Ksenija Vodeb
and 24.5) confirm the hypothesis stating that the competitive ability ofcross-border regions on the international market increases with the increaseof the degree of cooperation. This is, of course, confirmation that the re-spondents who were engaged in this survey believed that the competitiveability of cross-border regions increases with the increase in the cooper-ation degree.
Conclusion
Sometimes the competitiveness of border regions could be weaker thanthe competitiveness of, say, a country’s central regions, because of theperipheral position of borderlands, the disruption that a border gen-erally carries with all its connotations, and because of all issues arisingout of this (depopulation, unemployment, poor development). Becausetourism destinations are not necessarily restricted or disrupted by na-tional and other borders, but their boundaries are determined by touristperceptions, i. e. tourist needs and wants linked to a given tourism des-tination, we predict that in the borderlands between Slovenia and Croa-tia we will see an increase in tourism competitiveness providing effec-tive cross-border cooperation. Through enhanced cooperation the spe-cific cross-border tourism destinations could be created in places wheretourism offerings are compatible. This is indicated by the results of oursurvey, in which we have measured the variable of the possibilities ofenhancing destination competitiveness. As a result of this concept, wepropose the development of an integrated tourism offering in places inwhich the offering, i. e. tourism attractions are compatible, and in whichtourism demand exists. To this end, it would be beneficial to investigatethe opinions and attitudes of tourists as yet another dimension, withoutwhich developing a tourism offering would be meaningless.
The results from the survey were analysed together for all seven cross-border areas because we wanted to catch the general condition of theissue. That is why we haven’t got any different opinion from area to area,which represents a certain limitation in this research.
This survey has shown that, in the field of research, tourism has beenrecognised as a method of developing border regions. It also shows thatcompetitiveness assessments using the Calgary model have given simi-lar results on both the Croatian and the Slovene side. The awareness ofrespondents regarding the development function of tourism in borderregions is at a very high level. Destination appeal received the highestrating, and destination organisation the lowest, in both cases. In other
Managing Global Transitions

Competitiveness of Frontier Regions and Tourism Destination Management 67
words, there is no dispute regarding destination appeal. More problem-atic is the sphere of destination organisation, which comprises destina-tion management and destination development strategies.
Our recommendations deriving from the results to tourism develop-ment stakeholders are to start cooperation between the tourism indus-try and local community, as both can gain much from reasonable jointtourism cross – border products. Of course, no instantaneous changes inmarket position are possible, but nor are they necessary. The local resi-dents like to live in places that are attractive to tourists but should havea more active role in tourism development. We therefore suggest grad-ual enrichment of the tourism offerings regarding sustainability issuesthrough cross-border cooperation and a joint development of cross bor-der areas between Slovenia and Coratia.
References
Bieger, T. 2000. Destination Management and Tourism Organization. Mu-nich and Vienna: Oldenbourg.
Campbell, C. T., and J. Harald. 2009. ‘Developing Southern Mediter-ranean Tourism: The Interface Between Strategy and Sustainability.’In Trends and Issues in Global Tourism, edited by R. Conrady and M.Buck, 137–53. Berlin: Springer.
Edgell, D. L., M. A. Del Mastro, G. Smith, and J. R. Swanson. 2008. TourismPolicy and Planning: Yesterday, Today and Tomorrow. Oxford: ElsewierButterworth Heinemann.
Goeldner, C. R., and J. R. B. Ritchie. 2006. Tourism: Principles, Practices,Philosophies. 10th ed. Hoboken, nj: Wiley.
Gomezelj Omerzel, D., and T. Mihalic. 2008. ‘Destination Competitive-ness – Applying Different Models: The Case of Slovenia.’ TourismManagement 29 (2): 294–307.
Grundy-Warr, C., and M. Perry. 2001. ‘Tourism in an Inter-State Border-land: The Case of the Indonesian-Singapore Cooperation.’ In Inter-connected Worlds: Tourism in Southeast Asia, edited by T. Peggy, T. C.Chang, and K. C. Ho, 64–83. Oxford: Elsevier Science.
Huang, L. 2006. ‘Building up a b2b e-Commerce Strategic Alliance Modelunder an Uncertain Environment for Taiwan’s Travel Agencies.’ Tour-ism Management 27 (6): 1308–20.
Hunt S. D. 2000. A General Theory of Competition, Resources, Competences,Productivity, Economic Growth: Marketing for a new Century. Thou-sands Oaks, ca: Sage.
Jogaratham, G., and R. Law. 2006. ‘Environmental Scanning and Informa-tion Source Utilization: Exploring the Behaviour of Hong Kong Hotel
Volume 10 · Number 1 · Spring 2012

68 Ksenija Vodeb
and Tourism Executives.’ Journal of Hospitality and Tourism Research30 (2): 170–90.
Jurowski, C., and M. D. Olsen. 1995. ‘Scanning the Environment of TouristAttractions.’ Journal of Travel and Tourism Marketing 4 (1): 71–96.
Kušen, E. 2000. ‘Skrb za turisticku atrakcijsku osnovu: postojece stanje imetodološki okvir.’ Turizam 48 (3): 313–34.
Laws, E. 1995. Tourism Destination Management: Issues, Analysis and Poli-cies. London: Routledge.
Magaš, D. 2000. Razvoj hrvatskog turizma: koncepcija dugorocnog razvoja.Rijeka: Adamic.
———. 1997. Turisticka destinacija. Opatija: Hotelijerski fakultet.Manete, M., and M. Cerato. 1999. ‘Razumijevanje destinacije kao sustava:
prijedlog metodologije.’ Turizam 47 (3): 188–210.Mihalic. T. 2002. ‘Konkurencnost slovenskega turisticnega gospodarstva.’
http://www.sigov.si/zmar/sgrs/diskusij/turizem.htmlNemec Rudež, H. 2004. Intelektualni kapital v slovenskih turisticnih pod-
jetjih. Ljubljana: Ekonomska fakulteta.Pechlaner, H. 1999. ‘Konkurentnost alpskih destinacija izmedu pritiska
tržišta i problema prilagodavanja.’ Turizam 47 (4): 332–44.Pedro Bueno, A. 1999. ‘Konkurentnost u turizmu i uloga Španjolske
Državne uprave: primjer pokrajine Valencije.’ Turizam 47 (4): 316–32.Poon, A. 1993. Tourism, Technology and Competitive Strategies. Walling-
ford: cab International.Porter, E. M. 1996. The Competitive Advantage of Nations. New York: The
Free Press.———. 1997. La strategia competitiva – analisi per le decisioni. Translated
by G. Lorenzoni. Bologna: Editrice Compositori.Porter. M. E. 1998. The Competitive Advantage of Nations. London: Macmil-
lan.Ritchie, J. R. B., and G. I. Crouch. 1993. Competitiveness of International
Tourism: A Framework for Understanding and Analysis; Competitive-ness of Long Hould Destination. St. Gallen: aiest.
Swarbrook, J., and S. Horner. 2001. Business Travel and Tourism. Oxford:Butterworth-Heinemann.
Teare, R., and M. Olsen. 1999. International Hospitality Management: Cor-porate Strategy in Practice. London: Longman.
Vanhove, N. 2005. The Economics of Tourism Destinations. Amsterdam: El-sevier; Boston: Butterworth-Heinemann.
Wei-Chiang Hong. 2008. Competitiveness in the Tourism Sector: A Compre-hensive Approach from Economic and Management Points. Heidelberg:Physica-Verlag.
Managing Global Transitions

Human Capital Constraints in South Africa:A Firm-Level Analysis
Ewert P. J. KleynhansJohannes Riaan Labuschagne
This paper examines human capital constraints in the South Africaneconomy, and the austerity of these constraints on firms in the coun-try. The two key human capital constraints explored in this article arethe inadequately educated workforce and labour market distortions.Regression analysis was applied to examine determinants of increasedlabour productivity in manufacturing firms. Education and labourmarket distortions were found to have a varying influence on outputper worker. Principal Component Analysis (pca) of the explanatoryvariables achieved similar results. This study found that the highest per-centage of the total variance is explained by latent variables that incor-porate education, training, compensation, region and Sector EducationTraining Authority (seta) support and effectiveness.
Key Words: human capital constraints, productivity, efficiency, labour,education, manufacturing, South Africa
jel Classification: d24, j24
Introduction
Since 1998, the government has shown a renewed commitment to im-prove human capital in South Africa. Investment in education has sincereceived more funding than any other function in government (Na-tional Treasury 1999–2010). Recent Global Competitiveness Reports re-veal, however, that an inadequately educated workforce and restrictivelabour regulations are the biggest threats to South Africa’s competitive-ness (Schwab, Porter and Lopez-Claros 2006, 334). Fedderke (2006, 26)also states that in South Africa, human capital accumulation contributesless towards economic growth than in several other countries, and thatthe lack of quality education plays a major role in this phenomenon.
Gary Becker, Murphy and Tamura (1990, s13) regard human capitalas embodied knowledge and skills. The accumulation of human capi-
Dr Ewert P. J. Kleynhans is a Professor at the School of Economics,North-West University, South Africa.
Johannes Riaan Labuschagne is a Research Associate at the School ofEconomics, North-West University, South Africa.
Managing Global Transitions 10 (1): 69–86

70 Ewert P. J. Kleynhans and Johannes Riaan Labuschagne
tal leads to economic development because economic development de-pends on advances in technological and scientific knowledge. Humancapital can also be defined as all acquired characteristics of workers, asunits of labour, which make them more productive (Filler, Hamermeshand Rees 1996, 64). For the purpose of this study, the concept of humancapital is depicted as both the unequal quality of labour between com-peting firms and constraints within the labour market. Some economicgrowth accountants, like Fabricant and Solow (as quoted by Griliches1997, 331), suggest that economic growth is not only explained by con-ventional labour and capital measures, but also by the changing qualityof the labour force. Similarly, this current study argues that ‘human cap-ital’ is responsible for changes in total factor productivity and ultimatelyoutput among competing manufacturing firms.
The South African labour market is characterised by sharp segmenta-tion, high levels of unemployment and relatively low informal employ-ment. Rogerson (2008, 75) states that the reason for this could be thatSouth Africa’s regulatory compliance cost is higher than in other devel-oping countries. The main problem is the perception that over-protectivelabour regulations deter employees from employing additional workers,and that this increases the costs associated with employment. Interna-tional experience also indicates that flexible labour market characteris-tics and sufficient state support are some of the main determinants ofemployment and productivity (Natrass 2003, 15). This paper aims to de-termine the impact that the above-mentioned constraints have on firmsin the South African manufacturing sector.
The next will review the relevant literature and motivate the perspec-tive of this study, while the third discusses the survey and its analysis,describing the severity of these constraints. In the fourth section, regres-sion analysis will be estimated on enterprise survey data collected by theWorld Bank. The fourth will also contain a Principal Component Anal-ysis (pca) to determine underlying trends in the explanatory variablesused in the regression analysis. The last section will contain concludingremarks and a summary on all the relevant findings of this paper.
Literature Study and Theoretical Rationale
In economic theory, the Solow growth model explains that increases insavings and technological innovation lead to higher levels of output, in-vestment and capital per person (Colander and Gamber 2002, 142). Theendogenous growth theory differs from the Solow model in that inputs
Managing Global Transitions

Human Capital Constraints in South Africa 71
are defined more broadly in order to encompass accumulated capitalsupply and ‘human’ capital.
According to Cypher and Dietz (2009, 224), the 1950s and 1960s wereperiods of optimism in terms of global convergence. Economic modelssuggested that slower population growth and rapid investment in physi-cal and human capital could in the long run contribute to convergence.However, Barro and Sala-I-Martin (1992, 242) found a divergence be-tween countries from the nineteen seventies and eighties onward.
To explain how investment in education forms part of human cap-ital, Schultz (1960, 571) proposed that education should be treated asan investment in man and the consequences as a form of capital, inother words ‘human capital’. Efforts by government to promote smalland medium-sized businesses (smmes) have mainly three pillars: to pro-mote entrepreneurship, to create a fertile environment and to increasecompetitiveness and capacity (Rogerson 2008, 61). Improvements in hu-man capital underlie all three these pillars, and explain the importanceof human capital in business development.
Survey work done by Chandra et al. (2001, iv) revealed that in 1999,30 to 45 per cent of smmes indicated a skills shortage. Only 24 to 30
per cent of firms with more than five workers had formal skills training,and ten per cent of firms with fewer than five workers had formal skillstraining. Kraak (2003, 678) explains that the number of specialised skilledgraduates (e. g. engineers and technicians) is extremely low when takeninto account that enrolment has shown dramatic increases.
While most studies on human capital focus on the supply and de-mand trends of skilled individuals and government programmes, thisstudy considers the influence that human capital development has onproductivity (output per worker) in South African firms. The followingsection describes the survey and the data that were utilised in the currentstudy.
Analysis of Firms in the World Bank Survey
This analysis is based on data gathered by the World Bank enterprisesurvey on productivity and investment climate in South Africa. The sur-vey targeted establishments located in the cities of Johannesburg, CapeTown, Port Elizabeth and Durban in the following industries (accordingto isic revision 3.1): all manufacturing, construction, retail, hospitality,transport, storage, communication and computer-related activities. Af-ter careful consideration, four industries were eliminated for the pur-
Volume 10 · Number 1 · Spring 2012

72 Ewert P. J. Kleynhans and Johannes Riaan Labuschagne
table 1 Labour regulations and workforce education as obstacles
Workforce education Labour regulation
Small Medium Large Small Medium Large
No 67 49 41 75 59 47
Minor 20 23 25 15 23 30
Moderate 5 19 20 5 10 18
Major 5 7 11 5 6 4
Severe 3 2 3 0 2 1
notes Based on World Bank survey and authors’ own calculations.
pose of this study. The analysis will focus on manufacturing establish-ments and therefore wholesale, retail, hotel and it establishments havebeen eliminated from the dataset. For the purpose of this study, a sampleof 720 establishments will be used to analyse constraints and develop-ments among South African manufacturers. Next, the severity of theseconstraints will be considered along with human capital development.
The requirement for establishments to be included in the survey wasa minimum of five full-time paid employees. To further distinguishbetween small, medium and large companies, scales were introduced.Small-sized companies ranged between five and 19 employees, medium-sized between 20 and 99 employees and large-sized companies with 100
or more employees. Small establishments formed 34.5 per cent of thesample population, while medium and large-sized establishments repre-sented 39.9 per cent and 25.6 per cent respectively.
The survey determined obstacles that firms face in doing business. Ta-ble 1 shows that firms in the survey did not experience immense prob-lems with labour regulations or labour force education. The majorityof small, medium and large firms indicated that these two aspects serveas either no or as minor constraints. These categories of constraints arebased on perception, with the variables either having no constraint (orimpact), or a limiting negative impact on firms in the survey. Regressionanalysis revealed that the quality of the workforce (measured as educa-tional attainment) has a positive relationship with output per worker inmanufacturing firms. The coefficients for labour regulations are not sta-tistically significant and will receive attention later.
Although the global competitiveness index, as well as other authorslike Kleynhans (2006, 58), indicated that labour regulations and inade-quately educated workers are the biggest obstacles facing South Africa,
Managing Global Transitions

Human Capital Constraints in South Africa 73
table 2 The top six obstacles
Obstacles Firm Size
Small Medium Large
Crime 26 35 32
Access to finance 8 6 3
Corruption 5 7 6
Electricity 25 16 16
Poor educated workforce 3 10 10
Labour legislation 6 5 8
notes Based on World Bank survey and authors’ own calculations.
this survey found slightly different evidence. Further evidence revealedthat crime and electricity costs are the biggest threats to firms in the sur-vey (see table 3). Next were inadequately educated workers and labourregulations. In the following section, human capital development will beassessed via training and seta (Sector Education and Training Author-ity) initiatives.
human capital development: training and seta
support
The biggest problem in analysing the effectiveness of human capitaldevelopment initiatives, such as Sector Education Training Authority(seta), is the lack of quality data. Rogerson (2004, 769) explains thatdiscrepancies between national and provincial sources make findingsand analysing data difficult. The majority of studies on human capitalhave been done by using survey data on a firm level across the coun-try. This section compared findings from this study with evidence fromother relevant studies on human capital development and training.
Large firms enjoyed more support from seta, according to table 3,and are more likely to have official training programmes. Of small firmsin the survey, only 27.4 per cent have formal training programmes, whilefor medium and large establishments, the figure is 47.4 and 70.8 per centrespectively. The majority of firms indicated that they spend between oneand two per cent of their total sales on training. Seventy per cent of largeestablishments have formal training programmes, but only 26.5 per centenjoyed seta support. For small and medium-sized establishments, thefigure was 4.8 and 11.8 per cent respectively.
The need for ‘learning led’ competitiveness has become a global phe-
Volume 10 · Number 1 · Spring 2012

74 Ewert P. J. Kleynhans and Johannes Riaan Labuschagne
table 3 Average training programme and seta support (percentage)
Item Small Medium Large
Training programme(s) 27.4 47.4 70.8
Cost of training programme (as 1 to 2 % of sales) 19.4 35.2 50.2
seta support 4.8 11.8 26.5
notes Based on World Bank survey and authors’ own calculations.
nomenon, and changing ideas and environments pose as the biggestchallenge to establishments. Education, training and experience formthe most important aspects of competitiveness for all types and sizes offirms (Rogerson 2008, 61). The World Bank assessment of national smme
(Small, Medium and Micro Enterprises) programmes in 2006 indicatedthat it has not been successful in South Africa. Findings in this reportidentified an absence of training and education as the main stumblingblocks (World Bank 2006, 4).
Survey work done by Chandra et al. (2001, iv) revealed that during1999, 30 to 45 per cent of smmes indicated a skills shortage. Only 24
to 30 per cent of firms larger than five workers had formal skills train-ing, and ten per cent of firms with fewer than five workers had formalskills training. The most worrying aspect is that the amount spent oncrime prevention was bigger than the amount spent on training. Estab-lishments did not experience labour regulations as a constraint, as theyjust reduced their number of permanent employees. Chandra et al. (2001,41) also found usage and awareness rates of national training assistanceprogrammes to be five and eighteen per cent respectively.
Bhorat and Lundall (2004, 1039) found evidence that in-house train-ing schemes were preferred above outside training schemes. Eighty-fourper cent of firms in this survey invest in in-house training programmes,while the figure for outside training was twenty-six per cent. The lack offormal evaluation in these programmes also generates questions aboutthe quality of these training practices.
Firms that obtained seta support were asked to describe the effective-ness of the support they received, and this will next be reported.
Table 4 indicates mixed reactions to seta’s effectiveness and on aver-age it seems that seta support has very little influence, which is neithereffective nor ineffective. Large firms experience more support from seta;however, close to twelve per cent of the respondents reported that setawas in fact ineffective or very ineffective.
Managing Global Transitions

Human Capital Constraints in South Africa 75
table 4 seta effectiveness
Small Medium Large
Very effective 3.0 3.9 3.8
Effective 1.6 5.9 11.1
Neither effective nor ineffective 3.0 5.8 14.0
Ineffective 0.7 1.0 6.5
Very Ineffective 0.0 2.0 5.0
notes Based on World Bank survey and authors’ own calculations.
Results from the regression analysis also indicate that seta supporthas no significant influence on output levels in manufacturing firms inthe survey. Evidence from this paper and work done in other studiesshow that seta is an ineffective vehicle for promoting workplace edu-cation and training.
Empirical Analysis of the Quality of Human Capital
A variety of approaches can be found in the literature that explains hu-man capital and its role in economic growth. Two main features that sur-face in the majority of the studies surrounding human capital include thequality of education and labour market distortions. Those studies thatfocus on education identify four aspects that influence human capital,which include quantity, quality, inequality and institutional differences.Work done by Barro (2001), Checchi (2006) and Dessus (2001) explainseach one of these aspects.
Labour market distortions, on the other hand, can also be dividedinto four categories that influence human capital, namely labour marketrigidity, inappropriate bargaining, industry concentration and the mis-pricing of labour. These are the four key aspects that explain the role thatlabour market distortions may have on human capital. Authors who haveall described these aspects intensively are, for example, Fedderke (2005),Griliches (1997), Kingdon and Knight (2007) and Moll (1996), to name afew.
This section aims to determine the influence that the above-mentionedconstraints have on manufacturing firms in South Africa. The followingsections will establish the influence that these human capital constraintshave on productivity and output in manufacturing firms. Firstly, the es-timation of the regression equation will be explained, followed by theregression results and a Principal Component Analysis.
Volume 10 · Number 1 · Spring 2012

76 Ewert P. J. Kleynhans and Johannes Riaan Labuschagne
estimation of the multiple regression equation
on human capital
This section of the study aims to determine to what extent variations ofthe contributors to human capital can explain the variations in the out-put per worker. The dependent variable (Y) in this regression representsoutput per worker (total sales/total workforce). The independent or ex-planatory variables (Xs) will coincide with variables that are found inthe broad literature on human capital as described in the fourth sectionabove. Variables that represent educational attainment and labour mar-ket distortions will be created and used in the regression analysis. Someof the explanatory variables can also further be divided into categories,and dummy coding will be used to distinguish between them.
Equation (1) includes all ten of the explanatory variables selected forthe regression equation. To obtain the best possible fit, the equation hasbeen transformed into a Log-linear functional form. This type of modelis widely applied in the human capital literature (Asteriou and Hall2007, 164).
lnY (output-per-worker) = β1 + β2 (managers’-education)+ β3 (production-workers’-education) + β4 (labour-regulations)+ β5 (training) + β6 (seta-support) + β7 (seta-effectiveness)+ lnβ8 (compensation-production-workers)+ lnβ9 (compensation-managerial-workers)+ β10 (competition) + β11X (location) + εi. (1)
Multiple regression analysis estimates a line that best fits the data andhas the smallest possible residual values. The model, as indicated in equa-tion 1, was estimated in the following way. In the spss software pro-gramme, the backward mode of the stepwise method of regression wasselected. This mode is preferable to the forward mode due to its suppres-sor effects (Field 2005, 161). This method yielded the following results;there is a less than 0.1 per cent chance that the large F-ratio (20.08) hap-pened by chance alone, because p < 0.001 (Field 2005, 190). The coeffi-cient of determination (R2) indicates that 48 per cent of the variabilityof output per worker is explained by the explanatory variables in thismodel. The adjusted R2 value of 45.6 per cent is close to the model’s R2,and indicates that this model is a good generalisation of the dependentvariable.
Field (2005, 189) suggests that a Durbin Watson value (in this case1.685) close to two satisfies the Classical Linear Regression Model (clrm)
Managing Global Transitions

Human Capital Constraints in South Africa 77
assumption of independent errors. Next, the regression coefficients oftable 5 will be discussed, and the significance of each variable will beexplained.
regression results
Table 5 is a summary of the regression coefficients. The b-values (b) willbe used to explain the results obtained from this regression. Variableswith an asterisk (*) next to them indicate that the specific variable is sig-nificant at a five per cent level (or p < 0.05). This shows that the b-valueis significantly different from zero, and not equal to zero as describedin the null hypothesis. The Variance Inflation Factor scores (vif) in thelast column indicate whether an explanatory variable has a strong linearrelationship with other explanatory variables. This measure is used todetect multicollinearity in the model. This model does not suffer frommulticollinearity, as the vif scores are all less than ten (Field 2005, 175).
Managers’ education: For this variable, dummies were included. Thiswas to distinguish clearly between the different levels of education. Theb-values show that, compared to managers with primary education,secondary education and training is negatively related to the depen-dent variable (output per worker). Higher education seems to be pos-itively related to the dependent variable, although only the mba (Mas-ter’s of Business Administration degree in South Africa) dummy is sig-nificant.
Production workers’ education: The survey analysis found that on av-erage, production workers have between seven and twelve years of ed-ucation. This might explain why, relative to the reference group of zeroto three years of education, production workers with between seven andtwelve years of education have a positive relationship with output perworker. None of the dummies were statistically significant though.
Labour regulation as an obstacle: in the third section, it was shownthat on average labour regulations do not pose a major obstacle. The co-efficients suggest that when labour regulations pose a minimal or mod-erate obstacle, the dependent variable decreases. Large firms were alsoshown to experience more difficulty with labour regulations than smalland medium-sized firms. The positive relationship between labour reg-ulations as a major or severe obstacle and the dependent variable mightbe explained by the fact that large firms are better equipped to deal withlabour regulations. However, none of these variables are significant at thefive per cent level and these assumptions are made without absolute cer-
Volume 10 · Number 1 · Spring 2012

78 Ewert P. J. Kleynhans and Johannes Riaan Labuschagne
table 5 Regression coefficients
Item B Std error vif
Constant 1.904 0.214 —
Managers’ education
Secondary educationTrainingSome universityGraduatemba (South Africa)mba (foreign)Post-graduate (South Africa)Post-graduate (foreign)
–0.073–0.0220.0660.1360.191*0.0970.1570.341
0.0770.0730.0770.0740.0820.1020.1100.215
3.9765.4093.9545.6673.4891.9071.7621.139
Labour regulations
Minimal obstacleModerate obstacleMajor obstacleSevere obstacle
–0.025–0.0590.0390.052
0.0350.0480.0640.136
1.1901.1781.0781.065
Production workers education
4 to 6 years7 to 12 years≥13 years
–0.0060.044
–0.057
0.0700.0640.075
3.1964.8782.745
Continued on the next page
tainty. The reference group for this variable is labour regulations as noobstacle.
Training programme and Sector Education Training Authority (seta)support: The existence of training programmes has a negative relation-ship with the dependent variable, while seta support has a positive rela-tionship. These variables are both statistically insignificant. It is thereforenot clear whether the presence of training programmes or seta supportinfluences the dependent variable.
seta effectiveness: seta support was on average insignificant, beingneither effective nor ineffective. The coefficients show that seta effec-tiveness varies much. seta support contributes to the biggest increase inthe dependent variable. An interesting point is that seta support thatis very effective has a negative relationship with the dependent variable,and is statistically significant. seta support that is ineffective also has anegative relationship with worker output, but this coefficient is not sta-tistically significant. The influence of seta effectiveness on the depen-dent variable is therefore unclear, as the reference group for this variableis seta support that is very ineffective.
Managing Global Transitions

Human Capital Constraints in South Africa 79
table 5 Continued from the previous page
Item B Std error vif
Training
Yes –0.013 0.034 1.588
seta support
Yes 0.116 0.087 4.610
seta effectiveness
Very effectiveEffectiveNeither effective nor ineffectiveIneffective
–0.273*0.0440.074
–0.063
0.116*0.1060.0610.100
2.4863.1411.4111.370
Compensation
Production workersManagerial workers
0.635*0.254*
0.056*0.055*
1.8001.823
Location/Region
cape town
johannesburg
port elizabeth
0.117*0.216*0.112
0.053*0.044*0.063
2.1472.4321.624
Competition
1
2 to 5
>5
0.178*0.0850.115*
0.070*0.0480.046*
1.5102.8382.948
notes R2 = 48%, * p < 0.005.
Compensation of production and managerial workers: Both thesevariables have a positive relationship with the dependent variable, andare statistically significant. A one unit increase in the compensation ofproduction workers yields a greater increase in output per worker thanthat of managerial workers. The study also found a large compensationdifferential between production workers and managerial workers in thesurvey.
Competition: The coefficients for this variable suggest two scenarios.Firstly, firms that have a single competitor have the highest positive rela-tionship with the dependent variable. This may represent firms that aremonopolistic, as the reference group refers to firms with no competi-tors. Secondly, where there are more than five competitors in the samemarket, a positive relationship exists with the dependent variable. Thisimplies that increased competition has a positive impact on productiv-ity, as sales output per worker increases. This relationship is also statis-
Volume 10 · Number 1 · Spring 2012

80 Ewert P. J. Kleynhans and Johannes Riaan Labuschagne
tically significant, but smaller than in the first scenario. Where competi-tion takes place between two to five firms, the coefficient is positive butnot statistically significant.
Location (Region): This variable shows that compared to Durban,firms in Johannesburg and Cape Town have a greater relationship withthe dependent variable. These dummies are also statistically significant.For Port Elizabeth, the relationship is also positive but the coefficientis not statistically significant. Manufacturing output in this survey isalso location biased. Manufacturing firms in Johannesburg achieve muchgreater levels of output per worker than those in the other three cities.
This corresponds well with findings about increased industry concen-tration in the South African economy. Fedderke and Szalontai (2005, 9)found that the top five per cent of firms produce an increasing fraction oftotal output in various industries (up to 85 per cent in some industries).In a separate study, Naudé and Gries (2004) found that in South Africa,eighty-five per cent of manufactured exports come from twenty-two outof the possible three-hundred-and-fifty-four magisterial districts. In astudy done by Naudé (2006, 14), it was found that only KwaZulu-Natal(Durban area) and Gauteng (Johannesburg) were export orientated, andthat the ability to successfully manufacture goods in only a few areascaused migration to these areas where industries are more densely situ-ated.
In explaining this anomaly, international and national studies have in-dicated several potential contributing factors towards increased indus-try concentration. These factors include transport cost, infrastructure,specialisation, ports, technological spill-overs, resource endowments andother location essentials (Naudé 2006, 2).
The following section will apply Principal Component Analysis togenerate more information on the subject matter regarding the qualityof human capital in South Africa.
principal component analysis (pca)
Factor analysis is used to measure aspects that cannot be directly mea-sured. This analysis determines whether different variables are driven bythe same underlying trend (latent variable). This section applies the samevariables used in the previous section, and aims to identify groups orclusters of variables. These groups of variables (also called factors) willthen also be used in a regression analysis. The dependent variable (out-put per worker) in this regression analysis will be exactly the same as in
Managing Global Transitions

Human Capital Constraints in South Africa 81
the previous section. It should be noted that variables, which measure thesame underlying dimension or different aspects of the same dimension,should not be entered into the analysis simultaneously. Instead, only onevariable should be entered into the analysis. Therefore, the following twovariables have been omitted from the analysis: production workers’ levelof education and production workers’ compensation. It is assumed thatthese variables measure the same underlying trend as the variables thatmeasure the managers’ level of education and compensation.
After running the Principal Component Analysis in spss, the kmo
and Bartlett’s test produced a score of 0.677. Field (2005, 648) suggests aminimum score of zero point five, and that a score close to point sevenis a good score for this test. This test is also significant at the five percent level (p < .005), and indicates that there is some relationship be-tween the variables. After factor extraction, the rotation sums of squaredloadings indicate that three factors are present. These three factors alsocumulatively explain 60.7 per cent of the total variance. Factor 1 explains29.6 per cent of the total variance, while Factors 2 and 3 explain 18.5 percent and 12.6 per cent of the total variance respectively. After selecting anOrthogonal rotation (varimax) the rotated component matrix was esti-mated (table 6).
This matrix shows the factor loadings for each variable onto each fac-tor. There are two things to consider about this matrix. Firstly, factorloadings of less than 0.4 are not displayed. This is the reason why thereis no factor loading for the variable labelled ‘labour regulations’. Thisvariable does not load onto any of the three factors, and has little or noconnection with the other variables. Secondly, the variables are listed ac-cording to the size of their factor loadings. Note that these variables caneither have a positive or negative loading, and the number of variablesthat load onto each factor differs.
The next step is to identify common themes for all three factors. Thevariables that load onto Factor 1 all seem to relate to training and seta
involvement. Variables that load onto Factor 2 relate to the level of themanagers’ education, compensation as well as the number of competi-tors. Only one variable loads onto Factor 3, and this involves region.Next, the nature of the underlying themes for each factor will be labelled.Factor 1 can be labelled as ‘training,’ Factor 2 as ‘management’s compet-itiveness’ and the third factor as ‘region.’
Now that the explanatory variables have been reduced to three factorsthat measure three different underlying dimensions, a regression analysis
Volume 10 · Number 1 · Spring 2012

82 Ewert P. J. Kleynhans and Johannes Riaan Labuschagne
table 6 Rotated component matrix
Item Factors
1 2 3
Training supported by seta
Formal trainingseta effectiveness
0.930–0.8610.833
Managers’ educationManagers’ compensationNumber of competitors
0.7320.664
–0.592
Labour regulations
Region 0.964
notes kmo and Bartlett’s test = 0.677.
table 7 Regression analysis with factor scores
Item B Stderror
β vif
Constant 5.425 0.016
Factor score 1 ‘training’ 0.106* 0.016 0.221* 1.000
Factor score 2 ‘management’s competitiveness’ 0.190* 0.016 0.397* 1.000
Factor score 3 ‘region’ –0.077* 0.016 –0.160* 1.000
notes R2 = 23%, * p < 0.005.
is estimated. Again, the method of ordinary least squares (ols) estimatesa line that best fits the data. This line lies closest to all data points, andhas the smallest possible residual values. Low Variance Inflation Factor(vif) scores and a Durban-Watson score of 1.6 indicate that the modelsatisfies the Classical Linear Regression Model (clrm) criteria. Table 7
shows the results obtained from this regression.Both Factors 1 and 2 have a positive relationship with the dependent
variable that is statistically significant. Factor 3 has a negative relation-ship with the dependent variable, and is also statistically significant. Aone unit change in management’s competitiveness (Factor 2) will lead tothe greatest increase in the dependent variable (output per worker). Thisregression model has an R2 of 23 per cent; therefore 23 per cent of thevariability of output per worker is explained by the explanatory variablesin this model. This model is to some extent inferior to the model in theprevious section, which had an R2 of 48 per cent, and explained 48 percent of the variability of output per worker. The bottom line is that prin-
Managing Global Transitions

Human Capital Constraints in South Africa 83
cipal component analysis showed that output per worker in manufac-turing firms in the survey can be explained by three underlying factors.These are ‘training,’ ‘management’s competitiveness’ and ‘region.’ Next,concluding remarks will highlight the findings of this paper.
Conclusion
This paper explored potential human capital constraints in the SouthAfrican economy. Human capital constraints are aspects of human capi-tal that limit the productivity and effectiveness of the workforce. The firstsection indicated that an inadequately educated workforce and restrictivelabour regulations are the two major human capital constraints facingthe South African economy. The consequences of investing in educationwere shown to be a form of capital, namely human capital. Empirical evi-dence in the fourth indicated that there is a positive relationship betweeneducational attainment and output per worker and therefore productiv-ity. Managers with higher levels of education achieved higher levels ofoutput per worker from their labour force. The study also found thatthe existence of training programmes and the South African Sector Ed-ucation and Training Authority (seta) support had no significant influ-ence on output levels among firms in the survey. seta support was alsoshown to have minimal effect – neither effective nor ineffective influenceon firms in the survey. Small and medium-sized firms also experiencedvery little seta support compared to large firms.
The influence of labour regulations on manufacturing firms in the sur-vey was shown to be diminutive in the third section. In the Global Com-petitiveness Report, the World Economic Forum describes South Africanlabour regulations as restrictive. Formal sector employment is over pro-tected. However, this study found no significant evidence that suggeststhat labour regulations have an influence on the level of output amongmanufacturing firms in the survey. Other labour market distortions alsoexist in the South African economy. These include high levels of unem-ployment, an oversupply of semi-skilled production workers and a con-centration of industries and firms that are location biased. Firms situatedin the city of Johannesburg were shown to have the highest output perworker figures.
For South Africa to achieve higher levels of growth and output, a newapproach to human capital development is needed. The current globalmarket is one that is ‘learning led’ and the demand for newer, more ad-vanced products and services is very large. Recent initiatives to develop
Volume 10 · Number 1 · Spring 2012
84 Ewert P. J. Kleynhans and Johannes Riaan Labuschagne
human capital in South Africa have proven to be unsuccessful. Govern-ment initiatives as well as labour unions are more focussed on the redis-tribution of wealth and improved working conditions than on increasedcompetitiveness, efficiency and productivity. This leads to a decreasingmarginal productivity as employment increases.
Results from a Principal Component Analysis (pca) revealed that theexplanatory variables used in the regression analysis measure three un-derlying dimensions, namely training, management’s competitivenessand region. The first two latent variables (underlying dimensions) ex-plain the majority of the total variance. The importance of quality hu-man capital measures, such as the level of education, compensation andtraining, therefore highlights the importance of quality human capitaldevelopment in the South African manufacturing sector.
Scope for further research on human capital and its influence on pro-ductivity will depend greatly on the availability of improved measures todefine the quality aspect of human capital. Countries, firms and even in-dividuals possess different levels of financial and human capital, and it isthe mixture of these two forms of capital that brings forth productivity.Policy recommendations include:
• A restructuring of seta to improve support to manufacturing firmsin South Africa. The consequence of discriminatory policies inSouth Africa’s past has led to inequalities in the country’s labourmarket. This paper proposes that seta investigates a two-fold ap-proach that distinguishes between low-skilled (unemployed), andhighly-skilled professional employment. Such an approach wouldnot only be more targeted, but could also deal with the issues ofunemployment and skills shortages at the same time. To addressthe effectiveness of these bodies, authorities should explore the linkbetween sectoral training and productivity. This could be done viathe inclusion of targets of a qualitative nature, and not merely quan-titative measures such as the number of candidates that completetraining and development;
• Additional measures to create a more flexible bargaining process insectors that are sensitive to changes in labour legislation. This in-cludes a general decentralisation of bargaining in the manufactur-ing sector; and
• Implementing structures to evaluate and regulate human capital de-velopment initiatives that incorporate training, education and busi-ness development.
Managing Global Transitions

Human Capital Constraints in South Africa 85
A final aspect that needs attention is the unavailability of reliable dataon human capital development, and the absence of measures to assessdevelopments in human capital formation and quality education.
References
Asteriou, D., and S. G. Hall. 2007. Applied Econometrics: A Modern Ap-proach. New York: Palgrave.
Barro, R. J. 2001. ‘Human Capital and Growth.’ American Economic Review91 (2): 12–7.
Barro, R. J., and S. Sala-I-Martin. 1992. ‘Convergence.’ Journal of PoliticalEconomy 100 (2): 223–51.
Becker, G. S., K. M. Murphy, and R. Tamura. 1990. ‘Human Capital, Fer-tility, and Economic Growth.’ Journal of Political Economy 98 (5): s12–s37.
Bhorat, H., and P. Lundall. 2004. ‘Employment, Wages and Skills Devel-opment: Firm-Specific Effects – Evidence from a Firm Survey in SouthAfrica.’ South African Journal of Economics 72 (5): 1023–56.
Chandra, V., L. Moorty, J. P. Nganou, B. Rajaratnam, and K. Schaefer.2001. ‘Constraints to Growth and Employment in South Africa: Evi-dence From the Small, Medium and Micro Enterprise Firm Survey.’World Bank Discussion Paper 15, World Bank, Washington.
Checchi, D. 2006. The Economics of Education: Human Capital, FamilyBackground and Inequality. Cambridge: Cambridge University Press.
Colander, D. C., and E. N. Gamber. 2002. Macroeconomics. EnglewoodCliffs, nj: Prentice Hall.
Cypher, J. M., and J. L. Dietz. 2009. The Process of Economic Development.London: Routledge.
Dessus, S. 2001. ‘Human Capital and Growth: The Recovered Role of Ed-ucation Systems.’ Working Paper 2632, The World Bank, Social andEconomic Development Group, Washington.
Fedderke, J. W. 2005. ‘Technology, Human capital and Growth.’ WorkingPaper 27, University of Cape Town, School of Economics, Cape Town.
———. 2006. ‘From Chimera to Prospect: South African Sources of andConstraints on Long Term Growth, 1970–2000.’ Policy Paper 1, Uni-versity of Cape Town, School of Economics, Cape Town.
Fedderke, J., and G. Szalontai. 2005. ‘Industry Concentration in SouthAfrican Manufacturing: Trends and Consequences.’ Africa RegionWorking Paper 96, University of Cape Town, Cape Town.
Field, A. 2005. Discovering Statistics Using spss. 2nd ed. London: Sage.Filler, R. K., D. S. Hamermesh, and A. Rees. 1996. The Economics of Work
and Pay. New York: HaperCollins.Griliches, Z. 1997. ‘Education, Human Capital and Growth: A Personal
Perspective.’ Journal of Labour Economics 15 (1): 330–44.
Volume 10 · Number 1 · Spring 2012

86 Ewert P. J. Kleynhans and Johannes Riaan Labuschagne
Kingdon, G., and J. Knight. 2007. ‘Unemployment in South Africa 1995–2003: Causes, Problems and Policies.’ Journal of African Economies 16
(5): 813–48.Kleynhans, E. P. J. 2006. ‘The Role of Human Capital in the Competitive
Platform of South African Industries.’ South African Journal of HumanResource Management 4 (3): 55–62.
Kraak, A. 2003. Human Resource Development Review: Education, Employ-ment and Skills in South Africa. Cape Town: hsrc.
Moll, P. 1996. ‘Compulsory Centralisation of Collective Bargaining inSouth Africa.’ American Economic Review 86 (2): 326–29.
Nattrass, N. 2003. ‘Unemployment and aids: The Social-DemographicChallenge for South Africa.’ cssr Working Paper 43, University ofCape Town, Centre for Social Science Research, Cape Town.
Naudé, C. 2006. ‘Measures of Manufacturing Industry Concentration: Im-plications for South Africa.’ Paper presented at the conference Accel-erated and Shared Growth in South Africa: Determinants, Constraintsand Opportunities, Muldersdrift, 18–20 October.
Naudé, W. A., and T. Gries. 2004. ‘The Economic Geography and De-terminants of Manufacturing Exports from South Africa.’ Paper pre-sented at the Conference on Growth, Poverty Reduction and HumanDevelopment in Africa, Oxford, 21–2. March.
National Treasury (South Africa). 1999. ‘Budget 1999: Budget Speech.’http://www.treasury.gov.za
———. 2010. ‘Budget 2010: Budget Speech.’ http://www.treasury.gov.zaRogerson, C. M. 2004. ‘The Impact of the South African Government’s
smme Programs: A Ten-Year Review (1994–2003).’ Development South-ern Africa 21:765–84.
———. 2008. ‘Tracking smme Development in South Africa: Issues ofFinance, Training and the Regulatory Environment.’ Urban Forum 19
(1): 61–81.Schultz, T. W. 1960. ‘Capital Formation by Education.’ Journal of Political
Economy 68 (3): 571–83.Schwab, K., M. E. Porter, and A. Lopez-Claros. 2006. The Global Compet-
itiveness Report. New York: Palgrave.World Bank. 2006. ‘South Africa: Enhancing the Effectiveness of Govern-
ment in Promoting Micro, Small and Medium Enterprise.’ Report forthe Department of Trade and Industry, Pretoria.
Managing Global Transitions
Corporate Leverage and Financial Decisionin the Indian Textile Industry
Ramachandran AzhagaiahSelvaraj Sathia
In the presence of market imperfections, leverage has the potential tohave an important influence on investment decisions. If a firm makesmoney on its borrowing (has favorable financial leverage), the share-holders realize higher earnings per share (eps) than would be the casein the absence of debt, as the debt-equity ratio (der) is a long termrisk measure. In the present study 25 textile firms, which are listed inBombay Stock Exchange are taken as a sample for the study periodfrom 2004 to 2008. The study reveals that the firms i. e. acm, afl, asl,basml, bcil, gsm, gdpm and gjml show significant growth rate infinancial, operating and combined leverage.
Key Words: capital structure, financial leverage, operating leverage,corporate leverage, financial decision, debt equity ratio
jel Classification: g30, g32, g35
Introduction
Financial Decision (fd) plays a crucial role in the survival of a firm.Business decisions of the firms in general and strategies in particularare molded by the business environment. Every businessman has to facetough competitions, uncertainty and risk prevailing in the trade. Exter-nal factors like the economic, political/regulatory, social, demographic,technological and natural factors which make up the opportunities forand threats to business, and internal factors like the resources, capabili-ties and goodwill of the organization, internal power relationships etc.,which decide the strength and weakness of the firm. The firm’s capitalstructure (cs), which is the mix of debt and equity is considered to beoptimum when the market value of the share is maximized. When theshareholders’ return is maximized with minimum risk the market value
Dr Ramachandran Azhagaiah is an Associate Professor in the KanchiMamunivar Centre for Post Graduate Studies, Pondicherry CentralUniversity, India.
Selvaraj Sathia is a Research Scholar in the Kanchi Mamunivar Centrefor Post Graduate Studies, Pondicherry Central University, India.
Managing Global Transitions 10 (1): 87–114

88 Ramachandran Azhagaiah and Selvaraj Sathia
per share will be maximized and the firm’s cs would be considered opti-mum. Once the financial manager is able to determine the best combina-tion of debt and equity, he must generate the appropriate capital throughthe best available sources. Hence, debt equity ratio (der) is determinedto ascertain soundness of the long-term financial policies of the firm.
corporate leverage (col)
In the presence of market imperfections, leverage has the potential tohave an important influence on investment decisions. Jensen (1986; 1989)argues that leverage limits managerial discretion over free cash flow andlowers the likelihood that resources are expended for negative net presentvalue investments. In business parlance, leverage refers to the relationshipbetween percentage of business changes in fixed cost and in earnings be-fore interest and taxes (ebit) i. e. operating profit (op). In other words,leverage results from the use of fixed cost assets or funds to magnify re-turns to firm’s owners. It is the employment of an asset or source of fi-nance for which the firm pays fixed cost or fixed return. Leverage maybe of three kinds: i. e. financial leverage (fl); operating leverage (ol); andcombined or composite leverage (cl).
fl reflects the fds of the firm. It refers to the use of funds obtained byfixed cost or fixed return securities such as debentures, bonds, preferenceshares etc. in the hope of increasing the return to equity shareholders.Favorable or positive leverage is said to occur when the firm uses fundsobtained at fixed cost to earn more than the fixed financing costs paid.Unfavorable or negative leverage occurs when the firm does not earn asmuch as the fixed financing costs.
If a firm is making money on its borrowing (has favorable fl), theshareholders are realizing higher earnings per share (eps) than would bethe case in the absence of debt. ol occurs where a firm has fixed cost thatmust be met regardless of the volume or value of sales. With fixed cost,the percentage change in operating profit affirming a change in sales isgreater than that of the percentage change in sales. In business terminol-ogy a high degree of ol, other factors held constant, implies that a rela-tively small change in sales results in a large change in ebit. The degreeof ol depends upon the amount of fixed elements in the cost structure,and it is the function of three factors, i. e. the fixed cost, the variable con-tribution margin, and the volume of sales. ol and fl combine them in amultiplicative form to bring about a more proportionate change in eps
for a given percentage change in activity. This is because the dispersion
Managing Global Transitions

Corporate Leverage and Financial Decision in the Indian Textile Industry 89
and risk of possible eps are increased. With the presence of fixed oper-ating costs and fixed financing costs, a given change in sales is translatedinto a larger relative change in eps through a two step magnificationprocess.
Literature Review
Prior empirical research on leverage shows that leverage can constraininvestment (Lang, Ofek, and Stulz 1996; Denis and Denis 1993). Merton(1974) suggested for highly leveraged firms, contingent claims. He pre-dicted that almost all firms’ value is in the hands of the debt holders. Asmall increase in cash reserves goes largely to increase the value of debt(and not equity value) and implies that the probability of bankruptcydecreases. Jensen and Meckling (1976) proposed that managerial owner-ship reduces their incentives to engage in non-optimal behavior. Firmswith higher investment in intangible assets tend to use less debt in theircs to reduce the agency costs associated with risky debt (Myers 1977). Forlow-growth firms, this means that growth adds value to the firm, whichincreases borrowing capacity. Operating fixed costs (in effect a capacityconstraint) could have an impact on the choice of fl (Huffman 1983).Mandelker and Rhee (1984) found a positive relationship between bothdegree of financial leverage (dfl), degree of operating leverage (dol)and systematic risk (sr).
Later, Huffman (1989) replicated the study of Mandelker and Rhee andalso found a consistent positive relationship between sr and dfl. Man-delker and Rhee and Huffman both tested to determine whether firmstraded off the amount of total leverage which they faced by substitut-ing one type of leverage for the other, and found evidence that firmswith low levels of dfl tend to have higher levels of dol and vice-versa.However, Huffman was, again, unable to re-confirm their findings withconfidence. Mandelker and Rhee found no statistically significant rela-tionships between the measures of leverage and the risk measures (onlythe correlation between dol and sr was significant).
Information asymmetry induces the pecking order of fds (Myers, Ma-jluf and Nicholas (1984)). Stulz (1988) argued that when leverage is in-creased because of the firm’s buying out other (passive) shareholders, thepercentage of non-insider shares that an acquirer would need to purchaseincreases. Gordon and Mackie-Mason (1990) found that, after two yearsfrom the reform, the 1986 Tax Reform Act (tra) produced a lower effecton the der than that predicted by a theoretical model of immediate full
Volume 10 · Number 1 · Spring 2012

90 Ramachandran Azhagaiah and Selvaraj Sathia
adjustment. Li and Henderson (1991) tested for the impact of both dol
and dfl on total risk. Similar to their result for sr, they found a signifi-cant positive relationship between total risk and dol, but could not con-firm a statistically significant relationship in the case of dfl. They alsofound a positive relationship between dfl and sr using the time-seriesestimates of degree of leverage measures suggested by O’Brien. However,they could not confirm that the inter-relationship between the two typesof leverage had any influence on sr. Choe (1991) tested the propositionthat substitution of short-term debt (std) for long-term debt (ltd) in-creases the expected returns of common stocks.
Ang (1992) argued that the relationship between size and leverage israther complex, and enough reasons can be found to justify both loweror higher leverage in (privately held) small firms when compared withlarger firms. Indeed, empirical evidence does not provide support fora clear and monotone relationship between size and leverage, althoughsmall firms generally show higher leverage ratios and make greater useof short-term financing than the larger firms. Whited (1992) found thatfirms with high leverage display a higher sensitivity of investment tocash flow. John (1993) presented evidence for firm-level determinants ofcash holdings, indicating that firms with higher costs of financial dis-tress and higher cash flow volatility hold significantly more cash, whilefirms with higher leverage, higher growth rates, a longer cash conver-sion cycle, and more tangible assets hold less cash. Raad and Wu (1994)found that stockholders of mergers financed with stocks suffer significantlosses.
Vogt (1994) found that the relationship between cash flows and in-vestment spending differs significantly between small and large firms.Smaller growth firms conform more to the pecking order behavior. Ra-jan and Zingales (1995) found that there is a significant relationship be-tween firms’ leverage and variables measuring firms’ size, asset tangi-bility, profitability and growth prospects, and that their relationships toleverage are broadly similar in each of the seven countries despite theirinstitutional differences. Lord (1996) inferred that dol, the ratio of netprofits to firm value, and the variability of unit output are all found to bepositively correlated with each of the three risk measures. The dfl, whilepositively related to total and unsystematic risk (ur), does not appearto be related to sr. Honohan (1997) advocated ‘speed limits’ to restrictthe rate of growth of banks’ loan portfolios. Kim, Mauer and Sherman(1998) inferred that cash holdings increase with a higher market-to-book
Managing Global Transitions

Corporate Leverage and Financial Decision in the Indian Textile Industry 91
ratio and higher cash flow volatility, revealing that cash holdings decreasewith firm size, leverage, the length of the cash conversion cycle, and theprobability of financial distress.
Parrino and Weisbach (1999) found that the agency costs of debt canbe so high that firms cannot raise funds and therefore forego profitableinvestment projects. Mahajan (1999) found three possible reasons for thedecline in stockholders’ wealth: changes in earnings, changes in beta, andchanges in variance of earnings after the announcements. Opler et al.(1999) suggested that firms with low debt levels tend to hold more cashbecause a low leverage ratio makes the firm less subject to market mon-itoring. Gelb (2000) found that firms with lower levels of managerialownership tend to provide more extensive disclosures in their annual re-ports, which suggests that managerial ownership mitigates agency costsand reduces investors’ information needs.
Gelb and Siegel (2000) found that firms with high levels of intangi-ble assets are more likely to emphasize dividend increase and stock re-purchase (which are generally perceived as signaling favorable invest-ment opportunities), instead of traditional accounting disclosures, as ameans of overcoming adverse selection. Chen, Chen and Su (2001) foundthat the management in Chinese listed firms always manipulates the ac-counting profit in order to cater to the return on equity (roe) require-ment made by the Chinese Securities Regulatory Commission (csrc);the roe is easier to be twisted by earning management. Benito and Whit-ley (2003) found evidence that the external finance premium postulatedby the ‘pecking order hypothesis’ has a non-linear relation with firms’capital leverage, where changes in leverage only affect the premium athigh levels of leverage.
Olafsson (2003) pointed out that even when cash flows received inthe future are assumed to be stochastic, resulting in a distribution forthe npv instead of a single number, the resulting framework does notprovide a basis for a decision-making tool as no assumptions have beenmade on attitudes to risk. Iona, Leonida and Ozkan (2004) treated a firmas financially conservative if it has both low leverage and high cash re-serves at the same time; they suggested that managerial ownership, boardcomposition, and to some extent, ownership concentration influence thelikelihood of firms to adopt a conservative financial policy. Faulkender(2004) reported that the determinants of cash holdings are somewhatdifferent; small firms tend to hold more cash as their leverage increases,possibly because they have limited access to the cm.
Volume 10 · Number 1 · Spring 2012

92 Ramachandran Azhagaiah and Selvaraj Sathia
Faccio, Lang and Young (2004) provided empirical evidence that inEurope, where the monitoring role of debt is effective due to the estab-lished and enforced capital market institutions, entrenched managers de-crease leverage; in contrast, in Asia, where the monitoring role of debt isless effective than in Europe, entrenched managers abuse debt. Ferreiraand Vilela (2004) reported that cash holdings are positively affected bygrowth opportunities and cash flows, whereas asset liquidity, leverage,bank debt, and firm size negatively impact cash holdings. Kytonen (2005)and Kim, Mauer and Sherman (2005) found that the funds allocation inthe firms, where controlling shareholders have high cash flow rights arebetter aligned with the investment opportunities and, therefore, moreefficient than in the firms where they have low cash flow rights. Francis,Khurana and Pereira (2005) found that firms with a greater external fi-nancing need to have higher voluntary disclosure levels. They also docu-ment that these firms benefit from higher voluntary disclosure by havinglower cost of both debt and equity capital (ec).
Leary and Roberts (2005) found that firms are more likely to increase(decrease) leverage if their leverage is relatively low (high), if their lever-age has been decreasing (accumulating), and if they have recently de-creased (increased) their leverage through past fds. Saibal (2005) sug-gested that the leverage ratio can serve as a useful signpost of asset qual-ity and second, the analysis points to the need to improve the collectionof data from the corporate sector.
Ruland and Zhou (2005) revealed a strong positive association be-tween leverage and the values of diversified firms. The values of special-ized firms do not increase with leverage. Faulkender and Wang (2006)inferred that the average marginal value of cash across all firms declineswith larger cash holdings, and higher leverage. Moon and Tandon (2007)found that the association between equity ownership and leverage is sig-nificant for low-growth firms, but not for high-growth firms. Li and Tang(2007) found that low fl actually improves the profitability, stock expan-sion ability and market value of listed firms; however, as an importantcapital resource for the existence and development of a firm, fl also hasa positive influence on the firm when increasing the debt to a certaindegree, revealing that large scale firms perform better on their profitabil-ity, the stock expansion ability, operational efficiency, financial elastic-ity and safety, while their market value is lower. Drobetz and Gruninger(2007) found that the market to book ratio is a proxy for both growth op-portunities and/or the importance of adverse selection costs, leading to
Managing Global Transitions

Corporate Leverage and Financial Decision in the Indian Textile Industry 93
competing hypotheses in a pecking order framework. Jugurnath, Stewartand Brooks (2008) provided evidence that der was positive and signif-icant in the us only; they also provided evidence that fl influences cci
in the us.The overall effect of leverage recapitalizations is to improve firm’s
value, as supported by the prior literature. However, the evidence alsopoints to a straightforward indirect cost of fl that has received rela-tively little attention in the literature. High leverage generates interestpayments that may be high relative to current levels of cash flow. Whenmanagers face substantial personal costs of financial distress, this can cre-ate incentives to emphasize investments that maximize the cash flow ofthe firm, possibly at the expense of undertaking investments with thehighest net present value. This effect of high leverage is likely to influencethe divisional allocation of investment within a firm. The estimates sug-gest that the increase in firm’s value around the recapitalization wouldbe larger in the absence of such changes in divisional allocation. In thisregard, the study adds to a wide literature emphasizing the indirect costsof debt financing.
Objectives and Hypotheses Development
statement of the problems
fd making is primarily concerned with developing the skills needed tomake the fds required in a rapidly changing corporate business envi-ronment. If the overall level of business activity is rising, most firms willneed more money to expand their operations. The need for additionallong-term funds will bring a firm to the money markets for either debtor equity funds. On the other hand, a decline in business activity mayallow a firm to cut back its operations and use its cash to retire debt orequity securities.
Therefore, the present study mainly analyses how far the level of cor-porate leverage (col) affects the fd making in the Textile industry inIndia. The debt equity ratio (der) is employed, which is the most com-mon indicator of col. In effect, this ratio signifies how much business isfinanced through debt vis-à-vis equity. A very high leverage ratio impliesgreater risk to present or future investors.
significance and scope of the study
Though many research studies have been undertaken in the field of coland fds, only very few studies have been undertaken to analyze the im-
Volume 10 · Number 1 · Spring 2012

94 Ramachandran Azhagaiah and Selvaraj Sathia
pact of col on fd. Therefore, the present study attempts to analyze theimpact of col on fd in the textile industry in India. The scope of thestudy is limited to the area of consumer textiles and industrial textilesonly. The study comprises an attempt to provide an empirical support tothe conjectured impact of leverage on fd.
research questions
The present study is proposed to seek answers to the following statedquestions:
• What is the significance of various leverages and fds?
• Is there a degree of relation between fl and fds?
• How far are the leverage and fds inter-related?
• How do the profitability and liquidity ratio influence the fd?
objectives and hypotheses of the study
The following are the objectives and hypotheses of the study:
• To analyze the impact of sales on ebit on selected textile firms inIndia.
• To study the variance ratios of investment and borrowings as wellas net worth and borrowings of selected textile firms in India.
• To study the various ratios of net worth and corporate leverage aswell as net worth and financial leverage.
• To associate the fl with the fd with respect to the progress of thefirm.
h10 There is no significant relationship between the sales and ebit as
well as the derived correlation coefficient from sales and ebit witheffect to leverage.
h20 There is no significant relationship between the investment and bor-
rowings with respect to leverages as well as fds.
h30 There is no significant relationship between the net worth and bor-
rowings with respect to leverages as well as fds.
h40 There is no significant relationship between the net worth and com-
bined leverage with respect to fds.
h50 There is no significant relationship between the net worth and fl
with respect to fds.
Managing Global Transitions

Corporate Leverage and Financial Decision in the Indian Textile Industry 95
Methodology
sources of data
The study used only secondary data, which are collected from the cmie
prowess (package). The data collected from this source have been com-piled and used with due care as per the requirements of the study.
sampling design
In the present study, 25 textile firms are chosen randomly from the listedfirms in Bombay Stock Exchange based on the adequacy of data for thestudy period i. e. from 2004–2008. The firms chosen are the mixture ofsmall, medium and large in sizes based on their capital.
tools for analysis of data
To analyze the data, statistical tools that have been used are correlationand regression methods to ascertain the best fitted model for makingfds.
Regression Analysis
1. The regression equation of X on Y is
X − X = rσx
σy(Y − Y),
rσx
σy=
∑xy
√∑y2
,
where X is the mean of X series, Y is the mean of Y series, andr(σx/σy) is known as the regression co-efficient of X on Y .
2. Regression Equation of Y on X:
Y − Y = rσy
σx(X − X),
rσy
σx=
∑xy√∑
x2,
where r(σy/σx) is known as the regression co-efficient of Y on X.
Considered the col as independent variable; fd as dependent vari-able, keeping other control variables constant.
period of the study and limitations
Period of the Study
The data used for the analysis relate to the selected textile firms for theperiod of 5 years on a yearly basis ranging from 2004 to 2008.
Volume 10 · Number 1 · Spring 2012

96 Ramachandran Azhagaiah and Selvaraj Sathia
Limitations
• The study is limited to 5 years’ data only; therefore a detailed trendcovering a lengthy period is not possible.
• The study is based on secondary data, which are collected from thecmie Prowess (package), hence the quality of the study dependspurely upon the accuracy, reliability and quality of the secondarydata.
• The study is confined to only 25 firms of the textile industry, whichare listed in Bombay Stock Exchange (bse).
significance of the textile industry in india
The Indian textile industry is estimated to be around usd 52 billion andis likely to reach usd 115 billion by 2012. The domestic market is likely toincrease from usd 34.6 billion to usd 60 billion by 2012. It is expectedthat India’s share of exports to the world would also increase from thecurrent four per cent to around seven per cent during this period. Indiahas overtaken the us to become the world’s 2nd largest cotton produc-ing country, after China, as per a study by International Service for theAcquisition of Agra-biotech Application. India is the largest exporter ofyarn in the international market and has a share of 25 per cent in worldcotton yarn exports and accounts for 12 per cent of the world’s produc-tion of textile fibers and yarn. The country (India) has the highest loomcapacity, including handlooms, with a share of 61 per cent in world loomage. India is the largest producer of jute in the world. It is the secondlargest producer of silk and the only country to produce all four varietiesof silk – Mulberry, Tsar, Ere and Muga. The primary contribution of theTextile Industry is export earnings for the country; the textile industryoccupies 16% of the country’s export earning. Industrial output sums upto 14% of total industrial production and contributes to approximately30% of total export products. In an effort to increase India’s share in theworld textile market, the Government of India has introduced a numberof progressive steps.
The Indian textile industry is striving to realize its full potential andface the emerging challenges of globalization and liberalization. Thusleveraging firms lead to borrowing, which leads to debt. The der is along run risk measure. Debt to equity compares debt to the owner’s in-vestment in the business. An increase in the debt-equity ratio increasesthe firm’s fl, because this makes additional debt financing available.
Managing Global Transitions

Corporate Leverage and Financial Decision in the Indian Textile Industry 97
table 1 fl of Textile Firms for the period 2004–2008
No. Name of the Firm 2004 2005 2006 2007 2008
1. Aditya Mills Ltd. 1.11 1 1 1 1
2. Alka India Ltd. 1.03 6.78 1 1 1
3. Ambika Cotton Mills Ltd. 1.39 1.30 1.31 1.89 1.58
4. Anjani Fabrics Ltd. 1.46 1.39 1.20 1.70 1.53
5. Arasan Syntex Ltd. 2.86 3.22 5.04 1.91 2.14
6. Arunoday Mills Ltd. 0.33 0.39 0.26 1 0.98
7. Asia Pack Ltd. 1 1 1 1 1.02
8. Bannari Amman Spinning Mills Ltd. 1.08 1.04 1.10 1.28 1.57
9. Birla Cotsyn India Ltd. 2 3.67 1.34 1.08 1.18
10. Blue Blends (India) Ltd. –0.45 1.04 1.01 2.47 0.58
11. Bombay Dyeing & Mfg. Co. Ltd. 1.34 1.41 0.86 1.64 0.49
12. Coimbatore Pioneer Mills Ltd. 0.78 0.48 0.11 1.01 0.69
13. Damodar Threads Ltd. 1.32 1.37 1.23 1.18 2.10
14. East India Commercial Co. Ltd. 2.67 1.46 1.19 1.17 1.21
15. Futura Polyesters Ltd. 11.87 3.62 0.98 2.10 2.21
16. Garden Silk Mills Ltd. 1.39 3.85 2.55 2.10 1.93
17. Gemini Dyeing & Printing Mills Ltd. 5.71 1.91 1.48 1.51 1.94
18. Gloster Jute Mills Ltd. 1.31 1.37 1.49 1.65 1.18
19. Indo Rama Synthetics (India) Ltd 1.18 1.33 1.36 1.97 12.94
20. Jindal Texofab Ltd. 1.39 1.49 0.54 3.37 5.70
21. Modern Threads (India) Ltd. 0.37 0.86 0.77 1.13 –0.79
22. Orient Craft Ltd. 1.14 1.41 1.41 1.49 2.12
23. Pondicherry Spinners Ltd. 0.28 1 0.93 1 1
24. Provogue (India) Ltd. 1.23 1.19 1.18 1.19 1.42
25. Veejay Lakshmi Textiles Ltd. 1.29 1.14 1.14 1.41 0.63
Firms with high debt ratios pay lower dividends, because they have al-ready committed their cash flows to make debt payments. The presentstudy is intended to analyze how far the leverage has impact on the fds,and to study the relationship between the firm’s fl and fd.
Industry Analysis and Discussion
The principal focus of the study is to analyze the effect of leverages andratios which help the (selected 25 textile firms) textile industry in India to
Volume 10 · Number 1 · Spring 2012

98 Ramachandran Azhagaiah and Selvaraj Sathia
take significant decisions in risky situations. The secondary data relatingto various facets of growth were analyzed with the use of appropriatestatistical tools. The results of the analysis are presented and interpretedin the following paragraphs:
The calculated value of F is compared with the table values for υ1 andυ1 at 5% and 1% level of significances. If the calculated values of F aregreater than the table values then the F ratio is significant, and h0 isrejected. On the other hand, if the calculated values of F are lower thanthe table values the null hypothesis is accepted.
financial leverage of textile firms
The fl is employed in the hope of increasing the return to commonshareholders and is used to measure the solvency of the firm and the abil-ity of a firm in order to test whether the firm can regularly pay interestagainst long-term borrowings. Table 1 shows the fl of 25 selected firms inIndia for the study period from 2004 to 2008. The firms, viz., Blue Blendsltd in 2004, Bombay Dyeing Ltd., in 2006, 2007, 2008, Coimbatore Pio-neer Mills Ltd in 2006, Futura Polyesters Ltd in 2004 and 2006, ModernThreads India Ltd in 2006 and 2008 all show negative fl. This indicatesthat they might have faced loss; however, these firms have shown a posi-tive fl for the remaining years of study. This reveals that these firms haveearned more than the financial commitment such as interest on borrow-ings they had in those years. The fl is exactly one for Aditya Mills Ltdfrom 2005 to 2008, Alka India Ltd from 2006 to 2008, Arunoday Mills Ltdin 2007, Asia Pack Ltd in 2004 to 2007, Pondicherry Spinners Ltd in 2005,2007 and 2008, which shows that these firms have shown a nil liability inrespect of interest.
Firms i. e. Alka India in 2005 (6.78), Arasan in 2004 (2.86), 2005 (3.22),2006 (5.04), 2008 (2.14), Birla in 2004 (2), 2005 (3.67), Blue in 2007 (2.47),Damodar in 2008 (2.10), East India in 2004 (2.67), Futura in 2005 (3.62),2007( 2.1), 2008 (2.21), Garden 2005 (3.85), 2006 (2.55), 2007 (2.10), Gem-ini in 2004 (5.71), Indo Rama in 2008 (12.94), Jindal in 2007 (3.37), 2008(5.7), and Orient 2008 (2.12) show a positive fl value of more than 2,which proves that the firms gained more profit in these years.
operating leverage of textile firms
Firms i. e. Aditya (2007), Alka (2005, 2006, and 2008), Arunoday (from2004 to 2007), Blue (2008), Bombay (2008), Coimbatore Pioneer Mills(2005 and 2007), Jindal Texafab (2006), Modern (2004 and 2005), Pondi-cherry Spinners (from 2004 to 2007), Veejay (2008) show negative ol
Managing Global Transitions
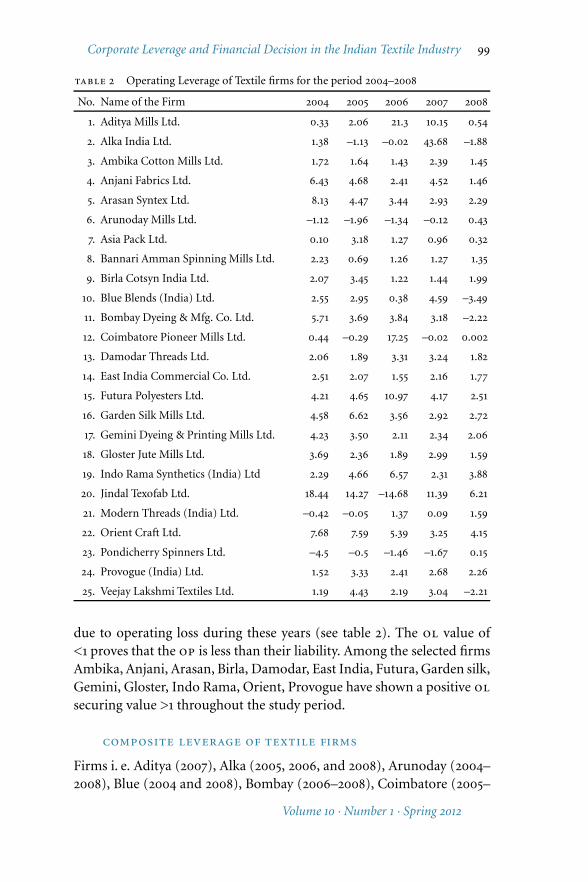
Corporate Leverage and Financial Decision in the Indian Textile Industry 99
table 2 Operating Leverage of Textile firms for the period 2004–2008
No. Name of the Firm 2004 2005 2006 2007 2008
1. Aditya Mills Ltd. 0.33 2.06 21.3 10.15 0.54
2. Alka India Ltd. 1.38 –1.13 –0.02 43.68 –1.88
3. Ambika Cotton Mills Ltd. 1.72 1.64 1.43 2.39 1.45
4. Anjani Fabrics Ltd. 6.43 4.68 2.41 4.52 1.46
5. Arasan Syntex Ltd. 8.13 4.47 3.44 2.93 2.29
6. Arunoday Mills Ltd. –1.12 –1.96 –1.34 –0.12 0.43
7. Asia Pack Ltd. 0.10 3.18 1.27 0.96 0.32
8. Bannari Amman Spinning Mills Ltd. 2.23 0.69 1.26 1.27 1.35
9. Birla Cotsyn India Ltd. 2.07 3.45 1.22 1.44 1.99
10. Blue Blends (India) Ltd. 2.55 2.95 0.38 4.59 –3.49
11. Bombay Dyeing & Mfg. Co. Ltd. 5.71 3.69 3.84 3.18 –2.22
12. Coimbatore Pioneer Mills Ltd. 0.44 –0.29 17.25 –0.02 0.002
13. Damodar Threads Ltd. 2.06 1.89 3.31 3.24 1.82
14. East India Commercial Co. Ltd. 2.51 2.07 1.55 2.16 1.77
15. Futura Polyesters Ltd. 4.21 4.65 10.97 4.17 2.51
16. Garden Silk Mills Ltd. 4.58 6.62 3.56 2.92 2.72
17. Gemini Dyeing & Printing Mills Ltd. 4.23 3.50 2.11 2.34 2.06
18. Gloster Jute Mills Ltd. 3.69 2.36 1.89 2.99 1.59
19. Indo Rama Synthetics (India) Ltd 2.29 4.66 6.57 2.31 3.88
20. Jindal Texofab Ltd. 18.44 14.27 –14.68 11.39 6.21
21. Modern Threads (India) Ltd. –0.42 –0.05 1.37 0.09 1.59
22. Orient Craft Ltd. 7.68 7.59 5.39 3.25 4.15
23. Pondicherry Spinners Ltd. –4.5 –0.5 –1.46 –1.67 0.15
24. Provogue (India) Ltd. 1.52 3.33 2.41 2.68 2.26
25. Veejay Lakshmi Textiles Ltd. 1.19 4.43 2.19 3.04 –2.21
due to operating loss during these years (see table 2). The ol value of<1 proves that the op is less than their liability. Among the selected firmsAmbika, Anjani, Arasan, Birla, Damodar, East India, Futura, Garden silk,Gemini, Gloster, Indo Rama, Orient, Provogue have shown a positive ol
securing value >1 throughout the study period.
composite leverage of textile firms
Firms i. e. Aditya (2007), Alka (2005, 2006, and 2008), Arunoday (2004–2008), Blue (2004 and 2008), Bombay (2006–2008), Coimbatore (2005–
Volume 10 · Number 1 · Spring 2012

100 Ramachandran Azhagaiah and Selvaraj Sathia
2008), Futura (2004 and 2006), Jindal (2006), Modern (2004–2006 and2008), Pondicherry Spinners (2004–2007), and Veejay (2008) show neg-ative cl values (see table 3). From the selected firms, Ambika, An-jani, Arasan, Bannari, Birla, Damodar, East India, Garden Silk, Gemini,Gloster, Indo Rama, Orient, Provogue show a positive cl with values>1. The highest values of cl of firms viz Arasan 2004 (23.38), Gardenin 2005 (25.51), Gemini in 2004 (24.13), Indo Rama in 2008 (50.28), Jin-dal in 2004 (25.65), 2005 (21.26), 2007 (38.37) and 2008 (35.41) show asignificant growth in sales, thereby profit.
trends in fl, ol, and cl of textile firms in india
Firms i. e. Aditya from 2004–2008, Alka in 2005, 2006, 2008, Aruno-day 2004–2008, Blue 2004–2008, Bombay 2006–2008, Coimbatore 2004–2008, Indo Rama 2008, Modern 2004–2008, Pondicherry Spinners 2004–2008, Veejay in 2008, Asia 2004–2005, Futura 2004–2006, Gemini in 2004
and Jindal in 2004, 2006, and 2007 all show negative values, thus provingthat the firms incurred loss during those years (see table 4).
Firms i. e. Ambika, Anjani, Arasan, Asia, Bannari, Birla, etc show pos-itive profitability ratios, which proves that there was a significant growthin the profit throughout the study period. Out of these firms, Ambika,Anjani, Arasan, Asia, etc show the highest values, which proves that thesefirms have gained huge profit, and thus the ratios (ebit) over the totalnet income of profit and expenses, profit after tax over total net incomeshows growth in their calculated values. The return on investment (roi)is the key indicator of profitability for a firm. It matches op with the as-sets available to earn a return. Firms that are efficiently using their assetswill have a relatively high return.
Firms, i. e. Ambika, Arasan, Birla, Blue, Coimbatore, Durairaj, Futura,Gemini, etc show an increasing trend in their values, which help the firmsto meet their current obligations (see table 4, which shows the liquidityratios, which help to examine the adequacy of funds, the solvency of thefirm, and the firm’s ability to pay its obligations). The higher the currentratio, the larger is the amount available per rupee of current liability;the more the firm’s ability to meet current obligations, the greater is thesafety of funds for short-term creditors. In case of cs, the lower the der,the higher is the degree of protection enjoyed by the creditors.
The general thumb rule for this ratio is 2:1. The DERs of the firmsAditya (0.23), Alka (1.08), Ambika (2.51), Anjani (1.56), Arasan (1.63),Asia (0.17), Bannari (2.65), Birla (1.34), Bombay (10.22), Damodar (4.83),
Managing Global Transitions
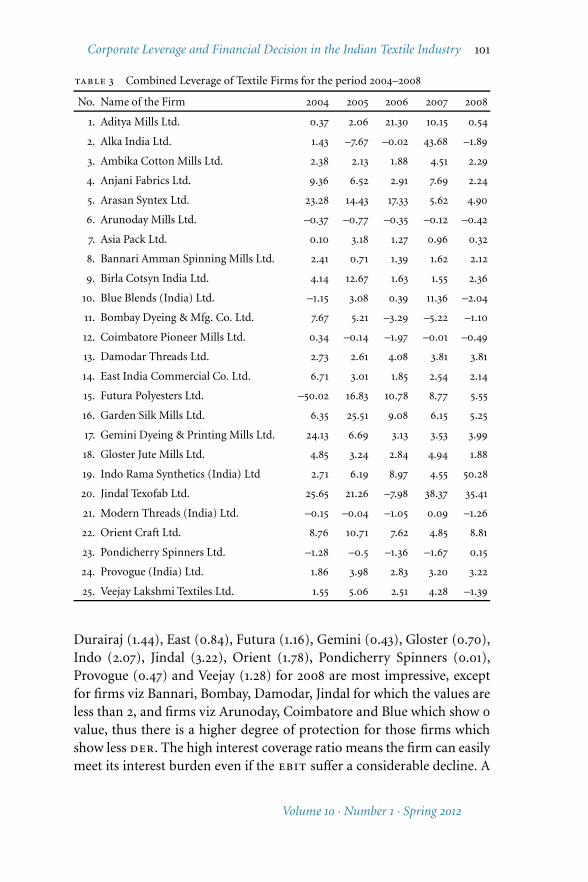
Corporate Leverage and Financial Decision in the Indian Textile Industry 101
table 3 Combined Leverage of Textile Firms for the period 2004–2008
No. Name of the Firm 2004 2005 2006 2007 2008
1. Aditya Mills Ltd. 0.37 2.06 21.30 10.15 0.54
2. Alka India Ltd. 1.43 –7.67 –0.02 43.68 –1.89
3. Ambika Cotton Mills Ltd. 2.38 2.13 1.88 4.51 2.29
4. Anjani Fabrics Ltd. 9.36 6.52 2.91 7.69 2.24
5. Arasan Syntex Ltd. 23.28 14.43 17.33 5.62 4.90
6. Arunoday Mills Ltd. –0.37 –0.77 –0.35 –0.12 –0.42
7. Asia Pack Ltd. 0.10 3.18 1.27 0.96 0.32
8. Bannari Amman Spinning Mills Ltd. 2.41 0.71 1.39 1.62 2.12
9. Birla Cotsyn India Ltd. 4.14 12.67 1.63 1.55 2.36
10. Blue Blends (India) Ltd. –1.15 3.08 0.39 11.36 –2.04
11. Bombay Dyeing & Mfg. Co. Ltd. 7.67 5.21 –3.29 –5.22 –1.10
12. Coimbatore Pioneer Mills Ltd. 0.34 –0.14 –1.97 –0.01 –0.49
13. Damodar Threads Ltd. 2.73 2.61 4.08 3.81 3.81
14. East India Commercial Co. Ltd. 6.71 3.01 1.85 2.54 2.14
15. Futura Polyesters Ltd. –50.02 16.83 10.78 8.77 5.55
16. Garden Silk Mills Ltd. 6.35 25.51 9.08 6.15 5.25
17. Gemini Dyeing & Printing Mills Ltd. 24.13 6.69 3.13 3.53 3.99
18. Gloster Jute Mills Ltd. 4.85 3.24 2.84 4.94 1.88
19. Indo Rama Synthetics (India) Ltd 2.71 6.19 8.97 4.55 50.28
20. Jindal Texofab Ltd. 25.65 21.26 –7.98 38.37 35.41
21. Modern Threads (India) Ltd. –0.15 –0.04 –1.05 0.09 –1.26
22. Orient Craft Ltd. 8.76 10.71 7.62 4.85 8.81
23. Pondicherry Spinners Ltd. –1.28 –0.5 –1.36 –1.67 0.15
24. Provogue (India) Ltd. 1.86 3.98 2.83 3.20 3.22
25. Veejay Lakshmi Textiles Ltd. 1.55 5.06 2.51 4.28 –1.39
Durairaj (1.44), East (0.84), Futura (1.16), Gemini (0.43), Gloster (0.70),Indo (2.07), Jindal (3.22), Orient (1.78), Pondicherry Spinners (0.01),Provogue (0.47) and Veejay (1.28) for 2008 are most impressive, exceptfor firms viz Bannari, Bombay, Damodar, Jindal for which the values areless than 2, and firms viz Arunoday, Coimbatore and Blue which show 0
value, thus there is a higher degree of protection for those firms whichshow less der. The high interest coverage ratio means the firm can easilymeet its interest burden even if the ebit suffer a considerable decline. A
Volume 10 · Number 1 · Spring 2012

102 Ramachandran Azhagaiah and Selvaraj Sathia
table4
Tren
dsin
fl,o
l,an
dcl
ofTe
xtile
Firm
sin
Indi
a
(1)
(2)
(3)
(4)
aml
0.89
0.15
0.15
ail
0.18
0.79
0.61
acml
4.57
*0
.52
1.08
afl
5.15
1.69
2.06
asl
0.05
0.79
2.14
arml
1.21
0.91
0.14
apl
2.24
0.39
0.38
basm
l1.73
0.41
0.88
bcil
1.06
2.09
1.51
bbil
1.02
0.73
0.80
bdmcl
1.79
0.25
1.59
cpml
0.48
0.88
0.28
dtl
0.41
1.73
2.64
eic
cl
1.23
2.78
0.27
fpl
0.94
0.45
0.92
gsm
l2.34
0.73
0.36
gdpml
1.28
1.71
1.16
gjm
l0
.37
0.37
0.53
irsil
1.06
2.06
0.62
jtfl
2.11
2.06
0.16
mtil
0.53
1.07
1.07
ocl
0.62
0.25
0.25
psl
3.92
*1.81
2.63
pil
1.34
3.12
0.55
vlt
l0
.15
0.48
0.75
Col
um
nh
ead
ings
are
asfo
llow
s:(1
)fi
rm,
(2)
t-va
lue
forfl
,(3
)t-
valu
efo
rol
,84
)t-
valu
efo
rcl
.*
Sign
ifica
nta
t1%
leve
l.Ta
ble
valu
eof
tfo
rυ=
5−1=
4at
5%le
veli
s2.776
and
at1%
leve
lis4.604.
table5
Reg
ress
ion
and
Cor
rela
tion
Coe
ffici
ent
ofSa
les
andebit
ofSe
lect
edTe
xtile
Firm
sin
Indi
a
(1)
(2)
(3)
(4)
(5)
(6)
(7)
(8)
(9)
aml
X=
0.29Y+2.07
Y=
0.19X−1
.28
2.39
1.11
0.24
53
0.44
ail
X=−2
.53Y+156
.07
Y=−4
.73X+755.50
160
.06
1.5
0.11
53
0.19
acml
X=
3.49
Y+37
.47
Y=
0.15X+5.5
118.89
23.33
0.72
53
2.59
afl
X=
12.23Y+42
.91
Y=
0.03X+0
.73
81.92
3.19
0.59
53
1.57
asl
X=
1.49
Y−3
.65
Y=
0.53X−9
.95
23.40
2.45
0.89
53
7.33
arml
X=
0.94Y+34
.79
Y=
0.05X−8
.93
41.25
6.87
0.21
53
0.38
apl
X=
0.86
Y+1.17
Y=
1.14
X−1
.27
3.96
3.24
0. 99
53
85.64
basm
lX=
0.08Y+104.56
Y=
3.28
X−3
27.36
106
.25
21.14
0.51
53
1.19
bcil
X=
0.05Y+29
.72
Y=
16.72X−4
96.67
29.82
1.92
0.96
53
20.76
bbil
X=
14.42Y−2
40.16
Y=
2.82
X−3
50.45
133.46
25.91
0.88
53
6.62
bdmcl
X=
0.06
Y+950
.22
Y=
6.33X−5
974.45
954.13
65.19
0.62
53
1.73
cpml
X=−1
.89Y+17
.86
Y=−0
.02X+8.4
2.06
8.36
0.21
53
0.38
dtl
X=
15.07Y+14
.63
Y=
0.06
X−0
.46
80.79
4.39
0.25
53
0.46
eic
cl
X=
8.03Y+53
.68
Y=
0.11X−4
.73
134.62
10.08
0.92
53
10.61
fpl
X=−0
.31Y+49
6.81
Y=
0.02+37
.32
505.25
27.21
0.08
53
0.14
gsm
lX=
12.85Y−9
8.35
Y=
0.07X+1.39
1156
82.33
0.96
53
20.76
gdpml
X=
3.36
Y+18
.77
Y=
0.23X−3
.82
26.20
2.21
0.88
53
6.62
gjm
lX=
2.23
Y+108.46
Y=
0.28X−2
6.16
134.79
11.78
0.79
53
3.69
irsil
X=−1
.45Y+24
64.67
Y=
0.14X−1
71.52
2255
144.2
0.45
53
0.99
jtfl
X=
8.48
Y+26
.42
Y=
0.02X−0
.21
29.98
0.42
0.42
53
0.89
mtil
X=
0.01Y+82
.25
Y=
14.92X−1
219.63
82.36
9.14
0.43
53
0.91
ocl
X=
3.89
Y+514.28
Y=
0.19X−8
4.16
689
.51
44.99
0.85
53
5.25
psl
X=
8.57+2.25
Y=
0.04X−0
.14
1.48
0.09
0.55
53
1.38
pil
X=
7.29
Y+19
.13
Y=
0.25X−2
1.59
174.78
21.36
1.34
53
2.93
vlt
lX=
1.41Y+32
.03
Y=
0.4
X−1
2.44
33.75
1.22
0.75
53
2.95
Col
um
nh
ead
ings
are
asfo
llow
s:(1
)fi
rm,(2)
regr
essi
oneq
uat
ion
Xon
Y,(3)
regr
essi
oneq
uat
ion
Yon
X,(4)
mea
nof
sale
s,(5
)m
ean
ofebit
,(6
)r,
(7)
N,(8)
df,(9)
t-va
lue.
able
valu
eof
tfo
rυ=
5−2=
3at
5%le
velo
fsig
nifi
can
ceis3.182
and
at1%
leve
lofs
ign
ifica
nce
is0
.841.
Managing Global Transitions
Corporate Leverage and Financial Decision in the Indian Textile Industry 103
low interest coverage ratio may result in financial embarrassment whenebit declines. Firms i. e. Aditya, Alka, Arunoday, Asia, Blue, Bombay,Coimbatore, etc show a negative or less value, and firms viz Ambika, An-jani, Arasan, Bannari, Birla, Damodar, Durairaj, etc show a higher value.The debtor’s ratio is to measure the liquidity of the receivables or to findout the period over which receivables remain uncollected. The debtor’sturnover ratios determine the liquidity of the firms. The lesser the pe-riod, the more is the liquidity; and the greater the period, the less is theliquidity.
Firms i. e. Ambika, Arasan, Bannari, East, Gloster, Indo and Pondi-cherry Spinners show a lesser period of collections while the other firmsshow higher period of collection. In case creditor’s payable ratio is longer,the period of outstanding payable is lesser. Firms, viz Bannari, Damodar,and East show a lesser period of payable, while the other firms show alonger period of payables. The calculated t-values for firms, viz acml
(4.57) afl (5.15), and psl (3.92) are higher than the table value at 5%level; and lower than the table value at 1% level of significance (see table4). For all the other firms, the t values are lower than the table values at5% level of significance.
h10 There is no significant relationship between the Sales and ebit and
the derived correlation coefficient from Sales and ebit with respectto leverage.
regression and correlation coefficients of sales
and ebit
As the t-values of most of the firms are lower than the table values, h10
is accepted, therefore it is proved that there is no significant relationshipbetween the Sales and ebit and the derived correlation coefficient fromSales and ebit with respect to leverage. However, F-values are higherthan the table values at 5% and 1% level of significances (see table 5) forfirms i. e. basml (14951.17), bcil (45.96), bdmcl (55.13), eiccl (64.47),gsml (20.24), gjml (48.64), ocl (59.59), and vltl (813), and for a fewfirms, i. e. bbil, cpml, dtl, jtfl, mtil, and psl it shows nil value.
variance ratio tests of investment and borrowings
as well as net worth and borrowings
h20 There is no significant relationship between the investment and bor-
rowings with respect to leverages as well as fds.
Volume 10 · Number 1 · Spring 2012

104 Ramachandran Azhagaiah and Selvaraj Sathia
table 6 Variance Ratio Tests of Investment and Borrowings as well as Net Worth andBorrowings of Selected Textile firms in India
(1) (2) (3) (4) (5) (6) (7)
aml 0.04 0.59 10 3.09 0.59 0
ail 19.20 2.26 2.32 60.00 2.26 18.43
acml 177.34 159.37 1.06 84.88 159.37 11.18
afl 13.87 13.88 1.04 11.53 13.88 6.89
asl 20.04 19.29 1.00 9.56 19.29 1.03
arml 33.12 81.91 3.51 55.39 81.91 1.90
apl 2.08 3.86 5.43 6.97 3.86 2.65
basml 3.60 163.59 14951.17 110.73 163.59 5.99
bcil 3.71 20.91 45.96 32.64 20.91 1.36
bbil 10.74 142.74 0 110.12 142.74 1.04
bdmcl 151.97 750.62 55.13 398.28 750.62 114.54
cpml 0.02 38.93 0 38.20 38.93 1.30
dtl 0.02 34.85 0 11.64 34.85 48.26
eiccl 0.65 31.06 64.47 29.13 31.06 6.19
fpl 25.14 146.09 11.09 160.44 146.09 296.87
gsml 87.44 609.18 20.24 349.04 609.18 14.68
gdpml 3.04 8 1.37 19.95 8.00 4.04
gjml 0.84 30.87 48.64 30.44 30.87 2.09
irsil 80.57 792.6 6.98 662.79 792.6 165.04
jtfl 0 9.29 0 3.18 9.29 29.43
mtil 0.01 272.35 0 374.63 272.35 10.78
ocl 24.54 301.35 59.59 185.95 301.35 10.08
psl 0 0.28 0 0.89 0.28 2.67
pil 58.51 63.86 1.98 146.79 63.86 6.87
vltl 0.15 17.22 813 20.76 17.22 1.76
notes Column headings are as follows: (1) firm, (2) investment mean (X), (3) bor-rowing mean (Y), (4) F-value, (5) net worth mean (X), (6) borrowing mean (Y), (7)F-value. Table value of F for υ = 5 − 1 = 4 at 5% level of significance is 6.39 and at 1%level of significance is 15.98.
H20 is rejected as per the calculated F value, and it is concluded that
there is a significant relationship between the investment and borrow-ings with respect to leverages as well as fds. Observation of table 6 indi-cates that the F values of ail (18.43), bdmcl (114.54), dtl (48.26), fpl
Managing Global Transitions

Corporate Leverage and Financial Decision in the Indian Textile Industry 105
(296.87), irsil (165.04), jtfl (29.43) are higher than the table value at5% and 1% levels of significance, and for all other firms the values arelower than the table values, hence h2
0 is accepted.
variance ratio tests of net worth and cl as well as
net worth and fl
h30 There is no significant relationship between the net worth and bor-
rowings with respect to leverages as well as fds.
H30 is rejected based on the computed F value, since it is concluded that
there is a significant relationship between the net worth and borrowingswith respect to leverages as well as fds.
Observation of the results indicates (see table 7) that the calculated Fvalues of ail (8.97), afl (1.09), fpl (5.76), gsml (10.64), irsil (1.25),vltl (7.93) are lower than the table values at 5% and 1% levels of sig-nificance, and the F values for the other firms are higher than the tablevalues.
h40 There is no significant relationship between the net worth and com-
bined leverage with respect to fds.
h40 is rejected with the support of calculated F value, hence it is con-
cluded that there is a significant relationship between the net worth andcombined leverage with respect to fds. Further, table 7 also reveals thatonly few firms’ F values are lower than the table values at 5% and 1% lev-els of significances [ail (12.64), asl (2.32), gdpml (1.64), irsil (12.27),and psl (1.6)], and for all the other firms the F values are higher than thetable values.
h50 There is no significant relationship between the net worth and fl
with respect to fds.
h50 is not proved based on calculated F value, hence h5
0 is rejected andthus it is found that there is a significant relationship between the networth and fl with respect to fds.
Summary of Results, Concluding Remarks & Suggestionsand Scope for Further Studies
summary of results
There is no major change in the fl of firms viz ami, apl, basml, gjml,etc. however, there is a significant growth in the fl of asl, arml, dtl,gsml, etc. for the study period. Firms i. e., bbil, bdmcl, cpml, fpl,
Volume 10 · Number 1 · Spring 2012

106 Ramachandran Azhagaiah and Selvaraj Sathia
table 7 Variance Ratio Tests of Net worth and cl as well as Net worth and fl ofSelected Textile firms in India
(1) (2) (3) (4) (5) (6) (7)
aml 0.95 130.38 137.24 0.95 0.003 316.67
ail 47.92 429.98 8.97 47.92 3.79 12.64
acml 617.83 1.13 546.75 617.83 0.06 10297.17
afl 8.61 9.44 1.09 8.61 0.04 215.25
asl 3.57 61.62 17.26 3.57 1.54 2.32
arml 497.81 0.89 559.34 497.81 0.14 3555.79
apl 130.77 1.49 87.77 130.77 0 0
basml 4513.76 0.44 10258.55 4513.76 0.05 90275.2
bcil 838.31 22.09 37.95 838.31 1.16 722.69
bbil 4179.72 29.27 142.79 4179.72 1.10 3799.29
bdmcl 1944.09 30.78 63.16 1944.09 1.59 1222.69
cpml 556.33 0.80 695.41 556.33 0.18 3090.72
dtl 33.05 0.47 70.32 33.05 0.14 236.07
eiccl 75.94 3.93 19.32 75.94 0.42 180.81
fpl 4082.02 708.34 5.76 4082.02 39.86 102.41
gsml 774.17 72.75 10.64 774.17 0.86 900.19
gdpml 1.98 1120.78 566.05 1.98 3.25 1.64
gjml 77.12 1.75 44.07 77.12 0.03 2570.69
irsil 324.44 404.46 1.25 324.44 26.45 12.27
jtfl 0.14 168.02 1200.14 0.14 4.27 30.50
mtil 10891.82 0.81 13446.69 10891.82 0.81 13446.07
ocl 1677.79 3.99 420.49 1677.79 0.13 12906.08
psl 0.16 3.18 19.88 0.16 0.10 1.60
pil 17710.69 0.59 30018.12 17710.69 0.01 17771.07
vltl 50.89 6.42 7.93 50.89 0.09 565.44
notes Column headings are as follows: (1) firm, (2) net worth variance, (3) cl vari-ance, (4) F-value, (5) net worth variance, (6) fl variance, (7) F-value. Table value of Ffor υ = 5 − 1 = 4 at 5% level of significance is 6.39 and at 1% level of significance is 15.98.
mtil show a negative leverage for few years of the study period, whilefirms viz bcil, vltl show a decreasing trend in the fl, and the otherfirms show a triggering trend. Among the selected 25 textile firms thereis an increase in the position of ol for two firms, i. e. irsil, pil, whilethere is a decrease in the position of ol for 10 firms i. e. ami, ail, arml,
Managing Global Transitions

Corporate Leverage and Financial Decision in the Indian Textile Industry 107
bbil, bdmcl, cpml, etc. during the study period, and the other firmsshow a triggering trend.
The cl of 11 firms viz., ami, ail, arml, bbil, bdmcl, cpml, fpl,jtfl, mtil, psl and vltl show a negative trend, while a significantgrowth rate is found for five firms i. e., irsil, ocl, pil, basml and dtl
in terms of cl during the study period. However, there is a decreasingtrend in the cl of firms viz., afl, apl, gjml, vltl; the other firms showa triggering trend during the study period.
There is no significant difference between the financial variables ofsales and ebit; the derived correlation coefficient from sales and ebit issignificant with effect to leverage as the calculated t value is lower thanthe table value for υ = 3 at 5% level of significance (3.182) and at 1%level of significances (5.841). However, there is a significant relationshipbetween the investment and borrowings with effect to leverage and fd asmost of the firms’ F-value is higher than the table value for υ = 4 at 5%(6.39) and at 1% level of significances (15.98). Also there is a significantrelationship between the net worth and borrowings as well as a relation-ship between the net worth and cl with respect to fd as the computedF value is higher than the table value; there is a significant relationshipbetween the net worth and fl with effect to fd.
Profitability ratios of the firms, ami from (2004–2008), ail in (2005–2006 and 2008), arml (2004–2008), bbil (2004–2008), bdmcl (2006–2008), cpml (2004–2008), irsil (2008), mtil (2004–2008), psl (2004–2008, vltl (2008), apl (2004–2005), fpl (2004–2006), gdpml (2004),and jtfl (2004, 2006, and 2007) show negative values, thereby provingthat the firms faced loss during those years. Firms like acml, afl, asl,apl, basml, bcil, etc. show positive profitability ratios, which provethat there is a significant growth in the profit throughout the study pe-riod. Among these firms, acml, afl, asl, apl, basml, dtl, eiccl,gsml, gsml and pil show higher profitability ratios, which prove thatthey have gained huge profit over the study period.
acml, asl, bcil, bbil, cpml, fpl, gdpml, etc. show an increasingtrend in their current ratios, which helps the firms to meet their currentobligations. The der for the year 2008 for firms viz., ami (0.23), ail(1.08), acml (2.51), afl (1.56), asl (1.63), apl (0.17), basml (2.65), bcil(1.34), bdmcl (10.22), etc. except for firms viz., basml, bdmcl, dtl,jtfl, where the values are less than 2 and firms viz arml, cpml andbbil show 0 value, thereby leading to conclude that there is a higherdegree of protection for those firms which show less der.
Volume 10 · Number 1 · Spring 2012

108 Ramachandran Azhagaiah and Selvaraj Sathia
concluding remarks
Leverage represents the influence of one financial variable over someother related financial variables, while business risk refers to the volatil-ity of ebit. In other words, leverage refers to the use of fixed costs inan attempt to increase op. ol is due to fixed operating costs associatedwith the production of goods or services, and fl is due to the existence offixed financing costs. Both types of leverages affect the level and volatil-ity of the firm’s after tax earnings and thereby the firm’s overall risk andreturn.
fl is employed in the hope of increasing the return to common stock-holders. The purpose of the leverage is to maximize the profits; a high de-gree of leverage gives a huge increase in profits, however one can’t ignorethat the higher the degree of leverage the greater is the risk. Hence, theterm risk implies the degree of uncertainty the firm has to face in meet-ing fixed payment obligations, so it is said to be a double-edged weapon. Ifit is used in the right (appropriate) way it serves the purpose (positively)very well, and if not it acts reversely (negatively); its effects are favourableor unfavorable depending upon the use of it.
Increasing leverage is the easiest way to increase returns in a risingmarket, and there were incentives to chase these returns and to ignore ordownplay the risks. fl may also be an effective weapon in the battle forcorporate control. Certain Employee Stock Ownership Plans (esops) are‘leveraged’, in that the trust fund borrows funds in order to quickly placea large number of the firm’s shares in friendly hands.
In the present study 25 textile firms, which are listed in Bombay StockExchange, are taken as sample units for the study period on a year-to-year basis from 2004 to 2008. Firms viz acm, afl, asl, basml, bcil,gsm, gdpm and gjml show a significant growth rate in financial, oper-ating and combined leverages. The selected financial variables viz sales,ebit, investment, borrowings and net worth influence the leverage inboth the positive and negative way. As a general rule, a firm having lowfl should have a high operating leverage and vice versa. Since ol is re-lated to the fixed cost of the firms these firms have large fixed cost andthus much of the marginal contribution must be applied to cover fixedcost. Firms i. e. dtl, fpl, gsml, pvl and gjml have high ol and lowfl. Firms viz afl, asl, fpl, gsml and ocl show high ol. In this casethe firm should finance its new investment from sources other than debt,which will help in reducing the ol.
Managing Global Transitions

Corporate Leverage and Financial Decision in the Indian Textile Industry 109
A low ol means high controllable costs and low uncontrollable costsor fixed costs and therefore leads to a less risky situation. A high fl sug-gests that a firm has taken adequate help from fixed interest bearing se-curities, in planning its cs, in order to maximize the return to the share-holders. cl is the result of these two leverages and measures the totalrisk.
In the present study firms viz apl, gjml have low ol and high fl.High leverage generates interest payments that may be highly relative tocurrent levels of cash flow. The results show that the effect of high lever-age is likely to influence the divisional allocation of investment within afirm, which further suggests that high leverage has the potential to distorta firm’s internal investment policy. This evidence, however, comes froma sample of firms that chose to undergo a dramatic increase in leverage.Since firms have self-selected into the sample, it is possible that the indi-rect costs of high leverage are less important.
Leverage is positively related to firm’s value for low growth firms, butnegatively related to firm’s value for high growth firms. Much of the ev-idence regarding the effect of leverage on investment comes from theanalysis of firm-level data, while the effect of leverage in determining thelevel of the overall firm’s investment is clearly of interest. The effect ofleverage on firms’ investment policies has been a question of long stand-ing interest. In the presence of market imperfections, leverage has thepotential to have an important influence on investment decision. Themanagerial ownership aligns the interests of shareholders and managersthrough eliciting increased leverage, whereas institutional investors dis-courage managerial overspending through the board of directors and en-courage firms to preserve borrowing capacity. This finding supports thetheory that leverage has a disciplining role on this kind of firms and it is alsoin conformity with the results of the previous literature.
suggestions and scope for further studies
Suggestions
• Firms i. e. asl, afl and gsml show high fl and ol, thus bindingrisky, and these firms have high fixed cost and high level of debtfinancing. This combination is risky as both the leverages are high,and these risks can be avoided by managing the leverages to theappropriate level.
• Firms i. e. dtl, fpl, gsml, pvl and gjml have high ol and low fl;
Volume 10 · Number 1 · Spring 2012

110 Ramachandran Azhagaiah and Selvaraj Sathia
hence these firms should finance their new investment from sourcesother than debt so that it may help them in reducing the ol.
• Firms i. e. apl, basml, bcil, gdpml and gjml show an almostbalanced ol and fl, which is not a risky situation. fl is employedin the hope of increasing the return to the common shareholdersand the leverage is favorable in these firms.
• Firms i. e. afl, asl, fpl, gsml and ocl show high ol. Since ol
is related to the fixed cost, these firms have large fixed cost, thusmuch of their marginal contribution must be applied to cover fixedcost. If the firm has high ol, even a small change in sales will havea large effect on ebit. If the change is a small rise in sales, profitswill rise dramatically, but if the change is a small decline in fore-casted sales, ebit may be wiped out and loss may be reported. As ageneral rule, firms do not like to operate under conditions of a highol. This is a high risk situation in which a small drop in sales canbe excessively damaging to the firm’s efforts to achieve profitability.The firm prefers to operate sufficiently above break-even to avoidthe danger of a fluctuation in sales and profits. In this case thesefirms should be careful while making fds.
• Profitability ratio of firms i. e., acml, afl, asl, apl, basml, bcil,etc shows a positive increase in their ratios and there is a signifi-cant growth in their profit rate, hence these firms could expect anincrease in ebit in the years to come, provided other things (vari-ables) remain the same.
• acml (19%), basml (87%), bcil (55%), vltl (13%), jtfl (93%),gsml (6%), gdpml (20%), and bdmcl (7%) show a significantgrowth in their profit level, thus income comprises the variable costand fixed cost as the income increases and the variable cost alsoincreases but the fixed cost remains stable, thus more profit couldbe gained by these firms.
• Efficiency ratio of firms i. e. afl (1.4), mtil (1.03), eiccl (1.57),irsil (1.06), gjml (1.64), gsml (1.4), fpl (1.06), and dtl (1.72) >1,which shows more income than the average asset and thus increasesin the ratio.
• fl, ol and cl are influenced by the selected financial variables suchas net worth, investment and borrowings. cl of firms i. e., afl, asl,bcil, GSML, gdpml, irsil and ocl is high. cl is used to comparechanges in revenues with changes in ebt. It is viewed as the total
Managing Global Transitions

Corporate Leverage and Financial Decision in the Indian Textile Industry 111
impact of fixed charges in the firm’s operating and financial struc-ture to magnify the effects of changes in sales on the firm’s eps, aproper balance between the two leverages can only provide an idealcl. Maintaining an ideal situation would require a firm to have lowol and high fl, in order to keep the risk profile of the firm within areasonable limit and maximize the return to the shareholders. Thefindings suggest several novel insights into the interdependency ofcl and fd, which helps the firms to determine the business risk interms of fl and ol.
Scope for Further Studies
The present study suggests a number of interesting avenues for futureresearch. Further studies can be conducted also in the following areas:
• The relationship between ownership structure and leverage basedon the size of the firms as the significance of the relationship differswith the size.
• The important implications on the relationship between leverageand investment in emerging markets where crises and macroeco-nomics fluctuations are very common and business risk can bedogged.
• The leverage influence on the resources of diversified firms, whichundergo recapitalization, to determine the effects on the businessenvironment.
• The relationship between cl and product differentiation strategy,as drastic product differentiation strategies allow firms with healthybalance sheets to sustain superior product market rents, while firmswith high leverage and poor balance sheets should be deterred fromadopting overly drastic differentiation choices.
References
Ang, J. S. 1992. ‘On the Theory of Finance for Privately Held Firms.’ TheJournal of Small Business Finance 1 (3): 185–203.
Benito, A., and J. Whitley. 2003. ‘Implicit Interest Rates and CorporateBalance Sheets: An Analysis using Aggregated and Disaggregated uk
Data.’ Working Paper 193, Bank of England, London.Chen, C. J. P., S. Chen, and X. J. Su. 2001. ‘Profitability Regulations, Earn-
ings Management, and Modified Audit Opinions: Auditing.’ A Journalof Practice and Theory 20 (2): 8–30.
Volume 10 · Number 1 · Spring 2012
112 Ramachandran Azhagaiah and Selvaraj Sathia
Choe, Y. S. 1994. ‘The Substitution Effects of Short-Term Debt for Long-Term Debt on the Expected Returns of Common Stocks.’ Asia PacificJournal of Management 11 (2): 187–203.
Denis, D. J., and D. K. Denis. 1993. ‘Managerial Discretion, OrganizationalStructure, and Corporate Performance: A Study of Leveraged Recapi-talizations.’ Journal of Accounting and Economics 16 (1–3): 209–36.
Drobetz, W., and M. C. Grüninger. 2007. ‘Corporate Cash Holdings: Evi-dence from Switzerland.’ Financial Markets and Portfolio Management21 (2): 293–324.
Faccio, M., H. P. L. Lang, and L. Young. 2004. ‘Debt and Expropriation.’Working paper, Vanderbilt University, Nashville, tn.
Faulkender, M. 2004. ‘Cash Holdings among Small Businesses.’ WorkingPaper, University of Maryland, Robert H. Smith School of Business.
Faulkender, M., and R. Wang. 2006. ‘Corporate Financial Policy and theValue of Cash.’ Journal of Finance 61 (4): 1975–90.
Ferreira, M. A., and A. S. Vilela. 2004. ‘Why do Firms Hold Cash? Evidencefrom emu Countries.’ European Financial Management 10 (2): 295–319.
Francis, J. R., I. K. Khurana, and R. Pereira. 2005. ‘Disclosure Incentivesand Effects on Cost of Capital around the World.’ The Accounting Re-view 80 (4): 1125–62.
Gelb, D. 2000. ‘Managerial Ownership and Accounting Disclosures: AnEmpirical Study.’ Review of Quantitative Finance and Accounting 15 (2):169–85.
Gelb, D., and P. Siegel. 2000. ‘Intangible Assets and Corporate Signaling.’Review of Quantitative Finance and Accounting 15 (4): 307–23.
Gordon, R. H., and J. K. Mackie Mason. 1990. ‘Effects of the Tax ReformAct of 1986 on Corporate Financial Policy and Organizational form.’In Do Taxes Matter: The Impact of the Tax Reform Act of 1986, edited byJ. Slemrod, 91–131. Cambridge, ma: mit Press.
Honohan, P. 1997. ‘Banking System Failures in Developing and TransitionCountries: Diagnosis and Predictions.’ bis Working Paper 39, Basel.
Huffman, L. 1983. ‘Operating Leverage, Financial Leverage, and EquityRisk.’ Journal of Banking and Finance 7 (2): 197–212.
Huffman, S. P. 1989. ‘The Impact of the Degrees of Operating and Fi-nancial Leverage on the Systematic Risk of Common Stocks: AnotherLook.’ Quarterly Journal of Business and Economics 28 (1): 83–100.
Iona, A,. L. Leonida, and A. Ozkan. 2004. ‘Determinants of Financial Con-servatism: Evidence from Low-Leverage and Cash-Rich uk Firms.’Working Paper 04/01, University of York, Department of Economics.
Jensen, M. C. 1986. ‘Agency Costs of Free Cash Flow, Corporate Financeand Takeovers.’ American Economic Review 76 (2): 323–29.
Jensen, M. C., and W. H. Meckling. 1976. ‘Theory of the Firm: Managerial
Managing Global Transitions

Corporate Leverage and Financial Decision in the Indian Textile Industry 113
Behavior, Agency Costs and Ownership Structure.’ Journal of FinancialEconomics 3 (3): 305–60.
John, T. A. 1993. ‘Accounting Measures of Corporate Liquidity, Leverage,and Costs of Financial Distress.’ Financial Management 22 (3): 91–100.
Jugurnath, B., M. Stewart, and R. Brooks. 2008. ‘Dividend Taxation andCorporate Investment: A Comparative Study Between the ClassicalSystem and Imputation System of Dividend Taxation in the UnitedStates and Australia.’ Review of Quantitative Finance and Accounting 31
(4): 209–24.Kim, C., D. C. Mauer, and A. E. Sherman. 1998. ‘The Determinants of
Corporate Liquidity: Theory and Evidence.’ Journal of Financial andQuantitative Analysis 33 (3): 335–58.
Kytonen, E. 2005. ‘Corporate Liquidity Holdings: An Empirical Investi-gation of Finnish Firms.’ Paper presented at 22th Summer Seminar inBusiness and Economics, Jvyäskylä, 8–9 June.
Lang, L., E. Ofek, and R. M. Stulz. 1996. ‘Leverage, Investment, and FirmGrowth.’ Journal of Financial Economics 40 (1): 3–29.
Leary, M, and M. R. Roberts. 2005. ‘Do Firms Rebalance their CapitalStructure?’ Journal of Finance 60 (6): 2575–619.
Li, R. J., and G. V. Henderson. 1991. ‘Combined Leverage and Stock Risk.’Quarterly Journal of Business and Economics 38 (1): 18–39.
Li, W., and Y. Tang. 2007. ‘An Evaluation of Corporate Governance Eval-uation, Governance Index (cgink) and Performance: Evidence fromChinese Listed Firms in 2003.’ Frontier of Business Research in China 1
(1): 1–18.Lord, R. A. 1996. ‘The Impact of Operating and Financial Risk on Equity
Risk.’ Journal of Economics and Finance 20 (3): 27–38.Mahajan, L. Y. 1999. ‘Corporate Financing and Investment Decisions un-
der Asymmetric Information.’ International Advances in Economic Re-search 5 (1): 148–9.
Mandelker, G. N., and S. Ghon Rhee. 1984. ‘The Impact of the Degreesof Operating and Financial Leverage on Systematic Risk of CommonStock.’ Journal of Financial and Quantitative Analysis 19 (1): 45–57.
Merton, R. 1974. ‘On the Pricing of Corporate Debt: The Risk Structure ofInterest Rates.’ Journal of Finance 29 (2): 449–70.
Moon, D. and K. Tandon. 2007. ‘The Influence of Growth Opportunitieson the Relationship Between Equity Ownership and Leverage.’ Reviewof Quantitative Financial Accounting 29 (3): 339–51.
Myers, S. 1977. ‘Determinants of Corporate Borrowing.’ Journal of Finan-cial Economics 5 (2): 147–75.
Myers, C., S. Majluf, and S. Nicholas. 1984. ‘Corporate Financing and In-vestment Decisions. Journal of Financial Economics 13 (2): 187–221.
Volume 10 · Number 1 · Spring 2012

114 Ramachandran Azhagaiah and Selvaraj Sathia
Olafsson, S. 2003. ‘Making Decisions under Uncertainty Implications forHigh Technology Investments.’ bt Technology Journal 21 (2): 170–83.
Opler, T., L. Pinkowitz, R. Stulz, and R. Williamson. 1999. ‘The Determi-nants and Implications of Corporate Cash Holdings.’ Journal of Finan-cial Economics 52 (1): 3–46.
Parrino, R., and M. S. Weisbach. 1999. ‘Measuring Investment DistortionsArising from Stockholder-Bondholder Conflicts.’ Journal of FinancialEconomics 53 (1): 3–42.
Raad, E., and H. K. Wu. 1994. ‘Acquiring Firms’ Stock Returns: Methods ofPayment Change in Leverage, and Management Ownership.’ Journal ofEconomics and Finance 18 (1): 13–29.
Rajan, R. G., and L. Zingales. 1995. ‘What do We Know About CapitalStructure? Some Evidence from International Data.’ Journal of Finance50 (5): 1421–60.
Ruland, W., and P. Zhou. 2005. ‘Debt, Diversification, and Valuation.’ Re-view of Quantitative Finance and Accounting 25 (2): 277–91.
Saibal, G. 2005. ‘Does Leverage Influence Banks’ Non-Performing Loans?Evidence from India.’ Applied Economics Letters 12 (1): 913–8.
Stulz, R. 1988. ‘Managerial Control of Voting Rights: Financing Policiesand the Market for Corporate Control.’ Journal of Financial Economics20 (1): 25–54.
Vogt, S. C. 1994. ‘The Cash Flow Investment Relationship: Evidence fromus Manufacturing Firms.’ Financial Management 23 (2): 3–20.
Whited, T. 1992. ‘Debt, Liquidity Constraints, and Corporate Investment:Evidence from Panel Data.’ Journal of Finance 47 (4): 1425–61.
Managing Global Transitions

Abstracts in Slovene
Ali lahko tehnologija omogoci boljše financne ucinke?Raziskava v indijskih poslovnih bankahDhiraj Sharma
Vprašanje, ali lahko tehnologija omogoci boljše financne ucinke in iz-boljša storilnost, je bilo predmet številnih razprav. Pricujoci clanek po-skuša s pomocjo razvršcanja bank glede na rabo tehnologije proucitifinancno ucinkovitost indijskih bank znotraj njihove bancne skupine.Da bi omogocili casovno primerjavo, je bilo obdobje proucevanja raz-deljeno na dva dela: na obdobje uvajanja nizkih tehnologij in na ob-dobje uvajanja visokih tehnologij. Izsledki kažejo, da so v celoti in-formatizirane banke financno uspešnejše od bank, ki so le delno in-formatizirane. Še vec, ucinkovitost skoraj vseh proucevanih bank seje v obdobju uvajanja visokih tehnologij izredno izboljšala. Vendar paje v indijskem bancnem sektorju korelacija med uvajanjem tehnologijin financno ucinkovitostjo negativna, ceprav je nizka in ni statisticnoznacilna.
Kljucne besede: paradoks storilnosti informacijske tehnologije,informacijska tehnologija, financna ucinkovitost, indijske banke,razmerje med odhodki in prihodkiKlasifikacija jel: o33, g21, m15
Managing Global Transitions 10 (1): 3–28
Tehnologija, bogastvo in sodobni management tehnologijSlavko Dolinšek in Peter Štrukelj
V clanku predlagamo nekoliko drugacno konceptualizacijo tehnolo-gije, temeljnega razmerja med tehnologijo in bogastvom v družbi, teh-nološke sposobnosti in managementa tehnologij. Osnova za predlaganekonceputalizacije je sedanja splošna in relevantna tehnološka praksa.Da bi deducirali te konceptualizacije, smo proucili danes najvecja pod-jetja na svetu v razlicnih proizvodnih in tehnoloških sektorjih, kakortudi splošno porocanje o tehnologiji iz tehnološko usmerjenih medijev.Te temeljne konceptualizacije bi utegnile zanimati vse, ki se prakticnoali teoreticno ukvarjajo s tehnologijo, bogastvom, tehnološko sposob-nostjo in managementom tehnologij in ki hocejo razumeti bistvo teh-nologije in njenih odnosov do pojavov, kot recimo bogastvo in mana-gement (»dobiti celovito sliko«). Na koncu ponudimo razlago, zakaj v
Managing Global Transitions 10 (1): 115–117

116 Abstracts in Slovene
današnjih podjetjih obstaja potreba po managiranju tehnologij in kaj jenova paradigma managementa tehnologij – s kakšnimi novimi izzivi intrendi se mora soociti sodobni management tehnologij.
Kljucne besede: tehnologija, bogastvo, tehnološka sposobnost,management tehnologij, tehnološki trendiKlasifikacija jel: i31, j30, m10, o3Managing Global Transitions 10 (1): 29–49
Konkurencnost obmejnih regij in managementturisticnih destinacijKsenija Vodeb
Konkurencnost obmejnih regij je pogosto nižja od konkurencne spo-sobnosti regij, ki so v notranjosti posamezne države. Vecinoma so re-gije, ki predstavljajo konec enega obmocja in zacetek drugega, gospo-darsko manj uspešne. Turizem kot razvojna metoda zagotavlja možno-sti za razvoj turisticnih destinacij v krajih, kjer turisticne privlacnostiin viri pomenijo konkurencne in komparativne prednosti. Prispevekobravnava modele za oceno konkurencnosti turizma in destinacijskimanagement kot nepogrešljiv element za doseganje višje ravni konku-rencnosti turisticne destinacije. Raziskava se osredotoca na turisticneponudnike obmejnih regij ob slovensko-hrvaški meji. Zanimala so nasnjihova stališca o turizmu, regionalni konkurencnosti in potencialnihturisticnih destinacijah kot posledici cezmejnega sodelovanja med dr-žavama. Rezultati kažejo, da je konkurencnost mogoce izboljšati s stra-teško metodo nacrtovanja in upravljanja cezmejnih turisticnih destina-cij.
Kljucne besede: turisticna destinacija, konkurencnost in turizem,management turisticne destinacije, cezmejno sodelovanjeKlasifikacija jel: o10, m20
Managing Global Transitions 10 (1): 51–68
Omejitve cloveškega kapitala v Južni Afriki:analiza na ravni podjetijP. J. Ewert Kleynhans in Johannes Riaan Labuschagne
Clanek obravnava omejitve cloveškega kapitala v južnoafriškem gospo-darstvu in resnost teh omejitev za podjetja v tej državi. Kljucni ome-jitvi cloveškega kapitala, obravnavani v tem clanku, sta nezadostno iz-obražena delovna sila in anomalije na trgu dela. Dejavnike povecanjaproduktivnosti dela v proizvodnih podjetjih smo proucili s pomocjo
Managing Global Transitions

Abstracts in Slovene 117
regresijske analize. Ugotovili smo, da se vpliv izobrazbe in anomalij natrgu dela na storilnost delavcev spreminja. Metoda glavnih osi in poja-snjevalne spremenljivke so dale podobne rezultate. Raziskava je poka-zala, da najvecji delež skupne variance pojasnjujejo latentne spremen-ljivke, med njimi izobrazba, usposobljenost, placilo, regija ter podporain ucinkovitost urada za sektorsko izobraževanje in usposabljanje.
Kljucne besede: omejitve cloveškega kapitala, storilnost, ucinkovitost,delo, izobraževanje, proizvodnja, Južna AfrikaKlasifikacija jel: l26, d24, j24Managing Global Transitions 10 (1): 69–86
Financne odlocitve in celotni vzvod podjetijv indijski tekstilni industrijiRamachandran Azhagaiah in Selvaraj Sathia
Na nepopolnih trgih lahko financni vzvodi pomembno vplivajo na od-locanje o naložbah. Ce podjetju zadolževanje prinese dobicek, imajodelnicarji vecje donose na delnico, kot bi jih imeli, ce podjetje ne biimelo dolga; financni vzvodi so namrec merilo dolgorocnega tveganja.V pricujoci študiji smo za vzorec vzeli petindvajset tekstilnih podjetij,ki so v obdobju od 2004 do 2008 kotirala na bombajski borzi. Raziskavaje pokazala, da podjetja acm, afl, asl, basml, bcil, gsm, gdpm ingjml kažejo znacilno stopnjo rasti v financnem, obratnem in skupnemzadolževanju.
Kljucne besede: kapitalska struktura, financni vzvodi, poslovni vzvodi,celotni vzvod podjetij, financne odlocitve, kazalnik financnega vzvodaKlasifikacija jel: g30, g32, g35Managing Global Transitions 10 (1): 87–114
Volume 10 · Number 1 · Spring 2012

Comparative CorporateGovernance:An Overview on USand Some EU Countries’Corporate Legislationand Theory
Rado Bohinc
December 2010ISBN 978-961-266-065-9545 pp., 16 × 24 cm
Book club price 35,40BCRegular price 59,00BC
www.zalozba.fm-kp.si
The Comparative Coporate Governance monograph containsthe extensive research the author has done on the corporategovernance systems of the USA, EU, UK, Germany, France,Slovenia and some other countries of the EU and out of EU.It analyses the differences and similarities, advantages anddisadvantages, of the US single board or one-tier systemin comparison with the European two-tier corporategovernance systems.Following an in-depth presentation of corporate governance ingeneral, provided with chapters on the general theory oncorporate governance, the main opened issues of corporategovernance, sources of law, OECD principles of corporategovernance and OECD guidelines for state owned enterprises,the book focuses on the types of business organizations andownership structures both in the US and EU corporations, andthen concentrates on explaining and analysing the corporategovernance systems in the EU, the USA, the United Kingdom,Germany, France and Slovenia, emphasising the featuresinherent to each of these systems.

Managing Global TransitionsInternational Research Journal
aims and scope
The journal Managing Global Transitionsis aimed at providing a forum fordisseminating scholarship focused ontransitions. The journal seeks to publishground breaking work in managementresearch that will provide integrated anddiverse perspectives on the processes ofchange and evolution in a broad range ofdisparate fields, including systems theory,leadership development, economics,education, industrial relations, law, sociology,informatics, technology, decision-makingtheory, and action learning. To further theunderstanding of transition environmentsinternationally the journal aspires to enhancethe availability of case studies and analysis ofdata from different cultural environments inpublic, non-profit, and corporate contexts.
information for authors
Manuscripts are accepted on the understan-ding that they are original and not undersimultaneous consideration by any otherpublication. All manuscripts are double-blind peer reviewed.Manuscripts should be prepared followingThe Chicago Manual of Style.
Manuscript Style
• Manuscripts should be submittedelectronically via e-mail. We accept filescreated with all major word processingpackages, but prefer ms Word and LATEX.
• The editors reserve to right to returnto authors, without peer review,improperly formatted manuscripts.
• Papers should be between 5000 and6000 words in length, accompanied bya 100–150-word abstract, and no morethan five key words and two areas of jelclassification (see http://www.aeaweb.org/journal/jel_class_system.html)on a separate sheet.
• The title page must list full title,author(s) address, and e-mail.
• Paper size should be a4. Margins shouldbe set for a 25 mm (1 in.) top, bottom,left, and right. The point size should be12 and the font should be Times New
Roman. Italics should be used foremphasis and bold for headings. Putblank lines between paragraphs anddifferentiate major and minor headings.
• Footnotes are not permitted. Endnotesare permissible but should be kept to aminimum.
Reference StyleThe author-date system of citation forreferences should be used in the text, followedby page number if a direct quotation is given,e.g., (Jackson 1979, 181). The alphabetizedreference list should be titled ‘References’with entries in the following format:
Anderson Analytics. 2007. ‘Brands andCountries.’ http://www.andersonanalytics.com/reports/BrandAndCountries.pdf
Beech, M. H. 1982. ‘The Domestic Realm inthe Lives of Hindu Women in Calcutta.’In Separate Worlds: Studies of Purdah inSouth Asia, edited by H. Papanek and G.Minault, 110–38. Delhi: Chanakya.
Kim, J., S. J. Lee, and G. Marschke. 2005. ‘TheInfluence of University Research onIndustrial Innovation.’ nber WorkingPaper Series 11447, National Bureau ofEconomic Research, Cambridge, ma.
Jackson, R. 1979. ‘Running Down theUp-Escalator: Regional Inequality in PapuaNew Guinea.’ Australian Geographer 14 (5):175–84.
Lynd, R., and H. Lynd. 1929. Middletown:A study in American Culture. New York:Harcourt, Brace and World.
University of Chicago Press. 2010. TheChicago Manual of Style. 16th ed. Chicago:University of Chicago Press.
indexing and abstracting
Managing Global Transitions is indexed/abstracted in the International Bibliographyof the Social Sciences, EconLit, doaj,EconPapers, Cabell’s, ebsco, and ProQuest.
The journal is supportedby the Slovenian Book Agency.
issn 1854-6935 (online)
