managing software quality with the team software process
TRANSCRIPT
© 2010 Carnegie Mellon University
Managing Software Quality with the Team Software Process
James W. Over
April 13, 2010
2Efficiency, Quality, and Agility
© 2010 Carnegie Mellon University
Key Message
Society depends on software.
As software professionals we have an obligation to produce reliable, secure software.
The methods exist to achieve this goal, but they aren’t widely used.
Software quality professionals should help shift the profession from its ad-hoc, “test-in quality” mindset, towards a measured, disciplined, “build-in quality” approach.
3Efficiency, Quality, and Agility
© 2010 Carnegie Mellon University
Team Software Process (TSP)
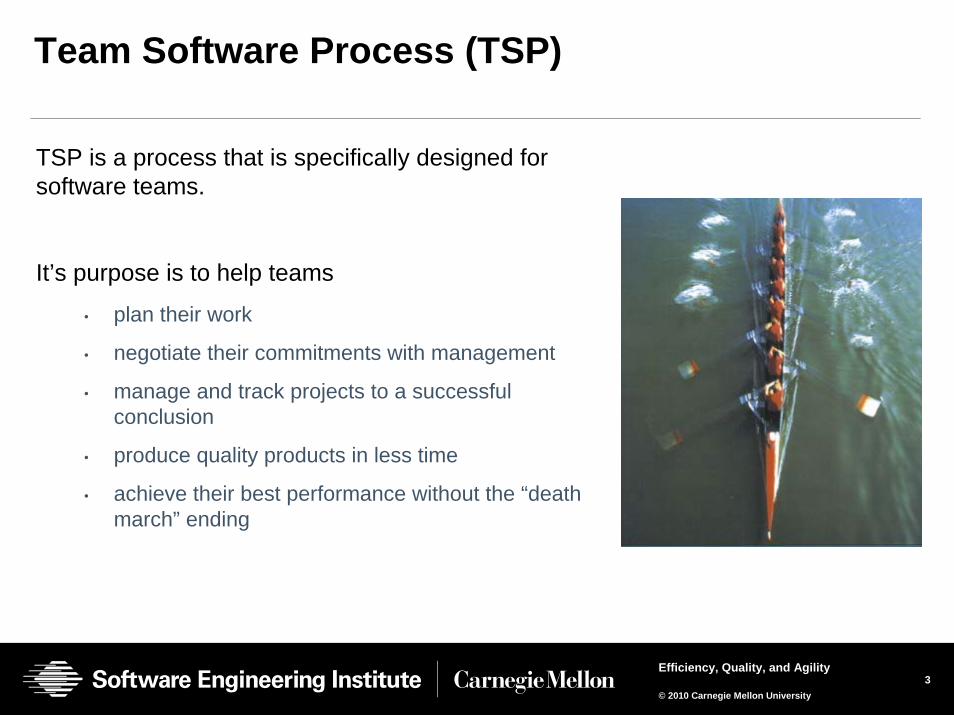
TSP is a process that is specifically designed for software teams.
It’s purpose is to help teams
• plan their work
• negotiate their commitments with management
• manage and track projects to a successful conclusion
• produce quality products in less time
• achieve their best performance without the “death march” ending
4Efficiency, Quality, and Agility
© 2010 Carnegie Mellon University
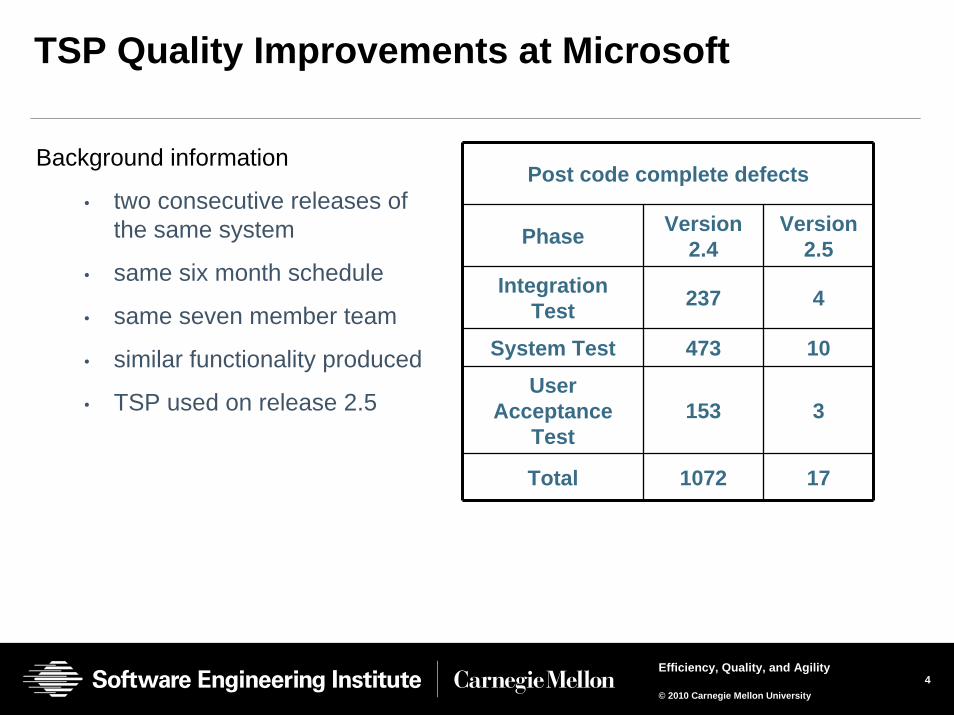
TSP Quality Improvements at Microsoft
Background information
• two consecutive releases of the same system
• same six month schedule
• same seven member team
• similar functionality produced
• TSP used on release 2.5
Post code complete defects
Phase Version 2.4
Version 2.5
Integration Test 237 4
System Test 473 10
User Acceptance
Test153 3
Total 1072 17

5Efficiency, Quality, and Agility
© 2010 Carnegie Mellon University
Quality Improvement at Intuit
From data on over 40 TSP teams, Intuit has found that• sixty percent fewer defects after code-complete
• post code-complete effort is 8% instead of 33% of the project
• standard test times are cut from 4 months to 1 month or less
Development
Development Test
Test Non-TSP
TSP
Source: Intuit
6Efficiency, Quality, and Agility
© 2010 Carnegie Mellon University
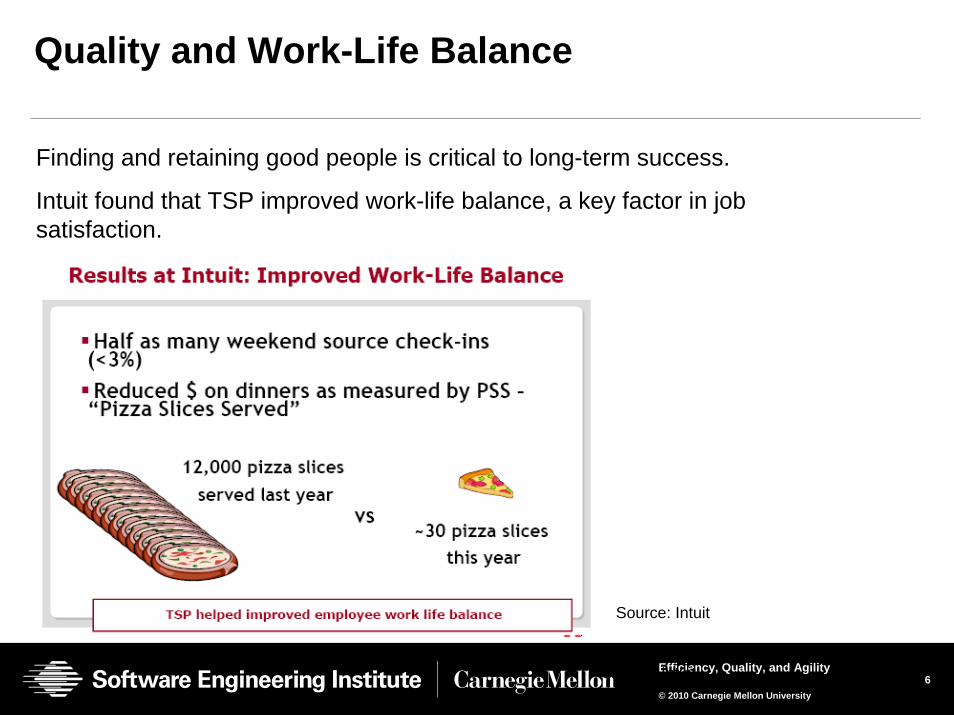
Quality and Work-Life Balance
Finding and retaining good people is critical to long-term success.
Intuit found that TSP improved work-life balance, a key factor in job satisfaction.
Source: Intuit
Source: Intuit
7Efficiency, Quality, and Agility
© 2010 Carnegie Mellon University
0
1
2
3
4
5
6
7
8
CMMLevel 1
CMMLevel 2
CMMLevel 3
CMMLevel 4
CMMLevel 5
TSP
Defectsper KLOC 7.5 6.24 4.73 2.28 1.05 0.06
Average Defect Density of Delivered Software
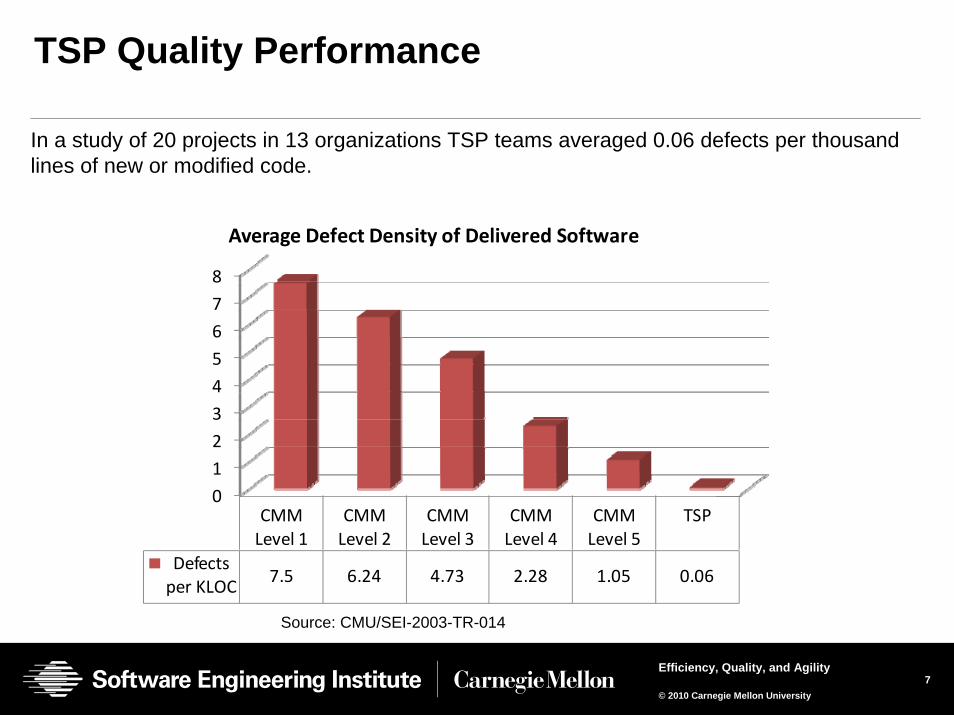
TSP Quality Performance
In a study of 20 projects in 13 organizations TSP teams averaged 0.06 defects per thousand lines of new or modified code.
Source: CMU/SEI-2003-TR-014
8Efficiency, Quality, and Agility
© 2010 Carnegie Mellon University
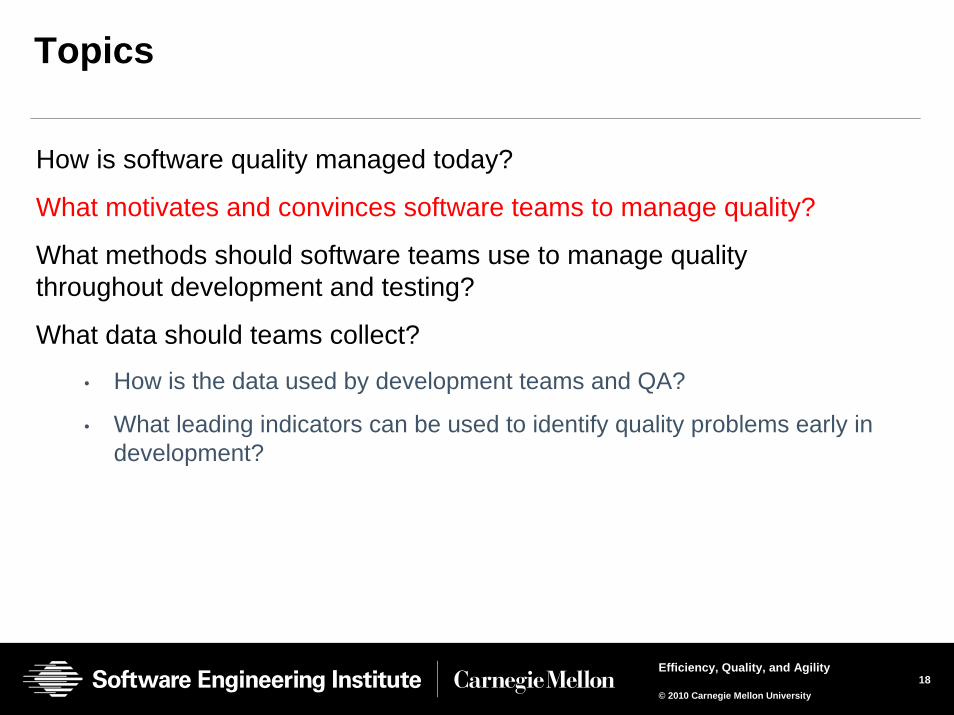
Topics
How is software quality managed today?
What motivates and convinces software teams to manage quality?
What methods should software teams use to manage quality throughout development and testing?
What data should teams collect?
• How is the data used by development teams and QA?
• What leading indicators can be used to identify quality problems early in development?
9Efficiency, Quality, and Agility
© 2010 Carnegie Mellon University
Software Industry Quality Performance
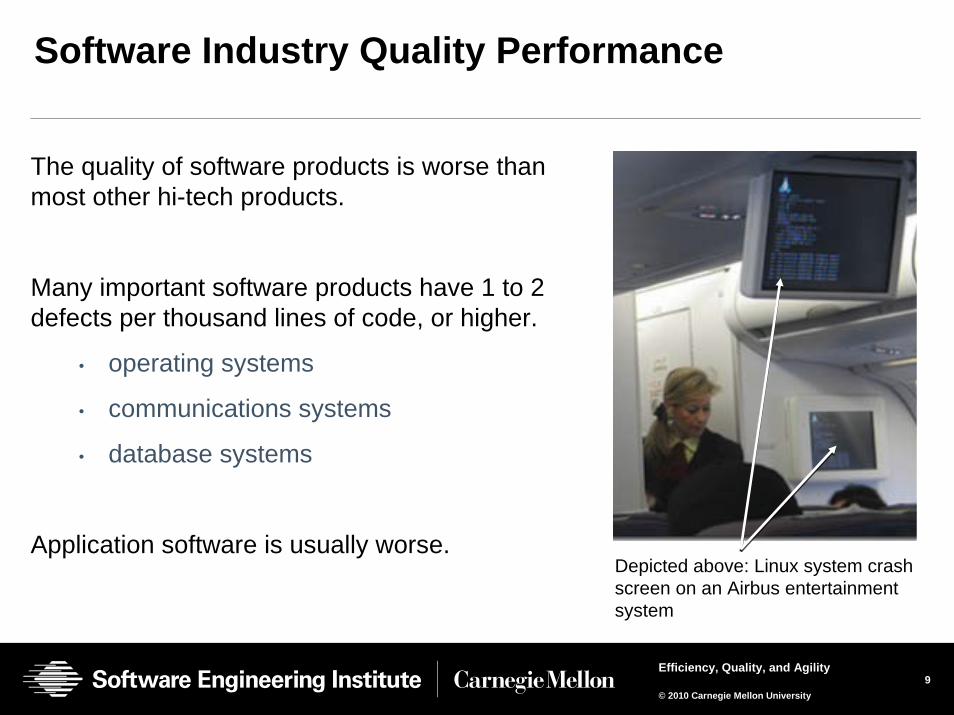
The quality of software products is worse than most other hi-tech products.
Many important software products have 1 to 2 defects per thousand lines of code, or higher.
• operating systems
• communications systems
• database systems
Application software is usually worse.Depicted above: Linux system crash screen on an Airbus entertainment system
10Efficiency, Quality, and Agility
© 2010 Carnegie Mellon University
Software Industry Quality Strategy
The software industry is the only modern high-tech industry that relies heavily on testing to remove defects.
Many software defects are found in or after test when defect removal costs are the highest and the methods are the least effective.
This strategy results in defective products and unnecessary rework that inflates development costs by 30% to 40% or more.
This strategy is also a principal cause of unexpected delays, system failures, and software security vulnerabilities.
11Efficiency, Quality, and Agility
© 2010 Carnegie Mellon University
Software Quality Practice
Formal inspections are not widely used.
• Peer review by another developer is the most common review practice
• Often only the “critical” code is reviewed or inspected.
• Inspections aren’t measured or managed to improve effectiveness.
Quantitative quality management is not common practice.
• Quality plans are generally qualitative not quantitative.
• Defects generally aren’t counted before test or code inspection.
• Quality cannot be managed or tracked before testing begins due to a lack of plans and data.
12Efficiency, Quality, and Agility
© 2010 Carnegie Mellon University
To Engineer is Human*
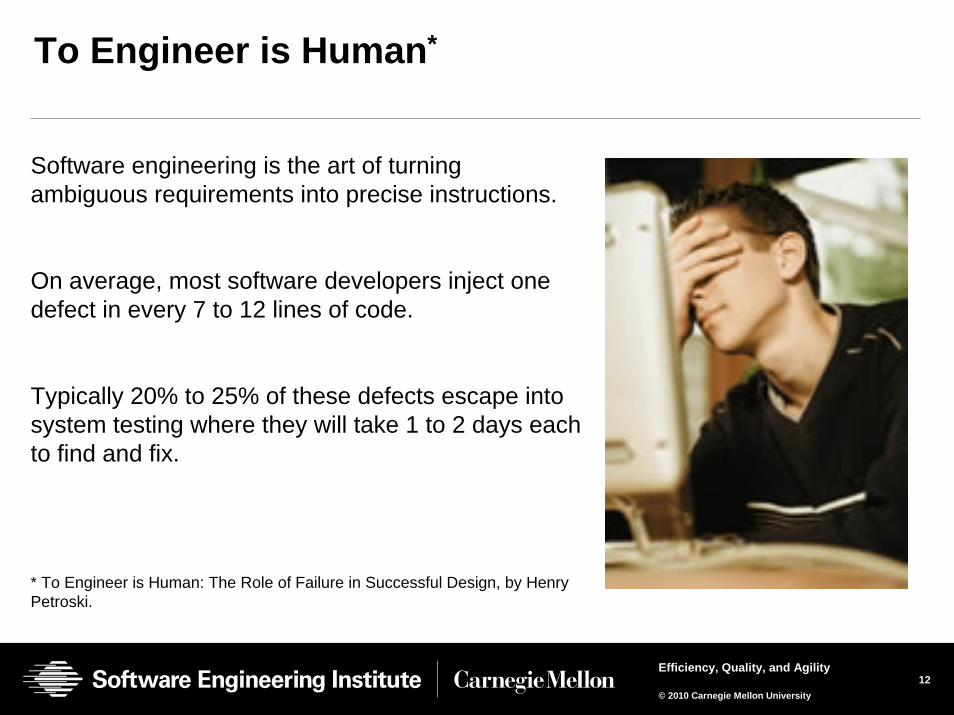
Software engineering is the art of turning ambiguous requirements into precise instructions.
On average, most software developers inject one defect in every 7 to 12 lines of code.
Typically 20% to 25% of these defects escape into system testing where they will take 1 to 2 days each to find and fix.
* To Engineer is Human: The Role of Failure in Successful Design, by Henry Petroski.
13Efficiency, Quality, and Agility
© 2010 Carnegie Mellon University
The Risk of Poor Quality
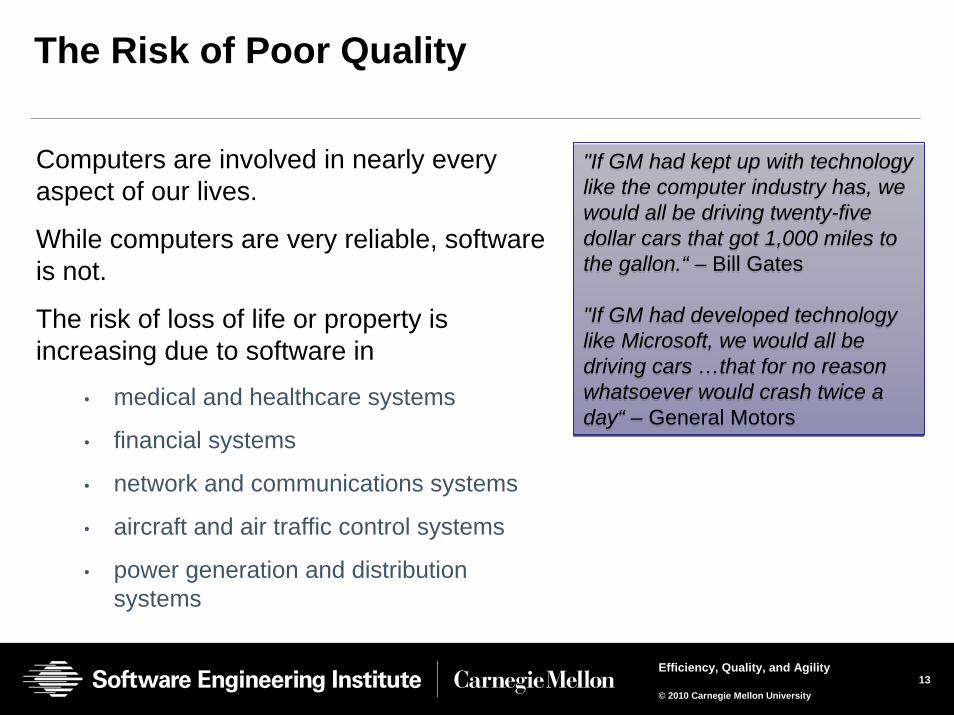
Computers are involved in nearly every aspect of our lives.
While computers are very reliable, software is not.
The risk of loss of life or property is increasing due to software in
• medical and healthcare systems
• financial systems
• network and communications systems
• aircraft and air traffic control systems
• power generation and distribution systems
"If GM had kept up with technology like the computer industry has, we would all be driving twenty-five dollar cars that got 1,000 miles to the gallon.“ – Bill Gates
"If GM had developed technology like Microsoft, we would all be driving cars …that for no reason whatsoever would crash twice a day“ – General Motors
14Efficiency, Quality, and Agility
© 2010 Carnegie Mellon University
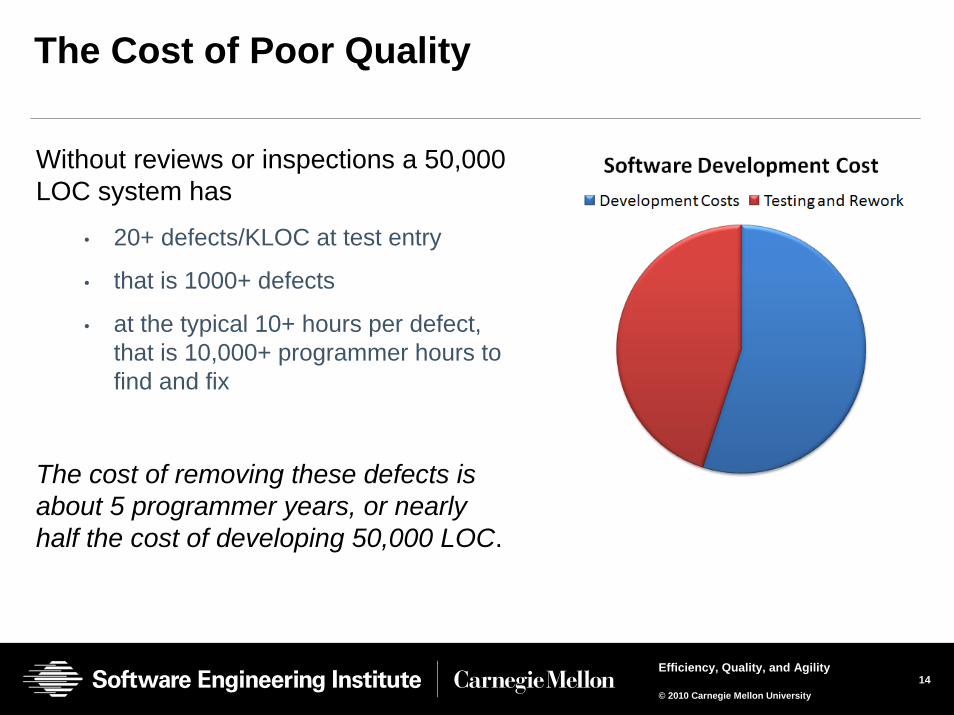
The Cost of Poor Quality
Without reviews or inspections a 50,000 LOC system has
• 20+ defects/KLOC at test entry
• that is 1000+ defects
• at the typical 10+ hours per defect, that is 10,000+ programmer hours to find and fix
The cost of removing these defects is about 5 programmer years, or nearly half the cost of developing 50,000 LOC.
15Efficiency, Quality, and Agility
© 2010 Carnegie Mellon University
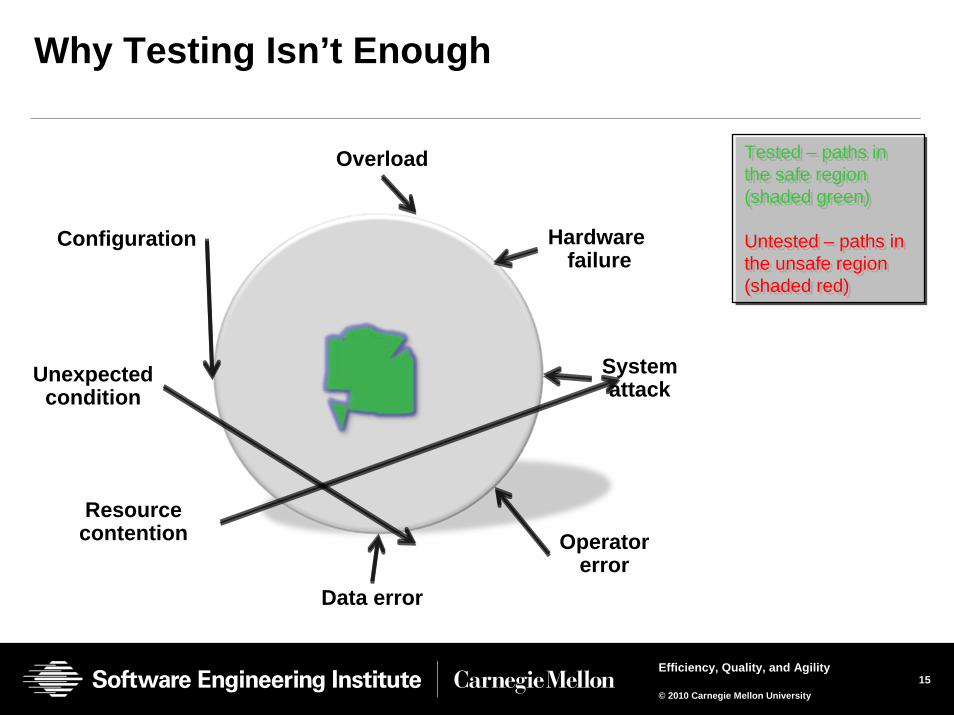
Why Testing Isn’t Enough
Overload
Hardware failure
Operatorerror
Data error
Resourcecontention
Configuration
Tested – paths in the safe region (shaded green)
Untested – paths in the unsafe region (shaded red)
Tested – paths in the safe region (shaded green)
Untested – paths in the unsafe region (shaded red)
Systemattack
Unexpectedcondition
16Efficiency, Quality, and Agility
© 2010 Carnegie Mellon University
Software Quality Management
IBM’s Dr. Harlan Mills said, “How do you know that you’ve found the last defect in system test?”
“You never find the first one.”
If you want a quality product out of test, you must put a quality product into test.
How do you put a quality product into test?
Measure and manage quality at every step, from requirements through system test.
17Efficiency, Quality, and Agility
© 2010 Carnegie Mellon University
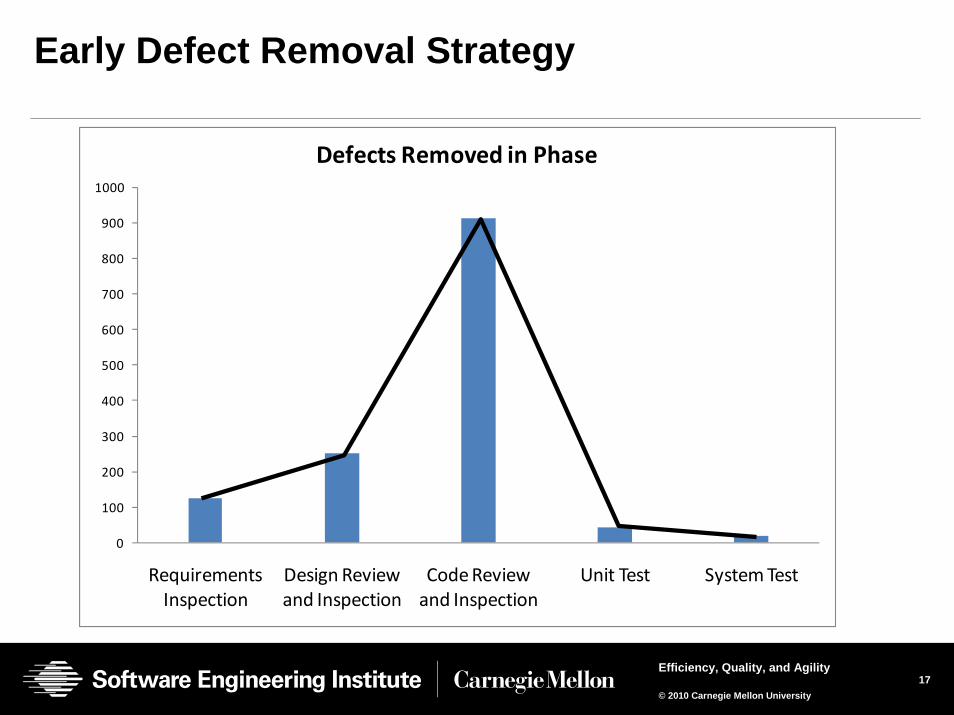
Early Defect Removal Strategy
0
100
200
300
400
500
600
700
800
900
1000
Requirements Inspection
Design Reviewand Inspection
Code Reviewand Inspection
Unit Test System Test
Defects Removed in Phase
18Efficiency, Quality, and Agility
© 2010 Carnegie Mellon University
Topics
How is software quality managed today?
What motivates and convinces software teams to manage quality?
What methods should software teams use to manage quality throughout development and testing?
What data should teams collect?
• How is the data used by development teams and QA?
• What leading indicators can be used to identify quality problems early in development?
19Efficiency, Quality, and Agility
© 2010 Carnegie Mellon University
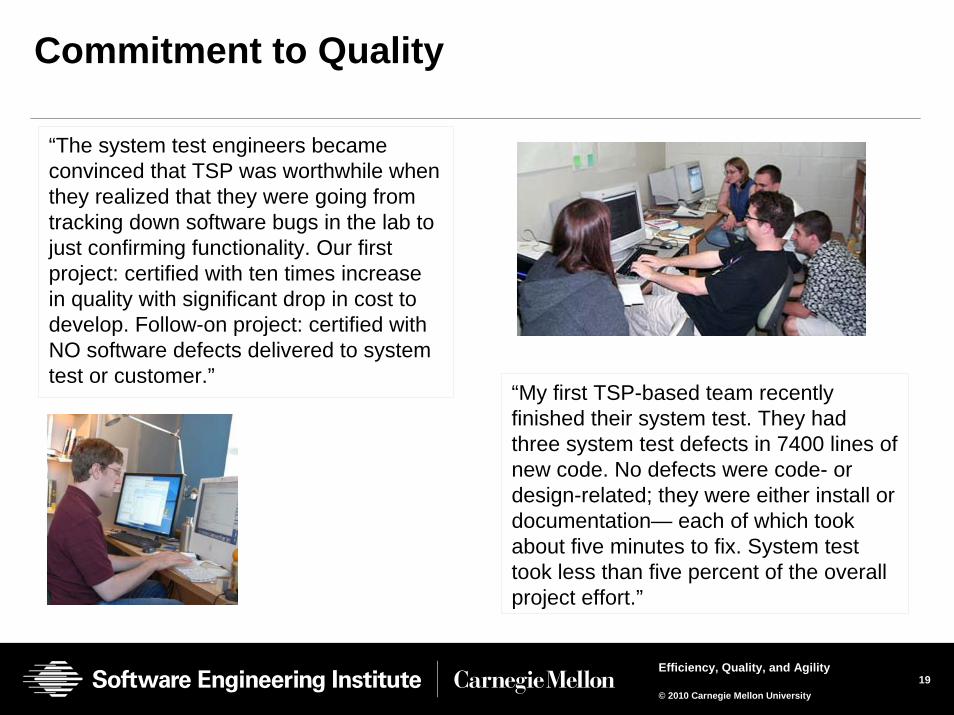
Commitment to Quality
“The system test engineers became convinced that TSP was worthwhile when they realized that they were going from tracking down software bugs in the lab to just confirming functionality. Our first project: certified with ten times increase in quality with significant drop in cost to develop. Follow-on project: certified with NO software defects delivered to system test or customer.”
“My first TSP-based team recently finished their system test. They had three system test defects in 7400 lines of new code. No defects were code- or design-related; they were either install or documentation— each of which took about five minutes to fix. System test took less than five percent of the overall project effort.”
20Efficiency, Quality, and Agility
© 2010 Carnegie Mellon University
Catch-22
To use new methods, software professionals must believe the methods will help them do better work.
To believe that, they must have used the methods.
To break this conundrum, TSP has a course where professionals
• use new methods to write several small programs
• plan, measure, track, and analyze their work
They then learn from their own data that the new methods work.
21Efficiency, Quality, and Agility
© 2010 Carnegie Mellon University
Learning to Develop Software
In computer science and software engineering education,• the emphasis is on technical knowledge and individual performance.
• evaluation emphasizes code that runs, not how the student got there.
• the prevailing ethic is to code quickly and fix the problems in test.
Developers then use these same practices on the job resulting in• missed commitments
• lengthy testing schedules
• buggy software
22Efficiency, Quality, and Agility
© 2010 Carnegie Mellon University
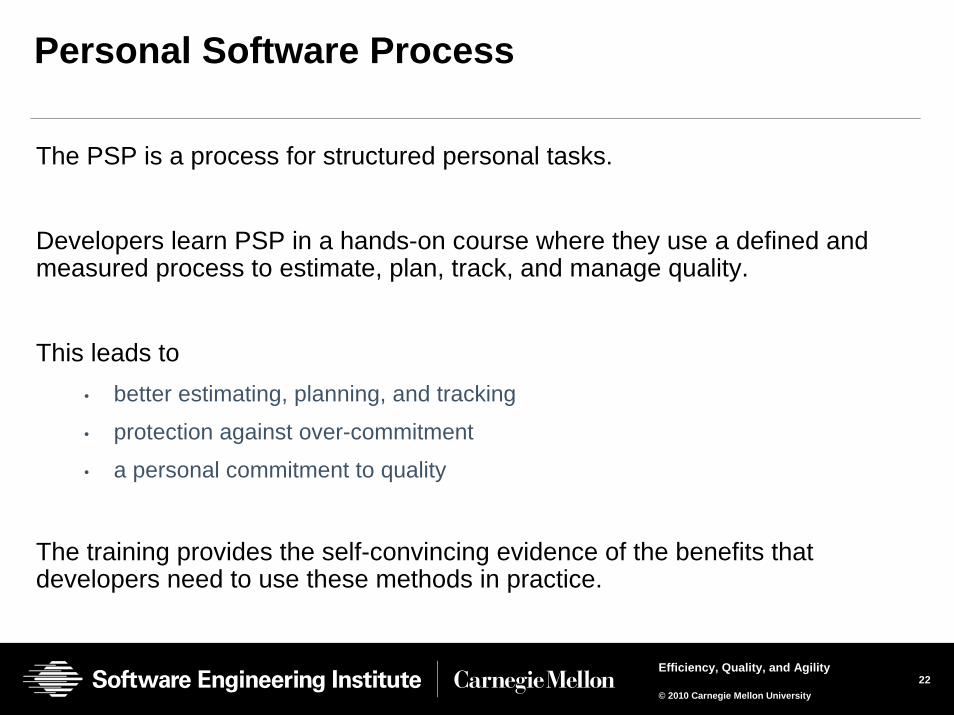
Personal Software Process
The PSP is a process for structured personal tasks.
Developers learn PSP in a hands-on course where they use a defined and measured process to estimate, plan, track, and manage quality.
This leads to• better estimating, planning, and tracking
• protection against over-commitment
• a personal commitment to quality
The training provides the self-convincing evidence of the benefits that developers need to use these methods in practice.
23Efficiency, Quality, and Agility
© 2010 Carnegie Mellon University
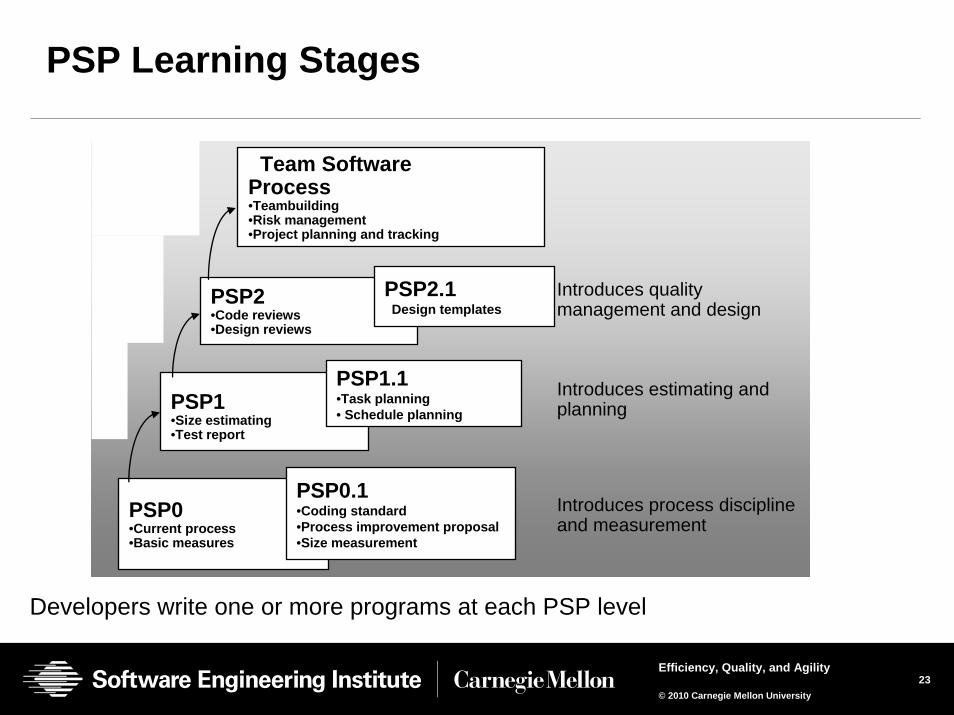
PSP Learning Stages
Developers write one or more programs at each PSP level
PSP0•Current process•Basic measures
PSP1•Size estimating•Test report
PSP2•Code reviews•Design reviews
Team Software Process•Teambuilding •Risk management•Project planning and tracking
PSP2.1Design templates
PSP1.1•Task planning• Schedule planning
PSP0.1•Coding standard•Process improvement proposal•Size measurement
Introduces process discipline and measurement
Introduces estimating and planning
Introduces quality management and design
24Efficiency, Quality, and Agility
© 2010 Carnegie Mellon University
PSP 0
PSP 1
PSP 2
100%0%-100%-200% 100%0%-100%-200%0
20
40
0
20
40
100%0%-100%-200% 100%0%-100%-200%0
20
40
0
20
40
100%0%-100%-200% 100%0%-100%-200%0
20
40
0
20
40
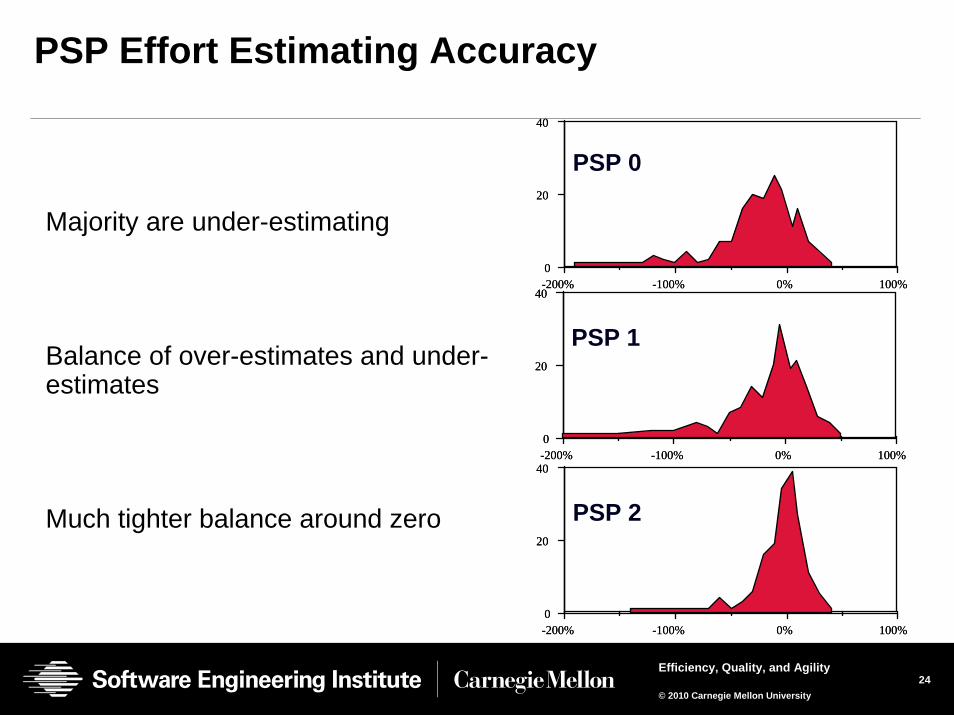
PSP Effort Estimating Accuracy
Majority are under-estimating
Balance of over-estimates and under-estimates
Much tighter balance around zero
25Efficiency, Quality, and Agility
© 2010 Carnegie Mellon University
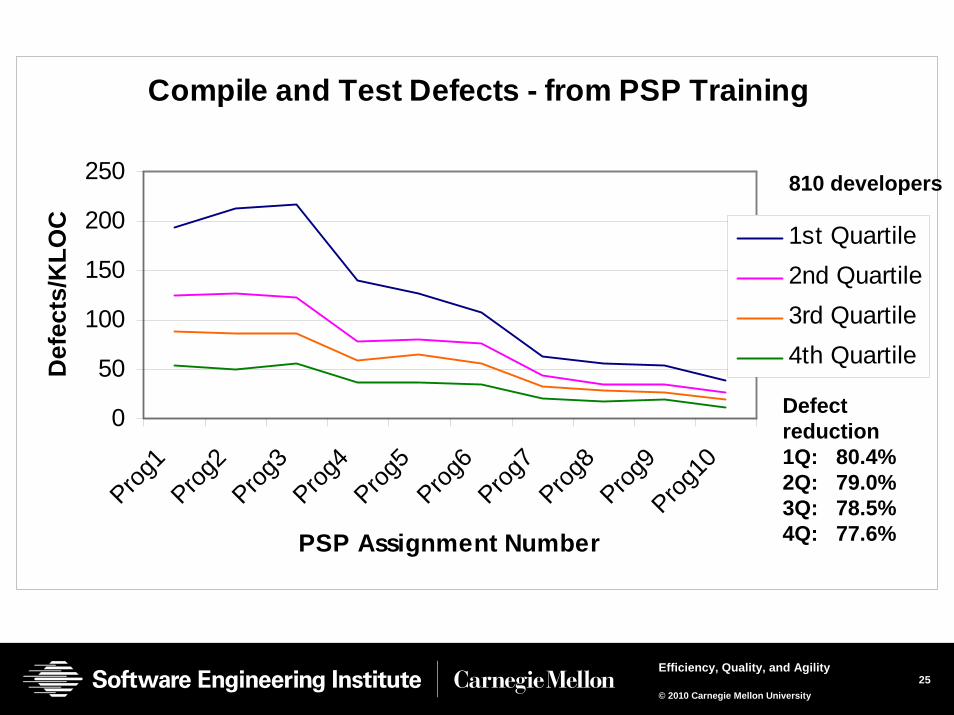
Compile and Test Defects - from PSP Training
0
50
100
150
200
250
Prog1
Prog2
Prog3
Prog4
Prog5
Prog6
Prog7
Prog8
Prog9
Prog10
PSP Assignment Number
Def
ects
/KLO
C 1st Quartile2nd Quartile3rd Quartile4th Quartile
810 developers
Defectreduction1Q: 80.4%2Q: 79.0% 3Q: 78.5% 4Q: 77.6%
26Efficiency, Quality, and Agility
© 2010 Carnegie Mellon University
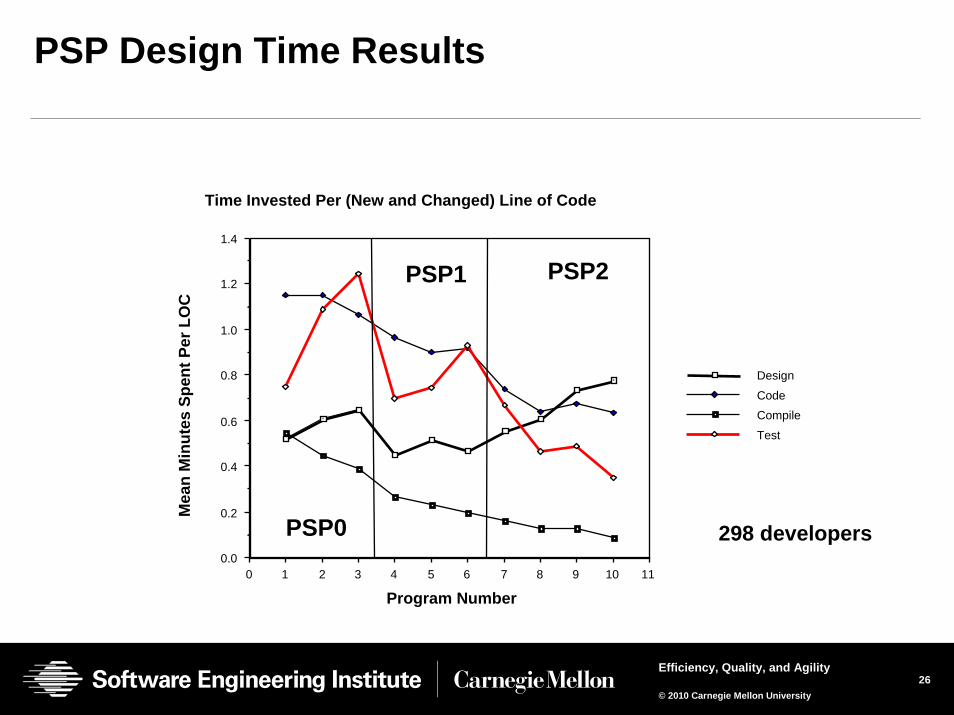
PSP Design Time Results
111098765432100.0
0.2
0.4
0.6
0.8
1.0
1.2
1.4
Design
CodeCompile
Test
Time Invested Per (New and Changed) Line of Code
Program Number
PSP0
PSP1 PSP2
Mea
n M
inut
es S
pent
Per
LO
C
298 developers
27Efficiency, Quality, and Agility
© 2010 Carnegie Mellon University
Quality and the Team
Quality doesn’t happen by accident.
Quality software is possible only when every member of a development team makes a personal commitment.
To build a high-quality product they must
• be properly trained and motivated
• understand their personal quality data
• have control of their process and plans
• have the proper data to track quality
28Efficiency, Quality, and Agility
© 2010 Carnegie Mellon University
Topics
How is software quality managed today?
What motivates and convinces software teams to manage quality?
What methods should software teams use to manage quality throughout development and testing?
What data should teams collect?
• How is the data used by development teams and QA?
• What leading indicators can be used to identify quality problems early in development?
29Efficiency, Quality, and Agility
© 2010 Carnegie Mellon University
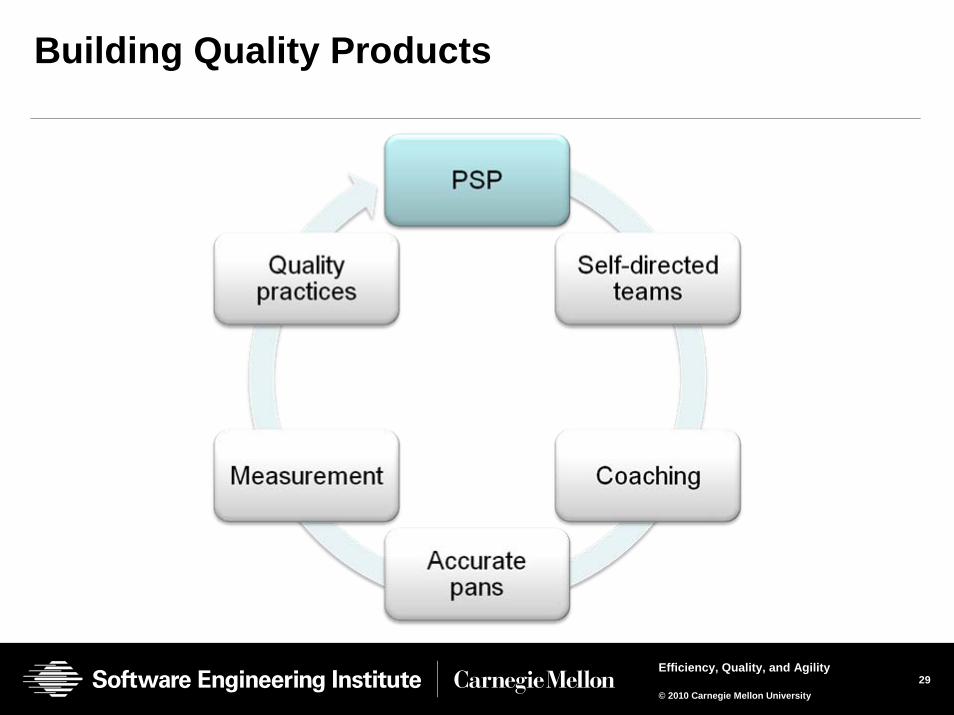
Building Quality Products
30Efficiency, Quality, and Agility
© 2010 Carnegie Mellon University
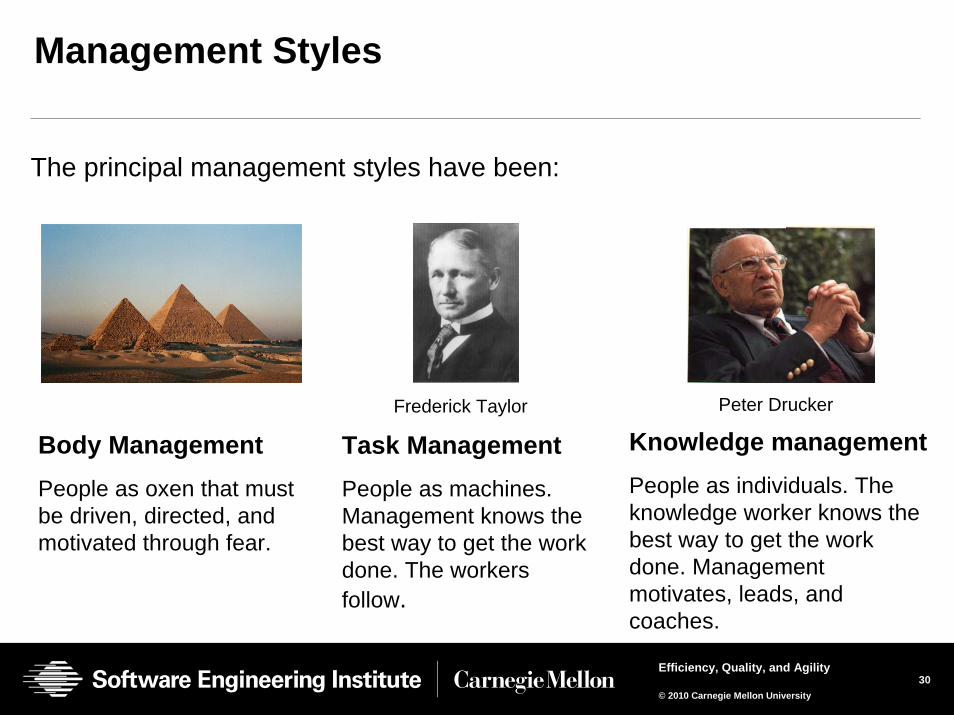
Management Styles
The principal management styles have been:
Knowledge managementPeople as individuals. The knowledge worker knows the best way to get the work done. Management motivates, leads, and coaches.
Body ManagementPeople as oxen that must be driven, directed, and motivated through fear.
Task ManagementPeople as machines. Management knows the best way to get the work done. The workers follow.
Frederick Taylor Peter Drucker
31Efficiency, Quality, and Agility
© 2010 Carnegie Mellon University
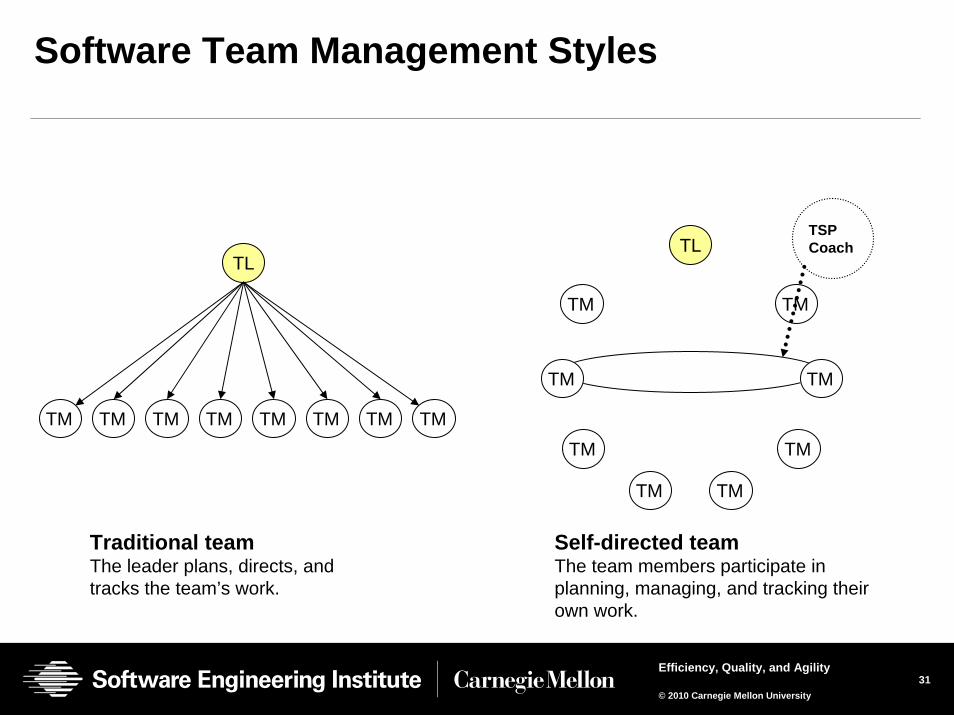
Software Team Management Styles
Traditional teamThe leader plans, directs, and tracks the team’s work.
TM TM TM TM
TL
TMTM TM TM
Self-directed teamThe team members participate in planning, managing, and tracking their own work.
TM
TM TM
TL
TM
TSP Coach
TM TM
TM TM
32Efficiency, Quality, and Agility
© 2010 Carnegie Mellon University
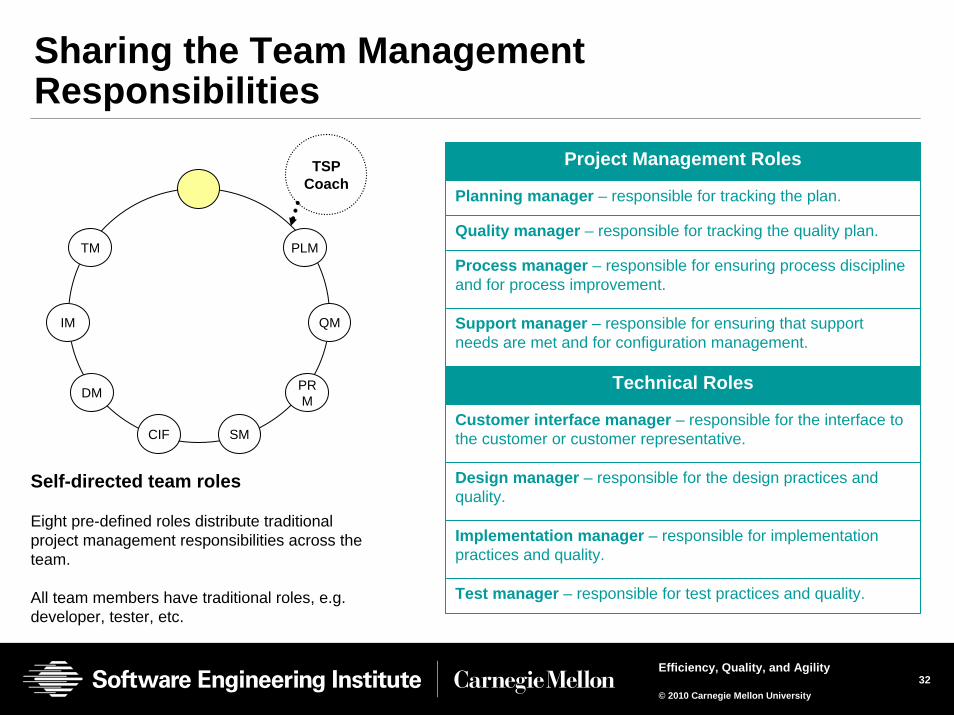
Sharing the Team Management Responsibilities
Project Management Roles
Planning manager – responsible for tracking the plan.
Quality manager – responsible for tracking the quality plan.
Process manager – responsible for ensuring process discipline and for process improvement.
Support manager – responsible for ensuring that support needs are met and for configuration management.
Technical Roles
Customer interface manager – responsible for the interface to the customer or customer representative.
Design manager – responsible for the design practices and quality.
Implementation manager – responsible for implementation practices and quality.
Test manager – responsible for test practices and quality.
TM
CIF SM
PLM
Self-directed team roles
Eight pre-defined roles distribute traditional project management responsibilities across the team.
All team members have traditional roles, e.g. developer, tester, etc.
TSP Coach
IM QM
DM PRM
33Efficiency, Quality, and Agility
© 2010 Carnegie Mellon University
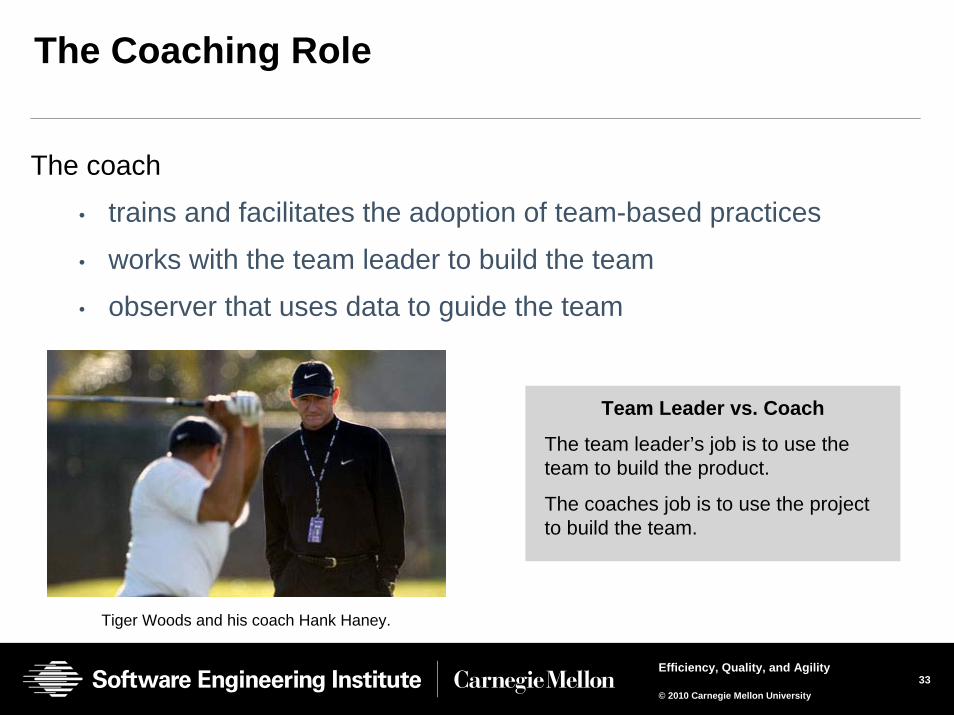
The Coaching Role
The coach
• trains and facilitates the adoption of team-based practices
• works with the team leader to build the team
• observer that uses data to guide the team
Team Leader vs. Coach
The team leader’s job is to use the team to build the product.
The coaches job is to use the project to build the team.
Tiger Woods and his coach Hank Haney.
34Efficiency, Quality, and Agility
© 2010 Carnegie Mellon University
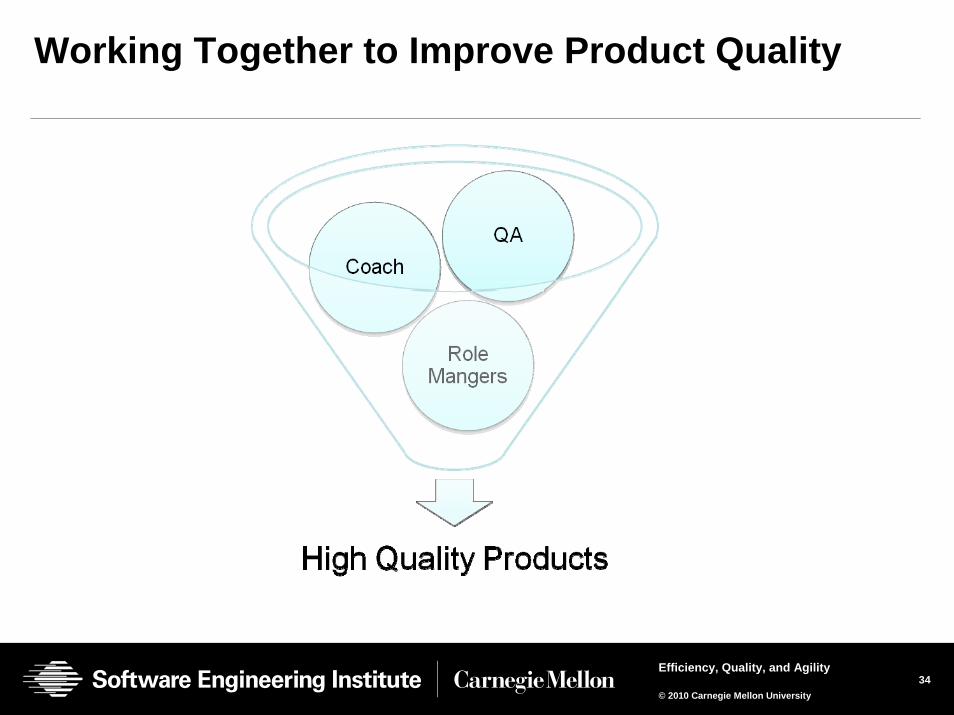
Working Together to Improve Product Quality
35Efficiency, Quality, and Agility
© 2010 Carnegie Mellon University
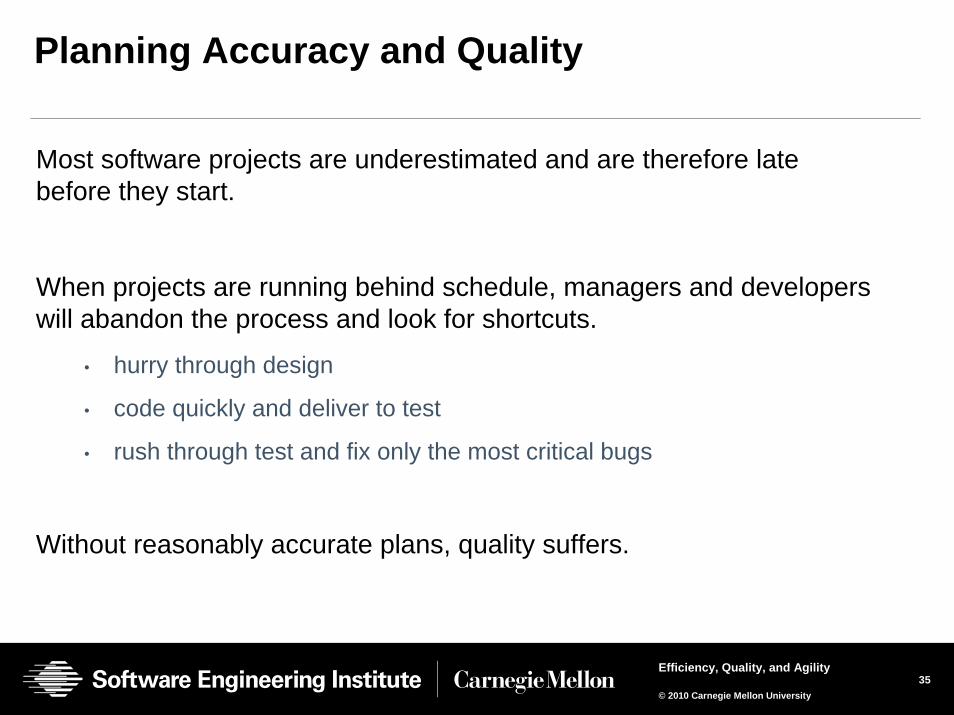
Planning Accuracy and Quality
Most software projects are underestimated and are therefore latebefore they start.
When projects are running behind schedule, managers and developers will abandon the process and look for shortcuts.
• hurry through design
• code quickly and deliver to test
• rush through test and fix only the most critical bugs
Without reasonably accurate plans, quality suffers.
36Efficiency, Quality, and Agility
© 2010 Carnegie Mellon University
36
Guidelines for Improving Plan Accuracy
Create a conceptual design as the basis for the estimate.
Estimate size first, then effort, to reduce estimating bias.
Use historical data for size and effort estimates to further reduce bias.
Estimate in detail to further reduce cumulative error.
Use historical data to estimate resource availability.
Make and use a quantitative quality plan to reduce the risk of schedule delays caused by “buggy” software.
Do workload balancing.
Good plans are dynamic, plan early and often.
The best plans are made by the people assigned to do the work.
37Efficiency, Quality, and Agility
© 2010 Carnegie Mellon University
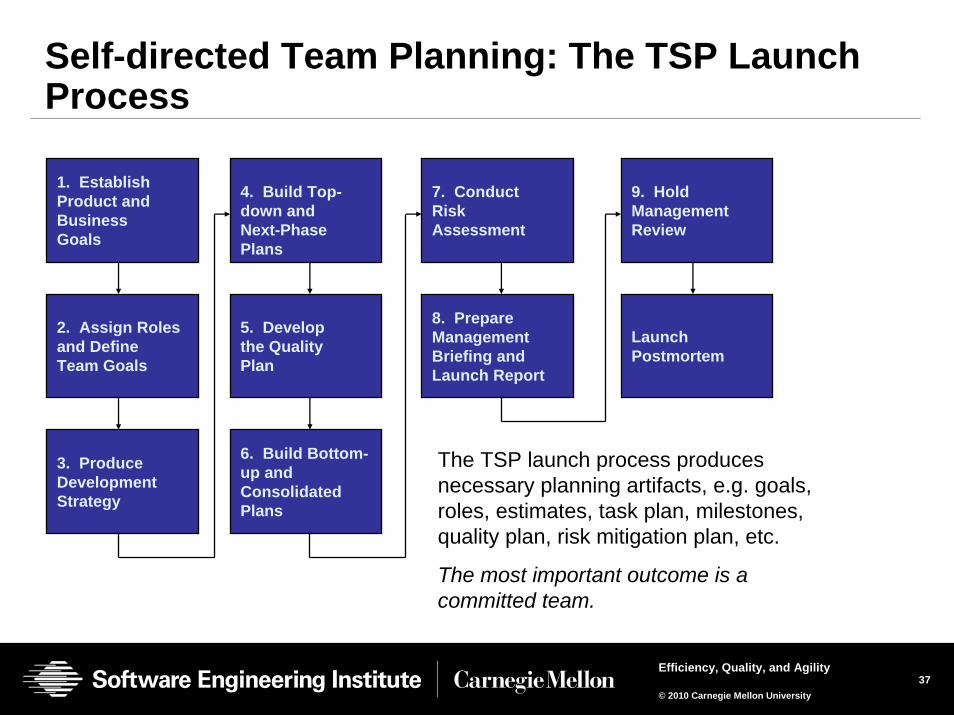
Self-directed Team Planning: The TSP Launch Process
The TSP launch process produces necessary planning artifacts, e.g. goals, roles, estimates, task plan, milestones, quality plan, risk mitigation plan, etc.
The most important outcome is a committed team.
1. Establish Product and Business Goals
2. Assign Rolesand Define Team Goals
4. Build Top-down and Next-Phase Plans
5. Developthe Quality Plan
6. Build Bottom-up andConsolidatedPlans
7. ConductRiskAssessment
8. PrepareManagementBriefing andLaunch Report
LaunchPostmortem
9. HoldManagementReview
3. Produce DevelopmentStrategy
38Efficiency, Quality, and Agility
© 2010 Carnegie Mellon University
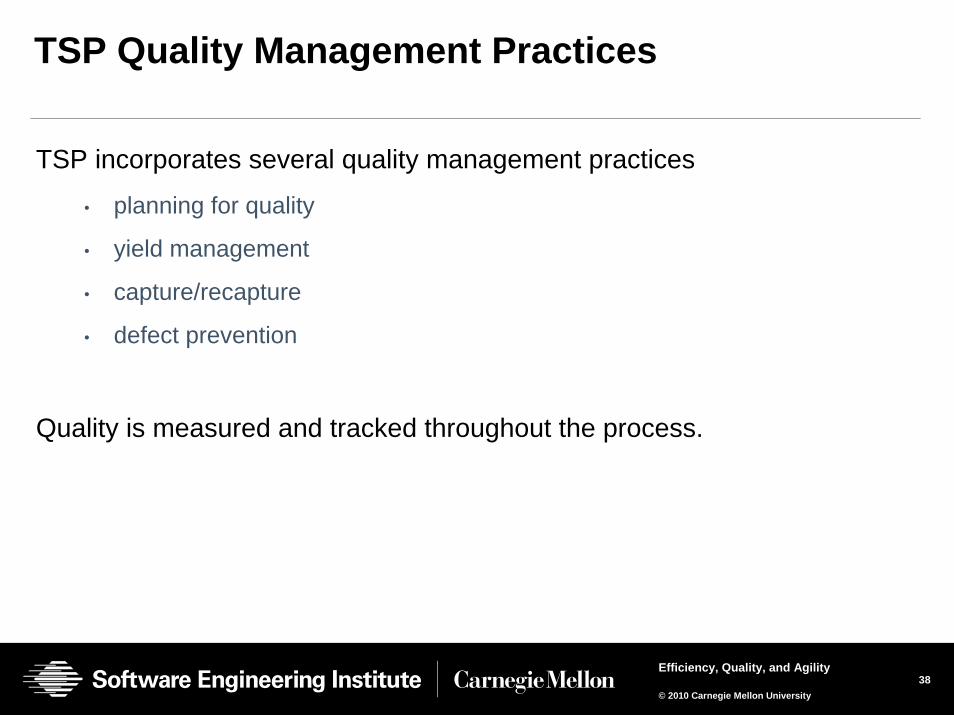
TSP Quality Management Practices
TSP incorporates several quality management practices
• planning for quality
• yield management
• capture/recapture
• defect prevention
Quality is measured and tracked throughout the process.
39Efficiency, Quality, and Agility
© 2010 Carnegie Mellon University
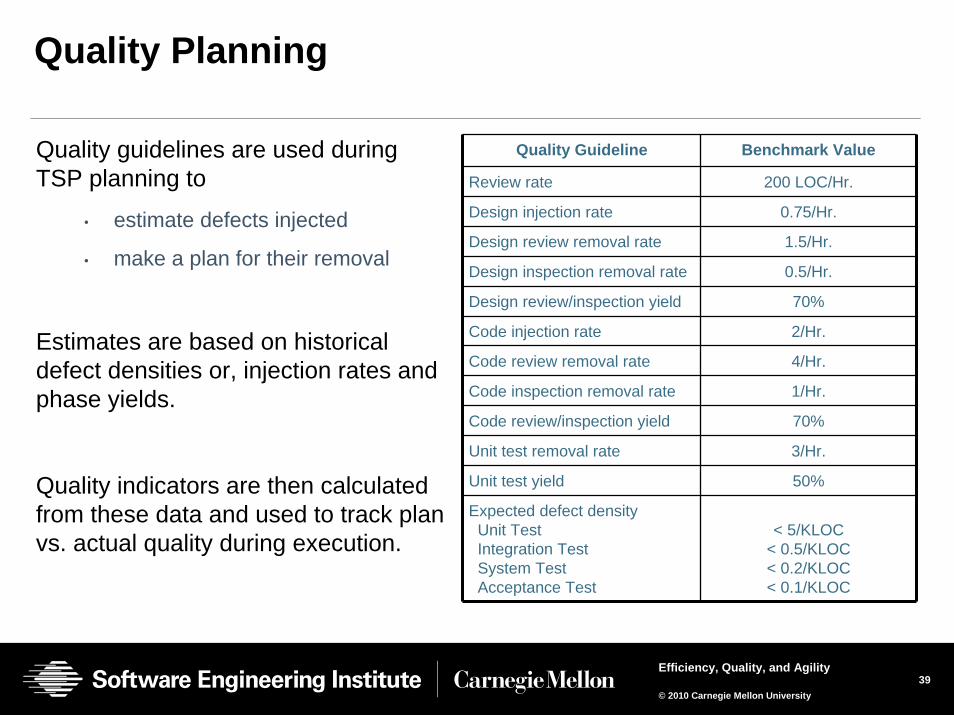
Quality Planning
Quality guidelines are used during TSP planning to
• estimate defects injected
• make a plan for their removal
Estimates are based on historical defect densities or, injection rates and phase yields.
Quality indicators are then calculated from these data and used to track plan vs. actual quality during execution.
Quality Guideline Benchmark Value
Review rate 200 LOC/Hr.
Design injection rate 0.75/Hr.
Design review removal rate 1.5/Hr.
Design inspection removal rate 0.5/Hr.
Design review/inspection yield 70%
Code injection rate 2/Hr.
Code review removal rate 4/Hr.
Code inspection removal rate 1/Hr.
Code review/inspection yield 70%
Unit test removal rate 3/Hr.
Unit test yield 50%
Expected defect densityUnit TestIntegration TestSystem TestAcceptance Test
< 5/KLOC< 0.5/KLOC< 0.2/KLOC< 0.1/KLOC
40Efficiency, Quality, and Agility
© 2010 Carnegie Mellon University
Yield Management
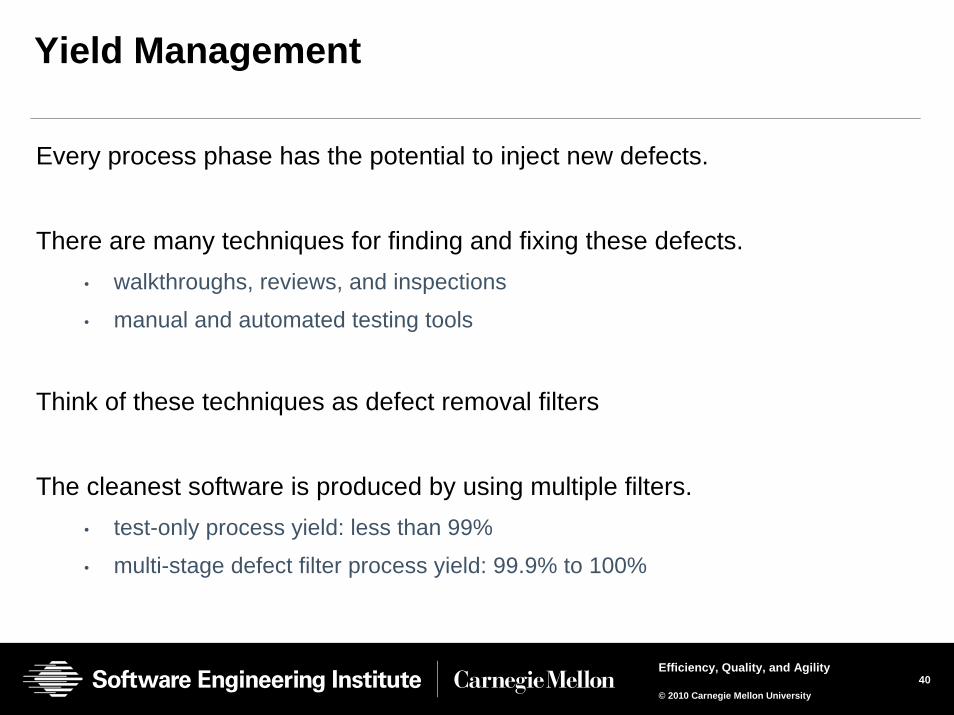
Every process phase has the potential to inject new defects.
There are many techniques for finding and fixing these defects.• walkthroughs, reviews, and inspections
• manual and automated testing tools
Think of these techniques as defect removal filters
The cleanest software is produced by using multiple filters.• test-only process yield: less than 99%
• multi-stage defect filter process yield: 99.9% to 100%
41Efficiency, Quality, and Agility
© 2010 Carnegie Mellon University
Static Analysis(optional)
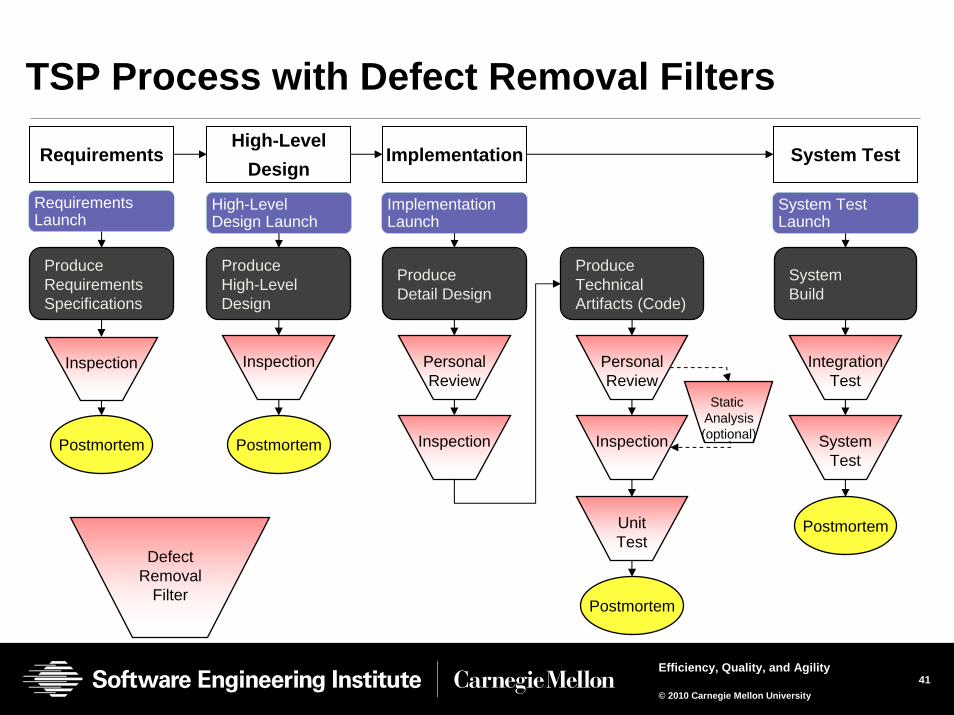
TSP Process with Defect Removal Filters
RequirementsLaunch
ProduceRequirementsSpecifications
Inspection
Postmortem
ProduceHigh-LevelDesign
System TestLaunch
Postmortem
ImplementationLaunch
ProduceDetail Design
ProduceTechnicalArtifacts (Code)
Postmortem
High-LevelDesign Launch
Inspection
Postmortem
PersonalReview
Inspection
PersonalReview
UnitTest
Inspection
SystemBuild
IntegrationTest
SystemTest
RequirementsHigh-Level
DesignImplementation System Test
DefectRemoval
Filter
42Efficiency, Quality, and Agility
© 2010 Carnegie Mellon University
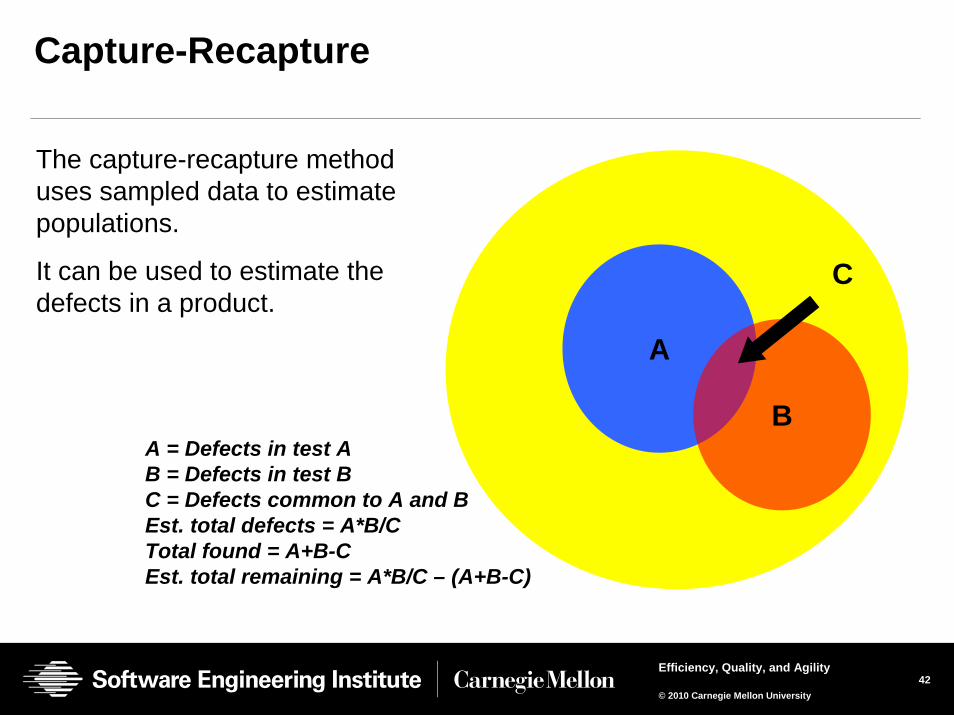
Capture-Recapture
The capture-recapture method uses sampled data to estimate populations.
It can be used to estimate the defects in a product.
A
B
C
A = Defects in test AB = Defects in test BC = Defects common to A and BEst. total defects = A*B/CTotal found = A+B-CEst. total remaining = A*B/C – (A+B-C)
43Efficiency, Quality, and Agility
© 2010 Carnegie Mellon University
System Test and Defect Prevention
What is the typical response when a defect is found in system test?
• The defect is reported.
• Someone is assigned to find and fix it.
• When fixed the module is checked back in for testing.
System test yields are low (~50%), so system test defects get special treatment in the TSP.
• Every defective module is re-inspected.
• A defect prevention process is invoked if defects are found during or after system test.
• Each defect is analyzed to prevent future escapes.
44Efficiency, Quality, and Agility
© 2010 Carnegie Mellon University
Topics
How is software quality managed today?
What motivates and convinces software teams to manage quality?
What methods should software teams use to manage quality throughout development and testing?
What data should teams collect?
• How is the data used by development teams and QA?
• What leading indicators can be used to identify quality problems early in development?
45Efficiency, Quality, and Agility
© 2010 Carnegie Mellon University
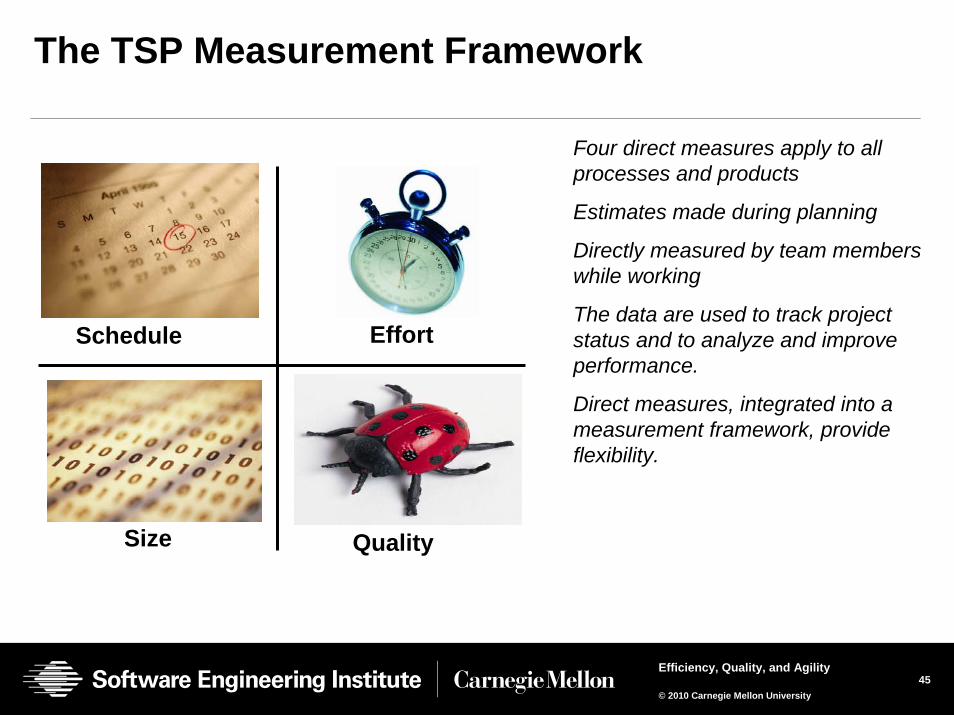
The TSP Measurement Framework
Four direct measures apply to all processes and products
Estimates made during planning
Directly measured by team members while working
The data are used to track project status and to analyze and improve performance.
Direct measures, integrated into a measurement framework, provide flexibility.
Size
Schedule
Quality
Effort
Source: CMU/SEI-92-TR-019
46Efficiency, Quality, and Agility
© 2010 Carnegie Mellon University
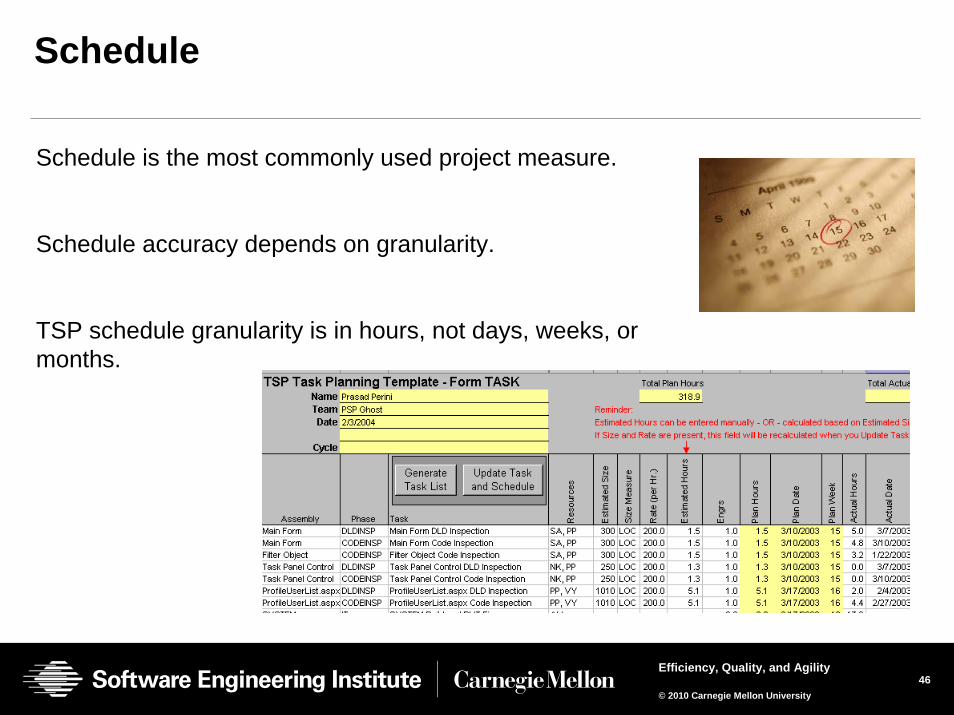
Schedule
Schedule is the most commonly used project measure.
Schedule accuracy depends on granularity.
TSP schedule granularity is in hours, not days, weeks, or months.
47Efficiency, Quality, and Agility
© 2010 Carnegie Mellon University
Time
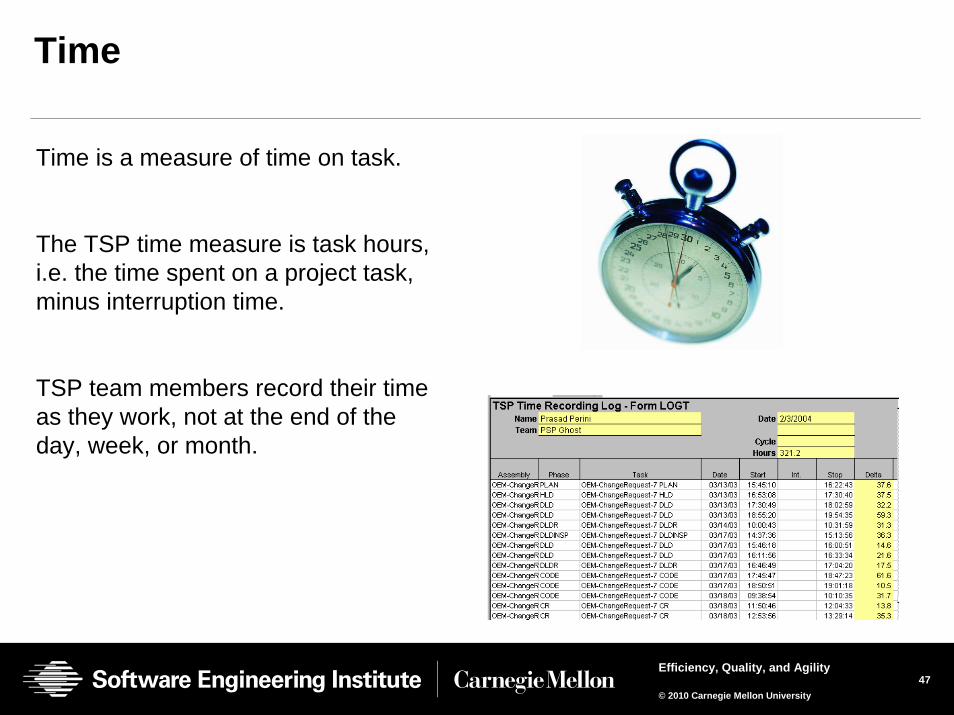
Time is a measure of time on task.
The TSP time measure is task hours, i.e. the time spent on a project task, minus interruption time.
TSP team members record their time as they work, not at the end of the day, week, or month.
48Efficiency, Quality, and Agility
© 2010 Carnegie Mellon University
Size
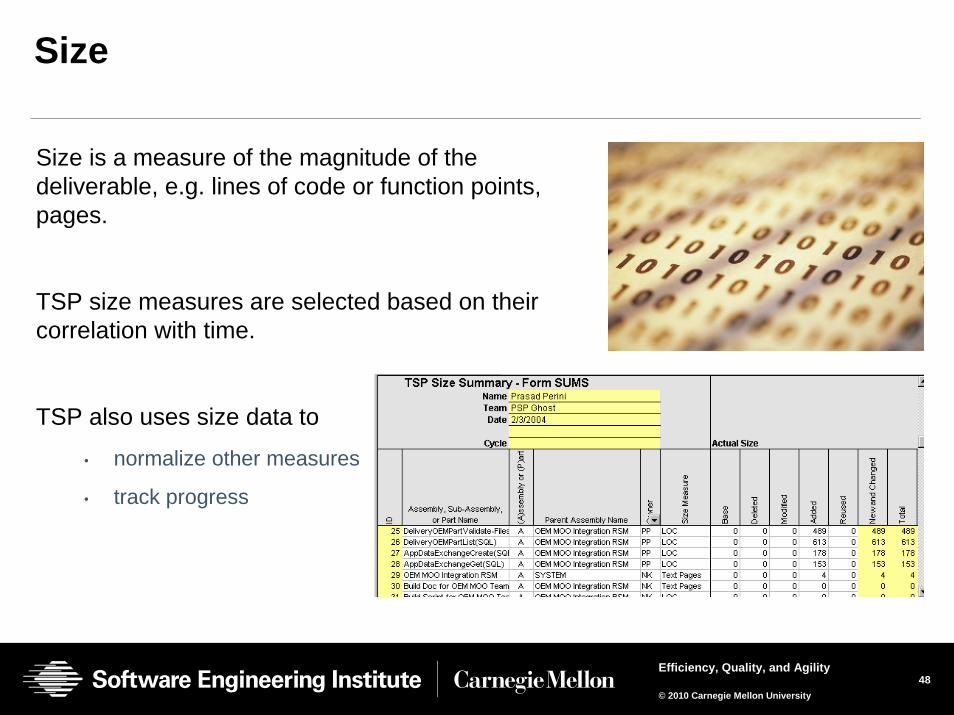
Size is a measure of the magnitude of the deliverable, e.g. lines of code or function points, pages.
TSP size measures are selected based on their correlation with time.
TSP also uses size data to
• normalize other measures
• track progress
49Efficiency, Quality, and Agility
© 2010 Carnegie Mellon University
Defects
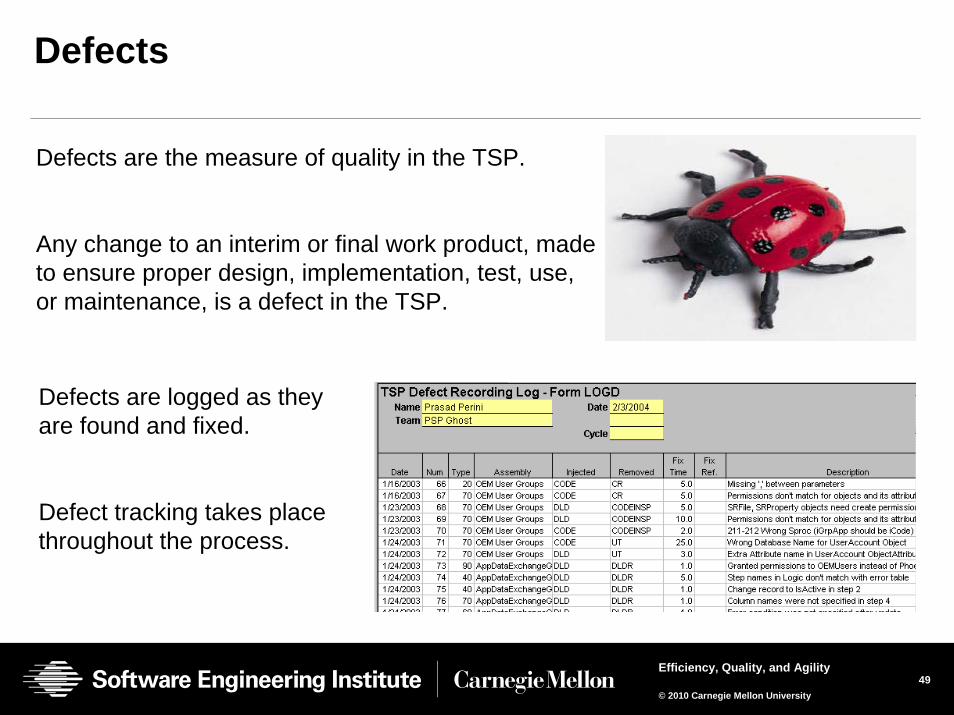
Defects are the measure of quality in the TSP.
Any change to an interim or final work product, made to ensure proper design, implementation, test, use, or maintenance, is a defect in the TSP.
Defects are logged as they are found and fixed.
Defect tracking takes place throughout the process.
50Efficiency, Quality, and Agility
© 2010 Carnegie Mellon University
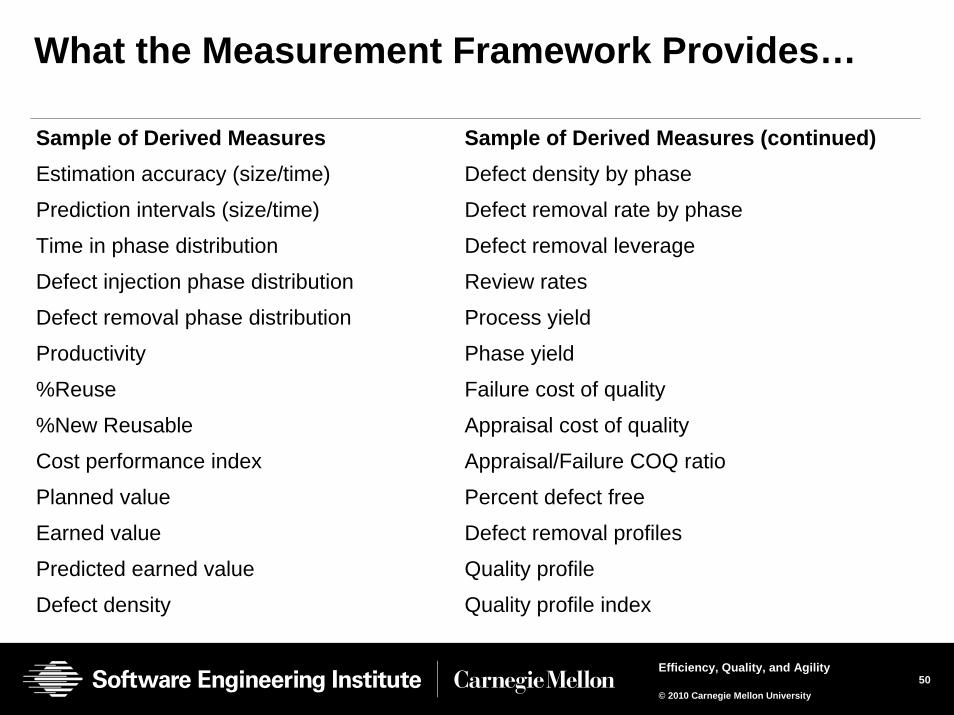
What the Measurement Framework Provides…
Sample of Derived MeasuresEstimation accuracy (size/time)
Prediction intervals (size/time)
Time in phase distribution
Defect injection phase distribution
Defect removal phase distribution
Productivity
%Reuse
%New Reusable
Cost performance index
Planned value
Earned value
Predicted earned value
Defect density
Sample of Derived Measures (continued)Defect density by phase
Defect removal rate by phase
Defect removal leverage
Review rates
Process yield
Phase yield
Failure cost of quality
Appraisal cost of quality
Appraisal/Failure COQ ratio
Percent defect free
Defect removal profiles
Quality profile
Quality profile index
51Efficiency, Quality, and Agility
© 2010 Carnegie Mellon University
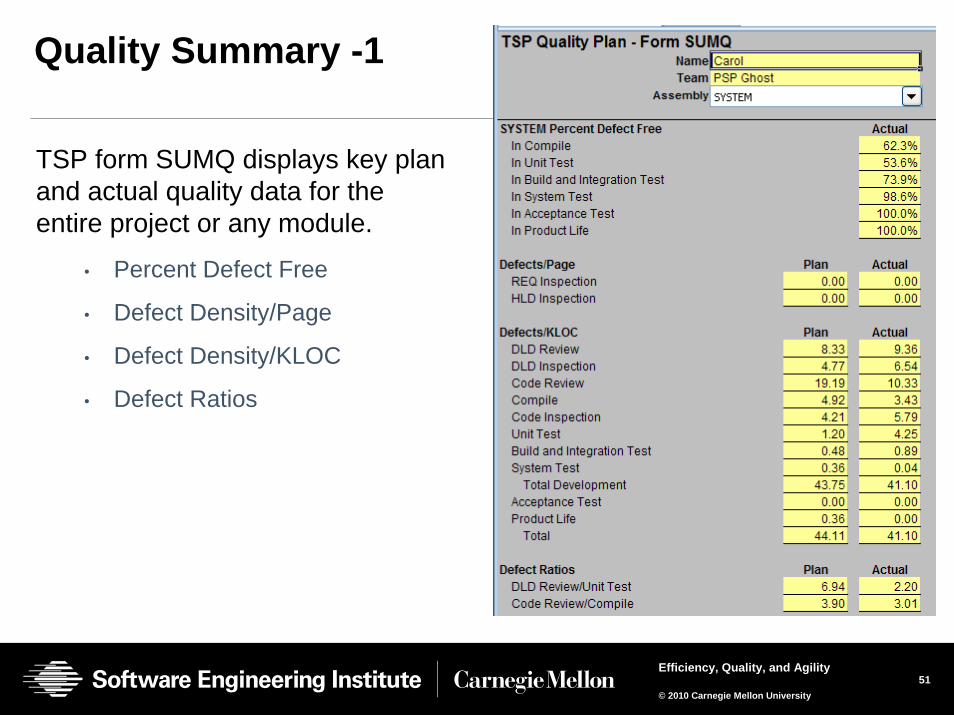
Quality Summary -1
TSP form SUMQ displays key plan and actual quality data for the entire project or any module.
• Percent Defect Free
• Defect Density/Page
• Defect Density/KLOC
• Defect Ratios
52Efficiency, Quality, and Agility
© 2010 Carnegie Mellon University
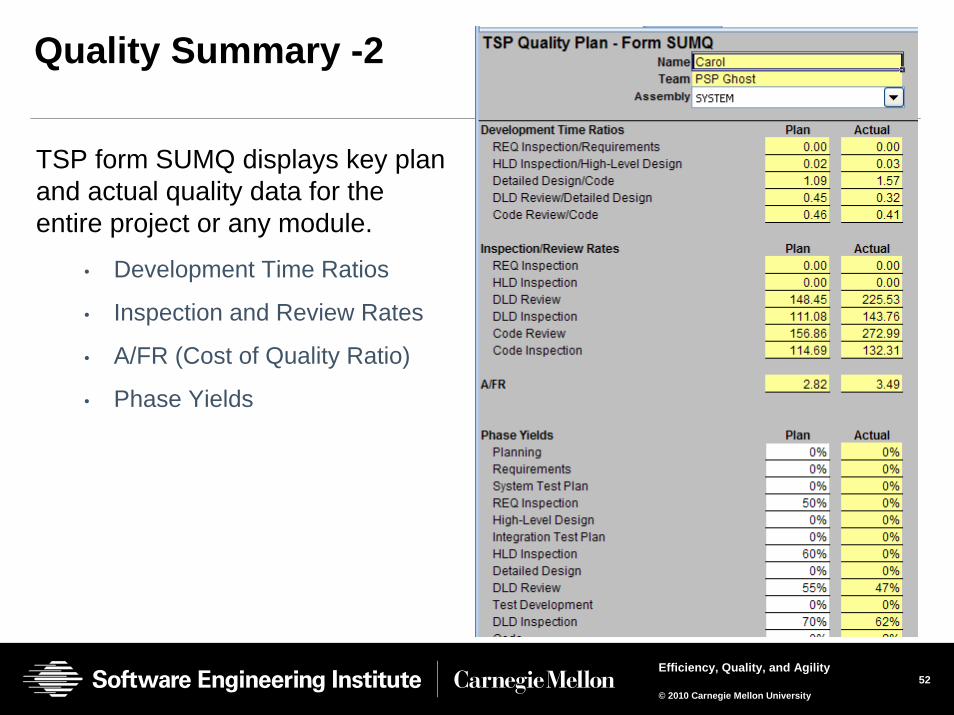
Quality Summary -2
TSP form SUMQ displays key plan and actual quality data for the entire project or any module.
• Development Time Ratios
• Inspection and Review Rates
• A/FR (Cost of Quality Ratio)
• Phase Yields
53Efficiency, Quality, and Agility
© 2010 Carnegie Mellon University
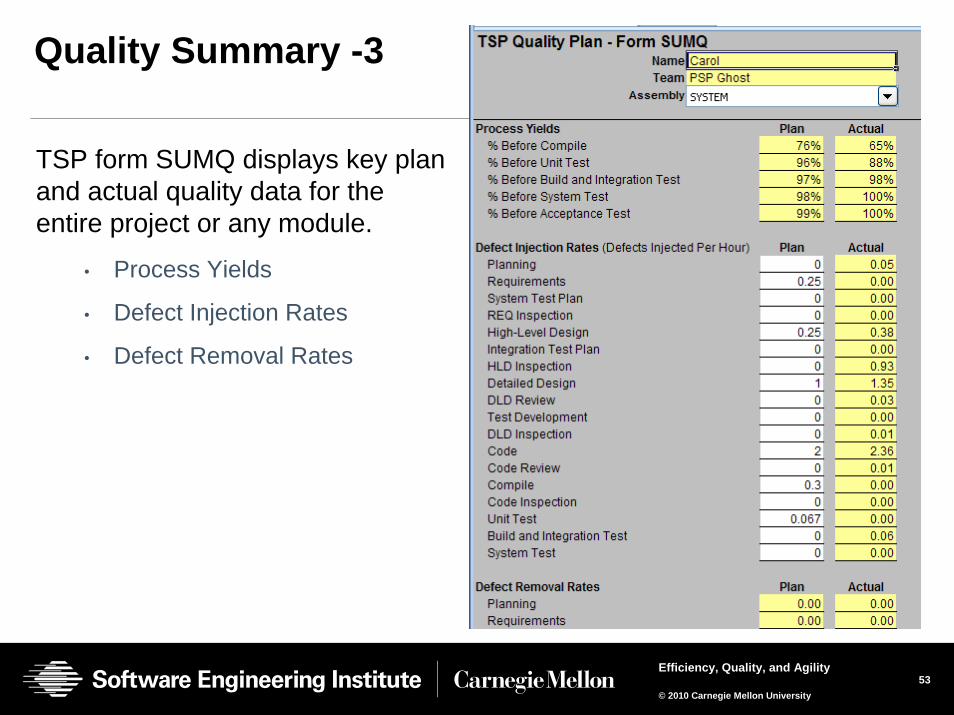
Quality Summary -3
TSP form SUMQ displays key plan and actual quality data for the entire project or any module.
• Process Yields
• Defect Injection Rates
• Defect Removal Rates
54Efficiency, Quality, and Agility
© 2010 Carnegie Mellon University
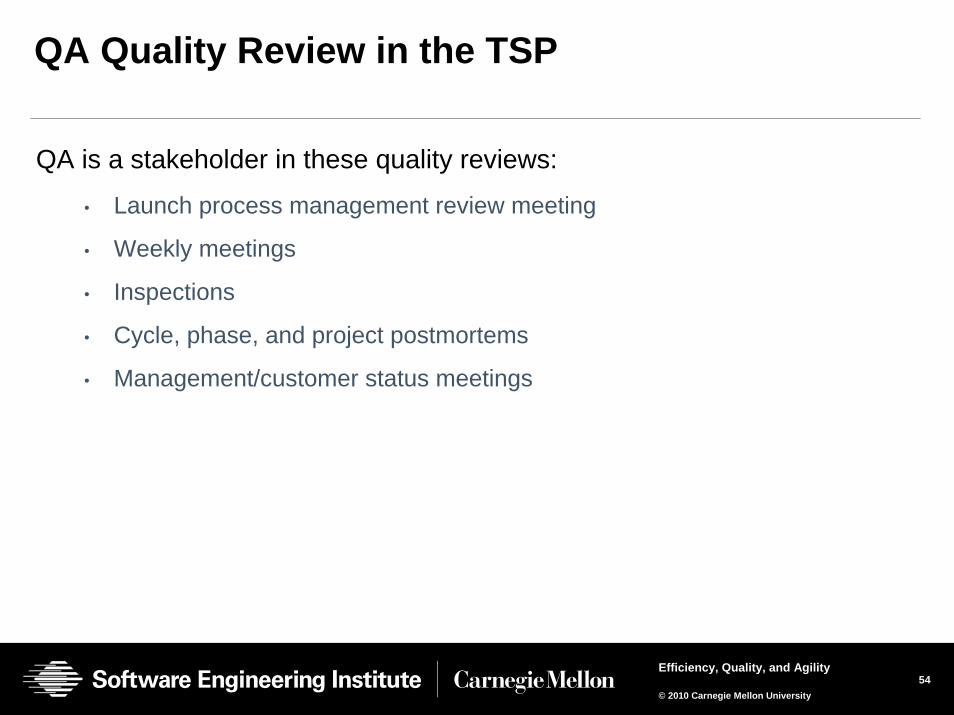
QA Quality Review in the TSP
QA is a stakeholder in these quality reviews:
• Launch process management review meeting
• Weekly meetings
• Inspections
• Cycle, phase, and project postmortems
• Management/customer status meetings
55Efficiency, Quality, and Agility
© 2010 Carnegie Mellon University
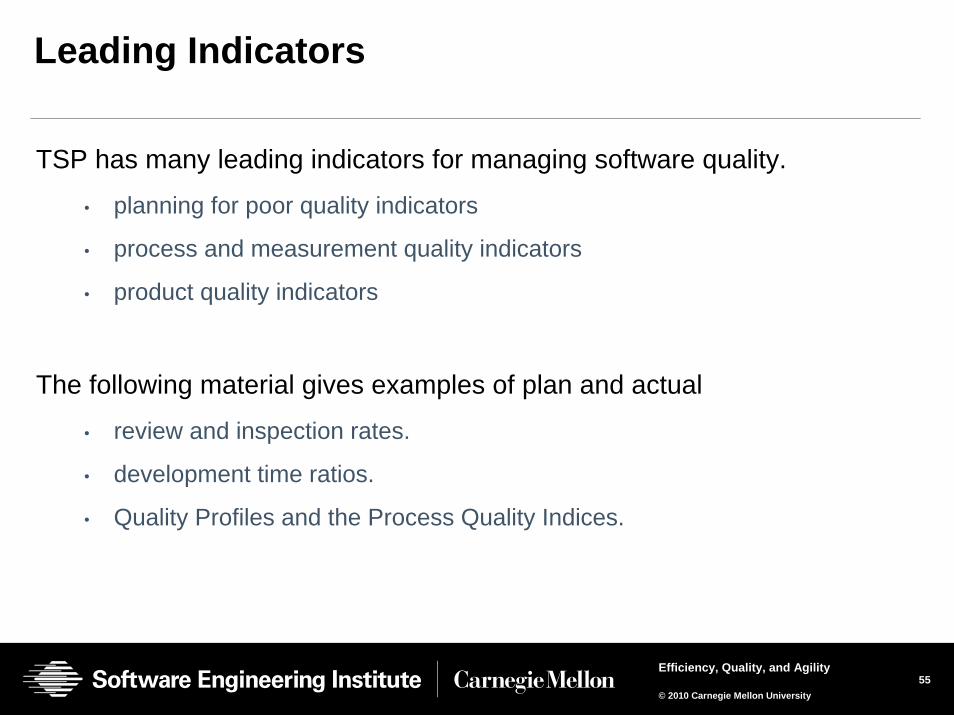
Leading Indicators
TSP has many leading indicators for managing software quality.
• planning for poor quality indicators
• process and measurement quality indicators
• product quality indicators
The following material gives examples of plan and actual
• review and inspection rates.
• development time ratios.
• Quality Profiles and the Process Quality Indices.
56Efficiency, Quality, and Agility
© 2010 Carnegie Mellon University
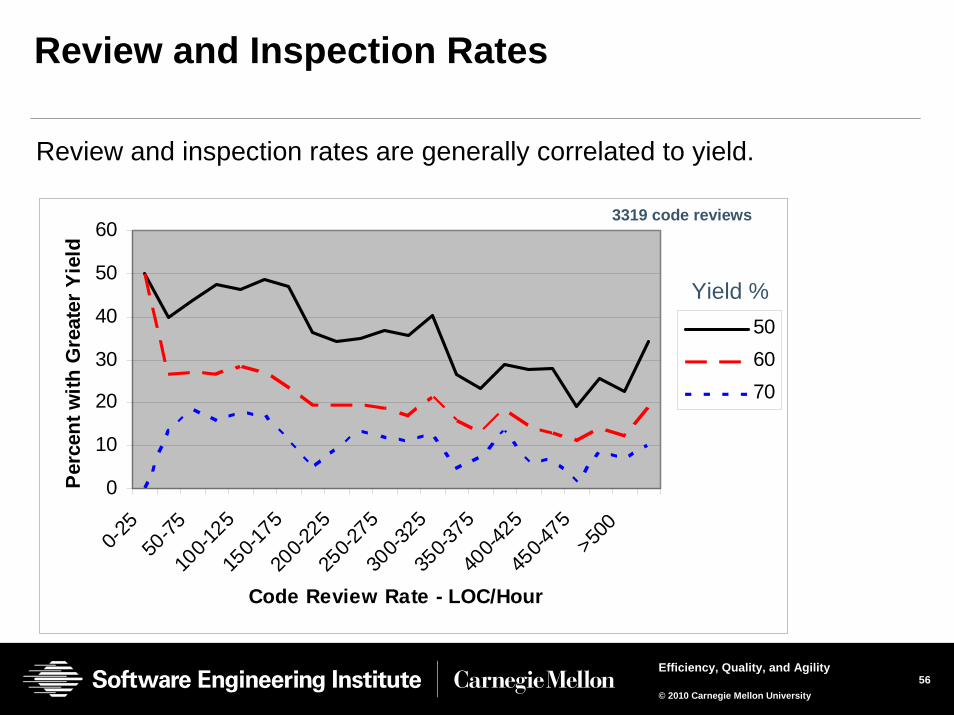
Review and Inspection Rates
Review and inspection rates are generally correlated to yield.
0
10
20
30
40
50
60
0-25
50-75
100-1
2515
0-175
200-2
2525
0-275
300-3
2535
0-375
400-4
2545
0-475
>500
Code Review Rate - LOC/Hour
Per
cent
with
Gre
ater
Yie
ld
506070
3319 code reviews
Yield %
57Efficiency, Quality, and Agility
© 2010 Carnegie Mellon University
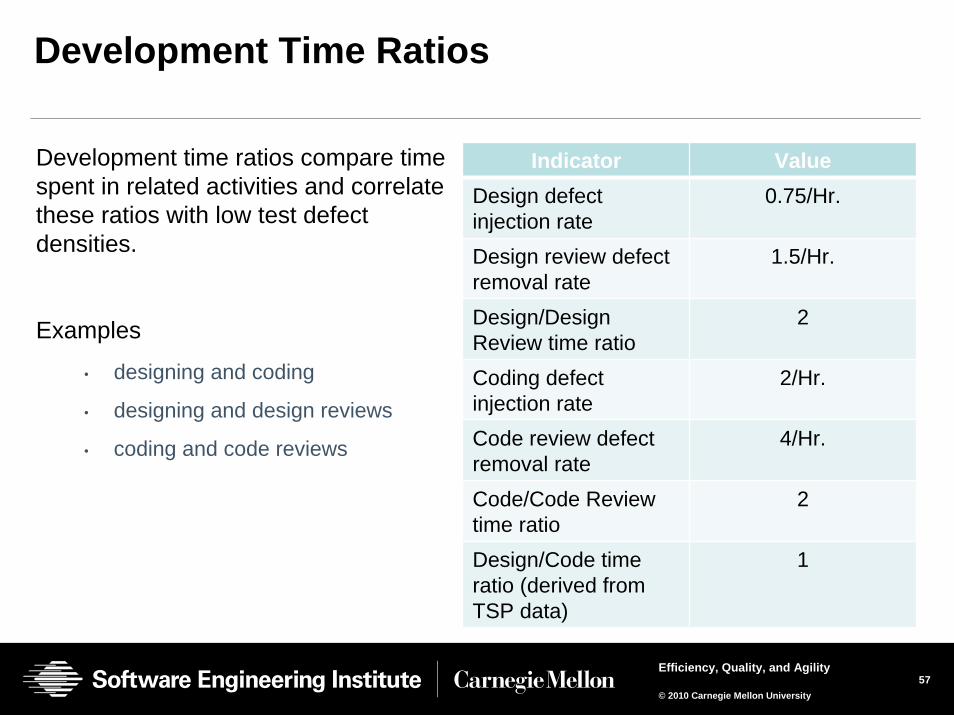
Development Time Ratios
Development time ratios compare time spent in related activities and correlate these ratios with low test defect densities.
Examples
• designing and coding
• designing and design reviews
• coding and code reviews
Indicator ValueDesign defect injection rate
0.75/Hr.
Design review defect removal rate
1.5/Hr.
Design/Design Review time ratio
2
Coding defect injection rate
2/Hr.
Code review defect removal rate
4/Hr.
Code/Code Review time ratio
2
Design/Code time ratio (derived from TSP data)
1
58Efficiency, Quality, and Agility
© 2010 Carnegie Mellon University
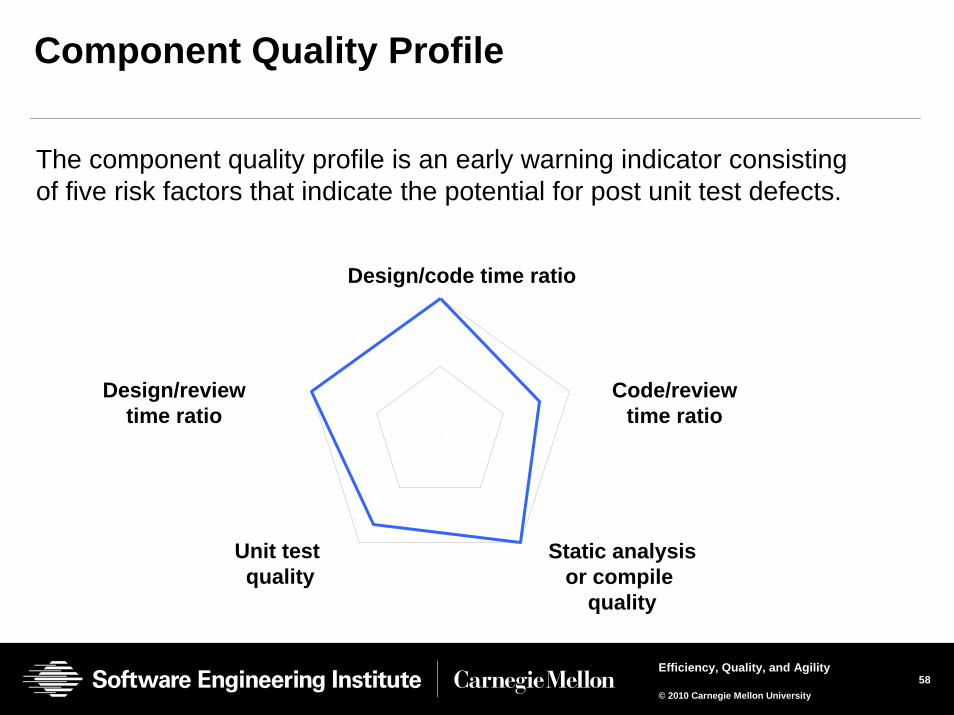
Component Quality Profile
The component quality profile is an early warning indicator consisting of five risk factors that indicate the potential for post unit test defects.
Design/code time ratio
Code/reviewtime ratio
Static analysisor compile
quality
Unit test quality
Design/review time ratio
59Efficiency, Quality, and Agility
© 2010 Carnegie Mellon University
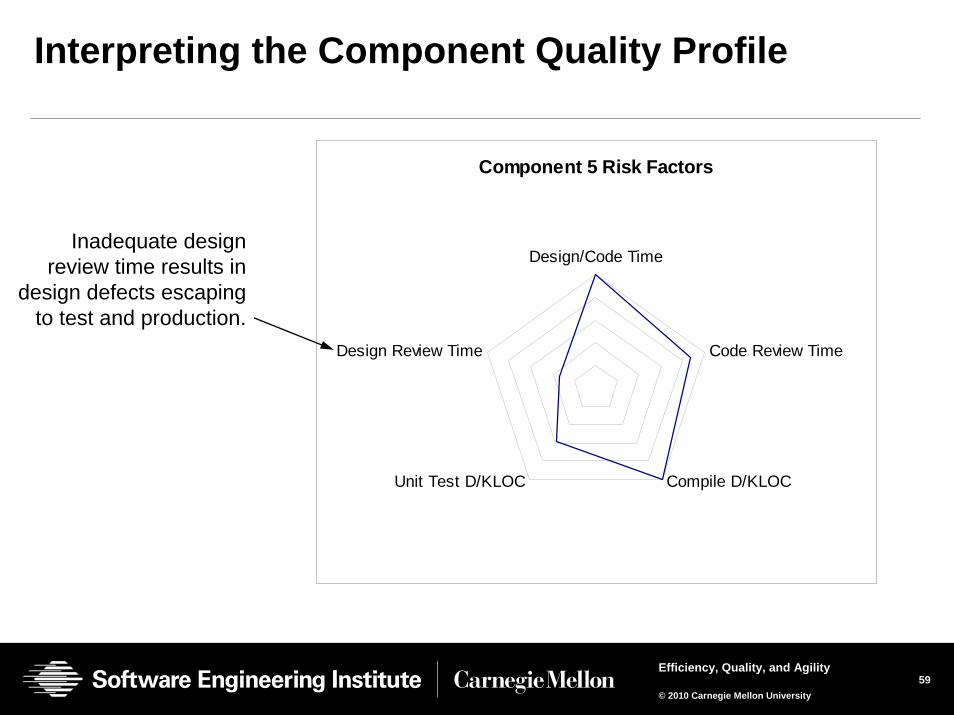
Interpreting the Component Quality Profile
Component 5 Risk Factors
Design/Code Time
Code Review Time
Compile D/KLOCUnit Test D/KLOC
Design Review Time
Inadequate design review time results in
design defects escaping to test and production.
60Efficiency, Quality, and Agility
© 2010 Carnegie Mellon University
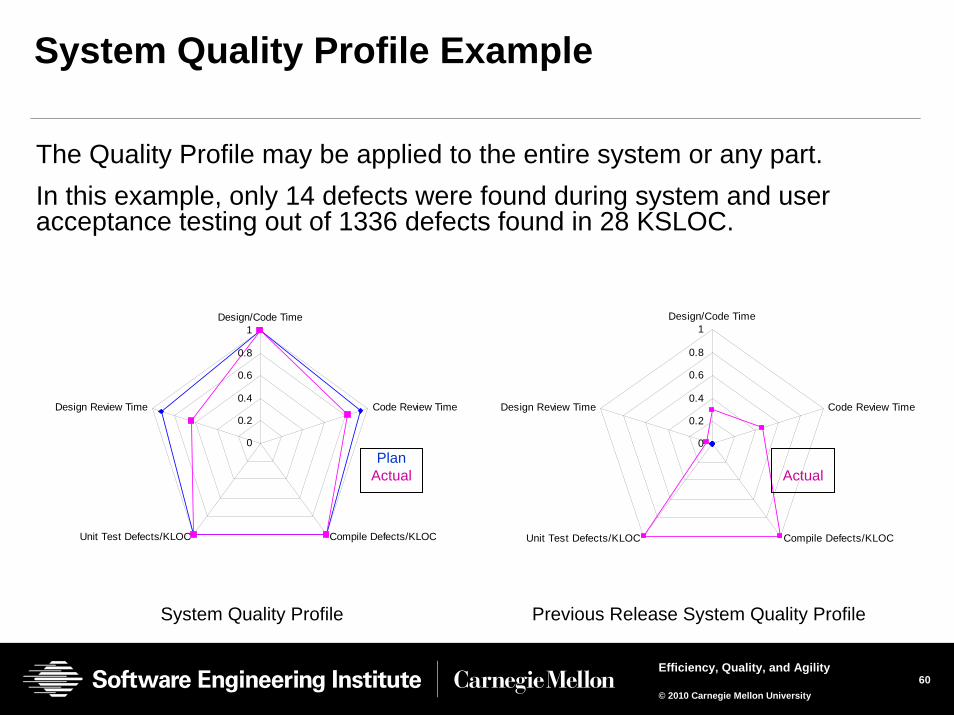
System Quality Profile Example
The Quality Profile may be applied to the entire system or any part.In this example, only 14 defects were found during system and user acceptance testing out of 1336 defects found in 28 KSLOC.
0
0.2
0.4
0.6
0.8
1Design/Code Time
Code Review Time
Compile Defects/KLOCUnit Test Defects/KLOC
Design Review Time
PlanActual
0
0.2
0.4
0.6
0.8
1Design/Code Time
Code Review Time
Compile Defects/KLOCUnit Test Defects/KLOC
Design Review Time
Actual
System Quality Profile Previous Release System Quality Profile
61Efficiency, Quality, and Agility
© 2010 Carnegie Mellon University
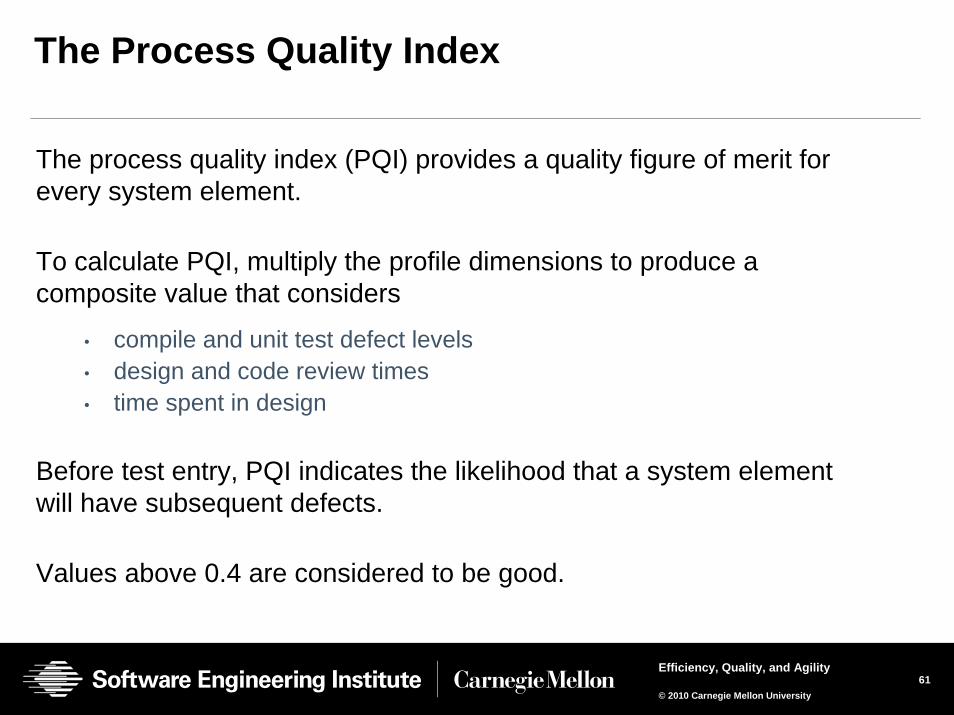
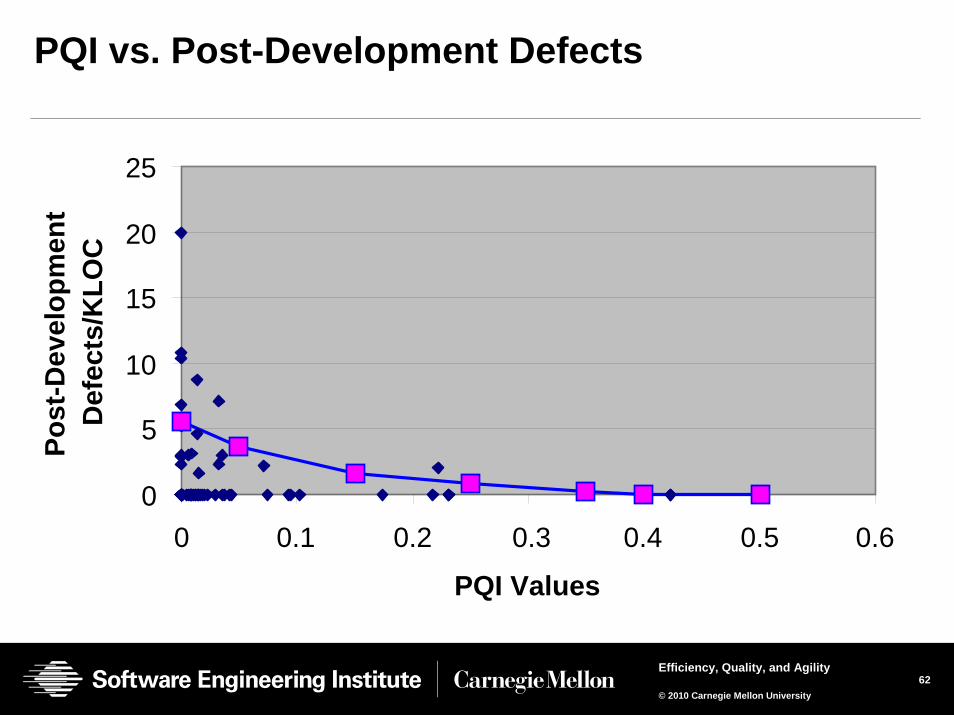
The Process Quality Index
The process quality index (PQI) provides a quality figure of merit for every system element.
To calculate PQI, multiply the profile dimensions to produce a composite value that considers
• compile and unit test defect levels• design and code review times• time spent in design
Before test entry, PQI indicates the likelihood that a system element will have subsequent defects.
Values above 0.4 are considered to be good.
62Efficiency, Quality, and Agility
© 2010 Carnegie Mellon University
PQI vs. Post-Development Defects
0
5
10
15
20
25
0 0.1 0.2 0.4 0.5 0.6
PQI Values
Post
-Dev
elop
men
t D
efec
ts/K
LOC
0.3
63Efficiency, Quality, and Agility
© 2010 Carnegie Mellon University
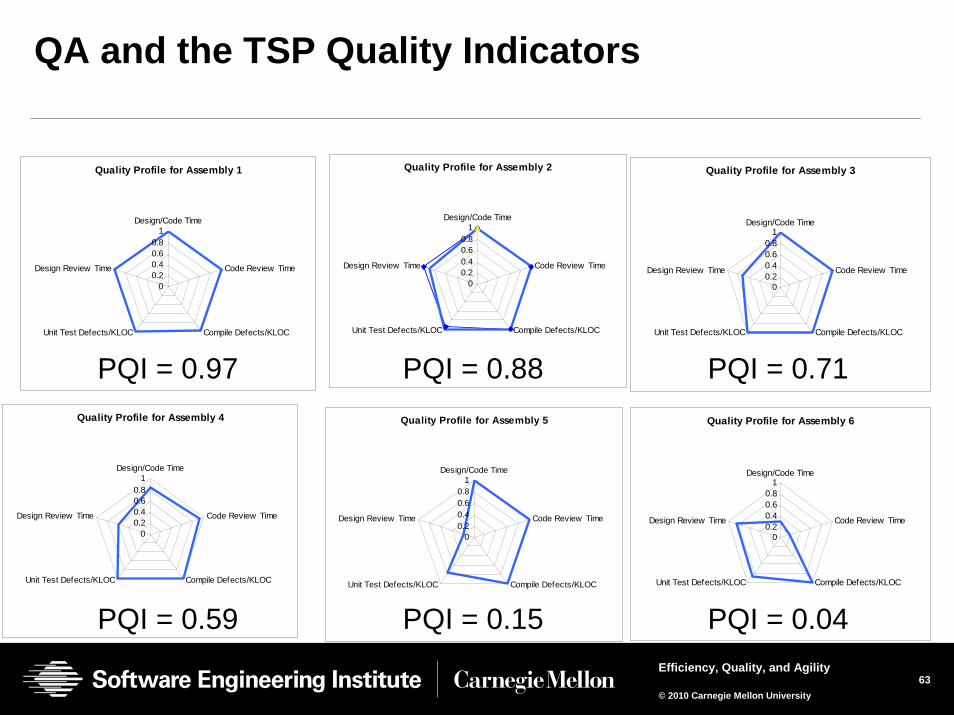
QA and the TSP Quality Indicators
Quality Profile for Assembly 1
00.20.40.60.8
1Design/Code Time
Code Review Time
Compile Defects/KLOCUnit Test Defects/KLOC
Design Review Time
Quality Profile for Assembly 2
00.20.40.60.8
1Design/Code Time
Code Review Time
Compile Defects/KLOCUnit Test Defects/KLOC
Design Review Time
Quality Profile for Assembly 3
00.20.40.60.8
1Design/Code Time
Code Review Time
Compile Defects/KLOCUnit Test Defects/KLOC
Design Review Time
Quality Profile for Assembly 4
00.20.40.60.8
1Design/Code Time
Code Review Time
Compile Defects/KLOCUnit Test Defects/KLOC
Design Review Time
Quality Profile for Assembly 5
00.20.40.60.8
1Design/Code Time
Code Review Time
Compile Defects/KLOCUnit Test Defects/KLOC
Design Review Time
Quality Profile for Assembly 6
00.20.40.60.8
1Design/Code Time
Code Review Time
Compile Defects/KLOCUnit Test Defects/KLOC
Design Review Time
PQI = 0.97 PQI = 0.88 PQI = 0.71
PQI = 0.59 PQI = 0.15 PQI = 0.04
64Efficiency, Quality, and Agility
© 2010 Carnegie Mellon University
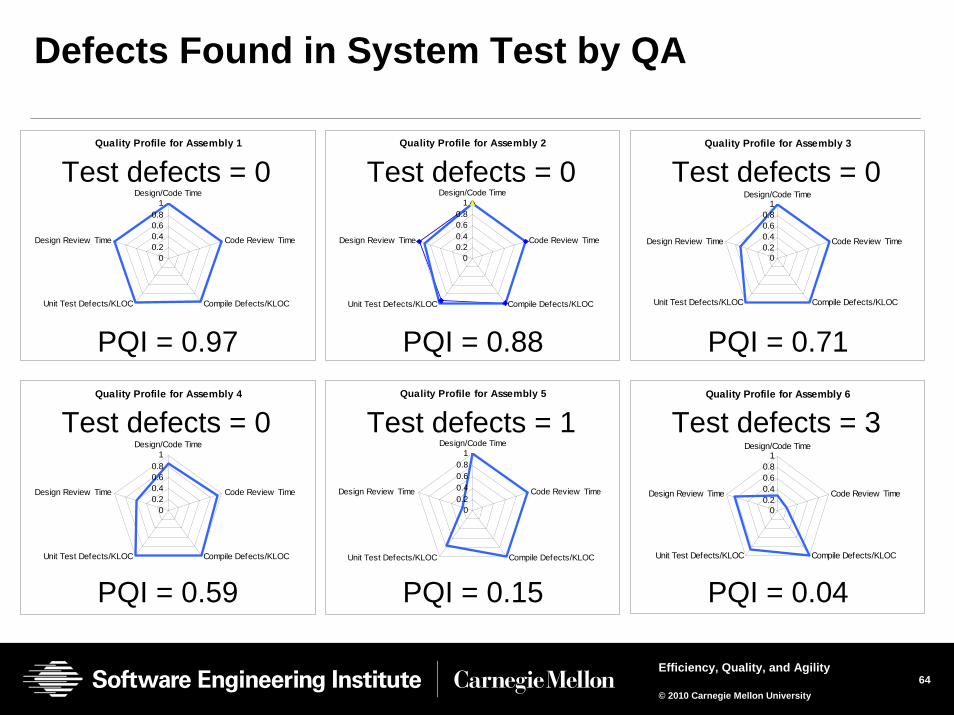
Defects Found in System Test by QA
Quality Profile for Assembly 1
00.20.40.60.8
1Design/Code Time
Code Review Time
Compile Defects/KLOCUnit Test Defects/KLOC
Design Review Time
Quality Profile for Assembly 2
00.20.40.60.8
1Design/Code Time
Code Review Time
Compile Defects/KLOCUnit Test Defects/KLOC
Design Review Time
Quality Profile for Assembly 3
00.20.40.60.8
1Design/Code Time
Code Review Time
Compile Defects/KLOCUnit Test Defects/KLOC
Design Review Time
Quality Profile for Assembly 4
00.20.40.60.8
1Design/Code Time
Code Review Time
Compile Defects/KLOCUnit Test Defects/KLOC
Design Review Time
Quality Profile for Assembly 5
00.20.40.60.8
1Design/Code Time
Code Review Time
Compile Defects/KLOCUnit Test Defects/KLOC
Design Review Time
Quality Profile for Assembly 6
00.20.40.60.8
1Design/Code Time
Code Review Time
Compile Defects/KLOCUnit Test Defects/KLOC
Design Review Time
PQI = 0.97
Test defects = 0
PQI = 0.88
Test defects = 0
PQI = 0.71
Test defects = 0
PQI = 0.59
Test defects = 0
PQI = 0.15
Test defects = 1
PQI = 0.04
Test defects = 3
65Efficiency, Quality, and Agility
© 2010 Carnegie Mellon University
Summary
We can no longer rely on testing as the principal means of improving the quality of software systems.
To get a quality product out of test, we must• establish a quality ethic at the individual level
• plan for and measure quality at each step
• use disciplined processes that emphasize early defect removal
The role of QA must change from a “test-in quality” focus to a “build-in quality” focus where quality plans and data are used by QA and the development teams to manage quality throughout the process.
66Efficiency, Quality, and Agility
© 2010 Carnegie Mellon University
Questions?
For more information contact:
Jim Over
+ 1 412-268-7624