managing the water–energy–food nexus: gains and … amu darya central asia ......
TRANSCRIPT

Journal of Hydrology 539 (2016) 648–661
Contents lists available at ScienceDirect
Journal of Hydrology
journal homepage: www.elsevier .com/locate / jhydrol
Managing the water–energy–food nexus: Gains and losses from newwater development in Amu Darya River Basin
http://dx.doi.org/10.1016/j.jhydrol.2016.05.0710022-1694/� 2016 Elsevier B.V. All rights reserved.
⇑ Corresponding author. Tel.: +358 46 6171001.E-mail address: [email protected] (S.-M. Jalilov).
Shokhrukh-Mirzo Jalilov a,⇑, Marko Keskinen a, Olli Varis a, Saud Amer b, Frank A. Ward c
aWater & Development Research Group, Aalto University, FinlandbUS Geological Survey, United StatescDepartment of Agricultural Economics and Agricultural Business, New Mexico State University, United States
a r t i c l e i n f o
Article history:Received 22 May 2015Received in revised form 7 May 2016Accepted 31 May 2016Available online 6 June 2016This manuscript was handled by GeoffSyme, Editor-in-Chief, with the assistance ofBellie Sivakumar, Associate Editor
Keywords:Hydro-economic modelWater–energy–food nexusRogunNurekAmu DaryaCentral Asia
s u m m a r y
According to the UN, the population of Central Asia will increase from its current approximately 65 mil-lion people to a well over 90 million by the end of this century. Taking this increasing population intoconsideration, it is impossible to project development strategies without considering three key factorsin meeting the demands of a growing population: water, food and energy. Societies will have to choose,for instance, between using land and fertilizer for food production or for bio-based or renewable energyproduction, and between using fresh water for energy production or for irrigating crops. Thus water, foodand energy are inextricably linked and must be considered together as a system. Recently, tensionsamong the Central Asian countries over the use of water for energy and energy production have increasedwith the building of Rogun Dam on the Vakhsh River, a tributary of the Amu Darya River. The dam willprovide upstream Tajikistan with hydropower, while downstream countries fear it could negativelyimpact their irrigated agriculture. Despite recent peer reviewed literature on water resources manage-ment in Amu Darya Basin, none to date have addressed the interconnection and mutual impacts withinwater–energy–food systems in face of constructing the Rogun Dam. We examine two potential operationmodes of the dam: Energy Mode (ensuring Tajikistan’s hydropower needs) and Irrigation Mode (ensuringwater for agriculture downstream). Results show that the Energy Mode could ensure more than doubleTajikistan’s energy capacity, but would reduce water availability during the growing season, resultingin an average 37% decline in agricultural benefits in downstream countries. The Irrigation Mode couldbring a surplus in agricultural benefits to Tajikistan and Uzbekistan in addition an increasing energy ben-efits in Tajikistan by two fold. However, energy production in the Irrigation Modewould be non-optimallydistributed over the seasons resulting in the most of hydropower being produced during the growing sea-son. Neither operation mode provides optimal benefits for all the countries, emphasizing how difficult itis to actually reach a win–win scenario across the water–energy–food security nexus in transboundaryriver basins.
� 2016 Elsevier B.V. All rights reserved.
1. Introduction
1.1. Water–energy–food nexus
Food, water and energy are essential for human existence andwell-being. Sustainable access to and management of theseresources is a foundation for long-term economic growth anddevelopment. Challenged by the importance of efficient and bal-anced use of these scarce resources, several recent academic workshave paid increasing attention to the concept of a water, energyand food security nexus. This concept calls for an integrated and
systematic approach to address water, energy, and food securityat several levels and in numerous settings (Rasul, 2014; WEF,2011; Hoff, 2011; Hellegers et al., 2008). Understanding and iden-tifying the linkages among these key resources and improving theiruse efficiency could mean a major win–win outcomes for well-being worldwide (GWSP, 2014).
The nexus approach recognizes the interlinkages betweenwater, energy, and food production. It looks for ways to conceptu-alize and, if possible, quantify these linkages into a single frame-work to assess and manage their use that shows full respect fortheir connections (Hermann et al., 2012; Hussey and Pittock,2012; Sharma and Bazaz, 2012; Bazilian et al., 2011; Scott et al.,2011; Hellegers et al., 2008). While there is an increasing amountof research trying to consider these three resources together

Fig. 1. Map of Central Asia with the site of Rogun Dam. Data source on rivers: World Data Bank II (1980) Global river network. CIA, U.S. government. Data source on nationalboundaries: USGS (2001) Administrative boundaries, Global GIS Database (Reston, VA: US Geological Survey). Data source on the location of Rogun Dam: The Economist(2013).
1 Kyrgyzstan supplies 2% of the total flow in the basin (SIC ICWC, 2010) andaccording to the ‘‘Agreement on Cooperation in Joint Management, Use and Protectionof Interstate Sources of Water Resources” signed in February 1992 entitled to use only0.6% of annual flow. Therefore, this country has not been considered in the study.
S.-M. Jalilov et al. / Journal of Hydrology 539 (2016) 648–661 649
(Rasul, 2014; Ringler et al., 2013; Gulati et al., 2013), there are fewanalyses done quantitatively with respect to their linkages withdifferent policy and planning options (Bazilian et al., 2011).
The water–energy–food security nexus is particularly challeng-ing in transboundary river basins. In such settings, each ripariancountry tends to maximize its own water, energy and food secu-rity. Yet, for the same reason the nexus approach is particularly rel-evant for transboundary settings, as it can reveal potential win–win and lose–lose situations that the actions of different countriescan create for the entire region around the basin. The political char-acter of water is also strong in transboundary basins, as thenational interests of each riparian country define the outcomes ofbasin-wide decision-making process related to water resourcesdevelopment (Jägerskog et al., 2013; Earle et al., 2010).
A few previous studies stress the existence of a tight connectionbetween the complex challenges of water, energy and food. Leeet al. (2011) presented an optimal scenario of integrated basinmanagement in the presence of a dam. Using an example of LakeAswan, located between Egypt and Sudan, the study showed thata move from the baseline status-quo condition to the socially opti-mal level will increase total basin-wide net present value by morethan $500 billion (Lee et al., 2011). In addition, the study also ana-lyzed other scenarios of cooperation. Wyrwoll (2011) demon-strated the case of the Xayaburi Project which consists of 11mainstream dams on the Mekong River; while the project couldbe the ‘‘battery of Asia” (Wyrwoll, 2011) it would also have a dev-astating effect on food security in the region. A comprehensivestudy of large hydropower projects all over the world by Ansaret al. (2014) makes an interesting conclusion that ‘‘. . .in most coun-tries large hydropower dams will be too costly in absolute termsand take too long to build to deliver a positive risk-adjusted returnunless suitable risk management measures outlined” (Ansar et al.,2014, p. 43). Therefore, decision-makers in developing countriesshould explore other energy alternatives with shorter building per-iod (Ansar et al., 2014). The most recent study by Chen et al. (2016)based on a firsthand analysis of global data on dams and socio-economic conditions, identifies the close relationship betweendams and socio-economic development. They conclude that
‘‘whether dam construction should continue is no longer a ques-tion, as the need, especially in the developing countries and theLDCs, is obvious” (Chen et al., 2016, p. 27).
1.2. Amu Darya River Basin and Rogun Dam
This study investigates linkages between water, energy produc-tion and food security in the transboundary Amu Darya River Basin(ADRB). The focus is on the planned Rogun Hydropower Plant(RHP) on the second largest Amu Darya tributary i.e. Vakhsh River(Fig. 1).
The Amu Darya River is the largest river in Central Asia in termsof its length (2540 km) (Wegerich, 2008) as well as its averageannual flow of 65 km3 (Spoor and Krutov, 2003). The Basin areacontains a land area of about 309,000 km2 (Wegerich, 2008) andit is home to approximately 55 million (CIA, 2011). The main-stream is supplied by two main tributaries, the Vakhsh and PyandjRivers, and it inflows to the Aral Sea. The discharge regime of theVakhsh River varies by season, with the lowest flows during winterand maximums in summer (Savchenkov et al., 1989). This phe-nomenon is mainly explained by melting snow and glaciers intothe Vakhsh River (Konovalov, 2009).
The Amu Darya River is shared by five riparian countries –Afghanistan, Kyrgyzstan,1 Tajikistan, Turkmenistan, and Uzbekistan.On its route from the headwaters to the Aral Sea, the river also servesas a border between Afghanistan and Tajikistan as well as betweenAfghanistan and Uzbekistan. There have long been heated debatesamong the riparian countries over the development of the AmuDarya River Basin (ADRB). Currently the debate evolves particularlyaround the planned Rogun Dam and around Tajikistan’s right tohydropower production as well as Uzbekistan’s concerns aboutpossible negative impacts on its irrigated agriculture. There arecurrently few signs of willingness among the riparian countries to
650 S.-M. Jalilov et al. / Journal of Hydrology 539 (2016) 648–661
secure an agreement on the use of the Amu Darya’s water resources(Kim and Indeo, 2013; Arbour, 2011).
The Rogun Dam was originally designed in the 1970s by Sovietengineers to act primarily as an irrigation reservoir that wouldbring new agricultural land into production in downstream areas(Azimov, 2014; World Bank, 2014). The Rogun Dam and reservoiris located about 70 km upstream of the existing NurekHydropower Plant (NHP) (World Bank, 2014). There are five otherhydropower stations located on the Vakhsh River down fromNurek; however all are run-of-river schemes with no significantwater storage capacity (World Bank, 2014). With the collapse ofthe former Soviet Union, original plans on Rogun’s design andpurpose were forgotten. The Rogun Dam is currently planned firstand foremost to produce hydropower energy for Tajikistan.Nevertheless, the Rogun Dam and related reservoir has a potentialto produce both agricultural and energy benefits.
Despite the ongoing political debates, there has been little peer-reviewed research on the possible economic benefits and lossesthat the planned Rogun Dam would bring to the riparian countriesunder different operation modes. While many studies analyzedand described current water resources management systems, eco-logical status of water bodies, joint use of water resources, as wellas conflict prevention in water use in Central Asia (see Schlüter andHerrfahrdt Pähle, 2011; Wegerich, 2008; Glantz, 2005; Schlüteret al., 2005; Cai et al., 2003; Raskin et al., 1992), only a few haveestimated specifically the possible economic implications of theRogun Dam (see Bekchanov et al., 2013a, 2013b; Jalilov et al.,2013a, 2013b). In addition, in June 2014 the World Bank launchedtheir much awaited assessment report of the Rogun Dam, investi-gating the technical, economic, environmental and social consider-ations for three possible dam heights as well as three possibleenergy generation capacities (World Bank, 2014). The assessmentdetermined that the tallest Rogun Dam option of 335 m is the mostsuitable option to meet Tajikistan’s energy needs. While Tajikistanhas seen the World Bank report as a green light to commence con-struction of the dam, downstream Uzbekistan – which has consis-tently opposed the construction of the Rogun Dam – immediatelyexpressed its disappointment and announced its unwillingness torecognize the results of the assessment (Thrilling, 2014).
1.3. Study objective
This study seeks to contribute to the current debate on theADRB by presenting the results of the hydro-economic modelingof the basin, with a focus on different operation modes of RogunDam and related reservoir. The modeling results of the Rogunreservoir operation are provided in two different scenarios focus-ing on energy generation, Energy Mode, and irrigation water supply,Irrigation Mode. Additionally, a Baseline scenario is given to com-pare the baseline condition (with no Rogun Dam) with the twomodeled scenarios. In this way, the modeling results can informplanners and policy-makers to evaluate the different managementoptions for water, energy and agricultural development in thebasin.
The remainder of the paper is organized as follows. In Section 2we outline an analytical framework in four subsections thatdescribe (a) use of hydro-economic models; (b) the modelingframework; (c) data used for the modeling framework; and (d)alternative modes of the dams’ operation. Section 3 presentsresults that are divided into five subsections (a) streamflow; (b)reservoir storage and operation; (c) energy production; (d) agricul-tural land area; and (e) total basin-wide economic benefits. Resultsare discussed in Section 4 which is followed by a discussion of lim-itations of the study in Section 5. Finally, Section 5 also concludesand provides suggestions for future research and policy.
2. A hydro-economic model for water–energy–foodinterconnections in the Amu Darya River Basin
2.1. Use of hydro-economic models to guide policy
The challenge of combining the use of water, energy and foodinto one integrated planning and management framework isdemanding and calls for the development of approaches and meth-ods (Bazilian et al., 2011). Particularly, transboundary settingsrequire consideration of the highly political nature of water man-agement, as the needs of riparian countries are often conflicting.In general, many water management problems are linked toincreasing water scarcity, changing climate and the lack of afford-ably developed new water supplies. These trends mean that bychoice or necessity, priority must often be placed on improvingthe management of existing supplies over developing new ones.This challenge will increase the demand for techniques such ashydro-economic modeling that enable better understanding ofthe most beneficial allocation, use and protection of water.
Hydro-economic modeling frameworks present an integratedsystemwhere water resources can be spatially and temporally allo-cated under a range of management options, economic values, andpolicy choices. Hydro-economicmodeling is a term used to describewater resource modeling studies that value some or all water usesusing common a metric, usually monetary units, to compare valuesacross time and space and among different water use categories. Aguiding principle is that water demands are not a set of fixedrequirements but depend on price and opportunities for substitu-tion. They are typically represented by mathematical functionswhere water quantities used are distributed in different times andspace due to a range of total and marginal values associated withalternative water use or conservation levels. Hydro-economic mod-eling often involves the use of optimization approaches to identifyways to increase the net economic benefits or other performancemetrics associated with the development, purification, protection,or use of water. Integrated hydro-economic models aim to capturethe complexity of interactions between water resources allocationand resulting economic performance for the purpose of informingpolicy choices.
2.2. The modeling framework
The model is an extension of the previous Amu Darya model(Jalilov et al., 2013a), in which the main tributary flows are allo-cated to various downstream water demands for beneficial use.The previous study provided empirical evidence for measures toachieve basin-wide Pareto efficiency by improving outcomes overshared transboundary waters, outcomes in which all riparian coun-tries could be made better off by sharing the benefits of waterdevelopment and allocation. In the current study, the model frame-work is updated to include new operation schemes by looking atcountry-specific benefits: under such schemes, the model maxi-mizes the economic benefits for each country with no considera-tion of the total basin-wide benefits.
The model considers the economic importance of irrigated agri-culture in the four basin countries i.e. Afghanistan, Tajikistan, Turk-menistan and Uzbekistan in addition to the potential forhydropower production in upstream Tajikistan. The model allo-cates water for energy and agricultural production over a 20-yearperiod with a monthly time step. The model considers two crop-ping seasons, with the first (early planting) crop season startingin March and lasting until August and the second so-called mid-term crop starting in May (late planting) and lasting until earlyautumn. The model includes three key crops: cotton as strategic

Inputs Model components Outputs
Water availability/inflows Water requirements of demand nodes Cost of produc�on in demand nodes Other inputs: land area, crops and yield, reservoir storage volume and capacity
Policy scenarios 1. Baseline scenario – calibra�on
and simula�on of current condi�ons (requires historical data on inflows, diversions, agricultural land and crops)
2. Irriga�on scenario – to sa�sfy downstream irriga�on demand
3. Energy scenario –to sa�sfy upstream energy demand
1. Hydrologic component: flow control and distribu�on among uses: (basin level) Mass balance Flow con�nuity principle Ins�tu�onal rules
2. Agronomic component: Crops and area Crop water requirement
3. Economic component: (individual and basin level): Max Economic Benefits s.t.: Resources constraints Technical constraints Ins�tu�onal constraints
4. Environmental component: Environmental benefits = Minimum water inflows to ecosystem (% of flows)
1. Water demand/use 2. Reservoir opera�on 3. Land use decision 4. Energy decision 5. Economic benefits
Fig. 2. Modeling framework.
S.-M. Jalilov et al. / Journal of Hydrology 539 (2016) 648–661 651
cash crop, and wheat and vegetables (often potato) as crops ensur-ing food security for all the riparian countries.
The integrated hydro-economic river basin model consists ofhydrologic, agronomic and economic elements, with specialemphasis on the economic element. The modeling frameworkdescribed above is summarized in Fig. 2. The nonlinear modelwas programmed using General Algebraic Modelling System(GAMS) language (Brooke et al., 2006). The basin scale integratedmodel maximizes discounted net present value (NPV)2 across allwater uses (in this case agriculture and energy), and all time periodssubject to selected hydrologic and institutional constraints. Dis-counted net present value is equal to the sum of agricultural andenergy benefits. The model allocates water among the basin’s wateruses, locations, and time periods to maximize net present value, sub-ject to the described constraints.
The river basin framework is developed as a node link network,which is a representation of the spatial objects in the river basin.Nodes represent river flows, reservoir, and demand objects, andlinks represent the linkages between these objects (Fig. 3). Runofffrom headwaters in the river basin are inflows to these nodes. Bal-ance between flows is calculated for each node at each time period,and flow movement is calculated on the spatial connection in theriver basin geometry (Appendix A).
2.3. Data
Fig. 3 shows a schematic of the Amu Darya and information onaverage annual water supply by source as well as the design datafor the Rogun and Nurek Dams and Reservoirs. These are twomajorreservoirs on the Vakhsh River. The average annual water runoff inthe Amu Darya River equals 65.58 km3. The two major tributariesof the Amu Darya, the Pyanj and the Vakhsh rivers, constitute49% and 30% of the main river’s total flow, respectively.
Economic benefits of hydropower and irrigated agriculture arederived from use of water for energy and crop production. Cropwater use data were used for existing cropping areas by countryand combined with agricultural production details including cropprices, production costs, and crop yields (Table 1). Net agriculturalincome per hectare and total land in production by country, crop,and season were identified. Agricultural income per unit of land
2 NPV – net present value is the sum of discounted future benefits minus costs.
for each crop was defined as crop price multiplied by yield minuscosts of production.
Discounted net farm incomewas summed over crops, time peri-ods, and countries, subject to water supply and sustainability con-straints described subsequently. Consistent with neoclassical pricetheory, reduced water quantities supplied to agricultural usersdecrease crop production and raise crop prices. Prices are basedon previously published work that estimated price elasticities ofdemand and a linear demand price response at historicallyobserved prices and production levels in the entire region. Thismeans that the model considers all countries as a unified andlinked market and allocates water to the country where benefitsminus costs are highest, while respecting all constraints.
The benefits from energy production (hydropower) were mea-sured as energy production multiplied by the constant price ofenergy as it is currently regulated by the Tajik government. Energyproduction is unknown in advance and part of the optimizedmodel results, but as a matter of principle, it depends on head offalling water, water discharge, gravitational acceleration, and acoefficient representing the technical efficiency of turbines bywhich falling water is converted into power. The model of energyproduction closely reproduced the maximum energy capacity ofRogun Reservoir that is used in most of the recently publishedplanning documents (The Rogunskaya Hydro Power Station, 2009).
The analysis requires a sustainable operation of the Nurek andRogun reservoirs, defined as filling it to its maximum capacity bythe last period (end of 20th year). By establishing this constrainton the terminal period’s reservoir level, sustainable water suppliesand use and operation modes are protected. In addition, the modelwas calibrated by fitting model predictions suitably close toobserved historical observed values of crop production and cropland pattern in each basin country in the baseline scenario.
2.4. Two alternative modes of the Dams’ operation
Our analysis looks at two alternative modes for operation of theRogun and Nurek reservoirs, and compares them with the BaselineMode i.e. the current situation with no Rogun (but with Nurek). Thefirst reservoir operation option assumes that the both reservoirsare operated on Energy Mode prioritizing hydropower generation,while the second operation option assumes that the reservoirs

Fig. 3. Schematic of the ADRB with design characteristic of Rogun and Nurek Reservoirs (Source: Jalilov et al., 2013b) and average annual water flow (billion cubic meters) bytributaries of Amu Darya (Source: UNECE, 2007) used in the model.
652 S.-M. Jalilov et al. / Journal of Hydrology 539 (2016) 648–661
operate on Irrigation Mode, where agriculture has the highestpriority.
The two reservoir operation modes are included in the model byintroducing constraints. In the Energy Mode, the RHP and NHP areforced to produce at least 70% of total energy requirements ofTajikistan for each month of the year (World Bank, 2012). Bychoosing 70%, the model forces both reservoirs to reach their max-imum long-term energy production capacity. This assumptiontakes into account varying energy demand throughout the year.In the Irrigation Mode, the model is optimized so that total agricul-tural benefits with dams in each country must be equal or greaterthan without the RHP and NHP.
As water is also needed to support aquatic systems and ecology,the environmental use of water is included into the model througha constraint that ensures that at least 10% of the flow at the conflu-ence of Vakhsh and Pyanj Rivers must flow to the Aral Sea any timeof the year.
3. Results
3.1. Streamflow
Fig. 4 illustrates typical results by showing predicted stream-flow on the gauge downstream of the Nurek reservoir by scenarioand month averaged over a 20-year period. The reason we choosethis particular gauge is because it could immediately show theimpacts of upstream water fluctuations and differences in waterflow between the baseline, irrigation and energy scenarios. As itcan be seen from the figure, the baseline scenario is characterizedby two peaks in water flowing downstream: the first peak isexplained by beginning the irrigation period in downstream coun-tries, the second peak is partly explained by the water demandedfor irrigation in summer months as well as peak discharge in theVakhsh River due to snow and glaciers melting into the VakhshRiver (Konovalov, 2009). Flow in the energy scenario is the most

Table 1Agricultural data by country and crop. Source: World Bank (2003).
Country Crop Yield(tons/ha)
Cost($US/ha)
Water requirements(m3/ha per year)
Total land area in production withinAmu Darya Basin (million ha)
Tajikistan cotton 1.8 444 12 0.5wheat 1.5 168 8vegetable 12 500 12
Afghanistan cotton 1.8 444 12 0.4wheat 1.6 165 8potato 12 503 12
Uzbekistan cotton 2.3 390 14 2.3wheat 1.5 283 6vegetable 11 702 11
Turkmenistan cotton 2.2 392 14 1.1wheat 1.5 283 6vegetable 11 702 11
0.00
2.00
4.00
6.00
8.00
Jan Feb Mar Apr May Jun Jul Aug Sep Oct Nov Dec Month
Baseline Energy Irriga�on
Fig. 4. Predicted streamflow on the gauge down the Nurek reservoir by scenariosand months, averaged over a 20-year period.
0.00 1.00 2.00 3.00 4.00 5.00
Jan Feb Mar Apr May Jun Jul Aug Sep Oct Nov Dec Month
Baseline Natural flow
Fig. 5. Fluctuation of the Nurek reservoir storage volume by months in baselinescenario, averaged over a 20-year period.
0.00
20.00
40.00
60.00
80.00
100.00
Jan Feb Mar Apr May Jun Ju
Month
Difference between the modes Irrig
Fig. 6. Fluctuation of the Rogun reservoir storage volume by months in Energy and Irrstorage capacity).
S.-M. Jalilov et al. / Journal of Hydrology 539 (2016) 648–661 653
evenly distributed across the months due to fact that there is anearly constant energy demand throughout the year in Tajikistan.However, a closer looks shows that energy demand is higher inwinter months and lower in summer months. Another picture ispresented in the irrigation scenario. Both reservoirs working forthe sake of agriculture downstream accumulate water in fall andwinter months and release it starting in the spring. By doing thisboth reservoirs could actually help to bring new lands into produc-tion and thus increase agricultural benefits downstream. Theimportant message of the figure is that both modeled scenariosare considerably different from the baseline scenario and also sig-nificantly differ between each other.
3.2. Reservoir storage and operation
With a capacity of 13.3 km3 for storage and an average annualrunoff from the Vakhsh River of 20 km3, it is possible to store abouttwo-thirds of the river’s annual flow into the Rogun reservoir. Add-ing the Nurek reservoir to this equation could make the pictureeven worse as both reservoirs together could store the entireannual runoff of the Vakhsh River. Taking into account that theVakhsh River contributes about one third of the total discharge intothe Amu Darya River, it is clear that the proposed Rogun reservoirtogether with the existing Nurek reservoir could potentially regu-late a very high percentage of the water used for the basin’s agri-cultural production.
Fig. 5 shows fluctuation of the Nurek reservoir’s monthly stor-age volume averaged over 20 years in the baseline scenario, indi-cating a typical operation of the reservoir in meeting irrigation
l Aug Sep Oct Nov Dec
a�on mode Energy mode
igation scenarios, averaged over a 20-year period (in percentage of the maximum

654 S.-M. Jalilov et al. / Journal of Hydrology 539 (2016) 648–661
water needs downstream. The baseline scenario was modeled toreproduce a historical irrigated area in downstream countries. Nor-mally, the Nurek reservoir would release water in spring and sum-mer to satisfy irrigation water demands of downstream agricultureand accumulate water in the high runoff period of summer andthroughout the fall and winter months. However, it does not meanthis scenario occurs currently due to ongoing disputes over theallocation of water resources in the Amu Darya Basin.
Fig. 6 shows the Rogun reservoir storage fluctuations in per-centage of the maximum storage capacity by months in two mod-eled scenarios: Energy and Irrigation. While operating under theEnergy Mode, the Rogun Reservoir stores water during late summerand early fall months when river flow is the greatest and thenreleases water to generate electricity during winter and springmonths when the energy demand is the highest (World Bank,2012). This is clearly visible in Fig. 6, where under the Energy Modethe reservoir starts to store water gradually from June onwardswith the reservoir storage being the greatest in September. Thenfrom September onwards, water flows are released to generatehydropower.
Under Irrigation Mode, the reservoir operation is considerablydifferent with a storage peak falling in February. Starting fromMarch, water is released as the farming season begins. Decline inwater release is observed from June onwards when the major irri-gation season ends and harvesting season begins, thus reducing thedemand for irrigation water. From then onwards the flow from thereservoir is minimal and the reservoir storage thus increasesslowly, hitting its peak again in February before the next plantingseason starts.
Overall, Fig. 6 depicts a clear difference in Rogun reservoir oper-ation under the Energy Mode and the Irrigation Mode. Moreover, itdisplays an obvious conflict of interests between food and energyproduction in the Amu Darya River Basin. While food productionneeds water to be stored in fall and winter, energy productionneeds to store water during the summer. High demand for electric-ity during the winter period forces the reservoir to release waterthrough turbines to generate energy in the Energy Mode. Similarly,irrigation water is in high demand during the spring-summer per-iod forcing the reservoir to store water during the winter periodwhen water flow in the river is minimal.
The blue3 area in Fig. 6 shows the difference in water volume (inpercentage of the maximum storage capacity) between the modes ofthe reservoir operation noticed for the particular month. Dependingon the certain month and the reservoir operation mode this indi-rectly indicates volume of water being stored in the Rogun as wellas delivery levels to downstream users in the particular month. Asmight be suspected, this amount of water is the major source for dis-putes between Irrigation and Energy scenarios in the reservoiroperation.
Storage fluctuation of the Nurek reservoir in percentage of themaximum storage capacity by months in two scenarios is shownin Fig. 7. The Irrigation Mode for the Nurek reservoir has a similarpattern to the Rogun reservoir operation in the same mode – accu-mulating water in winter months and releasing it in summer andfall partly because of irrigation demands and partly because ofpeak summer runoff allows for the generation of electricity andadditional energy benefits. However, the situation is different inthe Energy Mode which shows almost no fluctuations of the reser-voir storage. This occurs in order to satisfy energy demand in Tajik-istan which is distributed more or less evenly throughout themonths of the year (World Bank, 2012). Energy production is givenmore in details in the next subsection.
3 For interpretation of color in Figs. 6 and 7 , the reader is referred to the webversion of this article.
The blue area in Fig. 7 shows the difference in water volume (inpercentage of the maximum storage capacity) between the modesof the reservoir operation noticed for the particular month.Depending on the month and the reservoir operation mode thisindirectly indicates the volume of water being stored in the Nurekreservoir as well as downstream deliveries by month.
We should mention that Figs. 6 and 7 show fluctuations inreservoir storage level averaged over 20-year period and shouldn’tbe interpreted as changes of reservoir storage capacity which isfixed and cannot be changed.
3.3. Energy production
Figs. 8 and 9 show model estimated monthly energy productionby the Rogun and Nurek reservoirs under both the Energy Mode andthe Irrigation Mode. In the Energy Mode, both reservoirs arerequired to produce at least 70% of the electricity needed in Tajik-istan during different months (World Bank, 2012). According tothat source the demand for electricity in Tajikistan is relativelyevenly distributed across all the months with exception fromNovember until March, when energy demand is high. As Tajik-istan’s energy demand is higher in winter months, the reservoirsstore high river flow during the summer and release it to satisfyhigh demand for energy in winter. This is visible in Figs. 8 and 9,where the energy production is higher in the winter period oncompared to the summer period. The peak of energy productionfalls in March as this month’s demand for energy is higher thandemand in February (as seen in the Nurek operation). This can beseen as a win–win case for Tajikistan, as it would increase thecountry’s energy security and through possible energy export alsobring in additional revenue to the country.
It should be mentioned that under the Irrigation Mode energyproduction of both reservoirs has sharp fluctuations as the reser-voir follows agriculture needs for water. As a result, the mostenergy is produced between February–August and understandablylittle energy produced in winter when water has to be stored forthe next irrigation period. In the Irrigation Mode the reservoirsoperation reflects the irrigation water needs of agriculture. The Irri-gation Mode presumes that the most energy is produced in March–August. The energy production under Irrigation Mode presents thena kind of win–lose case for Tajikistan. While it could generate alarge surplus of electricity in six months (March to August), itcould also suffer from the insufficient energy supply in Septemberthrough December and almost no energy supply in January andFebruary when the energy demand is the highest.
3.4. Agricultural land area
The different reservoir operation modes will naturally impactthe potential agricultural land area due to changes in the wateravailability in the Amu Darya River, which is the major sourcefor irrigation water within the riparian countries (Spoor andKrutov, 2003). Historically, Central Asia’s agricultural land areaincreased with irrigation expansion in the 1970s and 1980s (i.e.the Soviet era), leading also to the widely-publicized loss of muchof the Aral Sea. Thus, the most limiting factor for agricultural pro-duction is the availability of water.
Table 2 summarizes the results of total agricultural area underproduction by country, crop, and scenario. The table presents twoimportant messages: no country except Afghanistan could experi-ence a potential reduction in agricultural area under the EnergyMode due to reduced availability of water for irrigation. However,the situation is different when one looks at crop distribution:Uzbekistan and Turkmenistan would have to decrease land undercotton production, which the most water-intensive crop amongthe three presented here and needs to be planted as a first crop.

0.00
20.00
40.00
60.00
80.00
100.00
Jan Feb Mar Apr May Jun Jul Aug Sep Oct Nov Dec Month
Difference between the modes Irriga�on mode Energy mode
Fig. 7. Fluctuation of the Nurek reservoir storage volume by months in Energy and Irrigation scenarios, averaged over a 20-year period (in percentage of the maximumstorage capacity).
0
1,000
2,000
3,000
4,000
5,000
Jan Feb Mar Apr May Jun Jul Aug Sep Oct Nov Dec Month
Difference between the modes of opera�on Energy mode Irriga�on mode
Fig. 8. Rogun reservoir energy production by scenarios and months, averaged over a 20-year period.
0
1,000
2,000
3,000
4,000
5,000
Jan Feb Mar Apr May Jun Jul Aug Sep Oct Nov Dec Month
Difference between the modes of opera�on Energy mode Irriga�on mode
Fig. 9. Nurek reservoir energy production by scenarios and months, averaged over a 20-year period.
S.-M. Jalilov et al. / Journal of Hydrology 539 (2016) 648–661 655
In exchange, the model calls for an increase in land underproduction for wheat, as this crop is less water intensive and hasthe lowest production cost compared to the other two crops andcould be planted later in the season when water is more readilyavailable.
Conversely, the Irrigation Mode of the Reservoir operation bringsmore potential, as it allows to develop new land (except forAfghanistan) as the Rogun and Nurek reservoirs act as multiyearwater storage. The greatest potential for increase in agriculturalland area would be in Turkmenistan and Uzbekistan (1.4 and 1.2times, correspondingly), but also Tajikistan could increase itsagricultural area 0.5 times under this scenario. In other words, if
the Rogun Reservoir is operated under the Irrigation Mode, it couldpotentially store water during high flows and release it in low flowperiods, bringing more land into production and accordingly morebenefits to all the countries in the basin.
There is no land being cultivated for vegetables in Afghanistan,Uzbekistan or Turkmenistan as the model was calibrated toreproduce total irrigated land area in those countries in a Baselinescenario, and because of the fact that considerably high profitabil-ity of cotton and wheat in the model allocated water to grow thesecrops in both the Irrigation and Energy scenarios.
The subsequent changes in agricultural benefits of the particu-lar country are presented in the next subsection.

Table 2The agricultural land area (millions of ha/year) by country and reservoir operationmode, averaged over 20 years.
Country Scenario Crops Total over crops
Cotton Wheat Vegetables
Tajikistan Baseline 0.00 0.15 0.10 0.25Irrigation 0.00 0.28 0.11 0.39Energy 0.00 0.18 0.06 0.24
Afghanistan Baseline 0.00 0.13 0.00 0.13Irrigation 0.00 0.12 0.00 0.12Energy 0.00 0.07 0.00 0.07
Uzbekistan Baseline 0.80 0.32 0.00 1.12Irrigation 0.89 1.59 0.00 2.48Energy 0.44 0.68 0.00 1.12
Turkmenistan Baseline 0.24 0.08 0.00 0.32Irrigation 0.24 0.55 0.00 0.79Energy 0.14 0.19 0.00 0.33
656 S.-M. Jalilov et al. / Journal of Hydrology 539 (2016) 648–661
3.5. Total basin-wide economic benefits
Total basin-wide economic benefits were calculated as a sum ofagricultural and energy benefits for each country. However, insteadof showing absolute numbers representing actual monetary bene-fits we decided to assign the baseline scenario as a base level andIrrigation and Energy scenarios as a percentage change compared tothe Baseline scenario. Therefore, Table 3 shows percentage changesof agricultural, energy and total benefits compared with the Base-line scenario by country over a 20-year period. The table presentstwo main messages: (1) Reservoirs operated in the Irrigation Modecould bring agricultural benefits to Tajikistan and Uzbekistan andalmost double total basin-wide economic benefits; (2) Reservoirsoperated in Energy Mode could bring energy benefits to Tajikistan,agricultural losses for all riparian countries, including Tajikistan,but double total basin-wide benefits as well. This happens bysecuring significant energy benefits for Tajikistan, much of whichcould see export to the other basin countries.
Reservoirs working in the Irrigation Mode present anopportunity for Tajikistan to increase agricultural and energybenefits and Uzbekistan to increase agricultural benefits. Forexample, Tajikistan could secure a growth in benefits of 120%and Uzbekistan could secure a growth in benefits of 10%. If theRogun Reservoir is managed in Energy Mode, Tajikistan couldsecure even higher benefits by 128%, but the remaining countrieswould shoulder a considerable decline in agricultural benefits.
Table 3Total discounted economic benefits (over 20 years) by country and reservoir operation mo
Country Policy Agricu
Tajikistan Baseline – Nurek 100Both dams – Irrigation 8Both dams – Energy �16
Afghanistan Baseline – Nurek 100Both dams – Irrigation 0Both dams – Energy �26
Uzbekistan Baseline – Nurek 100Both dams – Irrigation 10Both dams – Energy �25
Turkmenistan Baseline – Nurek 100Both dams – Irrigation 0Both dams – Energy �23
Total over countries Baseline – Nurek 100Both dams – Irrigation 8Both dams – Energy �24
4. Discussion
The results of this investigation showcase the importance ofimproved information on the economic impacts of future operationmodes of the Rogun Reservoir for the various countries influencedby its operation in the Amu Darya River Basin. Both reservoir oper-ation modes investigated present significant consequences for allof the riparian countries in the region. Operation in the EnergyMode causes reduction of water supply downstream in summerand as a result significant losses of agricultural benefits in Afghani-stan, Uzbekistan and Turkmenistan. In contrast, operation in theIrrigation Mode would leave Tajikistan with little electricity supplyfrom the reservoirs in their highest power demand period. Ourresults also indicate that in the Irrigation Mode additional benefitscould be acquired by downstream Uzbekistan only. This is a conse-quence of the upstream location of Uzbekistan and the possibilityof it using irrigation water prior to its downstream neighbor.
While hydropower production does not impact the quantity ofwater (with the exception of reservoir evaporation water losses),it strongly impacts the timing of river flows as the timing of waterreleases from the reservoir is dictated by the energy demand. Suchflow changes may lead to conflicts between upstream hydropowergeneration and downstream water users, including irrigation aswell as ecosystem needs. Water needs for energy production andirrigated agriculture are seasonally very different.
Tajikistan’s increased energy security would come at theexpense of downstream countries’ irrigation sectors. Under theEnergy Mode, Tajikistan would release water during winter to meetits energy demand, but Uzbekistan and Turkmenistan need waterduring the summer to ensure the sustainability of their large irri-gated agriculture. As a result, large areas of downstream cottonplantations could be lost due to decreased water availability duringthe peak irrigation season. When taking into account that the irri-gation sector plays a leading part in the national economies of bothUzbekistan and Turkmenistan and a high percentage of the popu-lation is engaged in agriculture, this could have major economicand social consequences.
Nevertheless, results from the Irrigation Mode show that thereservoirs could be operated so that they bring major agriculturalbenefits and potentially even increase the agricultural land areain upstream Tajikistan and downstream Uzbekistan. Under thismanagement, the Rogun Reservoir acts as a multiyear water stor-age regulator, thus helping downstream countries adapt to futuredroughts or floods. In this way, the Rogun Dam could have a majorpositive impact on the national economies, food security andeconomic development of the two downstream countries.
de in ratios to the baseline scenario.
ltural benefits Energy benefits Total benefits
100 100+124 +120+134 +128
1000
�26
100+10�25
1000
�23
100+80+75

S.-M. Jalilov et al. / Journal of Hydrology 539 (2016) 648–661 657
Operating both dams in the Irrigation Modewould not meet tim-ing of energy demand; however, Tajikistan will still secure signifi-cant levels of energy benefit. While the dam would still produceannually high levels of energy, the timing of energy productionwould be dictated by agriculture and not energy demand. As aresult, Tajikistan risks continuing to suffer from energy shortageduring several months while having energy surplus in othermonths. The Rogun Dam case in Central Asia is not a unique – othercountries face similar conditions and can tell similar stories abouttheir water managers and people. For instance, the Grand Ethio-pian Renaissance Dam (GERD) on the Nile River is the source ofconflict between upstream Ethiopia and downstream Egypt. Simi-lar to Tajikistan, Ethiopia needs energy for its economic develop-ment and wants to build the GERD, but Egypt opposes Ethiopianplans because of negative impacts on its long-established agricul-ture. The Xayaburi Dam on the Mekong River is supposed to bringconsiderable energy benefits to Laos (LPDR), although the down-stream countries of Thailand, Cambodia and Vietnam oppose thedam construction based on its detrimental impacts on their foodsecurity, driven by fishery production.
Without explicit trade in food, water, and power, in which over-all efficiency gains of basin-wide optimization are shared amongcountries, there are few easy solutions. Each country seeks toensure its own national interests, whether it is food or energy pro-duction. However, there is another solution not investigated in thisstudy but which could merit future analysis. One option is operateeach dam differently, for instance the Rogun could operate in theEnergy Mode while Nurek operates in the Irrigation Mode. By enact-ing this approach, Tajikistan would still ensure its seasonal elec-tricity demand and downstream countries would secure waterneeded for its crop irrigation. This could be an opportunity for allriparian countries to reach a benefit sharing Pareto Improvementin the Basin.
While the current situation is difficult to resolve we believe thatthe Basin countries could negotiate a settlement over equitablebenefit sharing mechanisms that implement some form of redistri-bution or compensation. Naturally, the form of this redistributionor compensation is highly situational and site specific, but couldinvolve monetary transfers, granting of rights to use water, financ-ing of investments, or the provision of non-related goods and ser-vices (Sadoff and Grey, 2002). As Sadoff and Grey (2002) note‘‘while some benefits are difficult to share or compensate, in gen-eral the optimization of benefits should be more robust and moreflexible than the optimization of physical water resources, becausebenefits tend to be more easily monetized and compensated andthey have less political and psychological significance” (Sadoffand Grey, 2002, p. 397). The scope of discussed benefits is also sub-ject to negotiations. The larger the scope of measures over whichnegotiation can occur, the more likely the riparians will be ableto find arrangements of benefits that are mutually acceptable.
There are cases of successful implementation of benefit sharingconcepts in various parts of the world. Canada and the UnitedStates reached agreement on benefit sharing mechanisms and con-cluded the Columbia River Treaty in 1964 (Tarlock and Wouters,2007). Guinea, Mauritania, Mali, and Senegal, all of which sharethe Senegal River Basin, agreed in 1972 to share the benefitsderived from water use, such as irrigation, hydropower generation,and inland navigation (Alam et al., 2009; Haas, 2009). An exampleof the Orange-Senqu River Basin, shared by South Africa, Lesotho,Botswana and Namibia, shows a case where a downstream countrybuilt a dam upstream to increase aggregate net benefits, so boththe downstream and upstream countries can share the project’sbenefits, rather than pursuing a unilateral alternative.(Hensengerth et al., 2012; Yu, 2011).
Based on the above-mentioned successful cases we could sug-gest to study the applicability of benefit sharing concepts related
to the Amu Darya basin. The Energy Mode scenario assumes a128% increase in Tajikistan’s total benefits. Detailed calculation isneeded to check whether this surplus of benefits would allowTajikistan to compensate losses of other riparian countries and stillbe better-off. By doing this Tajikistan also may seemingly get con-sent of downstream countries that object to building the RogunDam. Another option could be a restoration of benefit sharingschemes used in the former Soviet period. The scheme is basedon the principle – water was provided for the downstream coun-tries in vegetation time, so upstream countries had to store waterin their reservoirs in winter and release it in summer. In exchange,downstream countries were obliged to provide upstream countrieswith energy resources (natural gas, oil, coal) in the winter months.This scenario worked well until the emergence of newly indepen-dent countries emerging out of the former Soviet Union, who didnot want to follow previous Soviet agreements. Of course, at firsteach involved country must agree to such a scheme and new moredetailed calculations should be made. It could turn out that thisscheme would not be acceptable from a benefits and costs pointof view under the current situation.
The novelty of this study in comparison with the previous stud-ies on the Rogun Dam (Bekchanov et al., 2013b; Jalilov et al., 2013a,2013b) is that it aims to balance contradiction (economic gains andlosses) between energy mode and irrigation mode in differentdams by multi-objective optimization and decision making meth-ods. While those studies conclude that the Rogun Reservoir has amodest impact on downstream irrigation if the reservoir is oper-ated to maximize basin-wide benefits, our investigation in the cur-rent work shows more strongly the differences among the ripariancountries in potential economic benefits and losses under a rangeof operation modes. This fundamental difference becomes moreclear when pointing out those previous studies made assumptionsabout regional cooperation that would lead to optimal allocation ofbasin-wide economic benefits. Our investigation used a differentand perhaps more realistic view where each country focuses solelyon its own interests and tries to maximize the national benefitsderived from the Rogun and Nurek Dams.
5. Limitations and conclusions
This study has limitations, related both to data and approach.The analysis is based on simple datasets that are widely available.Hydrological data from the area are weak as a consequence of inad-equate hydrometric networks, and there is also little consistentlycollected agricultural data available for crop production, cost,yields, or crop water use. Our study has therefore required majorassumptions and simplifications on the cropped area, crop mix,river flows, and crop water use. Due to lack of reliable data on aqui-fers, the study also excluded groundwater use for irrigation. Inaddition, the model is based on the assumption that there are insti-tutions and markets that efficiently use and allocate land, water,crop and energy. The modeling framework faces limitations aswell. For example, the model constraints are simplifications. Yet,despite these limitations the study has demonstrated how differ-ent scenarios regarding the Rogun Dam can produce different eco-nomic benefits for the riparian countries.
This article has presented an analysis of possible future opera-tion modes of the controversial Rogun Dam, located in the majortributary of the Amu Darya River. The hydro-economic modelingresults of two operation modes – Energy Mode and Irrigation Mode– indicate that the Dam can be operated in different ways, leadingto dramatically differing benefits and losses for the riparian coun-tries. However, neither operation mode provides optimized bene-fits for all the countries, emphasizing how difficult it is toactually reach win–win situations across a water–energy–foodsecurity nexus in large river basins.

658 S.-M. Jalilov et al. / Journal of Hydrology 539 (2016) 648–661
The mission of this investigation was to examine the possibili-ties to develop the water resources in the Amu Darya River Basinso that it would maximize food, energy – and economy-relatedbenefits for all riparian countries while minimizing the losses tothese sectors as well as to the environment. The planned RogunDam is, due to its size and importance, was the focus of our work.While this study shows the benefits of differing operation modes ofthe Rogun Dam, it does not seek to provide an operational solutionfor this challenging and politically sensitive case. Yet, we wouldlike to see our results open and facilitate the discussion aboutthe sustainable water resources development in the region.
Funding
This article forms a part of the research carried out under theAcademy of Finland – funded NexusAsia project [#269901]. Inaddition, Olli Varis received funding from Finnish CulturalFoundation.
Acknowledgements
Thanks for our colleagues at Aalto University’s Water and Envi-ronmental Engineering Research Group for their support. Specialthanks to Miina Porkka and Matti Kummu for the map of CentralAsia.
Appendix A
The model and its documentation were originally developed forapplication to the Amu Darya Basin in the Central Asia. However, itis adaptable to the hydrology, water infrastructure development,land use patterns, economics, and institutions of any basin.
The essential principle of the hydrology component of model ismass balance – for surface flow, water diversions and water deple-tions for use in irrigated agriculture. Important variables trackedinclude water storage capacity, crop mix, land in production, andfarm income associated with various scales of water storage underconditions of various water supply scenarios from base anddrought. The model structure is defined below using the GAMSnotation, described by the vendor at gams.com.
A.1. Sets
Sets are the dimensions over which the storage scaling model isdefined. A similar structure could be used for reservoir capacityanalysis anywhere new water storage is planned. The followingsets and set elements are used.
i
Flows /inflow, river, divert, use, return,release/u
Stocks /reservoir/ t Months /Jan–Dec/ y Years /1–20/ j crop /cotton, wheat, vegetables/ k crop season /first, second/ n water supplyscenario
/base, dry/p
Policy /wo_dam, wi_dam1, wi_dam2,wi_dam3/s
Region countries /Afghanistan, Tajikistan, Turkmenistan,Uzbekistan/A.2. Data
Some of the following parameters (data) terms end in _p to dis-tinguish parameters (unknown terms) from unknown variables.Parameters are:
Bu (divert, use)
defines consumptive use as apercent of diversionBr (divert, return)
defines surface return flow as apercent of diversionBLV (rel, u)
links reservoir releases todownstream flowssource (inflow,y, t, n, p)
annual basin inflows atheadwaters in scenario(cubic km per month)yield_p (use, j, k)
crop yield (tons per hectare) cost_p (use, j, k) crop cost of production(USD per ton)
price_elast (j) price elasticity of demand P_p (j) observed crop price (USD per ton) Bu_p (i, j, t) crop water demand per hectare(divert + use + return) per month
Capacity (res, p) reservoir maximum capacity bystages
Z0 (res) initial reservoir level at stock node h0_p (res, y, t, n, p) dam’s maximum height in stages ID_ru (return, use) identity matrix connects returnnodes to use nodes
ID_du (divert, use) identify matrix connects divertnodes to use nodes
Landrhs_p (use) Irrigated land area by countries(million hectares)
hydro_price (res, t) price of hydropower (constantUSD per kW h)
A.3. Variables (unknowns)
Some of unknown variable ends in _v, to distinguish variablesfrom known data. The model solves for the optimal value of eachof these variables, for which the goal is to maximize several alter-native aggregations of total basin net economic benefits whilerespecting key constraints.
A.3.1. Positive variables
Z_v (res, y, t, n, p)
reservoir water stocks reservoirs_h_v (res, y, t, n, p) reservoirs height ineach month
supply_v (inflow, y, t, n, p) supplies hectares_v (use, j, k, y, t, n, p) area under each crop ineach country in time
land_v (use, y, t, n, p) land in production production_v (use, y, t, n, p) crop produced in eachcountry
T_production_v (j, k, y, t, n, p) crop produced energy_prod_v (res, y, t, n, p) energy production energy_ben_v (res, y, t, n, p) energy production benefitsin Rogun in each month
S.-M. Jalilov et al. / Journal of Hydrology 539 (2016) 648–661 659
A.3.2. Free variables
X_v (i, y, t, n, p)
water flows (inflow, river,divert, use, return, release)Con_surp_v (j, y, t, n, p)
consumer surplus ag_ben_v (use, y, t, n, p) net income over crops by nodeand period
tot_agben_v (use, n, p) net agricultural benefits bycountry
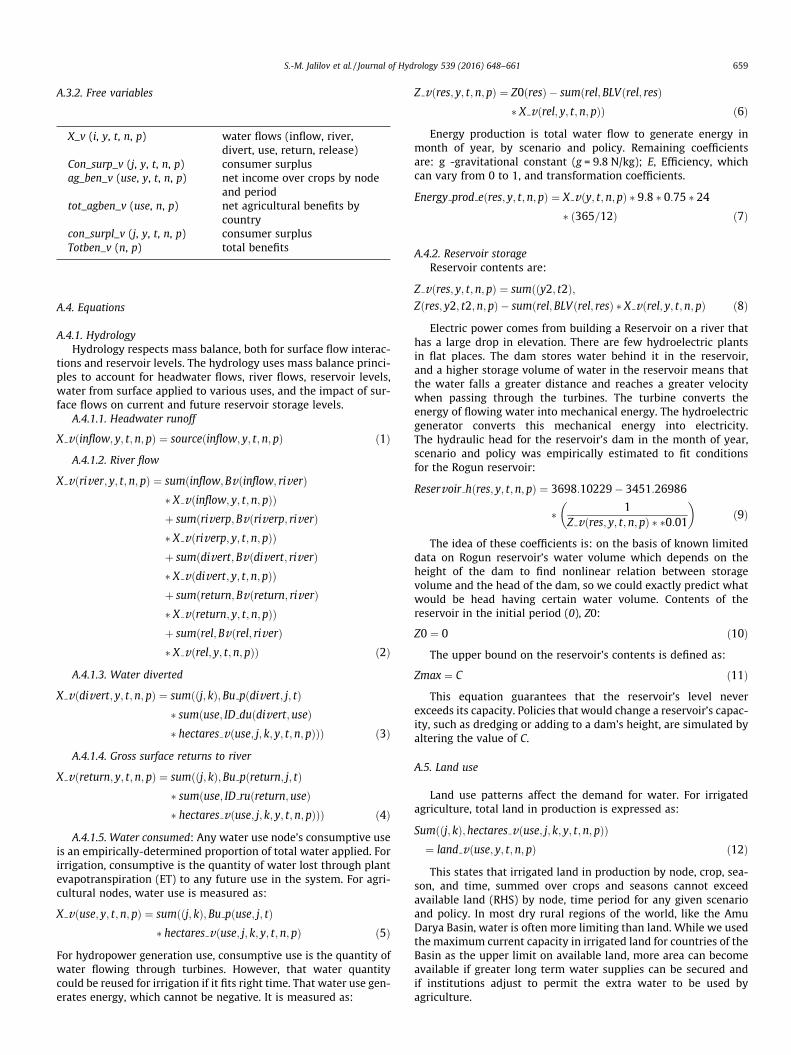
con_surpl_v (j, y, t, n, p) consumer surplus Totben_v (n, p) total benefitsA.4. Equations
A.4.1. HydrologyHydrology respects mass balance, both for surface flow interac-
tions and reservoir levels. The hydrology uses mass balance princi-ples to account for headwater flows, river flows, reservoir levels,water from surface applied to various uses, and the impact of sur-face flows on current and future reservoir storage levels.
A.4.1.1. Headwater runoff
X vðinflow; y; t;n;pÞ ¼ sourceðinflow; y; t; n;pÞ ð1ÞA.4.1.2. River flow
X vðriver; y; t;n; pÞ ¼ sumðinflow;Bvðinflow; riverÞ� X vðinflow; y; t;n; pÞÞþ sumðriverp;Bvðriverp; riverÞ� X vðriverp; y; t;n;pÞÞþ sumðdivert; Bvðdivert; riverÞ� X vðdivert; y; t;n;pÞÞþ sumðreturn; Bvðreturn; riverÞ� X vðreturn; y; t; n;pÞÞþ sumðrel;Bvðrel; riverÞ� X vðrel; y; t;n;pÞÞ ð2Þ
A.4.1.3. Water diverted
X vðdivert; y; t;n; pÞ ¼ sumððj; kÞ; Bu pðdivert; j; tÞ� sumðuse; ID duðdivert; useÞ� hectares vðuse; j; k; y; t;n;pÞÞÞ ð3Þ
A.4.1.4. Gross surface returns to river
X vðreturn; y; t;n; pÞ ¼ sumððj; kÞ;Bu pðreturn; j; tÞ� sumðuse; ID ruðreturn;useÞ� hectares vðuse; j; k; y; t; n;pÞÞÞ ð4Þ
A.4.1.5. Water consumed: Any water use node’s consumptive useis an empirically-determined proportion of total water applied. Forirrigation, consumptive is the quantity of water lost through plantevapotranspiration (ET) to any future use in the system. For agri-cultural nodes, water use is measured as:
X vðuse; y; t;n; pÞ ¼ sumððj; kÞ; Bu pðuse; j; tÞ� hectares vðuse; j; k; y; t;n;pÞ ð5Þ
For hydropower generation use, consumptive use is the quantity ofwater flowing through turbines. However, that water quantitycould be reused for irrigation if it fits right time. That water use gen-erates energy, which cannot be negative. It is measured as:
Z vðres; y; t;n;pÞ ¼ Z0ðresÞ � sumðrel;BLVðrel; resÞ� X vðrel; y; t;n;pÞÞ ð6Þ
Energy production is total water flow to generate energy inmonth of year, by scenario and policy. Remaining coefficientsare: g -gravitational constant (g = 9.8 N/kg); E, Efficiency, whichcan vary from 0 to 1, and transformation coefficients.
Energy prod eðres; y; t;n;pÞ ¼ X vðy; t;n;pÞ � 9:8 � 0:75 � 24� ð365=12Þ ð7Þ
A.4.2. Reservoir storageReservoir contents are:
Z vðres; y; t;n;pÞ ¼ sumððy2; t2Þ;Zðres; y2; t2;n;pÞ � sumðrel;BLVðrel; resÞ � X vðrel; y; t;n;pÞ ð8Þ
Electric power comes from building a Reservoir on a river thathas a large drop in elevation. There are few hydroelectric plantsin flat places. The dam stores water behind it in the reservoir,and a higher storage volume of water in the reservoir means thatthe water falls a greater distance and reaches a greater velocitywhen passing through the turbines. The turbine converts theenergy of flowing water into mechanical energy. The hydroelectricgenerator converts this mechanical energy into electricity.The hydraulic head for the reservoir’s dam in the month of year,scenario and policy was empirically estimated to fit conditionsfor the Rogun reservoir:
Reservoir hðres; y; t;n; pÞ ¼ 3698:10229� 3451:26986
� 1Z vðres; y; t;n;pÞ � �0:01
� �ð9Þ
The idea of these coefficients is: on the basis of known limiteddata on Rogun reservoir’s water volume which depends on theheight of the dam to find nonlinear relation between storagevolume and the head of the dam, so we could exactly predict whatwould be head having certain water volume. Contents of thereservoir in the initial period (0), Z0:
Z0 ¼ 0 ð10ÞThe upper bound on the reservoir’s contents is defined as:
Zmax ¼ C ð11ÞThis equation guarantees that the reservoir’s level never
exceeds its capacity. Policies that would change a reservoir’s capac-ity, such as dredging or adding to a dam’s height, are simulated byaltering the value of C.
A.5. Land use
Land use patterns affect the demand for water. For irrigatedagriculture, total land in production is expressed as:
Sumððj; kÞ;hectares vðuse; j; k; y; t;n; pÞÞ¼ land vðuse; y; t;n; pÞ ð12ÞThis states that irrigated land in production by node, crop, sea-
son, and time, summed over crops and seasons cannot exceedavailable land (RHS) by node, time period for any given scenarioand policy. In most dry rural regions of the world, like the AmuDarya Basin, water is often more limiting than land. While we usedthe maximum current capacity in irrigated land for countries of theBasin as the upper limit on available land, more area can becomeavailable if greater long term water supplies can be secured andif institutions adjust to permit the extra water to be used byagriculture.

660 S.-M. Jalilov et al. / Journal of Hydrology 539 (2016) 648–661
The baseline policy analysis is constrained to replicate historicalirrigated land by country and crop. For the two alternative policies,those constraints are removed by allowing water trade-offs tooccur, either within a single or among different irrigated areas.Either policy permits existing water to be reallocated to highereconomic valued water uses where the economics would supportsuch a reallocation.
A.6. Economics
Economic benefits are produced by water depletions at usenodes for irrigated agriculture and by the water flowing throughturbines to generate energy at reservoir nodes. For agriculturaluses, the willingness to pay is measured by the contribution ofwater to net farm income which equals crop price multiplied byyield minus cost of production plus any unpriced consumer sur-plus. Consumer surplus is an unpriced value, equal to the amountby which power buyers’ economic welfare exceeds the actual pricecharged. It is measured as the area beneath the demand functionand above actual price charged:
Con surp vðj; y; t;n;pÞ ¼ 0:5 � ½b0 pðjÞ� Crop price vðj; y; t;n; pÞ�� sumðk; T productionðj; k; y; t;n;pÞÞ ð13Þ
For energy benefits, total revenue is measured as the price ofelectricity multiplied by the quantity produced. In the currentimplementation of the model, that electricity price is set at recentobserved levels in the basin. Reduced prices from additional hydro-power will raise consumer surplus, while increased prices willreduce consumer surplus. For regions of the basin that currentlyhave little access to power, increases in consumer surplus are eco-nomically and politically important to achieve:
Energy ben vðres; y; t;n;pÞ ¼ energy prodðres; y; t; n;pÞ� hydro priceðres; tÞ ð14Þ
Agricultural benefits are measured as:
Ag ben vðuse; y; t;n;pÞ ¼ sumððj; kÞ; ðP pðjÞ � yield pðuse; j; tÞ� cost pðuse; j; tÞÞÞ ð15Þ
Price of a particular crop is a negatively sloping demand func-tion, which means that one price is set for each crop for all ripariancountries, so any crop could be grown in the most favorable condi-tions. What this means is that:
Crop price vðj; y; t;n;pÞ ¼ b0 pðjÞ þ b1 pðjÞ� sumðk; T production vðj; k; y; t;n;pÞÞ
ð16ÞThe empirically estimated coefficients b0_p and b1_p are a lin-
earized demand function based on estimated price elasticities.To measure total crop production, the following equation is
used:
T production v ¼ sumðuse;production vðuse; j; k; y; t;n;pÞÞ ð17Þ
A.7. Discounted net present value
Finally, the basin scale integrated model maximizes discountednet present value across all water uses, water environments, andtime periods subject to hydrologic and institutional constraints:
DNPV v ¼ sum�ðu; y; tÞ � Ag ben vðuse; y; t;n; pÞ
ð1þ ruÞ � �t�
þ sum�ðres; y; tÞ Energy ben vðres; y; t; n;pÞ
ð1þ ruÞ � �t�
ð18Þ
This says that the net present value of total water-based bene-fits for all nodes in the Amu Darya Basin sums income over coun-tries and time-periods, which discounts future incomes moreheavily when there is a higher discount rate. The current modelimplementation uses a 5% discount rate. The model allocates wateramong the basin’s water uses, locations, and time periods to max-imize DNPV_v, subject to the stated constraints.
References
Alam, U., Dione, O., Jeffrey, P., 2009. The benefit-sharing principle: implementingsovereignty bargains on water. Polit. Geogr. 28, 90–100. http://dx.doi.org/10.1016/j.polgeo.2008.12.006.
Ansar, A., Flyvbjerg, B., Budzier, A., Lunn, D., 2014. Should we build more largedams? The actual costs of hydropower megaproject development. Energy Policy69, 43–56.
Arbour, L., 2011. Next year’s Wars. Foreign Policy, No. 27, December.Azimov, H., 2014. Zvyozdniy chas Roguna I ego vozvrashenie. Asia-Plus Media
Group (in Russian). Available from: <http://news.tj/ru/news/zvezdnyi-chas-roguna-i-ego-vozvrashchenie> (accessed 10 August 2014).
Bazilian, M., Rogner, H., Howells, M., Hermann, S., Arent, D., Gielen, D., Steduto, P.,Mueller, A., Komor, P., Tol, S., Yumkella, K., 2011. Considering the energy, waterand food nexus: towards an integrated modelling approach. Energy Policy 39(12), 7896–7906.
Bekchanov, M., Bhaduri, A., Ringler, C., 2013a. How Market-Based Water Allocationcan Improve Water use Efficiency in the Aral Sea basin? ZEF Discussion Paperson Development Policy, No. 177. Available from: <http://www.econstor.eu/bitstream/10419/84792/1/744864917.pdf> (accessed 31 May 2014).
Bekchanov, M., Bhaduri, A., Ringler, C., 2013b. Is Rogun a Silver Bullet for WaterScarcity in Central Asia? Center for International Development andEnvironmental Research. Available from: <http://ageconsearch.umn.edu/bitstream/159075/2/Bekchanovetal2013aRogunimpactfinal.pdf> (accessed 31May 2014).
Brooke, A., Kendrick, D., Meeraus, A., Raman, R., 2006. GAMS Language Guide. GAMSDevelopment Corporation, Washington, DC.
Cai, X.M., McKinney, D.C., Rosegrant, M.W., 2003. Sustainability analysis forirrigation water management in the Aral Sea region. Agric. Syst. 3, 1043–1066.
Central Intelligence Agency (CIA), 2011. The World Factbook. Uzbekistan. Availablefrom: <http://www.cia.gov/library/publications/the-world-factbook/geos/uz.html> (accessed 5 May 2014).
Chen, J., Shi, H., Sivakumar, B., Peart, M.R., 2016. Population, water, food, energy anddams. Renew. Sustain. Energy Rev. 56, 18–28.
Earle, A., Jägerskog, A., Öjendal, J., 2010. Transboundary Water Management –Principles and Practice. Earthscan, London.
Glantz, M., 2005. Water, climate, and development issues in the Amu Darya Basin.Migr. Adapt. Strategies Glob. Change 1, 23–50.
Gulati, M., Jacobs, I., Jooste, A., Naidoo, D., Fakir, S., 2013. The water–energy–foodsecurity nexus: challenges and opportunities for food security in South Africa.Aqua. Proc. 1, 150–164.
GWSP, 2014. Sustainability in the Water–Energy–Food Nexus. In: Proceedings ofthe GWSP International Conference ‘‘Sustainability in the Water–Energy–FoodNexus”, 19–20 May 2014, Bonn, Germany.
Haas, L., 2009. Introducing Local Benefit Sharing Around Large Dams in West Africa.International Institute for Environment and Development and the Global WaterInitiative, London.
Hellegers, P.J., Zilberman, D., Steduto, P., McCornick, P., 2008. Interactions amongwater, energy, food and environment: evolving perspectives and policy issues.Water Policy 10 (Suppl. 1), 1–10.
Hensengerth, O., Dombrowsky, I., Scheumann, W., 2012. Benefit-Sharing in DamProjects on Shared Rivers. Discussion Paper. German Development Institute.
Hermann, S., Welsch, M., Segerstrom, R., Howells, M., Young, C., Alfstad, T., Rogner,H., Steduto, P., 2012. Climate, land, energy and water (CLEW) Interlinkages inBurkina Faso: an analysis of agricultural intensification and bioenergyproduction. Nat. Resour. Forum 36, 245–262.
Hoff, H., 2011. Understanding the Nexus. In: Background Paper for the Bonn2011Conference: The Water, Energy and Food Security Nexus. StockholmEnvironment Institute, Stockholm.
Hussey, K., Pittock, J., 2012. The energy–water nexus: managing the links betweenenergy and water for a sustainable future. Ecol. Soc. 17 (1), 31.
Jägerskog, A., Clausen, T.J., Lexén, K., nd Holmgren, T. (Eds.), 2013. Cooperation for aWater Wise World – Partnerships for Sustainable Development. Report Nr. 32.Stockholm; Stockholm International Water Institute.
Jalilov, S., Amer, S., Ward, F., 2013a. Reducing conflict in development and allocationof transboundary Rivers. Eurasian Geogr. Econ. 54 (1), 78–109.
Jalilov, S., Amer, S., Ward, F., 2013b. Water, food, and energy security: an elusivesearch for balance in central Asia. Water Resour. Manage 27, 3959–3979.
Kim, Y., Indeo, F., 2013. The new great game in Central Asia post 2014: the US ‘‘NewSilk Road” strategy and Sino-Russian rivalry. Commun. Post-Commun. Stud. 46,275–286.
Konovalov, V., 2009. Extreme and average glacier runoff in the Amudarya RiverBasin. In: Threats to Global Water Security. NATO Science for Peace and SecuritySeries C: Environment Security 2009.371-376. Available from: <http://www.springerlink.com/content/m530128021147308> (accessed 15 May 2014).

S.-M. Jalilov et al. / Journal of Hydrology 539 (2016) 648–661 661
Lee, Y., Yoon, T., Shah, F.A., 2011. Economics of integrated watershed managementin the presence of a dam. Water Resour. Res. 47, W10509. http://dx.doi.org/10.1029/2010WR009172.
Raskin, P., Hansen, E., Zhu, Z., Stavisky, D., 1992. Simulation of water-supply anddemand in the Aral Sea Region. Water Int. 17, 55–67.
Rasul, G., 2014. Food, water, and energy security in South Asia: a nexus perspectivefrom the Hindu Kush Himalayan region. Environ. Sci. Policy 39, 35–48.
Ringler, C., Bhaduri, A., Lawford, R., 2013. The nexus across water, energy, land andfood (WELF): potential for improved resource use efficiency? Curr. Opin.Environ. Sustain. 5, 617–624.
Sadoff, C.W., Grey, D., 2002. Beyond the river: the benefits of cooperation oninternational rivers. Water Policy 4 (5), 389–403.
Savchenkov, N.G., Osadchii, L.G., Kolesnichenko, A.I., Dokuchaev, S.M., Dubinchik, E.I., 1989. Damming the Vakhsh River channel at the site of the RogunHydroelectric station. Translated from Gidrotekhnicheskoe Stroitel’stvo 9, 17–19.
Schlüter, M., Savitsky, A., McKinney, D., Lieth, H., 2005. Optimizing long-term waterallocation in the Amu Darya river delta: a water management model forecological impact assessment. Environ. Model. Softw. 20, 529–545.
Schlüter, M., Herrfahrdt Pähle, E., 2011. Exploring resilience and transformability ofa River Basin in the Face of socioeconomic and ecological crisis: an examplefrom the Amu Darya River Basin, Central Asia. Ecol. Soc. 16 (1), 32.
Scott, G., Pierce, S., Pasqualetti, M., Jones, A., Montz, B., Hoover, J., 2011. Policy andinstitutional dimensions of the water-energy nexus. Energy Policy 39 (10),6622–6630.
SIC ICWC, Scientific-Information Center of the Interstate Commission for WaterCoordination in Central Asia, 2010. Available at <http://www.cawater-info.net/aral/water_e.htm> (accessed in 02/15/2010).
Sharma, S., Bazaz, A., 2012. Integrated assessment of water–energy nexus in thecontext of climate change. In: Water, Energy and Food Security: Call forSolutions. Presented at India Water Week 2012, New Delhi, 10–14 April 2012.
Spoor, M., Krutov, A., 2003. The power of water in a divided Central Asia. Perspect.Glob. Dev. Technol. 2, 593–614.
Tarlock, A., Wouters, P., 2007. Are shared benefits of international waters anequitable apportionment? Colo. J. Int. Environ. Law Policy 18 (3), 523–536.
The Economist, 2013. Hydropower in Tajikistan: Folie de grandeur, July 27th 2013.The Rogunskaya Hydro Power Station, 2009. Performance Characteristics.
Dushanbe. Tajikistan Open Joint Stock Holding Company ‘‘Barki Tojik.”Available from: <http://www.tjus.org/Copy%20of%20Rogynskaya%20GES%20_English%20version1.pdf> (accessed 25 September 2009).
Thrilling, D., 2014. Tajikistan: World Bank Gives Dam Green Light; Rights WatchdogWorried. EurasiaNet.org. Available from: <http://www.eurasianet.org/node/68761> (accessed 10 August 2014).
UNECE, 2007. Our Waters: Joining Hands across Borders. First Assessment ofTransboundary Rivers, Lakes and Groundwaters. <http://www.unece.org/env/water/publications/pub76.html> (accessed February 27, 2013).
USGS, 2001. Administrative Boundaries, Global GIS Database (Reston, VA: USGeological Survey) Available from: http://webgis.wr.usgs.gov/globalgis/(accessed on 26 August 2014).
Wegerich, K., 2008. Hydro-hegemony in the Amu Darya Basin. Water Policy 10, 71–88.
WEF, 2011. Global Risks 2011: Sixth Edition – An Initiative of the Risk ResponseNetwork. World Economic Forum in collaboration with Marsh & McLennanCompanies, Swiss Reinsurance Company, Wharton Center for RiskManagement, University of Pennsylvania and Zurich Financial Services,Cologny/Geneva, Switzerland.
World Bank, 2014. Key Issues for Consideration on the Proposed Rogun HydropowerProject. Draft for discussion, 17 June 2014. Available from: <http://www.worldbank.org/content/dam/Worldbank/Event/ECA/central-asia/WB%20Rogun%20Key%20Issues.pdf> (accessed on 23 June 2014).
World Bank, 2012. Tajikistan’s Winter Energy Crisis: Electricity Supply and DemandAlternatives, November 2012. The International Bank for Reconstruction andDevelopment/The World Bank, <http://siteresources.worldbank.org/ECAEXT/Resources/TAJ_winter_energy_27112012_Eng.pdf> (accessed on 30 May 2014).
World Bank, 2003. Irrigation in Central Asia. Social, Economic and EcologicalAspects. Available from: <http://www.worldbank.or/eca/environment>(accessed on 30 April 2014).
World Data Bank II, 1980. Global River Network. CIA, U.S. Government. Availablefrom: <http://www.evl.uic.edu/pape/data/WDB/> (accessed on 26 August2014).
Wyrwoll, P., 2011. The Xayaburi Dam: Challenges of Transboundary WaterGovernance on the Mekong River. Global Water Forum. Available from:<http://www.globalwaterforum.org/2011/12/13/the-xayaburi-dam-challenges-of-regional-water-governance-on-the-mekong/> (accessed on 16 February2015).
Yu, W., 2011. Benefit Sharing in International Rivers: Findings from the SenegalRiver Basin, the Columbia River Basin, and the Lesotho Highlands Water Project.World Bank, Washington, DC.