managing your savings fund manager report february 2019 · nbp funds managing your savings fund...
TRANSCRIPT

NBP FUNDSManaging Your Savings
Fund Manager ReportFebruary 2019
Disclaimer: All investment in mutual funds/plans is subject to market risk. Past performance is not necessarily indicative of future results. Please read the Offering Documents to understand the investment policies and the risks involved. The underlying scheme holds certain non-compliant investments. Before making any investments decision, investors should review the latest monthly Fund Manager Report and Financial Statements. NBP Funds will play a facilitating role by assisting the covered or the nominee in claim processing.
For Investment & Information
0800-20002 INVEST to 9995 [email protected]
www.nbpfunds.com /nbpfunds Rated by PACRAAM1
NAFA ISLAMIC SAVING PLANSWedding Plan Education Plan Retirement Plan Wealth Plan
Savings + Life Takaful Coverage of upto Rs. 5 million*
Available Investment Strategies
NAFA Islamic Surmaya Tahaffuz Plan (NISTP)
NAFA Islamic Mutawazan Surmaya Plan (NIMSP)
NAFA Islamic Surmaya Izafa Plan (NISIP)
Saving Plans**
7.2%11.6%15.5%
17.4 Lacs24.2 Lacs31.8 Lacs
Annualized Profit Value of Rs. 10 Lacs
Last 8 Year Performance of Underlying Funds***
*Terms and conditions apply.**Underlying investment of the above strategy is as follows NISTP: 100% NRFSF, NIMSP:50% NRFSF and 50% NIAAF, NISIP: 100% NIAAF. NRFSF: NAFA RIBA FREE SAVINGS FUND; NIAAF: NAFA ISLAMIC ASSET ALLOCATION FUND.***Note: Performance shown is of the underlying funds as on Feb 28, 2019 based on dividend reinvestment gross of withholding Taxes, excluding cost of front end load. The performance reported is net of Management Fee, Takaful premium, and all other expenses. Taxes apply as per current income tax law.

Table of Contents
Table of Contents
Pg. 04NAFA Government Securities Liquid Fund (NGSLF)
Pg. 05NAFA Money Market Fund (NMMF)
Pg. 06NAFA Islamic Money Market Fund (NIMMF)
Pg. 09NAFA Riba Free Savings Fund (NRFSF)
Pg. 10NBP Aitemaad Mahana Amdani Fund (NAMAF)
Pg. 11NAFA Financial Sector Income Fund (NFSIF)
Pg. 18NAFA Multi Asset Fund (NMF)
Pg. 16NAFA Islamic Asset Allocation Fund (NIAAF)
Pg. 15NAFA Asset Allocation Fund (NAAF)
Pg. 08NAFA Savings Plus Fund (NSPF)
Pg. 07NAFA Government Securities Savings Fund (NGSSF)
Pg. 20NAFA Stock Fund (NSF)
Pg. 22NAFA Financial Sector Fund (NFSF)
Pg. 19NAFA Islamic Stock Fund (NISF)
Pg. 03Capital Market Review
Pg. 02CEO’s Write-up
Pg. 01Performance Summary Sheet of Key Funds
NAFA Income Fund (NIF) Pg. 14
NAFA Islamic Income Fund (NIIF) Pg. 12
NAFA Income Opportunity Fund (NIOF) Pg. 13
NAFA Pension Fund (NPF) Pg. 23
NAFA Islamic Pension Fund (NIPF) Pg. 24
NAFA Islamic Principal Protected Fund-II (NIPPF-II) Pg. 25
NAFA Islamic Active Allocation Plan-I (NIAAP-I) Pg. 26
NAFA Islamic Active Allocation Plan-II (NIAAP-II) Pg. 27
NAFA Islamic Active Allocation Plan-III (NIAAP-III) Pg. 28
NAFA Islamic Active Allocation Plan-IV (NIAAP-IV) Pg. 29
NAFA Islamic Active Allocation Plan-V (NIAAP-V) Pg. 30
NAFA Islamic Active Allocation Plan-VI (NIAAP-VI) Pg. 31
NAFA Islamic Active Allocation Plan-VII (NIAAP-VII) Pg. 32
NAFA Islamic Active Allocation Plan-VIII (NIAAP-VIII) Pg. 33
NAFA Islamic Capital Preservation Plan-II (NICPP-II) Pg. 35
NAFA Islamic Capital Preservation Plan-III (NICPP-III) Pg. 36
NAFA Islamic Capital Preservation Plan-IV (NICPP-IV) Pg. 37
NBP Islamic Capital Preservation Plan-V (NICPP-V) Pg. 38
NAFA Islamic Capital Preservation Plan-I (NICPP-I) Pg. 34
NAFA Active Allocation Riba Free Savings Fund (NAARFSF) Pg. 39
NAFA Islamic Active Allocation Equity Fund (NIAAEF) Pg. 40
NBP Aitemaad Regular Payment Fund (NARPF) Pg. 17
NAFA Islamic Energy Fund (NIEF) Pg. 21
NBP FUNDSManaging Your Savings

Performance Summary of Key Funds
February 2019
Disclaimer: This publication is for informational purpose only and nothing herein should be construed as a solicitation, recommendation or an offer to buy or sell the fund. All investments in mutual funds and pension funds are subject to market risks. Past Performance is not necessarily indicative of future results. Please read the Offering Document to understand investment policies and the risks involved.
StabilityRating
Fund Size(Rs. In Crore)
InceptionDate
228
2,014
40
584
407
530
272
AAA (f)
AA (f)
AA- (f)
A (f)
A+ (f)
A (f)
A- (f)
15-May-09
23-Feb-12
21-Nov-09
20-Aug-10
28-Oct-11
21-Apr-06
26-Oct-07
8.5%
8.4%
7.7%
6.2%
8.4%
7.1%
7.7%
5.7%
8.6%
7.9%
8.0%
10.0%
6.6%
5.7%
SinceInception
8.1%
8.6%
8.2%
6.9%
7.9%
7.1%
7.8%
6.7%
7.9%
8.9%
16.6%
9.8%
13.6%
6.5%
FY2014
Fixed Income Funds Annualized Returns
Equity Related Funds Cumulative ReturnsAnnualized
Returns
NG
SLF
NMM
FN
SPF
NRF
SFN
FSIF
NIO
FN
IIFN
AA
FN
MF
Ris
k Pr
ofile
Low
est R
isk
Mod
erat
e Ri
sk
20-Aug-10
19-Jan-07
26-Oct-07
19-Jan-07
09-Jan-15
NAFA Asset Allocation Fund
Benchmark
NAFA Multi Asset Fund
Benchmark
NAFA Islamic Asset Allocation Fund
Benchmark
NAFA Stock Fund
Benchmark
NAFA Islamic Stock Fund
Benchmark
248
158
966
1,464
570
(2.4%)
(2.1%)
(2.5%)
(2.1%)
(1.9%)
(2.3%)
(3.3%)
(4.0%)
(2.9%)
(4.0%)
(2.3%)
0.9%
(2.9%)
0.9%
(4.6%)
(2.6%)
(7.5%)
(8.8%)
(7.7%)
(10.4%)
(6.8%)
(2.8%)
(6.2%)
(2.8%)
(8.7%)
(3.6%)
(9.7%)
(10.0%)
(12.8%)
(9.6%)
29.9%
14.2%
28.4%
14.1%
20.3%
11.9%
33.7%
17.9%
32.5%
18.8%
7.6%
6.2%
8.7%
7.1%
13.1%
9.2%
11.4%
7.1%
12.9%
15.5%
24.6%
9.6%
26.8%
11.0%
33.8%
12.1%
36.9%
12.3%
n/a
n/a
13.7%
15.3%
25.4%
19.6%
22.2%
17.7%
36.3%
29.6%
n/a
n/a
15.0%
9.4%
13.7%
8.3%
12.9%
9.1%
14.4%
5.4%
8.1%
5.5%
FY2015
8.3%
8.7%
8.9%
6.8%
8.7%
6.7%
7.4%
6.7%
10.9%
8.3%
13.2%
9.0%
9.2%
6.6%
7.6%
5.3%
6.6%
5.1%
8.1%
5.8%
5.9%
3.1%
8.4%
6.0%
6.3%
6.1%
5.4%
3.9%
FY2017
9.4%
9.3%
9.4%
9.3%
9.8%
10.9%
9.2%
4.1%
10.3%
10.9%
9.7%
10.9%
9.7%
4.1%
Feb2019
7.8%
7.8%
7.9%
7.8%
8.1%
9.4%
7.9%
3.1%
8.3%
9.4%
8.3%
9.4%
7.7%
3.1%
FYTD
(1.0%)
1.8%
(1.1%)
1.9%
(2.3%)
(1.6%)
(4.9%)
(5.9%)
(5.1%)
(7.8%)
7.0%
7.1%
7.3%
7.1%
7.3%
8.5%
7.2%
2.9%
7.7%
8.5%
7.4%
8.5%
7.0%
2.9%
Rolling 12Months
5.3%
5.4%
5.6%
5.4%
5.4%
6.3%
5.2%
2.4%
6.0%
6.3%
5.3%
6.3%
5.1%
2.4%
FY2018
FY2016
5.7%
6.0%
6.3%
4.6%
6.3%
4.7%
5.5%
4.9%
6.4%
5.9%
7.5%
6.5%
7.4%
4.8%
NIA
AF
NSF
NIS
FH
ighe
st R
isk
Fund Name
Notes: 1) Performance is net of management fee and all expenses. The calculation of performance does not include cost of front-end load. The performance reported is based on dividend reinvestment (gross of with-holding tax where applicable). 2) Tax credit also available as per section 62 of the Income Tax Ordinance, 2001. 3) Taxes apply.
n/a = Not applicable. Asset Manager Rating: AM1 by PACRA (Very High Quality)
NAFA Government Securities Liquid Fund
Benchmark
NAFA Money Market Fund
Benchmark
NAFA Savings Plus Fund
Benchmark
NAFA Riba Free Savings Fund
Benchmark
NAFA Financial Sector Income Fund
Benchmark
NAFA Income Opportunity Fund
Benchmark
NAFA Islamic Income Fund
Benchmark
Page 01
NBP FUNDSManaging Your Savings

Robust corporate earnings growth to propel stock market in CY19 and CY20
Page 02
NBP FUNDSManaging Your Savings
Disclaimer: This publication is for informational purpose only and nothing herein should be construed as a solicitation, recommendation or an offer to buy or sell the fund. All investments in mutual funds and pension funds are subject to market risks. The price of units may go up as well as down. Past Performance is not necessarily indicative of future results.
Economic Outlook:Two months into 2019, the benchmark KSE-100 Index is up by around 5.4% after witnessing a decline of around 8% during CY18 that came on the heels of a 15% correction in CY17. Lackluster performance of the stock market in the previous two years is attributable mainly to a relatively week corporate earnings growth amid challenging economic conditions emanating from burgeoning Current Account Deficit (CAD) along with lumpy external debt repayments. It resulted in drop of SBP forex reserves from USD 18.1 billion at the start of FY2017 to a paltry USD 8.0 billion currently. The precarious situation prompted the incumbent government to pursue tightening policies including PKR devaluation, monetary policy tightening, and levying and expanding the import duties with the aim to contain domestic consumption. Because of these measures, we have seen a drop in key import heads; however no meaningful compression in overall import numbers in 7MFY19 was visible due to higher global oil prices. Encouragingly, from a peak of around USD 2.1 billion in July 2018, CAD has dropped to USD 0.8 billion in January 2019 and we expect this improvement to sustain in the coming months as well owing to aforementioned tightening measures and slightly lower oil prices. The government has also made great stride in arranging external financing from friendly countries to alleviate pressure on foreign reserves while reportedly negotiations with the IMF are also in its final stages. While the media reports of still stringent conditions by the IMF seem to be the stumbling block but the need for long-standing structural reforms cannot be overemphasized to put the economy on a sustainable growth path and regain macroeconomic stability.
GDP growth is expected to decelerate to around 3% in FY2019 due to dismal performance of manufacturing and agriculture sectors driven by significant monetary tightening, large cut in development spending, and rising cost of doing business as a result of a hefty PKR devaluation and upward adjustments in utility prices. While the Real Effective Exchange Rate (REER) as per the latest data point is now near its equilibrium value, significantly low level of Foreign Exchange Reserves in terms of import cover still necessitates additional PKR devaluation in our view, in order to further curb the trade deficit.
So far, average inflation for 8-month FY 2019 has risen to 6.5% as a result of a large 26% PKR devaluation during CY2018 and higher utility & transportation related costs. We foresee inflation to further rise as government still has to raise utility tariffs in order to reduce subsidy burden while Petroleum products prices may also be raised to generate additional revenues. Average inflation for FY20 is expected to rise to around 9.7% and monthly inflation is likely to peak near 11% in 1HFY20, before gradually tapering off in 2HFY20. After a hefty 4.5% rise in interest rates during the ongoing monetary tightening cycle, the Discount Rate has risen to 10.75%. We expect around 100bps increase in interest rates henceforth as real interest rates would remain in positive territory even after accounting for upward trajectory of inflation and also because of implication of high interest rates for the fiscal side. Expected fall in inflation in second half of FY20 makes a case for decline in interest rates in late FY20.
Stock Market Outlook: From the valuation perspective, the market is trading at an attractive Price-to-Earnings (P/E) multiple of 7.8 times. Led by the Index heavy weight Oil and Gas Exploration & Production, Banking, and Fertilizer sectors; we expect a healthy double-digit corporate earnings growth for 2019 and 2020. There is ample local liquidity sitting on the sidelines, awaiting clarity on the economic policy front. We believe that given attractive valuations, subsiding risks of sharp currency devaluation, and improving external account position; the market would regain its luster for foreign investors post entry into the IMF program. We advise our investors to hold their position in the stock market unfazed by the periodic volatility spikes, keeping their investment objective in mind as the market holds potential to deliver a healthy return in CY19 and CY20.
2.8 4.9
12.6
19.0
13.4
9.3
1.0%1.7%
4.2%
6.1%
4.8%
3.3%
0.0%
1.0%
2.0%
3.0%
4.0%
5.0%
6.0%
7.0%
-
5.0
10.0
15.0
20.0
FY20
15
FY20
16
FY20
17
FY20
18
FY20
19f
FY20
20f
CAD (USD Bn) CAD as a % of GDP
Source: SBP, NBP Funds Research
Current account deficit to witness a sharp fall ifoil prices remain at current level
1.7
1.3
1.2
1.9 2.0
2.0 2.
10.
61.
21.
21.
21.
50.
8 1.0
0.9
0.8 1.
0 1.1
1.0
0.9
0.8
0.7 0.8 0.8
0.0
0.5
1.0
1.5
2.0
2.5Ja
n-18
Feb-
18M
ar-1
8Ap
r-18
May
-18
Jun-
18Ju
l-18
Aug-
18Se
p-18
Oct
-18
Nov-
18De
c-18
Jan-
19Fe
b-19
Mar
-19
Apr-
19M
ay-1
9Ju
n-19
Jul-1
9Au
g-19
Sep-
19O
ct-1
9No
v-19
Dec-
19
Monthly Current Account Deficit (USD Bln)
Source: SBP, NBP Funds Research

Capital Market Review
Page 03
NBP FUNDSManaging Your Savings
Disclaimer: This publication is for informational purposes only and nothing herein should be construed as a solicitation, recommendation or an offer to buy or sell any fund. All investments in mutual funds are subject to market risks. The price of units may go up as well as down. Past performance is not necessarily indicative of future results. Please read the Offering Documents to understand the investment policies and the risks involved.
February 2019
After a sharp recovery of 10% during January, the market lost momentum as investors’ attention shifted to the challenging economic outlook with the benchmark KSE 100 Index suffering a decline of 4.3% on a month-on-month basis. The deadly attack in Indian occupied Kashmir overshadowed much awaited historic visit of Crown Prince of Saudi Arabia during which MoUs of investments worth USD20 billion were signed. Furthermore, the ongoing corporate results season with many big names missing even the subdued expectations in terms of profitability and payout also weighed on investors’ sentiment. Mounting risk of military conflict with the neighbouring India over alleged involvement of Pakistan backed militant group in the Pulwama attack and subsequent counter Air strikes by the two nations also stoked volatility in the market. The market recovered some losses as tension diffused with the involvement of global community and goodwill gesture shown by the PM Imran Khan by announcing the release of captured Indian pilot. The most noteworthy development on the economic front of the month was a sharp decline in the Current Account Deficit that clocked in at USD0.8 billion for January 2019 versus USD 1.5 billion in the preceding month. The market participants are still uncertain about the timing and conditions of the financing package from the IMF with its implications for the economy and corporate profitability.
During the month, Auto Parts & Accessories, Cement, Banks, Fertilizer, Oil & Gas Exploration, Paper & Board, and Textile Composite sectors performed better than the market whereas, Automobile Assembler, Chemical, Engineering, Oil & Gas Marketing Companies, Pharmaceuticals, Power Generation & Distribution, Refinery, and Technology & Communication sectors lagged behind. During February, Foreign Investors remained net buyers in the market, accumulating fresh positions to the tune of USD 32 million. Similarly, Insurance Companies and Banks/DFIs emerged as large buyers in the market, with net buying of USD 11 million and USD 9 million, respectively. On the other hand, Mutual Funds, Broker Proprietary Trading, and Companies sold positions worth USD 37 million, USD 10 million, and USD 5 million, respectively.
Going forward, we reiterate our view that the stock market would take direction from development on the policy front for addressing vulnerabilities in the external account. From the valuation standpoint, currently the market is trading at an attractive forward Price-to-Earnings (P/E) multiple of 7.8. There is abundant local liquidity ready to enter the market, awaiting policy clarity. We expect net foreign buying during the year against unabated foreign portfolio outflows during the last three years. Taken together, we expect the market to post a healthy return during CY19.
After recording 7.2% YoY in January 2019, inflation as measured by CPI for February 2019 clocked in at 8.2%. We expect inflation to remain on the upward trajectory and peak near 11% during 1HFY20 as a result of pass-through of measured currency devaluation, hike in utility prices and rising transportation cost. We also expect incessant government borrowing from the banking system to continue to feed inflationary pressure. Consequently, we expect an additional 100 bps increase in interest rates during the ongoing monetary tightening cycle. SBP’s net liquid foreign exchange reserves remained stable during February at around USD 8.0 billion compared to USD 8.2 billion in January.
During the outgoing month, SBP held two T-Bill auctions with a combined target of Rs. 2.10 trillion against the maturity of Rs. 2.07 trillion. In the first T-Bill auction, an amount of Rs. 2.13 trillion was accepted at a cut-off yield of 10.55% and 10.60% for 3-month and 6-month tenors, respectively. In the second T-Bill auction, an amount of Rs. 489 billion was realized wherein cut-off yield was maintained at 10.55% for 3-month tenor. In the PIB auction, bids worth around Rs. 233 billion were realized for 3-year, 5-year and 10-year at a cut-off yield of 12.15%, 12.50% and 12.85%, respectively. The bid pattern was skewed towards 3-year tenor. Furthermore, SBP in the recent floating rate PIB auction dated 20-Feb-19 attracted bids worth Rs. 165 billion. Out of the total bids, around Rs. 89 billion was realized at a cut-off margin of 70 basis points over the benchmark (i.e. weighted average yield of the 06-month Market Treasury Bills).
We have calibrated the portfolio of our money market and income funds based on our interest rate outlook and remain alert to any developments that may influence our investment strategy.
Stock Market Review
Money Market Review

NAFA Government Securities Liquid Fund (NGSLF)
Disclaimer: This publication is for informational purposes only and nothing herein should be construed as a solicitation, recommendation or an offer to buy or sell any fund. All investments in mutual funds are subject to market risks. Past performance is not necessarily indicative of future results. Please read the Offering Document to understand investment policies and the risks involved.
Dr. Amjad Waheed, CFASajjad Anwar, CFA
Muhammad Ali Bhabha, CFA, FRMHassan Raza, CFA
February 2019
28-Feb-19Asset Allocation (% of Total Assets)
Sindh Workers' Welfare Fund (SWWF)
69.7%29.0%1.3%
100.0%Nil
31-Jan-19
36.1%62.9%1.0%
100.0%Nil
T-Bills Bank Deposits Others including receivables Total Leverage
Unit Price (28/02/2019): Rs. 10.1673
Launch Date: May 15, 2009 Fund Size: Rs. 2,280 million Type: Open-end – Money Market FundDealing Days: Daily – Monday to Saturday Dealing Time: (Mon - Thr) 9:00 A.M to 5:00 P.M (Friday) 9:00 A.M to 5:30 P.M (Saturday) 9:00 A.M to 1:00 P.M Settlement: 2-3 business days Pricing Mechanism: Forward Pricing Load: Front end: 0%, Back end: 0% Management Fee: 8% of Net Income (Min 0.5% p.a., Max 1.0% p.a.) Total Expense Ratio: 1.23% p.a. (including 0.32% government levies)Risk Profile: Exceptionally Low Fund Stability Rating: "AAA (f)" by PACRA Listing: Pakistan Stock Exchange Custodian & Trustee: Central Depository Company (CDC) Auditors: Deloitte Yousuf Adil Chartered Accountants Benchmark:** 70% 3-Month PKRV & 30% average 3-Month deposit rates of three AA rated banks as selected by MUFAP Fund Manager: Muhammad Ali Bhabha, CFA, FRMMinimum Growth Unit: Rs. 10,000/- Subscription: Income Unit: Rs. 100,000/- Asset Manager Rating: AM1 by PACRA (Very High Quality)
The scheme has maintained provisions against Sindh Workers' Welfare Fund's liability to the tune of Rs. 16,403,770/-. If the same were not made the NAV per unit/last one year return of scheme would be higher by Rs. 0.0731/0.77%. For details investors are advised to read note 8.1 of the financial statements of the Scheme for the period ended December 31, 2018.
The Fund earned an annualized return of 9.4% p.a. during February 2019 versus the Benchmark return of 9.3% p.a. The return generated by the Fund is net of management fee and all other expenses.
NGSLF's stability rating is 'AAA (f)' awarded by PACRA. NGSLF is the largest Fund in Pakistan with this rating. The rating reflects exceptionally strong credit and liquidity profile of the Fund. Average daily allocation for the last 365 days in short-term T-Bills was 80% of net assets. While at the end of the month, T-Bills comprised around 70% of the Total Assets and around 73% of Net Assets. Weighted average time to maturity of the Fund is 51 days.
We will rebalance the allocation of the Fund proactively based on the capital market outlook.
To generate optimal return with minimum risk, to provide easy liquidity and reasonable income to its unit holders by investing primarily in short-term Government Securities.
* Annualized Return Based on Morning Star Methodology All other returns are Annualized Simple Return
The performance reported is net of management fee & all other expenses and based ondividend reinvestment gross of with-holding tax where applicable.
Performance Period
Performance %Feb2019
9.4%
9.3%
FYTD2019
7.8%
7.8%
7.0%
7.1%
FY2016
5.7%
6.0%
FY2017
7.6%
5.3%
FY2018
5.3%
5.4%
8.1%
8.6%
FY2014
8.3%
8.7%
FY2015
6.7%
5.9%
Last 3years*
7.0%
6.7%
Last 5years*
8.5%
8.4%
Since LaunchMay 15, 2009*
NAFA Government Securities Liquid Fund
Benchmark**
Notes: 1) The calculation of performance does not include cost of front end load. 2) Taxes apply. Further, tax credit also available as per section 62 of the Income Tax Ordinance, 2001.
Credit Quality of the Portfolio as of February 28, 2019 (% of Total Assets)
T-Bills (AAA rated)AAAAA+AAAA-A-Others including receivablesTotal
69.7%0.7%27.9%0.1%0.1%0.2%1.3%
100.0%
** effective from September 01, 2016; previously 70% 3-Month T-Bills & 30% average 3-Month depositrates (AA & above rated banks)
Rolling12 months
Page 04
NBP FUNDSManaging Your Savings

NAFA Money Market Fund (NMMF)
Disclaimer: This publication is for informational purposes only and nothing herein should be construed as a solicitation, recommendation or an offer to buy or sell any fund. All investments in mutual funds are subject to market risks. Past performance is not necessarily indicative of future results. Please read the Offering Document to understand investment policies and the risks involved.
February 2019
To provide stable income stream with preservation of capital by investing in
AA and above rated banks and money market instruments.
The Fund earned an annualized return of 9.4% p.a. during February 2019 versus the Benchmark return of 9.3% p.a. Since its launch in February 2012, the Fund has outperformed its Benchmark by 1.5% p.a. by earning an annualized return of 7.7% p.a. This outperformance is net of management fee and all other expenses.
Being a money market scheme, the Fund has very restrictive investment guidelines. The authorized investments of the Fund include T-Bills, Bank Deposits and Money Market instruments. Minimum eligible rating is AA, while the Fund is not allowed to invest in any security exceeding six months maturity. The weighted average time to maturity of the Fund cannot exceed 90 days. The Fund is rated AA(f) by PACRA which denotes a very strong capacity to maintain relative stability in returns and very low exposure to risks.
Weighted average time to maturity of the Fund is 1 day. We will rebalance the allocation of the Fund proactively based on the capital market outlook.
Unit Price (28/02/2019): Rs. 9.8570MONTHLY REPORT (MUFAP's Recommended Format)
Launch Date: February 23, 2012Fund Size: Rs. 20,136 millionType: Open-end – Money Market FundDealing Days: Daily – Monday to SaturdayDealing Time: (Mon - Thr) 9:00 A.M to 5:00 P.M (Friday) 9:00 A.M to 5:30 P.M (Saturday) 9:00 A.M to 1:00 P.MSettlement: 2-3 business daysPricing Mechanism: Forward PricingLoad:*** Front End Load (Individual): without life insurance 0.5%, with life insurance 3% (Nil on investment above Rs. 26 million) Front End Load (Other): 0.5% (Nil on investment above Rs. 16 million) Back End Load: NILManagement Fee: 8% of Net Income (Min 0.5% p.a., Max 1.0% p.a.)Total Expense Ratio: 1.20% p.a. (including 0.32% government levies)Risk Profile: Very LowFund Stability Rating: "AA (f)" by PACRAListing: Pakistan Stock ExchangeCustodian & Trustee: Central Depository Company (CDC)Auditors: Deloitte Yousuf Adil Chartered AccountantsBenchmark:** 70% 3-Month PKRV & 30% average 3-Month deposit rates of three AA rated banks as selected by MUFAPFund Manager: Muhammad Ali Bhabha, CFA, FRMMinimum Growth Unit: Rs. 10,000/-Subscription: Income Unit: Rs. 100,000/-Asset Manager Rating: AM1 by PACRA (Very High Quality)
Bank Deposits Others including receivables Total Leverage
Asset Allocation (% of Total Assets)
Sindh Workers' Welfare Fund (SWWF)
99.1%0.9%
100.0%Nil
28-Feb-1999.2%0.8%
100.0%Nil
31-Jan-19
9.4%
9.3%
7.7%
6.2%
7.3%
7.1%
Feb2019
7.9%
7.8%
FYTD2019
6.3%
4.6%
6.6%
5.7%
Last 3years*
7.1%
5.9%
Last 5years*
8.2%
6.9%
FY2014
8.9%
6.8%
FY2015
FY2016
6.6%
5.1%
FY2017
5.6%
5.4%
FY2018
Since LaunchFebruary 23, 2012*
* Annualized Return Based on Morning Star Methodology All other returns are Annualized Simple Return
The performance reported is net of management fee & all otherexpenses and based on dividend reinvestment gross of with-holdingtax where applicable.
NAFA Money Market Fund
Performance Period
The scheme has maintained provisions against Sindh Workers' Welfare Fund's liability to the tune of Rs. 56,946,583/-. If the same were not made the NAV per unit/last one year return of scheme would be higher by Rs. 0.0279/0.30%. For details investors are advised to read note 8.2 of the financial statements of the Scheme for the period ended December 31, 2018.
Dr. Amjad Waheed, CFASajjad Anwar, CFA
Muhammad Ali Bhabha, CFA, FRMHassan Raza, CFA
Notes: 1) The calculation of performance does not include cost of front end load.2) Taxes apply. Further, tax credit also available as per section 62 of the Income Tax Ordinance, 2001.
Performance %
Credit Quality of the Portfolio as of February 28, 2019 (% of Total Assets)
AAAAA+A-Others including receivablesTotal
0.1%98.9%0.1%0.9%
100.0%
** effective from September 01, 2016; Previously 3-Month deposit rates (AA & above rated banks)*** effective from January 02 , 2017
Rolling12 months
Page 05
NBP FUNDSManaging Your Savings

NAFA Islamic Money Market Fund (NIMMF)
Disclaimer: This publication is for informational purposes only and nothing herein should be construed as a solicitation, recommendation or an offer to buy or sell any fund. All investments in mutual funds are subject to market risks. Past performance is not necessarily indicative of future results. Please read the Offering Document to understand investment policies and the risks involved.
February 2019
To provide competitive return with maximum possible capital preservation by
investing in low risk and liquid Shariah Compliant authorized instruments.
The Fund generated an annualized return of 8.5% p.a. for the month of February 2019 versus the Benchmark return of 3.6% p.a., thus registering an outperformance of 4.9% p.a. This reported return is net of management fee and all other expenses.
The fund aims to consistently provide better return than the profit rates offered by Islamic Banks / Islamic windows of commercial banks. Minimum eligible rating is AA, while the Fund is not allowed to invest in any security exceeding six months maturity. The weighted average time to maturity of the Fund cannot exceed 90 days, thus providing easy liquidity along with a high quality credit profile.
Around 100% of net assets of the Fund are invested in bank deposits which enhances the liquidity profile of the Fund. The weighted average time to maturity of the Fund is 1 day.
We will rebalance the allocation of the Fund proactively based on the capital market outlook.
Unit Price (28/02/2019): Rs. 10.0048MONTHLY REPORT (MUFAP's Recommended Format)
Launch Date: February 28, 2018Fund Size: Rs. 1,223 millionFund Size (excluding Rs. 392 millioninvestment by Fund of Funds) Type: Open-end – Shariah Compliant Money Market FundDealing Days: Daily – Monday to SaturdayDealing Time: (Mon - Thr) 9:00 A.M to 5:00 P.M (Friday) 9:00 A.M to 5:30 P.M (Saturday) 9:00 A.M to 1:00 P.MSettlement: 2-3 business daysPricing Mechanism Forward PricingLoad: Front End Load: 0.5%Back End Load: NILManagement Fee: 1.00% p.a.Total Expense Ratio: 1.70% p.a (including 0.37% government levies)Risk Profile: Very LowFund Stability Rating: "AA (f)" by PACRAListing: Pakistan Stock ExchangeCustodian & Trustee: Central Depository Company (CDC)Auditors: Deloitte Yousuf Adil Chartered AccountantsBenchmark: Three months average deposit rates of three (3) AA rated Islamic Banks or Islamic windows of Conventional Banks as selected by MUFAP.Fund Manager: Muhammad Ali Bhabha, CFA, FRMMinimum Growth Unit: Rs. 10,000/-Subscription: Income Unit: Rs. 100,000/-Asset Manager Rating: AM1 by PACRA (Very High Quality)
Bank Deposits Others including receivables Total Leverage
Asset Allocation (% of Total Assets)
Sindh Workers' Welfare Fund (SWWF)
98.5%1.5%
100.0%Nil
28-Feb-1998.7%1.3%
100.0%Nil
31-Jan-19
6.4%
2.8%
Since LaunchFebruary 28, 2018
8.5%
3.6%
Feb2019
7.2%
3.0%
FYTD2019
*Simple Annualized Return The performance reported is net of management fee & all other expensesand based on dividend reinvestment gross of with-holding tax where applicable.
NAFA Islamic Money Market Fund
Performance Period
The scheme has maintained provisions against Sindh Workers' Welfare Fund's liability to the tune of Rs. 1,772,307/-. If the same were not made the NAV per unit/since inception return of scheme would be higher by Rs. 0.0145/0.15%. For details investors are advised to read note 7 of the financial statements of the Scheme for the period ended December 31,2018.
Dr. Amjad Waheed, CFASajjad Anwar, CFA
Muhammad Ali Bhabha, CFA, FRMHassan Raza, CFA
Notes: 1) The calculation of performance does not include cost of front end load.2) Taxes apply. Further, tax credit also available as per section 62 of the Income Tax Ordinance, 2001.
Performance %*
Credit Quality of the Portfolio as of February 28, 2019 (% of Total Assets)
AAAAA+AAAA-A-Others including receivablesTotal
64.5%33.5%0.3%0.1%0.1%1.5%
100.0%
Note: Amount invested by fund of funds is Rs. 831 million
Page 06
NBP FUNDSManaging Your Savings

NAFA Government Securities Savings Fund (NGSSF)
Disclaimer: This publication is for informational purposes only and nothing herein should be construed as a solicitation, recommendation or an offer to buy or sell any fund. All investments in mutual funds are subject to market risks. Past performance is not necessarily indicative of future results. Please read the Offering Document to understand investment policies and the risks involved.
* Annualized Return Based on Morning Star Methodology All other returns are Annualized Simple Return
The performance reported is net of management fee & all other expensesand based on dividend reinvestment gross of with-holding tax where applicable.
Dr. Amjad Waheed, CFASajjad Anwar, CFA
Muhammad Ali Bhabha, CFA, FRMHassan Raza, CFA
February 2019
Asset Allocation (% of Total Assets)
Sindh Workers' Welfare Fund (SWWF)
74.7%25.0%0.3%
100.0%Nil
28-Feb-194.9%2.2%
92.9%100.0%
Nil
31-Jan-19T-Bills Bank Deposits Others including receivables Total Leverage
Unit Price (28/02/2019): Rs. 10.8256
Launch Date: July 10, 2014 Fund Size: Rs. 1,702 million Type: Open-end – Income Fund Dealing Days: Daily – Monday to Saturday Dealing Time: (Mon - Thr) 9:00 A.M to 5:00 P.M (Friday) 9:00 A.M to 5:30 P.M (Saturday) 9:00 A.M to 1:00 P.MSettlement: 2-3 business days Pricing Mechanism Forward Pricing Load:*** Front End Load (Individual): without life insurance 1%, with life insurance 3% (Nil on investment above Rs. 26 million) Front End Load (Other): 1% (Nil on investment above Rs. 16 million) Back End Load: NILManagement Fee: 5% of Net Income (min: 0.3% p.a., max: 1.0% p.a.) w.e.f. 10-Sep-18Total Expense Ratio: 1.43% p.a.(including 0.33% government levies)Risk Profile: Low Fund stability rating "AA- (f)" by PACRA Listing: Pakistan Stock ExchangeCustodian & Trustee: Central Depository Company (CDC) Auditors: KPMG Taseer Hadi & Co. Chartered AccountantsBenchmark:** 6-Month PKRV Fund Manager: Muhammad Ali Bhabha, CFA, FRM Minimum Growth Unit: Rs. 10,000/- Subscription: Income Unit: Rs. 100,000/- Asset Manager Rating: AM1 by PACRA (Very High Quality)
The scheme has maintained provisions against Sindh Workers' Welfare Fund's liability to the tune of Rs. 897,063/-. If the same were not made the NAV per unit/last one year return of scheme would be higher by Rs. 0.0057/0.06%. For details investors are advised to read note 8 of the financial statements of the Scheme for the period ended December 31, 2018.
To provide competitive return from portfolio of low credit risk by investing primarily in Government Securities.
During the month under review, the Fund generated an annualized return of 9.9% p.a. against the benchmark return of 10.6% p.a. Since its launch in July 2014, the Fund has generated an annualized return of 7.8% p.a. against the Benchmark return of 7.2% p.a., hence an outperformance of 0.6% p.a. This outperformance is net of management fee and all other expenses.
NAFA Government Securities Savings Fund (NGSSF) invests a minimum of 70% in Government Securities. The Fund invests a minimum 10% of its assets in less than 90 days T-Bills or saving accounts with banks, which enhances liquidity profile of the Fund.
As the asset allocation of the Fund shows, exposure in Government Securities was around 75% of the Total Assets and Net Assets at the end of the month. Last one year allocation in Government Securities was around 73% of net assets. The weighted average time-to-maturity of the Fund is 52 days.
We will rebalance the allocation of the Fund proactively based on the capital market outlook.
Performance Period
Performance %
7.8%
7.2%
Since LaunchJuly 10, 2014*
9.9%
10.6%
Feb2019
7.6%
9.2%
FYTD2019
6.9%
8.3%
Rolling12 months
5.8%
5.9%
6.5%
6.2%
FY2016
5.9%
6.7%
Last 3years*
NAFA Government Securities Savings Fund
Benchmark**
Notes: 1) The calculation of performance does not include cost of front end load.2) Taxes apply. Further, tax credit also available as per section 62 of the Income Tax Ordinance, 2001.
Credit Quality of the Portfolio as of February 28, 2019 (% of Total Assets)
Government Securities (AAA rated)AA-A+AA-Others including receivablesTotal
74.7%0.3%18.2%6.4%0.1%0.3%
100.0%
** effective from September 01, 2016; Previously 70% average 6-Month PKRV & 30% average 3-Month deposit rates (A+ & above rated banks)*** effective from January 02, 2017
FY2017
5.0%
6.2%
FY2018
Page 07
NBP FUNDSManaging Your Savings

NAFA Savings Plus Fund (NSPF)
Disclaimer: This publication is for informational purposes only and nothing herein should be construed as a solicitation, recommendation or an offer to buy or sell any fund. All investments in mutual funds are subject to market risks. Past performance is not necessarily indicative of future results.Please read the Offering Document to understand investment policies and the risks involved.
February 2019
Asset Allocation (% of Total Assets)
Sindh Workers' Welfare Fund (SWWF)
T-Bills Margin Trading System (MTS) Bank Deposits Others including receivables Total Leverage
5.9%10.2%82.2%1.7%
100.0%Nil
28-Feb-196.0%
16.0%77.0%1.0%
100.0%Nil
31-Jan-19
Unit Price (28/02/2019): Rs. 10.1505
Launch Date: November 21, 2009Fund Size: Rs. 397 millionType: Open-end – Income fundDealing Days: Daily – Monday to SaturdayDealing Time: (Mon - Thr) 9:00 A.M to 5:00 P.M (Friday) 9:00 A.M to 5:30 P.M (Saturday) 9:00 A.M to 1:00 P.MSettlement: 2-3 business daysPricing Mechanism: Forward PricingLoad:*** Front End Load (Individual): without life insurance 0.5%, with life insurance 3% (Nil on investment above Rs. 26 million) Front End Load (Other): 0.5% (Nil on investment above Rs. 16 million) Back End Load: NILManagement Fee: 7% of Net Income (min: 0.5% p.a., max: 1.50% p.a.) w.e.f 10-Sep-18 Total Expense Ratio: 2.18% p.a. (including 0.35% government levies)Selling & Marketing expenses: 0.4% p.a.Risk Profile: Very LowFund Stability Rating: "AA- (f)" by PACRAListing: Pakistan Stock ExchangeCustodian & Trustee: Central Depository Company (CDC)Auditors: KPMG Taseer Hadi & Co. Chartered Accountants Benchmark:** 6-Month KIBOR Fund Manager: Muhammad Ali Bhabha, CFA, FRMMinimum Growth Unit: Rs. 1,000/-Subscription: Income Unit: Rs. 100,000/-Asset Manager Rating: AM1 by PACRA (Very High Quality)
The scheme has maintained provisions against Sindh Workers' Welfare Fund's liability to the tune of Rs. 1,819,242/-. If the same were not made the NAV per unit/ last one year return of scheme would be higher by Rs. 0.0465/0.49%. For details investors are advised to read note 12.1 of the financial statements of the Scheme for the period ended December 31, 2018.
To minimize risk, preserve capital and generate a reasonable return along with a high degree of liquidity from a portfolio primarily constituted of bank deposits and money market instruments.
The Fund earned an annualized return of 9.8% p.a. during the month versus the Benchmark return of 10.9% p.a. Since its launch in November 2009, the Fund has offered an annualized return of 8.4% p.a. against the Benchmark return of 7.1% p.a., hence an outperformance of 1.3% p.a. This outperformance is net of management fee and all other expenses.
The Fund is allowed to invest in Government Securities up to a maximum maturity of 3 years and also in debt securities with rating of A and above with a maximum remaining maturity of 1 year. The Fund invests 25% of its net assets in less than 90 days T-Bills or saving accounts with banks, which further enhances liquidity profile of the Fund.
The portfolio of NSPF is invested in Treasury bills, MTS and bank deposits etc. The allocation in MTS is around 11% of net assets. The weighted average time to maturity of the entire Fund is around 11 days. Our internal guidelines permit MTS financing in only fundamentally strong companies with lower volatility. It is pertinent to mention that in this asset class the Fund provides financing at only pre-determined rates of return with no direct exposure to the stock market.
We will rebalance the allocation of the Fund proactively based on the capital market outlook.
Dr. Amjad Waheed, CFASajjad Anwar, CFA
Muhammad Ali Bhabha, CFA, FRMHassan Raza, CFA
The performance reported is net of management fee & all other expenses and based ondividend reinvestment gross of with-holding tax where applicable.
* Annualized Return Based on Morning Star Methodology All other returns are Annualized Simple Return
Performance Period
Performance %Feb2019
9.8%
10.9%
FYTD2019
8.1%
9.4%
7.3%
8.5%
7.9%
7.1%
FY2014
8.7%
6.7%
FY2015
6.3%
4.7%
FY2016
8.1%
5.8%
FY2017
5.4%
6.3%
FY2018
7.0%
6.6%
Last 3years*
7.3%
6.4%
Last 5years*
8.4%
7.1%
Since LaunchNovember 21, 2009*
NAFA Savings Plus Fund
Benchmark**
Notes: 1) The calculation of performance does not include cost of front end load.2) Taxes apply. Further, tax credit also available as per section 62 of the Income Tax Ordinance, 2001.
Credit Quality of the Portfolio as of February 28, 2019 (% of Total Assets)
Govt. Securities (AAA rated)AAAAA+AAAA-A+AA-MTS (Unrated)Others including receivablesTotal
5.9%1.6%1.6%0.3%55.5%8.3%14.7%0.2%10.2%1.7%
100.0%
** effective from September 01, 2016; Previously Average 6-Month deposit rate (A & above rated banks)*** effective from January 02, 2017
Rolling12 months
Page 08
NBP FUNDSManaging Your Savings

NAFA Riba Free Savings Fund (NRFSF)
Disclaimer: This publication is for informational purposes only and nothing herein should be construed as a solicitation, recommendation or an offer to buy or sell any fund. All investments in mutual funds are subject to market risks. Past performance is not necessarily indicative of future results.Please read the Offering Document to understand investment policies and the risks involved.
Dr. Amjad Waheed, CFASajjad Anwar, CFA
Muhammad Ali Bhabha, CFA, FRMHassan Raza, CFA
February 2019
Commercial Paper (Islamic) Bank Deposits Others including receivables Total Leverage
18.3%80.2%1.5%
100.0%Nil
28-Feb-1920.0%79.0%1.0%
100.0%Nil
31-Jan-19Asset Allocation (% of Total Assets)
Sindh Workers' Welfare Fund (SWWF)
Unit Price (28/02/2019): Rs. 10.7235
Launch Date: August 20, 2010Fund Size: Rs. 5,836 millionType: Open-end – Shariah Compliant Income FundDealing Days: Daily – Monday to SaturdayDealing Time: (Mon - Thr) 9:00 A.M to 5:00 P.M (Friday) 9:00 A.M to 5:30 P.M (Saturday) 9:00 A.M to 1:00 P.MSettlement: 2-3 business daysPricing Mechanism: Forward PricingLoad:*** Front End Load (Individual): without life Takaful 0.5%, with life Takaful 3% (Nil on investment above Rs. 26 million) Front End Load (Other): 0.5% (Nil on investment above Rs. 16 million) Back End Load: NILManagement Fee: 7% of Net Income (min: 0.5% p.a., max: 1.25% p.a.) w.e.f 10-Sep-18Total Expense Ratio: 1.55% p.a.(including 0.33% government levies)Selling & Marketing expenses: 0.4% p.a. Risk Profile: Very LowFund Stability Rating: "A(f)" by PACRAListing: Pakistan Stock ExchangeCustodian & Trustee: Central Depository Company (CDC)Auditors: Deloitte Yousuf Adil Chartered AccountantsBenchmark:** 6-month average deposit rates of three A rated Islamic Banks/Islamic windows of conventional banks as selected by MUFAPFund Manager: Muhammad Ali Bhabha CFA,FRMMinimum Growth Unit: Rs. 10,000/-Subscription: Income Unit: Rs. 100,000/-Asset Manager Rating: AM1 by PACRA (Very High Quality)
To provide preservation of capital and earn a reasonable rate of return along with a high degree of liquidity by investing in short-term Shariah Compliant banks and money market / debt securities.
The Fund generated an annualized return of 9.2% p.a. for the month of February 2019 versus the Benchmark return of 4.1% p.a., thus registering an outperformance of 5.1% p.a. This reported return is net of management fee and all other expenses.
The Fund aims to consistently provide better return than the profit rates offered by Islamic Banks / Islamic windows of commercial banks, while also providing easy liquidity along with a high quality credit profile. The Fund is allowed to invest in short-term Shariah Compliant money market securities of up to six months maturity rated AA- or better. The Fund is not authorized to invest in corporate debt securities and Equities.
Around 83% of net assets of the portfolio are invested in bank deposits which enhance the liquidity profile of the Fund. The weighted average time to maturity of the Fund is 14 days.
We will rebalance the allocation of the Fund proactively based on the capital market outlook.
The scheme has maintained provisions against Sindh Workers' Welfare Fund's liability to the tune of Rs. 10,426,134/-. If the same were not made the NAV per unit/last one year return of scheme would be higher by Rs. 0.0192/0.19% For details investors are advised to read note 10.1 of the financial statements of the Scheme for the period ended December 31, 2018.
* Annualized Return Based on Morning Star Methodology All other returns are Annualized Simple Return
The performance reported is net of management fee & all other expenses and based on dividend reinvestment gross of with-holding tax where applicable.
Performance Period
Performance %Feb2019
9.2%
4.1%
FYTD2019
7.9%
3.1%
7.2%
2.9%
7.4%
6.7%
FY2014
7.8%
6.7%
FY2015
5.9%
3.1%
FY2017
5.2%
2.4%
FY2018
5.5%
4.9%
FY2016
6.1%
3.1%
Last 3years*
6.4%
4.3%
Last 5years*
7.7%
5.7%
Since LaunchAugust 20, 2010*
NAFA Riba Free Savings Fund
Benchmark**
Notes: 1) The calculation of performance does not include cost of front end load. 2) Taxes apply. Further, tax credit also available as per section 62 of the Income Tax Ordinance, 2001.
Credit Quality of the Portfolio as of February 28, 2019 (% of Total Assets)
AAAAAAA-A-Others including receivablesTotal
0.1%8.8%41.0%48.6%1.5%
100.0%** effective from September 01, 2016; Previously Average 6-month deposit rate of A- and above rated Islamic Banks*** effective from January 02, 2017
Rolling12 months
Page 09
NBP FUNDSManaging Your Savings

NBP Aitemaad Mahana Amdani Fund (NAMAF)
Disclaimer: This publication is for informational purposes only and nothing herein should be construed as a solicitation, recommendation or an offer to buy or sell any fund. All investments in mutual funds are subject to market risks. Past performance is not necessarily indicative of future results. Please read the Offering Document to understand investment policies and the risks involved.
*Simple Annualized Return The performance reported is net of management fee & all other expenses and basedon dividend reinvestment gross of with-holding tax where applicable.
Launch Date: October 06, 2018Fund Size: Rs. 1,814 millionType: Open-end – Shariah Compliant Income FundDealing Days: Daily – Monday to SaturdayDealing Time: (Mon - Thr) 9:00 A.M to 5:00 P.M (Friday) 9:00 A.M to 5:30 P.M (Saturday) 9:00 A.M to 1:00 P.MSettlement: 2-3 business daysPricing Mechanism Forward PricingLoad: Front End Load : without life takaful 0-1%, with life takaful(amount upto Rs.5 million) 0- 3%, with life takaful(amount over & above Rs.5 million) 0-1% Back End Load: NILManagement Fee: 7% of Net Income (min: 0.5% p.a., max: 1.5% p.a.)Total Expense Ratio: 1.58% p.a. (including 0.36% government levies)Risk Profile: LowFund Stability Rating: ‘A(f)’ by PACRAListing: Pakistan Stock ExchangeCustodian & Trustee: Central Depository Company (CDC)Auditors: A. F. Ferguson & Co. Chartered AccountantsBenchmark: 6-month average deposit rates of three A rated Islamic Banks/Islamic windows of conventional banks as selected by MUFAPFund Manager: Muhammad Ali Bhabha, CFA, FRMMinimum Subscription Growth Unit: Rs. 10,000/- Income Unit: Rs. 100,000/-Asset Manager Rating: AM1 by PACRA (Very High Quality)
To provide monthly income to investors by investing in Shariah Compliant money market and debt avenues.
The Fund generated an annualized return of 9.5% in February 2019 versus the Benchmark return of 4.1% p.a., thus registering an outperformance of 5.4% p.a. This reported return is net of management fee and all other expenses.
The Fund aims to provide monthly income to investors by investing in Shariah Compliant money market and debt avenues. Minimum eligible rating is A-, while the Fund is allowed to invest with Islamic Banks, Islamic branches / windows of conventional banks, thus providing easy liquidity. The Fund is allowed to invest in Shariah Compliant Money Market instruments & debt securities rated A- or better. The Fund is not authorized to invest in Equities. The weighted average time to maturity of the Fund cannot exceed 4 years excluding government securities.
Around 96% of net assets of the Fund are invested in bank deposits which enhances the liquidity profile of the Fund. The weighted average time to maturity of the Fund is 4 days.
We will rebalance the allocation of the Fund proactively based on the capital market outlook.
February 2019
Since LaunchOctober 06, 2018
8.8%
3.4%
Feb 2019
9.5%
4.1%
NBP Aitemaad Mahana Amdani Fund
Performance Period
Commercial Paper (Islamic)Bank Deposits Others including receivables Total Leverage
3.2%95.6%1.2%
100.0%Nil
28-Feb-196.1%92.3%1.6%
100.0%Nil
31-Jan-19Asset Allocation (% of Total Assets)
Unit Price (28/02/2019): 10.0080
Notes: 1) The calculation of performance does not include cost of front end load.2) Taxes apply. Further, tax credit also available as per section 62 of the Income Tax Ordinance, 2001.
Dr. Amjad Waheed, CFASajjad Anwar, CFA
Muhammad Ali Bhabha, CFA, FRMHassan Raza, CFA
Credit Quality of the Portfolio as of February 28, 2019 (% of Total Assets)
AAAAAAA-A+A-Others including receivablesTotal
0.1%04%
46.6%0.5%51.2%1.2%
100.0%
The scheme has maintained provisions against Sindh Workers' Welfare Fund's liability to the tune of Rs. 343,169/-. If the same were not made the NAV per unit/since inception return of scheme would be higher by Rs. 0.0019/0.05%. For details investors are advised to read note 9.1 of the financial statements of the Scheme for the period ended December 31, 2018.
Sindh Workers' Welfare Fund (SWWF)
%*
NBP FUNDSManaging Your Savings
Page 10

Disclaimer: This publication is for informational purposes only and nothing herein should be construed as a solicitation, recommendation or an offer to buy or sell any fund. All investments in mutual funds are subject to market risks. Past performance is not necessarily indicative of future results. Please read the Offering Document to understand investment policies and the risks involved.
Dr. Amjad Waheed, CFASajjad Anwar, CFA
Muhammad Ali Bhabha, CFA, FRMHassan Raza, CFA
Launch Date: October 28, 2011 Fund Size: Rs. 4,070 Million Type: Open-end – Income Fund Dealing Days: Daily – Monday to Saturday Dealing Time: (Mon - Thr) 9:00 A.M to 5:00 P.M (Friday) 9:00 A.M to 5:30 P.M (Saturday) 9:00 A.M to 1:00 P.MSettlement: 2-3 business days Pricing Mechanism Forward Pricing Load:*** Front End Load (Individual): 1% (Nil on investment above Rs. 26 million) Front End Load (Other): 1% (Nil on investment above Rs. 16 million) Back End Load: NIL Management Fee: 7% of Net Income (min: 0.5% p.a., max: 1.5% p.a.) w.e.f 10-Sep-18 Total Expense Ratio: 1.64% p.a.(including 0.35% government levies)Selling & Marketing expenses: 0.4% p.a.Risk Profile: Low Fund stability rating ‘A+(f)’ by PACRA Listing: Pakistan Stock Exchange Custodian & Trustee: Central Depository Company (CDC)Auditors: KPMG Taseer Hadi & Co. Chartered AccountantsBenchmark:** 6-Month KIBOR Fund Manager: Muhammad Ali Bhabha, CFA, FRMMinimum Growth Unit: Rs. 10,000/- Subscription: Income Unit: Rs. 100,000/- Asset Manager Rating: AM1 by PACRA (Very High Quality)
To provide income enhancement and preservation of capital by investing in prime quality Financial Sector TFCs/Sukuks, Bank deposits and short-term money market instruments.
The Fund generated an annualized return of 10.3% p.a. in the month of February 2019 versus the Benchmark return of 10.9% p.a. Since its launch in October 2011, the Fund has generated an annualized return of 8.6% p.a. against the Benchmark return of 7.9% p.a., hence an outperformance of 0.7% p.a. This outperformance is net of management fee and all other expenses.
The Fund is unique as it invests a minimum 70% of its assets in Financial Sector (mainly banks) debt securities, instruments or deposits. Minimum entity rating of issuers of debt securities is “AA-“. This minimizes credit risk and at the same time enhances liquidity of the Fund. Duration of the overall portfolio cannot be more than one year. This minimizes interest rate or pricing risk. The Fund invests 25% of its net assets in less than 90 days T-Bills or saving accounts with banks, which further enhances liquidity profile of the Fund.
Exposure in TFCs was around 17% of net assets at the end of the month with average time to maturity of 4.1 years. The TFC portfolio of the Fund is predominantly floating rate linked to KIBOR. The weighted average time-to-maturity of the Fund is 0.7 year.
We will rebalance the allocation of the Fund proactively based on the capital market outlook.
TFCs Placement with Banks Bank Deposits Others including receivables Total Leverage
16.4%11.6%68.8%3.2%
100.0%Nil
28-Feb-1917.6%12.5%68.0%1.9%
100.0%Nil
31-Jan-19Asset Allocation (% of Total Assets)
Unit Price (28/02/2019): Rs. 10.6963
Top TFC (as at February 28, 2019) (% of Total Assets)
Sindh Workers' Welfare Fund (SWWF)
Name of TFCMCB Bank Limited 19-JUN-14 19-JUN-22JS Bank Limited 14-DEC-16 14-DEC-23Jahangir Siddiqui and Company Ltd. 18-Jul-17 18-Jul-22HBL TFC 19-FEB-16 19-FEB-26Jahangir Siddiqui and Company Ltd. 06-Mar-18 06-Mar-23Bank of Punjab Limited 23-APR-18 23-APR-28Jahangir Siddiqui and Company Ltd. 24-Jun-16 24-Jun-21Total
% of Total Assets5.4%2.8%2.5%2.4%1.8%1.2%0.3%
16.4%
The scheme has maintained provisions against Sindh Workers' Welfare Fund's liability to the tune of Rs. 7,854,801/-. If the same were not made the NAV per unit/last one year return of scheme would be higher by Rs. 0.0206/0.21%. For details investors are advised to read note 11.1 of the financial statements of the Scheme for the period ended December 31, 2018.
* Annualized Return Based on Morning Star Methodology All other returns are Annualized Simple Return
The performance reported is net of management fee & all other expenses and based ondividend reinvestment gross of with-holding tax where applicable.
Performance Period
Performance %Feb2019
10.3%
10.9%
FYTD2019
8.3%
9.4%
7.7%
8.5%
7.9%
8.9%
10.9%
8.3%
FY2014
FY2015
6.4%
5.9%
FY2016
8.4%
6.0%
FY2017
6.0%
6.3%
FY2018
7.3%
6.8%
Last 3years*
7.9%
7.2%
Last 5years*
8.6%
7.9%
Since LaunchOctober 28, 2011*
NAFA Financial Sector Income Fund
Benchmark**
Notes: 1) The calculation of performance does not include cost of front end load.2) Taxes apply. Further, tax credit also available as per section 62 of the Income Tax Ordinance, 2001.
NAFA Financial Sector Income Fund (NFSIF)
February 2019
Credit Quality of the Portfolio as of February 28, 2019 (% of Total Assets)
AAAAA+AAAA-A+AA-Others including receivablesTotal
5.8%7.1%0.1%24.5%37.6%21.6%0.1%3.2%
100.0%
** effective from September 01, 2016; Previously 70% 6-Month KIBOR & 30% average 3-Month deposit rates (A & above rated banks)***effective from January 02, 2017
Rolling12 months
Page 11
NBP FUNDSManaging Your Savings

NAFA Islamic Income Fund (NIIF)
Disclaimer: This publication is for informational purposes only and nothing herein should be construed as a solicitation, recommendation or an offer to buy or sell any fund. All investments in mutual funds are subject to market risks. Past performance is not necessarily indicative of future results. Please read the Offering Document to understand investment policies and the risks involved. The scheme holds certain non-compliant investments. Before making any investment decision, investors should review the latest monthly Fund Manager Report and Financial Statements. The reported returns may include provisioning and reversal of provisioning against some debt securities.
Details of Non-Compliant Investments
Particulars
New Allied Electronics (Sukuk I)
New Allied Electronics (Sukuk II)
K-Electric Limited
Total
SUKUK
SUKUK
CP/SUKUK
110,000,000
4,905,437
466,052,052
580,052,052
110,000,000
4,905,437
-
114,905,437
-
-
466,052,052
466,052,052
-
-
17.1%
17.1%
-
-
16.8%
16.8%
Type ofInvestment
Value of Investments
before Provision
Value of Investments
after Provision
% of Net
Assets
% ofGrossAssets
Provisionheld
General Information
Top Sukuk Holdings (as at February 28, 2019)
Name of the Members of Investment Committee
Sindh Workers' Welfare Fund (SWWF)
Investment Objective
Fund Manager Commentary
Dr. Amjad Waheed, CFASajjad Anwar, CFA
Muhammad Ali Bhabha, CFA, FRMHassan Raza, CFA
Asset Allocation (% of Total Assets)Sukuks GOP Ijara Sukuks - Govt. Backed Bank Deposits Commercial Papers (Islamic) Others including receivables Total Leverage
19.3%2.7%
46.6%30.2%1.2%
100.0%Nil
31-Jan-1928-Feb-1919.3%2.7%
46.8%30.0%1.2%
100.0%Nil
Launch Date: October 26, 2007Fund Size: Rs. 2,719 millionType: Open-end – Shariah Compliant Income FundDealing Days: Daily – Monday to FridayDealing Time: (Mon - Thr) 9:00 A.M to 5:00 P.M (Friday) 9:00 A.M to 5:30 P.MSettlement: 2-3 business daysPricing Mechanism: Forward PricingLoad:*** Front End Load (Individual): without life Takaful 1%, with life Takaful 3% (Nil on investment above Rs. 26 million) Front End Load (Other): 1% (Nil on investment above Rs. 16 million) Back End Load: NILManagement Fee: 7% of Net Income (min: 0.5% p.a., max: 1.0% p.a.) w.e.f. 10-Sep-18Total Expense Ratio: 1.55% p.a. (including 0.32% government levies)Selling & Marketing expenses: 0.4% p.a.Risk Profile: Low to MediumFund Stability Rating: "A-(f)" by PACRAListing: Pakistan Stock ExchangeCustodian & Trustee: Central Depository Company (CDC)Auditors: Deloitte Yousuf Adil Chartered AccountantsBenchmark:** 6-month average deposit rates of three A rated Islamic Banks/Islamic windows of conventional banks as selected by MUFAPFund Manager: Muhammad Ali Bhabha, CFA, FRMMinimum Growth Unit: Rs. 10,000/-Subscription: Income Unit: Rs. 100,000/-Asset Manager Rating: AM1 by PACRA (Very High Quality)
To earn a reasonable rate of return in a Shariah Compliant manner by investing in Shariah Compliant debt securities, money market instruments and bank deposits.
During the month under review, the Fund posted an annualized return of 9.7% p.a. as compared to the Benchmark return of 4.1% p.a., thus registering an outperformance of 5.6% p.a. This outperformance is net of management fee and all other expenses.
The allocation in corporate Sukuks stood at around 20% of the net assets. Around 48% of net assets of the portfolio are allocated in bank deposits. The higher allocation in bank deposits is due to better yields as compared to other authorized alternative investment avenues.
The weighted average Yield-to-Maturity (YTM) of the Sukuk portfolio is around 11% p.a. and weighted average time to maturity is 3.6 years. The weighted average time to maturity of the Fund is 0.9 year.
We will rebalance the allocation of the Fund proactively based on the capital market outlook.
Name of Sukuk
Pak Elektron Limited - Sukuk 19-FEB-18 19-MAY-19Dubai Islamic Bank - Sukuk 14-JUL-17 14-JUL-27Engro Polymer Chemical Ltd 11-JAN-19 11-JUL-26SHAKARGANJ FOODS 10-JUL-18 10-JUL-24ENGRO Fertilizer Limited 09-JUL-14 09-JUL-19K-Electric AZM Sukuk Limited -Total
% of Total Assets
5.3%4.7%3.6%3.6%1.2%0.9%19.3%
MONTHLY REPORT (MUFAP's Recommended Format)Unit Price (28/02/2019): Rs. 9.9878 February 2019
The scheme has maintained provisions against Sindh Workers' Welfare Fund's liability to the tune of Rs. 9,999,968/-. If the same were not made the NAV per unit/last one year return of scheme would be higher by Rs. 0.0367/0.39%. For details investors are advised to read note 7 of the financial statements of the Scheme for the period ended December 31, 2018.
* Annualized Return Based on Morning Star Methodology All other returns are Annualized Simple Return
The performance reported is net of management fee & all other expenses and based ondividend reinvestment gross of with-holding tax where applicable.
Performance Period
Performance %Feb2019
13.6%
6.5%
FY2014
FY2015
9.7%
4.1%
FYTD2019
7.7%
3.1%
7.0%
2.9%
9.2%
6.6%
FY2016
7.4%
4.8%
FY2017
5.4%
3.9%
FY2018
5.1%
2.4%
6.0%
3.3%
Last 3years*
7.9%
4.4%
Last 5years*
7.8%
5.7%
Last 10years*
6.6%
5.7%
Since Launch October 26, 2007*
NAFA Islamic Income Fund
Benchmark**
Notes: 1) The calculation of performance does not include cost of front end load.2) Taxes apply. Further, tax credit also available as per section 62 of the Income Tax Ordinance, 2001.
Credit Quality of the Portfolio as of February 28, 2019 (% of Total Assets)
GOP Ijarah Sukuk (AAA rated)AAAAA+AAAA-A+AA-Others including receivablesTotal
2.7%0.2%0.1%21.5%19.9%4.9%3.6%45.9%1.2%
100.0%
** effective from March 14, 2017; Previously 1-year average deposit rates of three A rated Islamic Banks/Islamic windows of conventional banks as selected by MUFAP*** effective from January 02, 2017
Rolling12 months
5 Years 19-MAR-14 19-MAR-19
Page 12
NBP FUNDSManaging Your Savings

NAFA Income Opportunity Fund (NIOF)
Disclaimer: This publication is for informational purposes only and nothing herein should be construed as a solicitation, recommendation or an offer to buy or sell any fund. All investments in mutual funds are subject to market risks. Past performance is not necessarily indicative of future results. Please read the Offering Document to understand investment policies and the risks involved. The scheme holds certain non-compliant investments. Before making any investment decision, investors should review the latest monthly Fund Manager Report and Financial Statements. The reported returns may include provisioning and reversal of provisioning against some debt securities.
General Information
Top Ten TFC/Sukuk Holdings (as at February 28, 2019)
Sindh Workers' Welfare Fund (SWWF)
Name of the Members of Investment Committee
Investment Objective
Fund Manager Commentary
Asset Allocation (% of Total Assets) 28-Feb-19
Dr. Amjad Waheed, CFASajjad Anwar, CFA
Muhammad Ali Bhabha, CFA, FRMHassan Raza, CFA
TFCs / Sukuks T-Bills Commercial Papers (Islamic) Placements with Banks MTS Bank Deposits Others including receivables Total Leverage
35.0%3.6%7.9%2.8%0.8%
46.6%3.3%
100.0%Nil
31-Jan-1933.6%3.5%7.6%2.7%3.3%
46.7%2.6%
100.0%Nil
Launch Date: April 21, 2006Fund Size: Rs. 5,295 millionType: Open-end – Income FundDealing Days: Daily – Monday to SaturdayDealing Time: (Mon - Thr) 9:00 A.M to 5:00 P.M (Friday) 9:00 A.M to 5:30 P.M (Saturday) 9:00 A.M to 1:00 P.MSettlement: 2-3 business daysPricing Mechanism: Forward PricingLoad:** Front End Load (Individual): 1% (Nil on investment above Rs. 26 million) Front End Load (Other): 1% (Nil on investment above Rs. 16 million)Management Fee: 8% of Net Income (min: 0.5% p.a., max: 1.0% p.a.) w.e.f 10-Sep-18Total Expense Ratio: 1.76% p.a.(including 0.36% government levies)Selling & Marketing expenses: 0.4% p.a.Risk Profile: LowFund Stability Rating: "A(f)" by PACRAListing: Pakistan Stock ExchangeCustodian & Trustee: Central Depository Company (CDC)Auditors: Deloitte Yousuf Adil Chartered AccountantsBenchmark: 6-Month KIBORFund Manager: Muhammad Ali Bhabha, CFA, FRMMinimum: Growth Unit: Rs. 10,000/-Subscription: Income Unit: Rs. 100,000/-Asset Manager Rating: AM1 by PACRA (Very High Quality)
To seek maximum possible preservation of capital and a reasonable rate of return via investing primarily in money market & debt securities having good credit rating and liquidity.
The Fund posted an annualized return of 9.7% p.a. in February 2019 as compared to the Benchmark return of 10.9% p.a. The reported return is net of management fee and all other expenses.
The weighted average time to maturity of the Fund is around 1.5 years. The Fund's sector allocation is fairly diversified with exposure to Banking, Financial Services and Fertilizer sectors. TFC portfolio of the Fund is predominantly floating rate linked to KIBOR. However, since TFCs prices may go up or down, therefore, only investors with medium-term investment horizon are advised to invest in this Fund.
We will rebalance the allocation of the Fund proactively based on the capital market outlook.
Name of TFCs / SukuksDawood Hercules Corp Ltd 16-NOV-17 16-NOV-22JS Bank Limited 14-DEC-16 14-DEC-23HBL TFC 19-FEB-16 19-FEB-26BANK ALFALAH LTD - V - REVISED 20-FEB-13 20-FEB-21Jahangir Siddiqui and Company Ltd. 06-Mar-18 06-Mar-23Bank of Punjab Limited 23-APR-18 23-APR-28Jahangir Siddiqui and Company Ltd. 18-Jul-17 18-Jul-22JS Bank Limited 29-DEC-17 29-DEC-24Javedan Corp Ltd. Suk 04-Oct-18 04-Oct-26Silk Bank Limited 10-Aug-17 10-Aug-25Total
8.9%5.5%3.6%3.0%2.8%2.7%1.9%1.8%1.8%1.6%33.6%
% of Total Assets
Details of Non-Compliant Investments
Particulars
AgriTech Limited I - Revised II 29-NOV-07 29-NOV-19
AgriTech Limited V 01-JUL-11 01-JAN-20
Azgard Nine Limited III (PP) - Revised 04-DEC-07 04-DEC-18
Azgard Nine Limited V (PPTFC Markup) 31-MAR-12 31-MAR-19
BRR Guardian Modaraba - Sukuk Revised II 07-JUL-08 07-APR-19
Dewan Cement Limited (Pre-IPO) 17-JAN-08 17-JAN-19
Eden House Limited - Sukuk Revised 29-MAR-08 29-SEP-19
New Allied Electronics Limited (PP) 15-MAY-07 15-NOV-18
New Allied Electronics Limited II - Sukuk 03-DEC-07 03-DEC-18
PACE Pakistan Limited - Revised 15-FEB-08 15-FEB-19
Saudi Pak Leasing Company Limited - Revised II 13-MAR-08 13-MAR-19
Worldcall Rs - III 10-APR-18 20-SEP-26
Azgard Nine Limited (Non-Voting Ordinary Shares)
Total
TFC
TFC
TFC
TFC
Sukuk
TFC
Sukuk
TFC
Sukuk
TFC
TFC
TFC
Equity
149,860,200
32,320,000
108,376,850
82,180,000
1,205,320
150,000,000
9,056,250
31,706,536
44,148,934
149,820,000
41,321,115
76,736,025
12,854
876,744,084
149,860,200
32,320,000
108,376,850
82,180,000
1,205,320
150,000,000
9,056,250
31,706,536
44,148,934
149,820,000
41,321,115
76,736,025
12,854
876,744,084
-
-
-
-
-
-
-
-
-
-
-
-
-
-
-
-
-
-
-
-
-
-
-
-
-
-
-
0.0%
-
-
-
-
-
-
-
-
-
-
-
-
-
0.0%
Type ofInvestment
Value of Investments
before Provision
Value of Investments
after Provision
% of Net
Assets
% ofGrossAssets
Provisionheld
MONTHLY REPORT (MUFAP's Recommended Format)Unit Price (28/02/2019): Rs. 10.9084 February 2019
The scheme has maintained provisions against Sindh Workers' Welfare Fund's liability to the tune of Rs. 25,603,905/-. If the same were not made the NAV per unit/last one year return of scheme would be higher by Rs. 0.0527/0.52%. For details investors are advised to read note 9.1 of the financial statements of the Scheme for the period ended December 31, 2018.
Notes: 1) The calculation of performance does not include cost of front end load. 2) Taxes apply. Further, tax credit also available as per section 62 of the Income Tax Ordinance, 2001.
Credit Quality of the Portfolio as of February 28, 2019 (% of Total Assets)
3.6%0.3%9.8%20.2%28.5%26.5%5.2%1.8%0.8%3.3%
100.0%
T-Bills (AAA rated)AAAAA+AAAA-A+AA-MTS (Un-rated)Others including receivablesTotal
** effective from January 02, 2017
* Annualized Return Based on Morning Star Methodology All other returns are Annualized Simple Return
The performance reported is net of management fee & all other expenses and based on dividend reinvestment gross of with-holding tax where applicable.
Performance Period
Performance %Feb2019
FY2015
13.2%
9.0%
FY2017
6.3%
6.1%
FY2018
5.3%
6.3%
FY2016
7.5%
6.5%
FY2014
16.6%
9.8%
9.7%
10.9%
FYTD2019
8.3%
9.4%
7.4%
8.5%
6.5%
6.9%
Last 3years*
9.0%
7.5%
Last 5years*
8.0%
9.7%
Last 10years*
8.0%
10.0%
Since LaunchApril 21, 2006 *
NAFA Income Opportunity Fund
Benchmark
Rolling12 months
Page 13
NBP FUNDSManaging Your Savings

NAFA Income Fund (NIF)
Disclaimer: This publication is for informational purposes only and nothing herein should be construed as a solicitation, recommendation or an offer to buy or sell any fund. All investments in mutual funds are subject to market risks. Past performance is not necessarily indicative of future results. Please read the Offering Document to understand investment policies and the risks involved. The scheme holds certain non-compliant investments. Before making any investment decision, investors should review the latest monthly Fund Manager Report and Financial Statements. The reported returns may include provisioning and reversal of provisioning against some debt securities.
Top TFC (as at February 28, 2019)
Sindh Workers' Welfare Fund (SWWF)
General Information
Name of the Members of Investment Committee
Details of Non-Compliant Investments
Investment Objective
Fund Manager Commentary
Asset Allocation (% of Total Assets) 28-Feb-19
Dr. Amjad Waheed, CFASajjad Anwar, CFA
Muhammad Ali Bhabha, CFA, FRMHassan Raza, CFA
Name of TFC / SukukAskari Commercial Bank Limited 30-SEP-14 30-SEP-24Jahangir Siddiqui and Company Ltd. 24-Jun-16 24-Jun-21Jahangir Siddiqui and Company Ltd. 18-Jul-17 18-Jul-22Jahangir Siddiqui and Company Ltd. 08-APR-14 08-APR-19Total
% of Total Assets3.9%2.6%2.1%0.5%9.1%
Particulars
AgriTech Limited II
AgriTech Limited V
Eden House Limited
New Allied Electronics Ltd
Saudi Pak Leasing Company Ltd
Worldcall Telecom Limited
149,875,800
22,180,000
19,687,500
49,054,371
41,321,115
23,873,430
305,992,216
149,875,800
22,180,000
19,687,500
49,054,371
41,321,115
23,873,430
305,992,216
-
-
-
-
-
-
-
-
-
-
-
-
-
-
-
-
-
-
-
-
-
TFC
TFC
SUKUK
SUKUK
TFC
TFC
Type ofInvestment
Value of Investments
beforeProvision
Value of Investments
after Provision
%of Net Assets
%of GrossAssets
Provisionheld
TFCs / Sukuks T-Bills MTS Commercial paper Placement with Banks Bank Deposits Others including receivables Total Leverage
9.1%3.1%1.7%4.2%9.8%
69.7%2.4%
100.0%Nil
31-Jan-199.1%3.1%6.3%4.2%9.8%
65.5%2.0%
100.0%Nil
Launch Date: March 28, 2008Fund Size: Rs. 933 millionType: Open-end – Income FundDealing Days: Daily – Monday to FridayDealing Time: (Mon - Thr) 9:00 A.M to 5:00 P.M (Friday) 9:00 A.M to 5:30 P.MSettlement: 2-3 business daysPricing Mechanism: Forward PricingLoad:** Front End Load (Individual): 1% (Nil on investment above Rs. 26 million) Front End Load (Other): 1% (Nil on investment above Rs. 16 million) Back End Load: NILManagement Fee: 7% of Net Income (min: 0.5% p.a., max: 1.0% p.a.) w.e.f. 10-Sep-18Total Expense Ratio: 1.96% p.a.(including 0.35% government levies)Selling & Marketing expenses: 0.4% p.a.Risk Profile: LowFund Stability Rating "A (f)" by PACRAListing: Pakistan Stock ExchangeCustodian & Trustee: Central Depository Company (CDC)Auditors: KPMG Taseer Hadi & Co. Chartered AccountantsBenchmark: 6-Month KIBOR Fund Manager: Muhammad Ali Bhabha, CFA, FRMMinimum Growth Unit: Rs. 10,000/-Subscription: Income Unit: Rs. 100,000/-Asset Manager Rating: AM1 by PACRA (Very High Quality)
To earn a competitive rate of return while preserving capital to the extent possible by investing in liquid assets.
The Fund posted an annualized return of 9.6% p.a. during February 2019 versus the Benchmark return of 10.9% p.a. The reported return is net of management fee and all other expenses.
Exposure in TFCs and Sukuks stands at around 9% of net assets. All TFCs in the Fund are floating rate instruments linked to KIBOR.
The weighted average time to maturity of the Fund is around 0.3 year. Potential recovery in fully provided TFCs (Face Value of around Rs. 306 million), is potential upside for the Fund. Thus, the Fund is expected to perform well over the medium to long term horizon. However, since TFCs prices may go up or down, therefore, only investors with medium term investment horizon are advised to invest in this Fund.
We will rebalance the allocation of the Fund proactively based on the capital market outlook.
MONTHLY REPORT (MUFAP's Recommended Format)Unit Price (28/02/2019): Rs. 10.3079 February 2019
The scheme has maintained provisions against Sindh Workers' Welfare Fund's liability to the tune of Rs. 3,770,982/-. If the same were not made the NAV per unit/last one year return of scheme would be higher by Rs. 0.0417/0.44%. For details investors are advised to read note 12.1 of the financial statements of the Scheme for the period ended December 31, 2018.
Notes: 1) The calculation of performance does not include cost of front end load.2) Taxes apply. Further, tax credit also available as per section 62 of the Income Tax Ordinance, 2001.
Credit Quality of the Portfolio as of February 28, 2019 (% of Total Assets)
Govt. Securities (AAA rated)AAAAA+AAAA-A+AA-MTS (Unrated)Others including receivablesTotal
3.1%0.1%5.4%4.2%58.6%7.5%16.9%0.1%1.7%2.4%
100.0%
** effective from January 02, 2017
* Annualized Return Based on Morning Star Methodology All other returns are Annualized Simple Return
The performance reported is net of management fee & all other expenses and based ondividend reinvestment gross of with-holding tax where applicable.
Performance Period
Performance %Feb2019
9.6%
10.9%
FYTD2019
8.5%
9.4%
7.6%
8.5%
2.3%
9.8%
FY2014
13.7%
9.0%
FY2015
6.5%
6.1%
FY2017
5.5%
6.3%
FY2018
6.9%
6.5%
FY2016
6.6%
6.9%
Last 3years*
7.1%
7.5%
Last 5years*
5.0%
9.6%
Last 10years*
4.5%
9.8%
Since LaunchMarch 28, 2008*
NAFA Income Fund
Benchmark
Rolling12 months
Page 14
NBP FUNDSManaging Your Savings

Disclaimer: This publication is for informational purposes only and nothing herein should be construed as a solicitation, recommendation or an offer to buy or sell any fund. All investments in mutual funds are subject to market risks. Past performance is not necessarily indicative of future results. Please read the Offering Documents to understand the investment policies and the risks involved.
Dr. Amjad Waheed, CFASajjad Anwar, CFA
Taha Khan Javed, CFAHassan Raza, CFA
Muhammad Ali Bhabha, CFA, FRM
Characteristics of Equity Portfolio****
NAAFKSE-30
PER7.67.9
PBV1.51.7
DY5.5%6.5%
**** Based on NBP Funds estimates
To generate income by investing in Debt & Money Market securities and to generate capital appreciation by investing in equity and equity related securities.
During the month under review, NAFA Asset Allocation Fund's (NAAF) unit price (NAV) decreased by 2.4%, whereas the Benchmark decreased by 2.1%, thus an underperformance of 0.3% was recorded. Since inception on August 20, 2010 the Fund has posted 15.0% p.a return, versus 9.4% p.a by the Benchmark. Thus, to date the outperformance of your Fund stands at 5.6% p.a. This outperformance is net of management fee and all other expenses.
NAAF started off the month with an allocation of around 69% in equities, which decreased to around 56% towards the end of the month. NAAF underperformed the Benchmark in February as the Fund was underweight in select Commercial Banks, and Cement sectors stocks which outperformed the market and overweight in select Engineering, Chemical, and Paper & Board sectors stocks which underperformed the market. During the month, the allocation was reduced primarily in Oil & Gas Exploration Companies, Chemical, Power Generation & Distribution Companies, and Fertilizer sectors.
Equities / Stocks Cash Bank Placements Others including receivables Total Leverage
55.9%31.7%10.1%2.3%
100.0%Nil
Launch Date: August 20, 2010Fund Size: Rs. 2,485 millionType: Open-end – Asset Allocation FundDealing Days: Daily – Monday to FridayDealing Time: (Mon - Thr) 9:00 A.M to 4:30 P.M (Friday) 9:00 A.M to 5:00 P.MSettlement: 2-3 business daysPricing Mechanism: Forward PricingLoad:*** Front End Load (Individual):3% (Nil on investment above Rs. 101 million) Front End Load (Other): 3% (Nil on investment above Rs. 50 million) Back End Load: NILManagement Fee: 2% per annum Total Expense Ratio (%) 3.22% p.a (including 0.37% government levies)Selling & Marketing Expenses 0.4% per annum Risk Profile: ModerateListing: Pakistan Stock ExchangeCustodian & Trustee: Central Depository Company (CDC)Auditors: Deloitte Yousuf Adil Chartered AccountantsBenchmark:** Daily weighted return of KSE-30 Total Return Index & 6-month KIBOR based on Fund's actual allocation.Fund Manager: Taha Khan Javed, CFAMinimum Growth Unit: Rs. 10,000/-Subscription: Income Unit: Rs. 100,000/-Asset Manager Rating: AM1 by PACRA (Very High Quality)
Asset Allocation (% of Total Assets) 28-Feb-1968.8%21.4%9.3%0.5%
100.0%Nil
31-Jan-19
Sindh Workers' Welfare Fund (SWWF)
Pak Petroleum LtdOil & Gas Dev Co LtdBank Al-Falah LtdFauji Fertilizer Co. LtdEngro Corporation LtdUnited Bank LtdBank AL-Habib Ltd Habib Bank LtdPakistan Oilfields Ltd Hub Power Company LtdTotal
EquityEquityEquityEquityEquityEquityEquityEquityEquityEquity
4.0%3.7%3.5%3.4%2.9%2.8%2.3%2.1%1.9%1.9%28.6%
% of TotalAssets
Top Ten Holdings (as on February 28, 2019)
The Scheme has maintained provisions against Sindh worker’s welfare Fund’s liability to the tune of Rs. 18,468,474/- if the same were not made the NAV Per unit/last one year return of the Scheme would be higher by Rs. 0.1165/0.73%. For details investors are advised to read the note 8 of the Financial Statements of the Scheme for the period ended December 31, 2018.
MONTHLY REPORT (MUFAP's Recommended Format)Unit Price (28/02/2019): Rs. 15.6731 February 2019
* Annualized Return All Other returns are Cumulative
The performance reported is net of management fee & all other expenses and based on dividend reinvestmentgross of with-holding tax where applicable.
Performance Period
Performance %Feb2019
(2.4%)
(2.1%)
FYTD2019
(1.0%)
1.8%
FY2017
29.9%
14.2%
FY2018
(6.8%)
(2.8%)
Rolling12 Months
(2.3%)
0.9%
24.6%
9.6%
FY2015
7.6%
6.2%
FY2016
13.7%
15.3%
FY2014
10.0%
6.9%
Last 3Years*
11.0%
6.8%
Last 5Years*
15.0%
9.4%
Since LaunchAugust 20, 2010*
NAFA Asset Allocation Fund
Benchmark**
Notes: 1) The calculation of performance does not include cost of front end load. 2) Taxes apply. Further, tax credit also available as per section 62 of the Income Tax Ordinance, 2001.
Top Five Sectors (% of Total Assets) (as on February 28, 2019)
Commercial BanksOil & Gas Exploration CompaniesFertilizerTextile CompositeOil & Gas Marketing CompaniesOthers
15.2%11.4%8.5%4.3%3.9%
12.6%
** effective from September 01, 2016; Previously 1/3 of average 3-month bank deposit rate; 1/3 of 6-month KIBOR; 1/3 of KSE 30 Index Total Return.*** effective from January 02, 2017
NAFA Asset Allocation Fund (NAAF) NBP FUNDSManaging Your Savings
Page 15
NAAF32.9%
Benchmark22.1%
Peers Avg.6.5%
-10.0%
10.0%
30.0%
50.0%
70.0%
29-F
eb-1
6
31-M
ay-1
6
31-A
ug-1
6
30-N
ov-1
6
28-F
eb-1
7
31-M
ay-1
7
31-A
ug-1
7
30-N
ov-1
7
28-F
eb-1
8
31-M
ay-1
8
31-A
ug-1
8
30-N
ov-1
8
28-F
eb-1
9
NAAF Benchmark Peers Avg.Annualized Return 10.0% 6.9% 1.9%Risk (Std. Deviation) 10.8% 10.8% 12.2%
Relative Performance of NAFA Asset Allocation Fund (NAAF)for the Last Three Years
Cum.Return

NAFA Islamic Asset Allocation Fund (NIAAF) NBP FUNDSManaging Your Savings
Page 16
Top Five Sectors (% of Total Assets) (as on February 28, 2019)
Oil & Gas Exploration Companies Fertilizer Cement Power Generation & Distribution Oil & Gas Marketing Companies Others
19.3%9.6%5.8%4.3%4.2%
13.6%
Disclaimer: This publication is for informational purposes only and nothing herein should be construed as a solicitation, recommendation or an offer to buy or sell any fund. All investments in mutual funds are subject to market risks.Past performance is not necessarily indicative of future results. Please read the Offering Documents to understand the investment policies and the risk involved. The scheme holds certain non-compliant investments. Before making any investment decision, investors should review the latest monthly Fund Manager Report and Financial statements. The reported return may include provisions and reversal of provisions against some debt securities.
‘s
February 2019
28-Feb-19Asset Allocation (% of Total Assets)
Sindh Workers' Welfare Fund (SWWF)
Top Ten Holdings (as on February 28, 2019)
Details of Non-Compliant Investments
Equities / Stocks Cash Others including receivables Total Leverage
56.8%41.6%1.6%
100.0%Nil
31-Jan-1969.1%30.3%0.6%
100.0%Nil
PER8.48.2
NIAAFPBV1.61.2
DY6.1%6.3%
Unit Price (28/02/2019): Rs. 15.1621
Launch Date: October 26, 2007Fund Size: Rs. 9,661 million Type: Open-end-Shariah Compliant -Asset Allocation FundDealing Days: Daily – Monday to FridayDealing Time: (Mon-Thr) 9:00 A.M to 4:30 P.M (Friday) 9:00 A.M to 5:00 P.MSettlement: 2-3 business daysPricing Mechanism: Forward PricingLoad:*** Front End Load (Individual): 3%, (Nil on investment above Rs. 101 million) Front End Load (Other): 3% (Nil on investment above Rs. 50 million) Back End Load: NILManagement Fee: 2% per annum Total Expense Ratio (%) 3.16% p.a (including 0.37% government levies)Selling & Marketing Expenses 0.4% per annum Risk Profile: Moderate Listing: Pakistan Stock ExchangeCustodian & Trustee: Central Depository Company (CDC)Auditors: Deloitte Yousuf Adil Chartered AccountantsBenchmark:** Daily weighted return of KMI-30 Index & 6-month average deposit rates of three A rated Islamic Banks/Islamic windows of conventional banks as selected by MUFAP, based on Fund's actual allocation.Fund Manager: Taha Khan Javed, CFAMinimum Growth Unit: Rs. 10,000/-Subscription: Income Unit: Rs. 100,000/-Asset Manager Rating: AM1 by PACRA (Very High Quality)
To generate capital appreciation by investing in Shariah Compliant equity and equity related securities and income by investing in Shariah Compliant bank deposits, debt & money market securities.
During the month under review, unit price (NAV) of NAFA Islamic Asset Allocation Fund (NIAAF) decreased by 1.9%, whereas the Benchmark decreased by 2.3%, thus an outperformance of 0.4% was recorded. Since inception your Fund has posted 12.9% p.a return, versus 9.1% p.a by the Benchmark. Thus, to-date the outperformance of your Fund stands at 3.8% p.a. This outperformance is net of management fee and all other expenses.
NIAAF started off the month with an allocation of around 69% in equities, which decreased to around 57% towards the end of the month. NIAAF outperformed the Benchmark in February as the Fund was underweight in select Oil & Gas Marketing Companies, Food & Personal Care Products, and Refinery sectors stocks which underperformed the market and overweight in select Commercial Banks, Glass & Ceramics, Technology & Communication, and Textile Composite sectors stocks which outperformed the market. During the month, the allocation was increased primarily in Commercial Banks sector, whereas it was reduced primarily in Chemical, Cement, Engineering, and Fertilizer sectors.
Pak Petroleum Ltd
Oil & Gas Dev Co Ltd
Engro Corporation Ltd
Engro Fertilizer Ltd
Pakistan Oilfields Ltd
Eden Housing (Sukuk II)
Total
4,921,875
4,921,875
4,921,875
4,921,875
-
-
-
-
Hub Power Company Ltd
Nishat Mills Ltd
Meezan Bank Ltd
Lucky Cement Ltd
Mari Petroleum Company Ltd
-
-
SUKUK
Equity
Equity
Equity
Equity
Equity
3.6%
3.5%
3.1%
2.7%
2.6%
Equity
Equity
Equity
Equity
Equity
6.6%
6.4%
5.7%
3.8%
3.7%
% of TotalAssets
% of TotalAssets
The Scheme has maintained provisions against worker’s welfare Fund’s liability to the tune of Rs. 60,862,274/- if the same were not made the NAV Per unit/return of the Scheme would be higher by Rs. 0.0955/0.60%. For details investors are advised to read the note 5 of the Financial Statements of the Scheme for the period ended December 31, 2018.
Dr. Amjad Waheed, CFASajjad Anwar, CFA
Muhammad Ali Bhabha, CFA, FRMTaha Khan Javed, CFA
Hassan Raza, CFA
* Annualized ReturnAll Other returns are Cumulative
The performance reported is net of management fee & all other expenses and based on dividendreinvestment gross of with-holding tax where applicable.
Performance Period
Performance %Feb2019
(1.9%)
(2.3%)
FYTD2019
(2.3%)
(1.6%)
(4.6%)
(2.6%)
22.2%
17.7%
FY2014
33.8%
12.1%
FY2015
13.1%
9.2%
FY2016
20.3%
11.9%
FY2017
(8.7%)
(3.6%)
FY2018
6.6%
4.8%
Last 3Years*
12.6%
6.7%
Last 5Years*
18.9%
14.7%
Last 10Years*
12.9%
9.1%
Since LaunchOctober 26, 2007*
Benchmark**
NAFA Islamic Asset Allocation Fund
Note:** Effective from September 01, 2016; Previously average of (i) average 3-month Islamic banks deposit rate (ii) 6-month KIBOR or its Shariah Compliant equivalent (iii) KMI 30 Index** KSE-30 is used as equity component for the Benchmark before June 30, 2008, the launch date of KMI-30 Index. The fund category was changed to Islamic Asset Allocationfrom Islamic Balanced with effect from April 22, 2014. Consequently, allowed equity range is now 0% to 90% which previously was 30% to 70%. Previous benchmark was50% KMI-30 Index & 50% Islamic Bank Deposit.
Notes: 1) The calculation of performance does not include cost of front end load.2) Taxes apply. Further, tax credit also available as per section 62 of the Income Tax Ordinance, 2001.
*** effective from January 02, 2017
Rolling12 Months
**** Based on NBP Funds estimates
NIAAF, 21.1%Benchmark **
15.3%
-10.0%
0.0%
10.0%
20.0%
30.0%
40.0%
50.0%
60.0%
29-F
eb-1
6
31-M
ay-1
6
31-A
ug-1
6
30-N
ov-1
6
28-F
eb-1
7
31-M
ay-1
7
31-A
ug-1
7
30-N
ov-1
7
28-F
eb-1
8
31-M
ay-1
8
31-A
ug-1
8
30-N
ov-1
8
28-F
eb-1
9
NIAAF Benchmark **Annualized Return 6.6% 4.8%Risk (Std. Deviation) 9.9% 9.9%
Relative Performance of NAFA Islamic Asset Allocation Fund (NIAAF)for the Last Three Years
Cum. Return

NBP Aitemaad Regular Payment Fund (NARPF) NBP FUNDSManaging Your Savings
Page 17
Disclaimer: This publication is for informational purposes only and nothing herein should be construed as a solicitation, recommendation or an offer to buy or sell any fund. All investments in mutual funds are subject to market risks.Past performance is not necessarily indicative of future results. Please read the Offering Documents to understand the investment policies and the risk involved.
*Cumulative Return [Returns are net of management fee & all other expenses]
Launch Date: October 31, 2018Fund Size: Rs. 119 millionType: Open-end – Shariah Compliant Asset Allocation FundDealing Days: Daily – Monday to FridayDealing Time: (Mon - Thr) 9:00 A.M to 4:30 P.M (Friday) 9:00 A.M to 5:00 P.MSettlement: 2-3 business daysPricing Mechanism Forward PricingLoad:*** Front end: 3.0% Back end: NilManagement Fee: 2% p.a. (currently no fee is being charged)Total Expense Ratio: 2.36% p.a. (including 0.12% government levies)Selling & Marketing Expenses 0.4% per annumRisk Profile: ModerateListing: Pakistan Stock ExchangeCustodian & Trustee: Central Depository Company (CDC)Auditors: KPMG Taseer Hadi & Co, Chartered AccountantsBenchmark: Daily weighted return of KMI-30 Index & 6-month average deposit rates of three A rated Islamic Banks/Islamic windows of conventional banks as selected by MUFAP, based on Fund's actual allocation.Fund Manager: Taha Khan Javed, CFAMinimum Subscription: Growth Unit: Rs. 10,000/- Income Unit: Rs. 100,000/-Asset Manager Rating: AM1 by PACRA (Very High Quality)
The objective of the Fund is to provide regular monthly payments to investors by investing in Shariah Compliant Debt, Money Market & Equity investment avenues.
NBP Aitemaad Regular Payment Fund is aimed at meeting investors' regular income needs along with growth in investment value through payment of regular dividend by investing in Shariah Compliant Debt, Money Market & Equity investment avenues.
NARPF started off the month with an allocation of around 87% in equities, which decreased to around 75% towards the end of the month. NARPF outperformed the Benchmark in February as the Fund was underweight in select Oil & Gas Marketing Companies, Transport, and Refinery sectors stocks which underperformed the market and overweight in select Cement and Oil & Gas Exploration Companies sectors stocks which outperformed the market. During the month, the allocation was reduced primarily in Automobile Assembler, Engineering, Power Generation & Distribution Companies, and Fertilizer sectors.
February 2019
Since LaunchOctober 31, 2018*
(7.7%)
(7.3%)
Feb 2019
(2.1%)
(2.9%)
NBP Aitemaad Regular Payment Fund
Performance Period
Equities / Stocks Cash Others including receivables Total Leverage
75.4%22.8%1.8%
100.0%Nil
87.0%11.6%1.4%
100.0%Nil
31-Jan-1928-Feb-19Asset Allocation (% of Total Assets)
Unit Price (28/02/2019): 9.2284
Notes: 1) The calculation of performance does not include cost of front end load.2) Taxes apply. Further, tax credit also available as per section 62 of the Income Tax Ordinance, 2001.
Dr. Amjad Waheed, CFASajjad Anwar, CFA
Muhammad Ali Bhabha, CFA, FRMTaha Khan Javed, CFA
Hassan Raza, CFA
%*
Characteristics of Equity Portfolio**
PER7.78.2
NARPFKMI-30
PBV1.61.2
DY7.9%6.3%
**Based on NBP Funds estimates
Top Five Sectors (% of Total Assets) (as on February 28, 2019)
Oil & Gas Exploration Companies Fertilizer Oil & Gas Marketing Companies Power Generation & Distribution Cement Others
28.4%17.8%9.6%8.6%4.7%6.3%
Top Ten Holdings (as on February 28, 2019)
Engro Corporation Ltd
Oil & Gas Dev Co Ltd
Pakistan Oilfields Ltd
Attock Petroleum Ltd
Pak Petroleum Ltd
Hub Power Company Ltd
Engro Fertilizer Ltd
Pakistan Telecommunication
Nishat Mills Ltd
Kohat Cement Ltd
8.6%
6.3%
4.0%
2.3%
1.7%
11.5%
10.5%
9.2%
8.9%
8.7%
Equity
Equity
Equity
Equity
Equity
Equity
Equity
Equity
Equity
Equity
% of TotalAssets
AssetsClass
% of TotalAssets
AssetsClass*** effective from January 02, 2017

NAFA Multi Asset Fund (NMF)
Disclaimer: This publication is for informational purposes only and nothing herein should be construed as a solicitation, recommendation or an offer to buy or sell any fund. All investments in mutual funds are subject to market risks. Past performance is not necessarily indicative of future results.Please read the Offering Documents to understand the investment policies and the risks involved. The scheme holds certain non-compliant investments. Before making any investment decision, investors should review the latest monthly Fund Manager Report and Financial statements. The reported return may include provisions and reversal of provisions against some debt securities.
Dr. Amjad Waheed, CFASajjad Anwar, CFA
Taha Khan Javed, CFAHassan Raza, CFA
Muhammad Ali Bhabha, CFA, FRM
February 2019
Saudi Pak Leasing
Eden Housing (Sukuk II)
New Allied Electronics (Sukuk I)
Total
TFC
SUKUK
SUKUK
27,547,410
9,843,750
10,000,000
47,391,160
27,547,410
9,843,750
10,000,000
47,391,160
-
-
-
-
-
-
-
-
-
-
-
-
To provide investors with a combination of capital growth and income. NMF aims to achieve attractive returns at moderate levels of risk by investing in a variety of asset classes such as stocks, bonds, money market instruments, CFS etc.
During the month under review, NAFA Multi Asset Fund's (NMF) unit price (NAV) decreased by 2.5%,whereas the Benchmark decreased by 2.1%, thus an underperformance of 0.4% was recorded. Since inception on January 19, 2007 your Fund has posted 13.7% p.a return, versus 8.3% p.a by the Benchmark. Thus, to-date the outperformance of your Fund stands at 5.4% p.a. This outperformance is net of management fee and all other expenses.
NMF started off the month with an allocation of around 67% in equities, which decreased to around 56% towards the end of the month. NMF underperformed the Benchmark in February as the Fund was underweight in select Oil & Gas Exploration Companies, Commercial Banks, and Cement sectors stocks which outperformed the market and overweight in select Engineering, Chemical, Paper & Board, and Vanaspati & Allied Industries sectors stocks which underperformed the market. During the month, the allocation was reduced primarily in Automobile Assembler, Chemical, Commercial Banks, and Fertilizer sectors.
Unit Price (28/02/2019): Rs. 17.8168
Launch Date: January 19, 2007Fund Size: Rs 1,576 millionType: Open-end – Balanced FundDealing Days: Daily – Monday to FridayDealing Time: (Mon-Thr) 9:00 A.M to 4:30 P.M (Friday) 9:00 A.M to 5:00 P.MSettlement: 2-3 business daysPricing Mechanism: Forward PricingLoad:*** Front End Load (Individual): 3%, (Nil on investment above Rs. 101 million) Front End Load (Other): 3% (Nil on investment above Rs. 50 million) Back End Load: NILManagement Fee: 2% per annumTotal Expense Ratio (%) 3.18% p.a.(including 0.36% government levies)Selling & Marketing Expenses 0.4% per annum Risk Profile: ModerateListing: Pakistan Stock ExchangeCustodian & Trustee: Central Depository Company (CDC)Auditors: KPMG Taseer Hadi Chartered AccountantsBenchmark:** Daily weighted return of KSE-30 Total Return Index & 6-month KIBOR based on Fund's actual allocation.Fund Manager: Taha Khan Javed, CFAMinimum Growth Unit: Rs. 10,000/-Subscription: Income Unit: Rs. 100,000/-Asset Manager Rating: AM1 by PACRA (Very High Quality)
MONTHLY REPORT (MUFAP's Recommended Format)
Jahangir Siddiqui Co.LtdPak Petroleum LtdOil & Gas Dev Co LtdBank Al-Falah LtdFauji Fertilizer Co. Ltd
TFCEquityEquityEquityEquity
6.2%3.6%3.5%3.5%3.4%
% of TotalAssets
% of TotalAssets
United Bank Ltd
Engro Corporation Ltd
Pakistan Oilfields Ltd
Habib Bank Ltd
Bank AL-Habib Ltd
3.0%2.9%2.3%2.3%2.2%
EquityEquityEquityEquityEquity
Equities / Stocks TFCs / Sukuks Cash Placement with Banks Others including receivables Total Leverage
55.6%6.2%
30.9%5.6%1.7%
100.0%Nil
Asset Allocation (% of Total Assets) 28-Feb-1966.5%5.9%
21.0%5.4%1.2%
100.0%Nil
31-Jan-19
Sindh Workers' Welfare Fund (SWWF)
Top Ten Holdings (as on February 28, 2019)
PER7.78.2
NMFKSE-30
PBV1.51.2
DY5.5%6.3%
The Scheme has maintained provisions against Sindh worker’s welfare Fund’s liability to the tune of Rs 12,212,908/- if the same were not made the NAV Per unit/last one year return of the Scheme would be higher by Rs 0.1381/0.75%. For details investors are advised to read the note 11.1 of the Financial Statements of the Scheme for the period ended December 31, 2018.
* Annualized ReturnAll Other returns are Cumulative
The performance reported is net of management fee & all other expenses and based on dividendreinvestment gross of with-holding tax where applicable.
Performance Period
Performance %Feb2019
(2.5%)
(2.1%)
FYTD2019
(1.1%)
1.9%
(2.9%)
0.9%
25.4%
19.6%
13.7%
8.3%
FY2014
26.8%
11.0%
FY2015
8.7%
7.1%
FY2016
28.4%
14.1%
FY2017
(6.2%)
(2.8%)
FY2018
10.4%
8.0%
Last 3Years*
12.5%
7.6%
Last 5Years*
18.0%
13.3%
Last 10Years*
Since LaunchJanuary 19, 2007*
Benchmark**
NAFA Multi Asset Fund
Notes: 1) The calculation of performance does not include cost of front end load.2) Taxes apply. Further, tax credit also available as per section 62 of the Income Tax Ordinance, 2001.
Top Five Sectors (% of Total Assets) (as on February 28, 2019)
Commercial BanksOil & Gas Exploration CompaniesFertilizerTextile CompositeCementOthers
15.0%11.1%8.5%4.4%4.1%
12.5%
** effective from September 01, 2016; Previously 50% KSE-30 Total Return Index & 50% 3-month KIBOR. From January 01, 2014, KSE-30 Total Return Index*** effective from January 02, 2017
Rolling12 Months
NBP FUNDSManaging Your Savings
Page 18
NMF, 34.5%
Benchmark, 26.0%Peer Avg., 21.2%
-10.0%
10.0%
30.0%
50.0%
70.0%
29-F
eb-1
6
31-M
ay-1
6
31-A
ug-1
6
30-N
ov-1
6
28-F
eb-1
7
31-M
ay-1
7
31-A
ug-1
7
30-N
ov-1
7
28-F
eb-1
8
31-M
ay-1
8
31-A
ug-1
8
30-N
ov-1
8
28-F
eb-1
9
NMF Benchmark Peer Avg.Annualized Return 10.4% 8.0% 6.6%%Risk (Std. Deviation) 9.8% 9.9% 13.7%
Relative Performance of NAFA Multi Asset Fund (NMF)for the Last Three Years Cum. Return
**** Based on NBP Funds estimates

NAFA Islamic Stock Fund (NISF) NBP FUNDSManaging Your Savings
Page 19
Disclaimer: This publication is for informational purposes only and nothing herein should be construed as a solicitation, recommendation or an offer to buy or sell any fund. All investments in mutual funds are subject to market risks. Past performance is not necessarily indicative of future results. Please read the Offering Document to understand the investment policies and the risks involved.
Top Ten Holdings (as on February 28, 2019)
Pak Petroleum Ltd
Oil & Gas Dev Co Ltd
Engro Corporation Ltd
Engro Fertilizer Ltd
Hub Power Company Ltd
Meezan Bank Ltd
Pakistan Oilfields Ltd
Lucky Cement Ltd
Mari Petroleum Company Ltd
Nishat Mills Ltd
5.2%
5.2%
4.9%
4.8%
4.8%
9.9%
9.3%
7.9%
5.8%
5.5%
% of TotalAssets
% of TotalAssets
* Annualized ReturnAll Other returns are Cumulative
The performance reported is net of management fee & all other expenses and based on dividendreinvestment gross of with-holding tax where applicable.
‘
Launch Date: January 9, 2015Fund Size: Rs. 5,704 million Type: Open-end-Shariah Compliant-Equity FundDealing Days: Daily – Monday to FridayDealing Time: (Mon-Thr) 9:00 A.M to 4:30 P.M (Friday) 9:00 A.M to 5:00 P.MSettlement: 2-3 business daysPricing Mechanism: Forward Pricing Load:** Front End Load (Individual):3% (Nil on investment above Rs. 101 million) Front End Load (Other): 3% (Nil on investment above Rs. 50 million) Back End Load: NILManagement Fee: 2% per annumTotal Expense Ratio (%): 3.25% p.a.(including 0.37% government levies)Selling & Marketing Expenses: 0.4% per annumRisk Profile: HighListing: Pakistan Stock ExchangeCustodian & Trustee: Central Depository Company (CDC)Auditors: A. F. Ferguson & Co. Chartered AccountantsBenchmark: KMI-30 IndexFund Manager: Sajjad Anwar, CFAMinimum: Growth Unit: Rs. 10,000/-Subscription: Income Unit: Rs. 100,000/-Asset Manager Rating: AM1 by PACRA (Very High Quality)
The objective of the Fund is to provide investors with long term capital growth
from an actively managed portfolio of Shariah Compliant listed equities.
During the month under review, NAFA Islamic Stock Fund’s (NISF) unit price (NAV) decreased by 2.9%, whereas the Benchmark decreased by 4.0%, thus an outperformance of 1.1% was recorded. Since inception on January 9, 2015 your Fund has posted 8.1% p.a return, versus 5.5% p.a by the Benchmark. Thus, to-date the outperformance of your Fund stands at 2.6% p.a. This outperformance is net of management fee and all other expenses.
NISF started off the month with an allocation of around 93% in equities, which decreased to around 87% towards the end of the month. NISF outperformed the Benchmark in February as the Fund was underweight in select Oil & Gas Marketing Companies, Transport, and Refinery sectors stocks which underperformed the market and overweight in select Commercial Banks, Cement, Food & Personal Care Products, and Glass & Ceramics sectors stocks which outperformed the market. During the month, the allocation was increased primarily in Commercial Banks, and Vanaspati & Allied Industries sectors, whereas it was reduced primarily in Oil & Gas Marketing Companies, Power Generation & Distribution Companies, Fertilizer, and Chemical sectors.
February 2019
Since Launch*January 09, 2015
8.1%
5.5%
Feb2019
(2.9%)
(4.0%)
FYTD2019
(5.1%)
(7.8%)
(7.7%)
(10.4%)
FY2016
12.9%
15.5%
Last 3Years*
8.7%
6.8%
FY2017
32.5%
18.8%
FY2018
(12.8%)
(9.6%)
NAFA Islamic Stock Fund
Performance Period
Equities / Stocks Cash Equivalents Others including receivables Total Leverage
PER8.48.2
NISFKMI-30
PBV1.61.2
DY5.9%6.3%
Dr. Amjad Waheed, CFASajjad Anwar, CFA
Taha Khan Javed, CFAHassan Raza, CFA
86.7%12.4%0.9%
100.0%Nil
28-Feb-19
93.4%5.9%0.7%
100.0%Nil
31-Jan-19Asset Allocation (% of Total Assets)
Characteristics of Equity Portfolio***
Unit Price (28/02/2019): Rs. 10.8196
The Scheme has maintained provisions against Sindh worker’s welfare Fund’s liability to the tune of Rs. 44,440,042/- if the same were not made the NAV Per unit/last one year return of the Scheme would be higher by Rs. 0.0843/0.72% age.For details investors are advised to read the Note 8 of the Financial Statements of the Scheme for the period ended December 31, 2018.
Sindh Workers' Welfare Fund (SWWF)
Notes: 1) The calculation of performance does not include cost of front end load.2) Taxes apply. Further, tax credit also available as per section 62 of the Income Tax Ordinance, 2001.
Performance %
Top Five Sectors (% of Total Assets) (as on February 28, 2019)
Oil & Gas Exploration CompaniesFertilizerCementPower Generation & DistributionOil & Gas Marketing CompaniesOthers
29.2%13.8%10.5%6.5%5.4%
21.3%
** effective from January 02, 2017
Rolling12 Months
*** Based on NBP Funds estimates
NISF, 28.5%Benchmark, 21.9%Peers Avg., 17.7%
0%
25%
50%
75%
100%
29-F
eb-1
6
31-M
ay-1
6
31-A
ug-1
6
30-N
ov-1
6
28-F
eb-1
7
31-M
ay-1
7
31-A
ug-1
7
30-N
ov-1
7
28-F
eb-1
8
31-M
ay-1
8
31-A
ug-1
8
30-N
ov-1
8
28-F
eb-1
9
NISF Benchmark Peers Avg.
Relative Performance of NAFA Islamic Stock Fund (NISF)for the Last Three Years Cumulative
Return
Annualized Return 8.7% 6.8% 5.5%Risk (Std. Deviation) 15.9% 18.5% 16.4%

NAFA Stock Fund (NSF)
Disclaimer: This publication is for informational purposes only and nothing herein should be construed as a solicitation, recommendation or an offer to buy or sell any fund. All investments in mutual funds are subject to market risks.Past performance is not necessarily indicative of future results. Please read the Offering Documents to understand the investment policies and the risks involved.
‘
Launch Date: January 19, 2007Fund Size: Rs. 14,638 millionType: Open-end – Equity FundDealing Days: Daily – Monday to FridayDealing Time: (Mon-Thr) 9:00 A.M to 4:30 P.M (Friday) 9:00 A.M to 5:00 P.MSettlement: 2-3 business daysPricing Mechanism: Forward PricingLoad:*** Front End Load (Individual): 3% (Nil on investment above Rs. 101 million) Front End Load (Other): 3% (Nil on investment above Rs. 50 million) Back End Load: NILManagement Fee: 2% per annumTotal Expense Ratio (%) 3.17% p.a.(including 0.37% government levies)Selling & Marketing Expenses 0.4% per annumRisk Profile: HighListing: Pakistan Stock ExchangeCustodian & Trustee: Central Depository Company (CDC)Auditors: KPMG Taseer Hadi & Co, Chartered AccountantsBenchmark: KSE-30 Total Return IndexFund Manager: Taha Khan Javed, CFAMinimum Growth Unit: Rs. 10,000/-Subscription: Income Unit: Rs. 100,000/-Asset Manager Rating: AM1 by PACRA (Very High Quality)
To provide investors with long term capital growth from an actively managed portfolio invested primarily in listed companies in Pakistan. The risk profile of the Fund will be moderate to high.
During the month under review, NAFA Stock Fund’s (NSF) unit price (NAV) decreased by 3.3%, whereas the Benchmark decreased by 4.0%, thus an outperformance of 0.7% was recorded. Since inception on January 19, 2007 your Fund has posted 14.4% p.a return, versus 5.4% p.a by the Benchmark. Thus, to-date the outperformance of your Fund stands at 9.0% p.a. This outperformance is net of management fee and all other expenses.
NSF started off the month with an allocation of around 94% in equities, which decreased to around 88% towards the end of the month. NSF outperformed the Benchmark in February as the Fund was underweight in select Commercial Banks, Power Generation & Distribution Companies, Oil & Gas Marketing Companies, and Refinery sectors stocks which underperformed the market and overweight in select Commercial Banks, Glass & Ceramics, Technology & Communication, and Textile Composite sectors stocks which outperformed the market. During the month, the allocation was increased primarily in Oil & Gas Exploration Companies sector, whereas it was reduced primarily in Chemical, Commercial Banks, Oil & Gas Marketing Companies, and Power Generation & Distribution Companies sectors.
February 2019
Equities / Stock Cash Others including receivables Total Leverage
88.3%11.2%0.5%
100.0%Nil
PER8.27.9
PBV1.61.7
DY5.7%6.5%
Dr. Amjad Waheed, CFASajjad Anwar, CFA
Taha Khan Javed, CFAHassan Raza, CFA
28-Feb-1993.7%6.2%0.1%
100.0%Nil
31-Jan-19Asset Allocation (% of Total Assets)
Top Ten Equity Holdings (as on February 28, 2019)
Unit Price (28/02/2019): Rs. 13.9093
The Scheme has maintained provisions against Sindh Worker’s Welfare Fund’s liability to the tune of Rs. 108,972,307/- if the same were not made the NAV Per unit/Last one year return of the Scheme would be higher by Rs. 0.1035/0.69%. For details investors are advised to read the Note 10.1 of the Financial Statements of the Scheme for the period ended December 31, 2018.
Sindh Workers' Welfare Fund (SWWF)
Bank Al-Falah Ltd
Pak Petroleum Ltd
Fauji Fertilizer Co. Ltd
United Bank Ltd
Oil & Gas Dev Co Ltd
Engro Corporation Ltd
Bank AL-Habib Ltd
Habib Bank Ltd
Hub Power Company Ltd
MCB Bank Ltd
4.6%
4.3%
3.5%
3.4%
3.2%
6.3%
5.4%
5.0%
4.9%
4.7%
% of TotalAssets
% of TotalAssets
* Annualized ReturnAll Other returns are Cumulative
The performance reported is net of management fee & all other expenses and based on dividendreinvestment gross of with-holding tax where applicable.
**From January 01, 2014, KSE-30 Total Return Index
Performance Period
Performance %Feb2019
(3.3%)
(4.0%)
FYTD2019
(4.9%)
(5.9%)
(7.5%)
(8.8%)
36.3%
29.6%
FY2014
36.9%
12.3%
FY2015
11.4%
7.1%
FY2016
33.7%
17.9%
FY2017
(9.7%)
(10.0%)
FY2018
11.0%
6.7%
Last 3Years*
14.3%
6.0%
Last 5Years*
23.3%
15.6%
Last 10Years*
14.4%
5.4%
Since LaunchJanuary 19, 2007*
Benchmark**
NAFA Stock Fund
Notes: 1) The calculation of performance does not include cost of front end load.2) Taxes apply. Further, tax credit also available as per section 62 of the Income Tax Ordinance, 2001.
Top Five Sectors (% of Total Assets) (as on February 28, 2019)
Commercial Banks Oil & Gas Exploration Companies Fertilizer Textile Composite Cement Others
26.6%16.4%13.0%6.4%6.4%
19.5%
*** effective from January 02, 2017
Rolling12 Months
NBP FUNDSManaging Your Savings
Page 20
NSF, 37%
Benchmark, 21%Peers Avg, 18%
-20%
20%
60%
100%
29-F
eb-1
6
31-M
ay-1
6
31-A
ug-1
6
30-N
ov-1
6
28-F
eb-1
7
31-M
ay-1
7
31-A
ug-1
7
30-N
ov-1
7
28-F
eb-1
8
31-M
ay-1
8
31-A
ug-1
8
30-N
ov-1
8
28-F
eb-1
9
NSF Benchmark Peers Avg.Annualized Return 11.0% 6.7% 5.6%Risk (Std. Deviation) 15.7% 17.9% 15.8%
CumulativeReturn
Relative Performance of NAFA Stock Fund (NSF)for the Last Three Years
**** Based on NBP Funds estimates

NAFA Islamic Energy Fund (NIEF)
Notes: 1) The calculation of performance does not include cost of front end load.2) Taxes apply. Further, tax credit also available as per section 62 of the Income Tax Ordinance, 2001.
Top Ten Holdings (as on February 28, 2019)
Pak Petroleum Ltd
Oil & Gas Dev Co Ltd
Mari Petroleum Company Ltd
Pakistan Oilfields Ltd
Hub Power Company Ltd
Pakistan State Oil Co Ltd
Sui Northern Gas Ltd
K-Electric Ltd
Attock Petroleum Ltd
Hascol Petroleum Ltd
6.5%
6.2%
4.7%
3.4%
3.1%
15.8%
13.2%
11.4%
10.2%
8.3%
% of TotalAssets
% of TotalAssets
PER8.18.2
NIEFKMI-30
PBV1.91.2
DY5.5%6.3%
Disclaimer: This publication is for informational purposes only and nothing herein should be construed as a solicitation, recommendation or an offer to buy or sell any fund. All investments in mutual funds are subject to market risks. Past performance is not necessarily indicative of future results. Please read the Offering Documents to understand the investment policies and the risks involved.
* Annualized ReturnAll Other returns are Cumulative
The performance reported is net of management fee & all other expenses and based on dividend reinvestmentgross of with-holding tax where applicable.
‘
Launch Date: April 21, 2016Fund Size: Rs. 1,090 millionType: Open Ended Shariah Compliant Equity SchemeDealing Days: Daily – Monday to FridayDealing Time: (Mon - Thr) 9:00 A.M to 4:30 P.M (Friday) 9:00 A.M to 5:00 P.MSettlement: 2-3 business daysPricing Mechanism Forward PricingLoad:** Front End Load (Individual): 3% (Nil on investment above Rs. 101 million) Front End Load (Other): 3% (Nil on investment above Rs. 50 million) Back End Load: NILManagement Fee: 2% p.aTotal Expense Ratio (%) 3.33% p.a (including 0.38% government levies)Selling & Marketing Expenses 0.4% per annum Risk Profile HighListing: Pakistan Stock ExchangeCustodian & Trustee: Central Depository Company (CDC)Auditors: A. F. Ferguson & Co. Chartered AccountantsBenchmark: KMI-30 IndexFund Manager: Taha Khan Javed, CFAMinimum Growth Unit: Rs. 10,000/-Subscription: Income Unit: Rs. 100,000/-Asset Manager Rating: AM1 by PACRA ( Very High Quality)
The objective of NAFA Islamic Energy Fund is to provide investors with long term capital growth from an actively managed portfolio of Shari’ah Compliant listed equities belonging to the Energy Sector.
NBP Funds launched its third open-end Islamic Equity Fund namely NAFA Islamic Energy Fund (NIEF) in April, 2016. The aim of the Fund is to provide growth to the investment of unit holders over the long-term in approved Shariah Compliant energy stocks.
NIEF started off the month with an allocation of around 93% in equities, which decreased to around 89% towards the end of the month. NIEF underperformed the Benchmark in February as the Fund was overweight in select Energy sectors stocks which underperformed the market. During the month, the allocation was increased primarily Oil & Gas Exploration Companies sector, whereas it was reduced primarily in Oil & Gas Marketing Companies, Power Generation & Distribution Companies and Refinery sectors.
February 2019
Since Launch*April 21, 2016
7.3%
3.8%
Feb2019
(4.8%)
(4.0%)
(12.7%)
(7.8%)
FYTD2019
FY2017
32.2%
18.8%
FY2018
(3.2%)
(9.6%)
Rolling12 Months
(12.4%)
(10.4%)
NAFA Islamic Energy Fund
Performance Period
Equities / Stocks Cash Equivalents Others including receivables Total Leverage
89.1%9.9%1.0%
100.0%Nil
93.1%6.1%0.8%
100.0%Nil
31-Jan-1928-Feb-19Asset Allocation (% of Total Assets)
Unit Price (28/02/2019): Rs. 11.0624
%
Dr. Amjad Waheed, CFASajjad Anwar, CFA
Taha Khan Javed, CFAHassan Raza, CFA
Sectors (% of Total Assets) (as on February 28, 2019)
Oil & Gas Exploration Companies
Oil & Gas Marketing Companies
Power Generation & Distribution
Refinery
50.6%
23.3%
14.3%
0.9%
**effective from January 02, 2017
The Scheme has maintained provisions against sindh worker’s welfare Fund’s liability to the tune of Rs. 14,050,569/- if the same were not made the NAV Per unit/return of the Scheme would be higher by Rs 0.1426/1.13%. For details investors are advised to read the note 12.1 of the Financial Statements of the Scheme for the period ended December 31, 2018.
Sindh Workers' Welfare Fund (SWWF)
*** Based on NBP Funds estimates
NBP FUNDSManaging Your Savings
Page 21
NIEF, 22.3%
KMI-30, 11.1%
0.0%
20.0%
40.0%
60.0%
80.0%
21-A
pr-1
621
-May
-16
21-J
un-1
621
-Jul
-16
21-A
ug-1
621
-Sep
-16
21-O
ct-1
621
-Nov
-16
21-D
ec-1
621
-Jan
-17
21-F
eb-1
721
-Mar
-17
21-A
pr-1
721
-May
-17
21-J
un-1
721
-Jul
-17
21-A
ug-1
721
-Sep
-17
21-O
ct-1
721
-Nov
-17
21-D
ec-1
721
-Jan
-18
21-F
eb-1
821
-Mar
-18
21-A
pr-1
821
-May
-18
21-J
un-1
821
-Jul
-18
21-A
ug-1
821
-Sep
-18
21-O
ct-1
821
-Nov
-18
21-D
ec-1
821
-Jan
-19
28-F
eb-1
9
NIEF KMI-30Annualized Return 7.3% 3.8%Risk (Std. Deviation) 16.7% 18.8%
Relative Performance of NAFA Islamic Energy Fund (NIEF)Since Launch on April 21, 2016
Cum. Return

Disclaimer: This publication is for informational purposes only and nothing herein should be construed as a solicitation, recommendation or an offer to buy or sell any fund. All investments in mutual funds are subject to market risks. Past performance is not necessarily indicative of future results. Please read the Offering Document to understand investment policies and the risks involved.
Dr. Amjad Waheed, CFASajjad Anwar, CFA
Taha Khan Javed, CFAHassan Raza, CFA
Launch Date: February 14, 2018Fund Size: Rs. 1,307 millionType: Open Ended Equity SchemeDealing Days: Daily – Monday to FridayDealing Time: (Mon-Thr) 9:00 A.M to 4:30 P.M (Friday) 9:00 A.M to 5:00 P.MSettlement: 2-3 business daysPricing Mechanism Forward PricingLoad: Front End Load (Individual): 3% (Nil on investment above Rs. 101 million)Front End Load (Other): 3% (Nil on investment above Rs. 50 million)Back End Load: NILManagement Fee: 2% per annumTotal Expense Ratio (%) 3.44% p.a (including 0.38% government levies)Selling & Marketing Expenses 0.4% per annumRisk Profile HighListing: Pakistan Stock ExchangeCustodian & Trustee: Central Depository Company (CDC)Auditors: A. F. Ferguson & Co., Chartered AccountantsBenchmark: KSE 30 Index (Total Return Index)Fund Manager: Taha Khan Javed, CFAAsset Manager Rating: AM1 by PACRA (Very High Quality)
The objective of NAFA Financial Sector Fund is to provide investors with long term capital growth from an actively managed portfolio of listed equities belonging to the Financial Sector.
NBP Funds launched its NAFA Financial Sector Fund (NFSF) in February 2018, aiming to provide an opportunity to invest and benefit from the strong growth of the Financial Sector. NFSF started off the month with an allocation of around 92% in equities, which decreased to around 88% towards the end of the month. NFSF outperformed the Benchmark in February as the Fund was overweight in select financial sectors stocks which outperformed the market. During the month, the allocation was increased primarily in Insurance sector, whereas it was reduced primarily in Commercial Banks sector.
Equities / Stocks Cash Equivalents Others including receivables Total Leverage
88.4%11.0%0.6%
100.0%Nil
92.2%6.0%1.8%
100.0%Nil
31-Jan-1928-Feb-19Asset Allocation (% of Total Assets)
Unit Price (28/02/2019): Rs. 9.7081
Characteristics of Equity Portfolio**
Sectors (% of Total Assets) (as on February 28, 2019)
* Annualized ReturnAll Other returns are Cumulative
[Returns are net of management fee & all other expenses]
Performance Period
Performance %
(2.8%)
(8.1%)
Since Launch*February 14, 2018
(3.4%)
(4.0%)
Feb2019
(2.9%)
(5.9%)
FYTD2019
(2.0%)
(8.8%)
Rolling12 Months
NAFA Financial Sector Fund
Benchmark
Notes: 1) The calculation of performance does not include cost of front end load.2) Taxes apply. Further, tax credit also available as per section 62 of the Income Tax Ordinance, 2001.
NAFA Financial Sector Fund (NFSF)
February 2019
Top Ten Holdings (as on February 28, 2019)
PER7.17.9
NFSFKSE-30
PBV1.11.7
DY5.1%6.5%
Commercial Banks Insurance
81.5%6.9%
MCB Bank Ltd
Bank AL-Habib Ltd
Allied Bank Ltd
United Bank Ltd
Bank Al-Falah Ltd
Habib Bank Ltd
Bank Of Punjab Ltd
Adamjee Insurance Co. Ltd
Askari Bank Ltd
Faysal Bank Ltd
8.8%
7.0%
6.8%
3.0%
2.9%
13.4%
12.0%
11.0%
9.8%
9.4%
% of TotalAssets
% of TotalAssets
NBP FUNDSManaging Your Savings
Page 22
** Based on NBP Funds estimates

NAFA Pension Fund (NPF)
Disclaimer: This publication is for informational purposes only and nothing herein should be construed as a solicitation, recommendation or an offer to buy or sell any Pension fund. All investments in Pension funds are subject to market risks. Past performance is not necessarily indicative of future results. Please read the Offering Documents to understand the investment policies and the risk involved.
To provide a secure source of savings and regular income after retirement tothe Participants.
MONTHLY REPORT (MUFAP's Recommended Format) February 2019
Cash EquivalentsTFC/SukukT-BillsOthersTotal
22.3%20.2%55.6%1.9%
100.0%
28-Feb-19
30-Nov-17
Money Market Sub-fundCash EquivalentsBank PlacementOthersTotal
78.3%19.6%2.1%
100.0%
Asset Allocation (% of Total Assets)
28-Feb-19Equity Sub-fund
EquityCash EquivalentsOthers Total
92.0%4.7%3.3%
100.0%
MCB Bank Limited 19-JUN-14 19-JUN-22 Askari Commercial Bank Limited 30-SEP-14 30-SEP-24 Dawood Hercules Corp Ltd 16-NOV-17 16-NOV-22 BANK ALFALAH LTD - V - REVISED 20-FEB-13 20-FEB-21 JS Bank Limited 14-DEC-16 14-DEC-23 Jahangir Siddiqui and Company Ltd. 18-Jul-17 18-Jul-22 Jahangir Siddiqui and Company Ltd. 08-APR-14 08-APR-19 Jahangir Siddiqui and Company Ltd. 24-Jun-16 24-Jun-21 Total
6.5%4.3%2.1%2.1%1.9%1.8%1.1%0.4%20.2%
As on February 28, 2019Top TFC/Sukuk Holdings of Debt Sub-fund
Name(% of Total
Assets)
28-Feb-1952.4%20.2%25.8%1.6%
100.0%
31-Jan-1979.5%19.2%1.3%
100.0%
31-Jan-19
95.4%4.2%0.4%
100.0%31-Jan-19Debt Sub-fund
Bank Al-Falah Ltd Fauji Fertilizer Co. Ltd Pak Petroleum Ltd Oil & Gas Dev Co Ltd Bank AL-Habib Ltd
6.6%6.3%6.2%5.0%4.8%
(% of Total Assets)
United Bank Ltd Engro Corporation Ltd Mari Petroleum Company Ltd Hub Power Company Ltd Pakistan Oilfields Ltd
4.5%4.3%3.6%3.5%3.4%
(% of Total Assets)
Top Ten Holdings of Equity Sub-fund (as on February 28, 2019)
Dr. Amjad Waheed, CFASajjad Anwar, CFA
Muhammad Ali Bhabha, CFA, FRMTaha Khan Javed, CFA
Hassan Raza, CFA
Name of the Members of Investment Committee
Fund Manager’s Commentary
General Information Investment Objective
NPF-Equity Sub-fund
NPF-Debt Sub-fund
NPF-Money Market Sub-fund
290.2608
153.9710
140.2240
930.3
379.6
730.2
The performance reported is net of management fee & all other expenses.* Cumulative Returns All Other returns are annualized
(3.3%)*
8.5%
8.9%
20.5%
7.7%
5.9%
NAV Per Unit(Rs.) Feb 28,
2019
Feb2019
(5.4%)*
6.5%
7.0%
FYTD2019
(7.4%)*
4.3%
4.4%
FY2018
(5.2%)*
5.9%
6.2%
Rolling12 Months
49.6%*
17.3%
7.8%
FY2015
19.2%
7.6%
5.8%
Last 5Years
12.7%
4.9%
5.0%
Last 3Years
14.8%*
5.5%
4.9%
FY2016
37.3%*
4.4%
4.4%
FY2017
Since LaunchJuly 02, 2013
Fund Size
(Rs. in mln)
Performance %
During the month of February:
NPF Equity Sub-fund unit price decreased by 3.3% compared with 4.3% decrease in KSE-100 Index. The Sub-fund was around 92% invested in equities with major weights in Commercial Banks, Oil & Gas Exploration Companies, and Fertilizer sectors. Equity Sub-fund maintains exposure of atleast 90% in listed equities on average. Last 90 days average allocation in equity was 95% of net asset.
NPF Debt Sub-fund generated annualized return of 8.5%.The Sub-fund was invested primarily in Government Securities and TFCs. Debt Sub-fund maintains a minimum combined exposure of 50% in Government Securities (25% minimum) and AA+ rated banks. Weighted Average Maturity of Sub-fund is 0.8 years.
NPF Money Market Sub-fund generated annualized return of 8.9%. In line with its investment strategy, the Sub Fund will maintain high exposure in money market securities. Money Market Sub-fund average maturity cannot exceed 90 days. Weighted Average Maturity of Sub-fund is 5 days.
Sindh Workers' Welfare Fund (SWWF)NPF has maintained provisions against Sindh Workers’ Welfare Fund’s liability inindividual Sub-funds as stated below:
Equity Sub-fund
Debt Sub-fund
Money Market Sub-fund
8,150,678
1,530,854
1,908,613
2.5432
0.6209
0.3665
0.83%
0.43%
0.28%
Last One Yearreturn would
otherwise have been higher by:
Amount PerTotal amount
ProvidedRs
Unit
Rs
Notes1) The calculation of performance does not include cost of front-end load. 2) Taxes apply. Further, tax credit also available as per section 63 of the Income Tax Ordinance, 2001.
Top Five Sectors (% of Total Assets) (as on February 28, 2019)Commercial Banks Oil & Gas Exploration Companies Fertilizer Cement Textile Composite Others
26.9%18.2%13.5%6.5%4.9%22.0%
Credit Quality of the Portfolio (as on February 28, 2019)
Government Securities (AAA rated)AAAAA+AAAA-A+OthersTotal
55.6%9.3%
22.7%4.1%4.3%2.1%1.9%
100.0%
-0.1%
19.8%-
59.0%19.0%2.1%
100.0%
Debt Money Market
Launch Date: July 2, 2013Fund size: Rs. 2,040 millionType: Open-end – Voluntary Pension SchemeDealing Days: Daily – Monday to FridayDealing Time: (Mon-Thr) 9:00 A.M to 5:00 P.M (Friday) 9:00 A.M to 5:30 P.MPricing Mechanism Forward PricingFront end Load: Upto 3% on ContributionsBack end Load: 0%Management Fee: On average Annual Net Assets of each Sub-Fund. Equity, Debt, Money Market 1.50% p.a. Equity 2.13% p.a. (including 0.24% government levies)Total Expense Ratio (%): Debt 2.16% p.a. (including 0.38% government levies) Money Market 2.08% p.a. (including 0.38% government levies)Risk Profile: Investor dependentCustodian & Trustee: Central Depository Company (CDC)Auditors: Deloitte Yousuf Adil Chartered AccountantsFund Manager: Sajjad Anwar, CFAMinimum: Initial: Rs. 10,000/-Subscription: Subsequent: Rs. 1000/-Asset Manager Rating: AM1 by PACRA (Very High Quality)Leverage: Nil
For details investors are advised to read the Note 5 of the Financial Statements of the Scheme for the period ended December 31, 2018.
NBP FUNDSManaging Your Savings
Page 23

NAFA Islamic Pension Fund (NIPF) NBP FUNDSManaging Your Savings
Page 24
Disclaimer: This publication is for informational purposes only and nothing herein should be construed as a solicitation, recommendation or an offer to buy or sell any Pension fund. All investments in Pension funds are subject to market risks. Past performance is not necessarily indicative of future results. Please read the Offering Documents to understand the investment policies and the risks involved.
General Information Investment Objective
Fund Manager’s Commentary
To provide a secure source of savings and regular income after retirement tothe Participants.
MONTHLY REPORT (MUFAP's Recommended Format) February 2019
Name of the Members of Investment Committee
Asset Allocation (% of Total Assets)
28-Feb-19Equity Sub-fund
Credit Quality of the Portfolio (as on February 28, 2019)
EquityCash EquivalentsOthers including receivablesTotal
90.7%7.2%2.1%
100.0%28-Feb-19Debt Sub-fund
Cash EquivalentsGOP Ijara SukukSukukCommercial Papers (Islamic)OthersTotal
66.5%24.8%3.1%4.4%1.2%
100.0%
28-Feb-19Money Market Sub-fundCash EquivalentsOthersTotal
98.0%1.1%
100.0%
31-Jan-19
93.9%5.3%0.8%
100.0%31-Jan-19
64.9%26.4%3.3%4.5%0.9%
100.0%
31-Jan-1999.0%1.0%
100.0%
24.8%24.4%2.5%4.0%
23.9%19.2%1.2%
100.0%
Government Securities (AAA rated)AAAAA+AAAA-A+OthersTotal
-21.5%17.6%4.1%
36.7%19.0%1.1%
100.0%
Debt Money Market
During the month of February:
NIPF Equity Sub-fund unit price decreased by 2.6%, compared with 4.0% decrease in KMI-30 Index. The Sub-fund was around 91% invested in equities with major weights in Oil & Gas Exploration Companies, Fertilizer and Cement sectors. Equity Sub-fund maintains exposure of atleast 90% in listed equities on average. Last 90 days average allocation in equity was 94% of net asset.
NIPF Debt Sub-fund generated annualized return of 9.5%. The Sub-fund was invested primarily in GoP Ijara Sukuks and Islamic bank deposits. Debt Sub-fund maintains a minimum combined exposure of 50% in Islamic Government Securities (25% minimum) and AA+ rated Islamic banks. Weighted Average Maturity of Sub-fund is 0.4 year.
NIPF Money Market Sub-fund generated annualized return of 8.3%. The Sub-fund was invested primarily in Islamic bank deposits. Money Market Sub-fund average maturity cannot exceed 1 year. Weighted Average Maturity of Sub-fund is 1 day.
Pak Petroleum LtdOil & Gas Dev Co LtdEngro Corporation LtdMeezan Bank LtdMari Petroleum Company Ltd
9.8%9.8%8.1%5.7%5.7%
(% of Total Assets)
5.6%5.5%5.2%5.1%4.8%
Hub Power Company LtdEngro Fertilizer LtdLucky Cement Ltd Pakistan Oilfields Ltd Nishat Mills Ltd
(% of Total Assets)
Top Ten Holdings of Equity Sub-fund (as on February 28, 2019)
Top Sukuk Holdings of Debt Sub-fund ( As on February 28, 2019)
Total amountProvided
Rs
Sindh Workers' Welfare Fund (SWWF)NIPF has maintained provisions against Sindh Workers’ Welfare Fund’s liability inindividual Sub-funds as stated below:
For details investors are advised to read the Note 5 of the Financial Statements of the Scheme for the period ended September 30, 2018.
Equity Sub-fund
Debt Sub-fund
Money Market Sub-fund
6,827,479
1,057,346
941,212
1.8055
0.34
0.2566
0.60%
0.27%
0.20%
Last One Yearreturn would
otherwise have
been higher by:
Amount Per
Unit
Rs
Notes: 1) The calculation of performance does not include cost of front-end load.2) Taxes apply. Further, tax credit also available as per section 63 of the Income Tax Ordinance, 2001.
Top Five Sectors (% of Total Assets) (as on February 28, 2019)
Oil & Gas Exploration Companies Fertilizer Cement Power Generation & Distribution Commercial Banks Others
30.4%13.6%10.7%6.0%5.7%24.3%
Launch Date: July 2, 2013Fund size: Rs. 1,976 millionType: Open-end – Shariah Compliant Voluntary Pension SchemeDealing Days: Daily – Monday to FridayDealing Time: (Mon-Thr) 9:00 A.M to 5:00 P.M (Friday) 9:00 A.M to 5:30 P.MPricing Mechanism Forward PricingFront end Load: Upto 3% on ContributionsBack end Load: 0%Management Fee: On average Annual Net Assets of each Sub-Fund. Equity, Debt, Money Market 1.50% p.a. Equity 2.06% p.a. (including 0.25% government levies)Total Expense Ratio (%) Debt 2.11% p.a. (including 0.37% government levies) Money Market 2.10% p.a. (including 0.38% government levies)Risk Profile Investor dependentCustodian & Trustee: Central Depository Company (CDC)Auditors: Deloitte Yousuf Adil Chartered AccountantsFund Manager: Sajjad Anwar, CFAMinimum Initial: Rs. 10,000/-Subscription: Subsequent: Rs. 1000/-Asset Manager Rating: AM1 by PACRA (Very High Quality)Leverage Nil
Dr. Amjad Waheed, CFASajjad Anwar, CFA
Taha Khan Javed, CFA,Muhammad Ali Bhabha, CFA,
Hassan Raza, CFA
NIPF-Equity Sub-fund
NIPF-Debt Sub-fund
NIPF-Money Market Sub-fund
282.7546
133.2516
134.3208
1,069.2
414.4
492.6
The performance reported is net of management fee & all other expenses.* Cumulative Returns All Other returns are annualized
(2.6%)*
9.5%
8.3%
20.0%
5.0%
5.2%
NAV Per Unit(Rs.) Feb 28,
2019
Feb2019
(4.2%)*
6.4%
6.6%
FYTD2019
(10.5%)*
2.8%
3.6%
FY2018
(5.8%)*
5.5%
5.8%
Rolling12 Months
51.5%*
5.6%
6.2%
FY2015
18.7%
4.6%
4.9%
Last 5Years
11.3%
4.0%
4.4%
Last 3Years
16.9%*
3.8%
3.9%
FY2016
35.8%*
3.9%
3.8%
FY2017
Since LaunchJuly 02, 2013
Fund Size
(Rs. in mln)
Performance %
Pak Elektron Limited - Sukuk 19-FEB-18 19-MAY-19ENGRO Fertilizer Limited 09-JUL-14 09-JUL-19
2.1% 1.0%
(% of Total Assets)
MCB Bank Limited 19-JUN-14 19-JUN-22 Askari Commercial Bank Limited 30-SEP-14 30-SEP-24 Dawood Hercules Corp Ltd 16-NOV-17 16-NOV-22 BANK ALFALAH LTD - V - REVISED 20-FEB-13 20-FEB-21 JS Bank Limited 14-DEC-16 14-DEC-23 Jahangir Siddiqui and Company Ltd. 18-Jul-17 18-Jul-22 Jahangir Siddiqui and Company Ltd. 08-APR-14 08-APR-19 Jahangir Siddiqui and Company Ltd. 24-Jun-16 24-Jun-21 Total

NAFA Islamic Principal Protected Fund-II (NIPPF-II) NBP FUNDSManaging Your Savings
Page 25
Top Ten Holdings (as on February 28, 2019)
Engro Corporation Ltd
Pak Petroleum Ltd
Engro Fertilizer Ltd
Hub Power Company Ltd
Oil & Gas Dev Co Ltd
Mari Petroleum Company Ltd
Nishat Mills Ltd
Meezan Bank Ltd
Pakistan Oilfields Ltd
Lucky Cement Ltd
Equity
Equity
Equity
Equity
Equity
2.3%
1.7%
1.6%
1.6%
1.2%
Equity
Equity
Equity
Equity
Equity
3.2%
3.2%
3.2%
3.0%
2.4%
% of TotalAssets
% of TotalAssets
Disclaimer: This publication is for informational purposes only and nothing herein should be construed as a solicitation, recommendation or an offer to buy or sell any fund. All investments in mutual funds are subject to market risks. Past performance is not necessarily indicative of future results.Please read the Offering Documents to understand the investment policies and the risk involved. Capital protection only applies to unit holders who hold their investments until initial maturity of two years.
‘
Launch Date: June 27, 2014Fund Size: Rs. 116 millionType: Open-end Shariah Compliant -Capital Protected FundDealing Days: Daily – Monday to FridayDealing Time: (Mon-Thr) 9:00 A.M to 4:30 P.M (Friday) 9:00 A.M to 5:00 P.MSettlement: 2-3 business daysPricing Mechanism: Forward PricingLoad: Back end: 0%Management Fee: Equity component 2% per annum Others: 12% of Net Income (Min 0.5% p.a., Max 1.0% p.a.)Risk Profile: LowTotal Expense Ratio (%) 2.62% p.a (including 0.27% government levies)Listing: Pakistan Stock ExchangeCustodian & Trustee: Central Depository Company (CDC)Auditors: KPMG Taseer Hadi & Co. Chartered AccountantsBenchmark: Daily weighted return of KMI-30 index & Islamic Bank Deposits based on Fund’s actual allocation.Fund Manager: Sajjad Anwar, CFAAsset Manager Rating: AM1 by PACRA (Very High Quality)
The objective of NAFA Islamic Principal Protected Fund-II is to earn a potentially high return through dynamic asset allocation between Shariah Compliant Equities and Money Market investment avenues, while providing principal protection.
Since inception, NIPPF-II has generated a return of 10.6% p.a versus Benchmark return of 8.1% p.a. The current equity exposure stands at around 30%. During the month, maximum multiplier stood at 0.8 whereas minimum multiplier was 0.7. Key holdings of the Fund belong to Oil & Gas Exploration Companies, Fertilizer and Power Generation & Distribution sectors.
February 2019
Since LaunchJune 27, 2014*
10.6%
8.1%
NAFA Islamic Principal Protected Fund-II
Performance Period
Equities / Stocks Cash Equivalents Others including receivables Total Leverage
PER7.88.2
NIPPF-IIKMI-30
PBV1.71.2
DY6.0%6.3%
Dr. Amjad Waheed, CFASajjad Anwar, CFA
Muhammad Ali Bhabha, CFA, FRMTaha Khan Javed, CFA
Hassan Raza, CFA
30.4%65.6%4.0%
100.0%Nil
28-Feb-1929.9%66.6%3.5%
100.0%Nil
31-Jan-19Asset Allocation (% of Total Assets)
Unit Price (28/02/2019): Rs. 102.5557
The scheme has maintained provision against Sindh Workers’ Welfare Fund’s liability to the tune of Rs 3,636,025/-If the same were not made the NAV per unit/ last one year return of scheme would be higher by Rs 3.2167/3.16%. For details investors are advised to read the Note 10.1 of the Financial Statements of the Scheme for the period ended December 31, 2018.
Sindh Workers' Welfare Fund (SWWF)
Feb2019
(0.7%)
(1.2%)
FYTD2019
1.0%
(0.2%)
FY2017
25.8%
16.1%
FY2018
0.8%
1.6%
0.8%
(0.3%)
FY2015
21.0%
12.2%
Last 3Years*
11.7%
9.9%
FY2016
3.3%
8.9%
* Annualized ReturnAll Other returns are Cumulative
The performance reported is net of management fee & all other expenses and based ondividend reinvestment gross of with-holding tax where applicable.
Notes: 1) The calculation of performance does not include cost of front end load.2) Taxes apply. Further, tax credit also available as per section 62 of the Income Tax Ordinance, 2001.
NIPPF-II, 60.4%
KMI-30, 39.7%
Islamic Bank Deposit15.3%
-20.0%
0.0%
20.0%
40.0%
60.0%
80.0%
100.0%
27-Ju
n-14
8-Se
p-14
20-N
ov-1
4
1-Fe
b-15
15-A
pr-1
5
27-Ju
n-15
8-Se
p-15
20-N
ov-1
5
1-Fe
b-16
14-A
pr-1
6
26-Ju
n-16
7-Se
p-16
-Nov
-16
31-Ja
n-17
14-A
pr-1
7
26-Ju
n-17
7-Se
p-17
19-N
ov-1
7
31-Ja
n-18
14-A
pr-1
8
26-Ju
n-18
7-Se
p-18
19-N
ov-1
8
28-F
eb-1
9
NIPPF-II KMI-30 Islamic Bank DepositCumulative
ReturnAnnualized Return 10.6% 7.4% 3.1%Annualized STDEV (Risk) 7.4% 17.8% 0.05%
Relative Performance of NAFA Islamic Principal Protected Fund-II (NIPPF-II)Since Inception on June 27, 2014
Top Five Sectors (% of Total Assets) (as on February 28, 2019)
Oil & Gas Exploration Companies Fertilizer Power Generation & Distribution Cement Textile Composite Others
9.4%6.4%3.5%3.3%1.8%6.0%
Rolling12 Months
** Based on NBP Funds estimates
%

NAFA Islamic Active Allocation Plan-I (NIAAP-I) NBP FUNDSManaging Your Savings
Page 26
The performance reported is net of management fee & all other expenses and based on dividendreinvestment gross of with-holding tax where applicable.
PER8.28.2
NIAAEFKMI-30
PBV1.61.2
DY6.0%6.3%
NAFA Islamic Active Allocation Equity FundNAFA Active Allocation Riba Free Savings FundTotal
58.7%33.4%92.1%
Top Holdings (% age of total assets)(as on February 28, 2019)
* Annualized ReturnAll Other returns are Cumulative
‘
Launch Date: January 15, 2016Fund Size: Rs. 301 millionType: Open Ended Shariah Compliant Fund of Funds Dealing Days: Daily – Monday to FridayDealing Time: (Mon - Thr) 9:00 A.M to 4:30 P.M (Friday) 9:00 A.M to 5:00 P.MSettlement: 2-3 business daysPricing Mechanism: Forward PricingBack end Load: Nil 1) On invested amount in NBP funds, noManagement Fee: additional fee. 2) Cash in Bank account: 1.25% p.a.Total Expense Ratio (%): 0.51% p.a (including 0.12% government levies)Risk Profile: Low to moderateListing: Pakistan Stock ExchangeCustodian & Trustee: Central Depository Company (CDC)Auditors: A. F. Ferguson & Co. Chartered AccountantsBenchmark:** Daily weighted return of KMI-30 Index & 6-month average deposit rates of three A rated Islamic Banks/Islamic windows of conventional banks as selected by MUFAP, based on Fund's actual allocation (which is combination of benchmarks of underlying schemes)Fund Manager: Sajjad Anwar, CFAAsset Manager Rating: AM1 by PACRA (Very High Quality)
The objective of the Fund is to provide investors an opportunity to earn attractive return from an actively managed portfolio of Shari’ah Compliant Equity Fund and Income Fund.
NBP Funds launched its NAFA Islamic Active Allocation Plan-I (NIAAP-I) in January, 2016 which is the first plan under NAFA Islamic Active Allocation Fund-I. The Active Allocation Plan is dynamically managed between dedicated equity related and income schemes managed by NBP Funds based on the Fund Manager’s outlook of the authorized asset-classes. The Plan is presently closed for new subscription. NIAAP-I has an initial maturity of two years. Since inception, NIAAP-I has generated a return of 6.2% p.a versus Benchmark return of 6.6% p.a. The current exposure in Income Fund and Equity Fund stands at 33.4% & 58.7%, respectively. The Plan can invest up to 100% in equity funds. We are confident that the Plan will generate good returns considering the improved macroeconomic and political outlook and dynamic equity allocation mechanism of the Fund.
February 2019
Since Launch*January 15, 2016
6.2%
6.6%
Feb2019
(1.7%)
(2.3%)
FYTD2019
(0.5%)
(1.2%)
FY2017
24.3%
16.3%
Last 3year*
6.3%
6.2%
FY2018
(12.0%)
(8.5%)
Rolling12 Months
(2.1%)
(2.4%)
NAFA Islamic Active Allocation Plan-I
Performance Period
Shariah Compliant Funds Cash Equivalents Others including receivables Total Leverage
92.1%7.8%0.1%
100.0%Nil
28-Feb-1993.2%6.6%0.2%
100.0%Nil
31-Jan-19Asset Allocation (% of Total Assets)
Unit Price (28/02/2019): Rs. 116.1243
Disclaimer: This publication is for informational purposes only and nothing herein should be construed as a solicitation, recommendation or an offer to buy or sell any fund. All investments in mutual funds are subject to market risks.Past performance is not necessarily indicative of future results. Please read the Offering Documents to understand the investment policies and the risks involved.
%
Dr. Amjad Waheed, CFASajjad Anwar, CFA
Muhammad Ali Bhabha, CFA, FRMTaha Khan Javed, CFA
Hassan Raza, CFA
Notes: 1) The calculation of performance does not include cost of front end load.2) Taxes apply. Further, tax credit also available as per section 62 of the Income Tax Ordinance, 2001.
** effective from September 01, 2016; Previously daily weighted return of KMI-30 index & 6 month deposit rateof A- and above rated Islamic banks and windows based on actual investment.
The scheme has maintained provision against Sindh Workers’ Welfare Fund’s liability to the tune of Rs 4,843,024/-If the same were not made the NAV per unit/ last one year return of scheme would be higher by Rs 1.8659/1.57%. For details investors are advised to read the Note 9.1 of the Financial Statements of the Scheme for the period ended December 31, 2018.
Sindh Workers' Welfare Fund (SWWF)
*** Based on NBP Funds estimates

NAFA Islamic Active Allocation Plan-II (NIAAP-II) NBP FUNDSManaging Your Savings
Page 27
The performance reported is net of management fee & all other expenses and based on dividendreinvestment gross of with-holding tax where applicable.
PER8.28.2
NIAAEFKMI-30
PBV1.61.2
DY6.0%6.3%
NAFA Islamic Active Allocation Equity FundNAFA Active Allocation Riba Free Savings FundTotal
58.3%36.8%95.1%
Top Holdings (%age of total assets)(as on February 28, 2019)
* Annualized ReturnAll other returns are cumulative
‘
Launch Date: March 04, 2016Fund Size: Rs. 150 millionType: Open Ended Shariah Compliant Fund of Funds Dealing Days: Daily – Monday to FridayDealing Time: (Mon - Thr) 9:00 A.M to 4:30 P.M (Friday) 9:00 A.M to 5:00 P.MSettlement: 2-3 business daysPricing Mechanism: Forward PricingBack end Load: Nil 1) On invested amount in NBP funds, noManagement Fee: additional fee. 2) Cash in Bank account: 1.25% p.a.Total Expense Ratio (%): 0.51% p.a (including 0.11% government levies)Risk Profile: Low to moderateListing: Pakistan Stock ExchangeCustodian & Trustee: Central Depository Company (CDC)Auditors: A. F. Ferguson & Co. Chartered AccountantsBenchmark:** Daily weighted return of KMI-30 Index & 6-month average deposit rates of three A rated Islamic Banks/Islamic windows of conventional banks as selected by MUFAP, based on Fund's actual allocation (which is combination of benchmarks of underlying schemes)Fund Manager: Sajjad Anwar, CFAAsset Manager Rating: AM1 by PACRA (Very High Quality)
The objective of the Fund is to provide investors an opportunity to earn attractive return from an actively managed portfolio of Shari’ah Compliant Equity Fund and Income Fund.
NBP Funds launched its NAFA Islamic Active Allocation Plan-II (NIAAP-II) in March 2016 which is the second plan under NAFA Islamic Active Allocation Fund-I. The Active Allocation Plan is dynamically managed between dedicated equity related and income schemes managed by NBP Funds based on the Fund Manager’s outlook of the authorized asset-classes. The Plan is presently closed for new subscription. NIAAP-II has an initial maturity of two years. Since inception, NIAAP-II has generated a return of 5.5% p.a versus Benchmark return of 5.1% p.a. The current exposure in Income Fund and Equity Fund stands at 36.8% & 58.3% respectively. The Plan can invest up to 100% in equity funds. We are confident that the Plan will generate good returns considering the improved macroeconomic and political outlook and dynamic equity allocation mechanism of the Fund.
February 2019
Feb2019
(1.8%)
(2.3%)
FYTD2019
(0.5%)
(1.4%)
FY2017
23.6%
15.9%
FY2018
(11.1%)
(8.1%)
Rolling12 Months
Since Launch*March 04, 2016
5.5%
5.1%
(2.2%)
(2.9%)
NAFA Islamic Active Allocation Plan-II
Performance Period
Shariah Compliant Funds Cash Equivalents Others including receivables Total Leverage
95.1%4.5%0.4%
100.0%Nil
28-Feb-19
85.0%14.7%0.3%
100.0%Nil
31-Jan-19Asset Allocation (% of Total Assets)
Unit Price (28/02/2019): Rs. 108.7059
Dr. Amjad Waheed, CFASajjad Anwar, CFA
Muhammad Ali Bhabha, CFA, FRMTaha Khan Javed, CFA
Hassan Raza, CFA
Disclaimer: This publication is for informational purposes only and nothing herein should be construed as a solicitation, recommendation or an offer to buy or sell any fund. All investments in mutual funds are subject to market risks.Past performance is not necessarily indicative of future results. Please read the Offering Documents to understand the investment policies and the risks involved.
Notes: 1) The calculation of performance does not include cost of front end load.2) Taxes apply. Further, tax credit also available as per section 62 of the Income Tax Ordinance, 2001.
** effective from September 01, 2016; Previously daily weighted return of KMI-30 index & 6 month deposit rateof A- and above rated Islamic banks and windows based on actual investment.
The scheme has maintained provision against Sindh Workers’ Welfare Fund’s liability to the tune of Rs 3,957,147/-If the same were not made the NAV per unit/ last one year return of scheme would be higher by Rs 2.8666/2.58%. For details investors are advised to read the Note 9.1 of the Financial Statements of the Scheme for the period ended December 31, 2018.
Sindh Workers' Welfare Fund (SWWF)
%
*** Based on NBP Funds estimates

NAFA Islamic Active Allocation Plan-III (NIAAP-III) NBP FUNDSManaging Your Savings
Page 28
The performance reported is net of management fee & all other expenses and based on dividendreinvestment gross of with-holding tax where applicable.
PER8.28.2
NIAAEFKMI-30
PBV1.61.2
DY6.0%6.3%
NAFA Islamic Active Allocation Equity FundNAFA Active Allocation Riba Free Savings FundTotal
59.5%32.7%92.2%
Top Holdings (% age of total assets)(as on February 28, 2019)
* Annualized ReturnsAll other returns are cumulative
‘
Launch Date: June 28, 2016Fund Size: Rs. 458 millionType: Open Ended Shariah Compliant Fund of Funds Dealing Days: Daily – Monday to FridayDealing Time: (Mon - Thr) 9:00 A.M to 4:30 P.M (Friday) 9:00 A.M to 5:00 P.MSettlement: 2-3 business daysPricing Mechanism: Forward PricingBack end Load: Nil 1) On invested amount in NBP funds, noManagement Fee: additional fee. 2) Cash in Bank account: 1.25% p.a.Total Expense Ratio (%): 0.50% p.a (including 0.15% government levies)Risk Profile: Low to moderate Listing: Pakistan Stock ExchangeCustodian & Trustee: Central Depository Company (CDC)Auditors: A. F. Ferguson & Co. Chartered AccountantsBenchmark:** Daily weighted return of KMI-30 Index & 6-month average deposit rates of three A rated Islamic Banks/Islamic windows of conventional banks as selected by MUFAP, based on Fund's actual allocation (which is combination of benchmarks of underlying schemes)Fund Manager: Sajjad Anwar, CFAAsset Manager Rating: AM1 by PACRA (Very High Quality)
The objective of the Fund is to provide investors an opportunity to earn attractive return from an actively managed portfolio of Shari’ah Compliant Equity Fund and Income Fund.
NBP Funds launched its NAFA Islamic Active Allocation Plan-III (NIAAP-III) in June 2016 which is the third plan under NAFA Islamic Active Allocation Fund-I. The Active Allocation Plan is dynamically managed between dedicated equity related and income schemes managed by NBP Funds based on the Fund Manager’s outlook of the authorized asset-classes. The Plan is presently closed for new subscription. NIAAP-III has an initial maturity of two years. Since inception, NIAAP-III has generated a return of 3.7% p.a versus Benchmark return of 3.2% p.a. The current exposure in Income Fund and Equity Fund stands at 32.7% & 59.5%, respectively. The Plan can invest up to 100% in equity funds. We are confident that the Plan will generate good returns considering the improved macroeconomic and political outlook and dynamic equity allocation mechanism of the Fund.
February 2019
Since Launch*June 28, 2016
3.7%
3.2%
Feb2019
(1.8%)
(2.3%)
FYTD2019
0.6%
0.2%
FY2017
20.0%
13.4%
FY2018
(8.9%)
(5.0%)
(0.5%)
(0.3%)
NAFA Islamic Active Allocation Plan-III
Performance Period
Shariah Compliant Funds Cash Equivalents Other including receivablesTotal Leverage
92.2%7.8%
-100.0%
Nil
28-Feb-1991.7%8.2%0.1%
100.0%Nil
31-Jan-19Asset Allocation (% of Total Assets)
Unit Price (28/02/2019): Rs. 107.1995
Disclaimer: This publication is for informational purposes only and nothing herein should be construed as a solicitation, recommendation or an offer to buy or sell any fund. All investments in mutual funds are subject to market risks.Past performance is not necessarily indicative of future results. Please read the Offering Documents to understand the investment policies and the risks involved.
%
Dr. Amjad Waheed, CFASajjad Anwar, CFA
Muhammad Ali Bhabha, CFA, FRMTaha Khan Javed, CFA
Hassan Raza, CFA
Notes: 1) The calculation of performance does not include cost of front end load.2) Taxes apply. Further, tax credit also available as per section 62 of the Income Tax Ordinance, 2001.
** effective from September 01, 2016; Previously daily weighted return of KMI-30 index & 6 month deposit rateof A- and above rated Islamic banks and windows based on actual investment.
The scheme has maintained provision against Sindh Workers’ Welfare Fund’s liability to the tune of Rs 3,922,781/-If the same were not made the NAV per unit/ last one year return of scheme would be higher by Rs 0.9189/0.85%. For details investors are advised to read the Note 9.1 of the Financial Statements of the Scheme for the period ended December 31, 2018.
Sindh Workers' Welfare Fund (SWWF)
Rolling12 Months
*** Based on NBP Funds estimates

NAFA Islamic Active Allocation Plan-IV (NIAAP-IV) NBP FUNDSManaging Your Savings
Page 29
PER8.28.2
NIAAEF**KMI-30
PBV1.61.2
DY6.0%6.3%
NAFA Islamic Active Allocation Equity Fund NAFA Active Allocation Riba Free Savings FundTotal
59.8%34.7%94.5%
Top Holdings (%age of total assets)(as on February 28, 2019)
* Annualized ReturnAll Other returns are Cumulative
‘
Launch Date: September 30, 2016Fund Size: Rs. 342 millionType: Open Ended Shariah Compliant Fund of Funds Dealing Days: Daily – Monday to FridayDealing Time: (Mon - Thr) 9:00 A.M to 4:30 P.M (Friday) 9:00 A.M to 5:00 P.MSettlement: 2-3 business daysPricing Mechanism: Forward PricingBack end Load: NilManagement Fee: 1) On invested amount in NBP funds, no additional fee. 2) Cash in Bank account: 1.25% p.a.Total Expense Ratio (%): 0.52% p.a (including 0.11% government levies)Risk Profile: Low to moderateListing: Pakistan Stock ExchangeCustodian & Trustee: Central Depository Company (CDC)Auditors: A. F. Ferguson & Co. Chartered AccountantsBenchmark: Daily weighted return of KMI-30 Index & 6-month average deposit rates of three A rated Islamic Banks/Islamic windows of conventional banks as selected by MUFAP, based on Fund's actual allocation (which is combination of benchmarks of underlying schemes)Fund Manager: Sajjad Anwar, CFAAsset Manager Rating: AM1 by PACRA (Very High Quality)
The objective of the Fund is to provide investors an opportunity to earn attractive return from an actively managed portfolio of Shari’ah Compliant Equity Fund and Income Fund.
NBP Funds launched its NAFA Islamic Active Allocation Plan-IV (NIAAP-IV) in September, 2016 which is the fourth plan under NAFA Islamic Active Allocation Fund-I. The Active Allocation Plan is dynamically managed between dedicated equity related and income schemes managed by NBP Funds based on the Fund Manager’s outlook of the authorized asset-classes. The Plan is presently closed for new subscription. NIAAP-IV has an initial maturity of two years.
Since inception, unit price of NIAAP-IV has increased by of 0.4% p.a versus the Benchmark return of 1.4% p.a. The current exposure in Income Fund and Equity Fund stands at 34.7% & 59.8%, respectively. The Plan can invest up to 100% in equity funds. We are confident that the Plan will generate good returns considering the improved macroeconomic and political outlook and dynamic equity allocation mechanism of the Fund.
February 2019
Since Launch*September 30, 2016
0.4%
1.4%
Feb2019
(1.7%)
(2.2%)
FYTD2019
(0.4%)
(0.7%)
(2.4%)
(2.2%)
NAFA Islamic Active Allocation Plan-IV
Performance Period
Shariah Compliant Funds Cash Equivalents Others including receivables Total Leverage
94.5%5.3%0.2%
100.0%Nil
28-Feb-19
96.2%3.7%0.1%
100.0%Nil
31-Jan-19Asset Allocation (% of Total Assets)
Unit Price (28/02/2019): Rs. 97.1825
Disclaimer: This publication is for informational purposes only and nothing herein should be construed as a solicitation, recommendation or an offer to buy or sell any fund. All investments in mutual funds are subject to market risks.Past performance is not necessarily indicative of future results. Please read the Offering Documents to understand the investment policies and the risks involved.
%
Dr. Amjad Waheed, CFASajjad Anwar, CFA
Muhammad Ali Bhabha, CFA, FRMTaha Khan Javed, CFA
Hassan Raza, CFA
Notes: 1) The calculation of performance does not include cost of front end load.2) Taxes apply. Further, tax credit also available as per section 62 of the Income Tax Ordinance, 2001.
The scheme has maintained provision against Sindh Workers’ Welfare Fund’s liability to the tune of Rs 1,739,910/-If the same were not made the NAV per unit/ last one year return of scheme would be higher by Rs 0.4941/0.50%. For details investors are advised to read the Note 9.1 of the Financial Statements of the Scheme for the period ended December 31, 2018.
Sindh Workers' Welfare Fund (SWWF)
Rolling12 Months
(9.6%)
(5.9%)
FY 2018
The performance reported is net of management fee & all other expenses and based on dividendreinvestment gross of with-holding tax where applicable.
** Based on NBP Funds estimates

NAFA Islamic Active Allocation Plan-V (NIAAP-V) NBP FUNDSManaging Your Savings
Page 30
[Returns are net of management fee & all other expenses]
PER8.28.2
NIAAEF**KMI-30
PBV1.61.2
DY6.0%6.3%
NAFA Islamic Active Allocation Equity FundNAFA Active Allocation Riba Free Savings FundTotal
64.1%31.7%95.8%
Top Holdings (%age of total assets)(as on February 28, 2019)
* Annualized Return All Other returns are Cumulative
‘
Launch Date: January 12, 2017 Fund Size: Rs. 515 million Type: Open Ended Shariah Compliant Fund of Funds Dealing Days: Daily – Monday to FridayDealing Time: (Mon - Thr) 9:00 A.M to 4:30 P.M (Friday) 9:00 A.M to 5:00 P.MSettlement: 2-3 business days Pricing Mechanism: Forward Pricing Back end Load: Nil Management Fee: 1) On invested amount in NBP funds, no additional fee. 2) Cash in Bank account: 1.25% p.a.Total Expense Ratio (%): 0.49% p.a (including 0.12% government levies) Risk Profile: Low to moderate Listing: Pakistan Stock Exchange Custodian & Trustee: Central Depository Company (CDC)Auditors: A. F. Ferguson & Co. Chartered AccountantsBenchmark: Daily weighted return of KMI-30 Index & 6-month average deposit rates of three A rated Islamic Banks/Islamic windows of conventional banks as selected by MUFAP, based on Fund's actual allocation (which is combination of benchmarks of underlying schemes)Fund Manager: Sajjad Anwar, CFA Asset Manager Rating: AM1 by PACRA (Very High Quality)
The objective of the Fund is to provide investors an opportunity to earn attractive return from an actively managed portfolio of Shari’ah Compliant Equity Fund and Income Fund.
NBP Funds launched its NAFA Islamic Active Allocation Plan-V (NIAAP-V) in January, 2017 which is the fifth plan under NAFA Islamic Active Allocation Fund-I. The Active Allocation Plan is dynamically managed between dedicated equity related and income schemes managed by NBP Funds based on the Fund Manager’s outlook of the authorized asset-classes. The Plan is presently closed for new subscription. NIAAP-V has an initial maturity of two years.
Since inception, unit price of NIAAP-V has decreased by 5.3% p.a versus the Benchmark decline of 5.2% p.a. The current exposure in Income Fund and Equity Fund stands at 31.7% & 64.1%, respectively. The Plan can invest up to 100% in equity funds. We are confident that the Plan will generate good returns considering the improved macroeconomic and political outlook and dynamic equity allocation mechanism of the Fund.
February 2019
Feb2019
(1.8%)
(2.3%)
FYTD2019
(0.6%)
(1.3%)
Rolling12 Months
(2.4%)
(2.7%)
FY2018
(9.1%)
(4.9%)
Since Launch*January 12 , 2017
(5.3%)
(5.2%)
NAFA Islamic Active Allocation Plan-V
Performance Period
Shariah Compliant Funds Cash Equivalents Others including receivables Total Leverage
95.8%1.1%3.1%
100.0%Nil
28-Feb-19
94.6%5.3%0.1%
100.0%Nil
31-Jan-19Asset Allocation (% of Total Assets)
Unit Price (28/02/2019): Rs. 89.0941
Disclaimer: This publication is for informational purposes only and nothing herein should be construed as a solicitation, recommendation or an offer to buy or sell any fund. All investments in mutual funds are subject to market risks.Past performance is not necessarily indicative of future results. Please read the Offering Documents to understand the investment policies and the risks involved.
%
Dr. Amjad Waheed, CFASajjad Anwar, CFA
Muhammad Ali Bhabha, CFA, FRMTaha Khan Javed, CFA
Hassan Raza, CFA
Notes: 1) The calculation of performance does not include cost of front end load.2) Taxes apply. Further, tax credit also available as per section 62 of the Income Tax Ordinance, 2001.
** Based on NBP Funds estimates

NAFA Islamic Active Allocation Plan-VI (NIAAP-VI) NBP FUNDSManaging Your Savings
Page 31
[Returns are net of management fee & all other expenses]
PER8.28.2
NIAAEF**KMI-30
PBV1.61.2
DY6.0%6.3%
NAFA Islamic Active Allocation Equity FundNAFA Active Allocation Riba Free Savings FundTotal
60.8%32.0%92.8%
Top Holdings (%age of total assets)(as on February 28, 2019)
* Annualized ReturnAll Other returns are Cumulative
‘
Launch Date: May 26, 2017 Fund Size: Rs. 319 million Type: Open Ended Shariah Compliant Fund of Funds Dealing Days: Daily – Monday to FridayDealing Time: (Mon - Thr) 9:00 A.M to 4:30 P.M (Friday) 9:00 A.M to 5:00 P.MSettlement: 2-3 business days Pricing Mechanism: Forward Pricing Back end Load: Nil Management Fee: 1) On invested amount in NBP funds, no additional fee. 2) Cash in Bank account: 1.25% p.a.Total Expense Ratio (%): 0.56% p.a (including 0.12% government levies) Risk Profile: Low to moderate Listing: Pakistan Stock Exchange Custodian & Trustee: Central Depository Company (CDC)Auditors: KPMG Taseer Hadi & Co. Chartered AccountantsBenchmark: Daily weighted return of KMI-30 Index & 6-month average deposit rates of three A rated Islamic Banks/Islamic windows of conventional banks as selected by MUFAP, based on Fund's actual allocation (which is combination of benchmarks of underlying schemes)Fund Manager: Sajjad Anwar, CFA Asset Manager Rating: AM1 by PACRA (Very High Quality)
The objective of the Fund is to provide investors an opportunity to earn attractive return from an actively managed portfolio of Shari’ah Compliant Equity Fund and Income Fund.
NBP Funds launched its NAFA Islamic Active Allocation Plan-VI (NIAAP-VI) in May, 2017 which is the first plan under NAFA Islamic Active Allocation Fund-II. The Active Allocation Plan is dynamically managed between dedicated equity related and income schemes managed by NBP Funds based on the Fund Manager’s outlook of the authorized asset-classes. The Plan is presently closed for new subscription. NIAAP-VI has an initial maturity of two years.
Since inception, unit price of NIAAP-VI has decreased by 7.9% p.a versus the Benchmark decline of 7.1% p.a. The current exposure in Income Fund and Equity Fund stands at 32.0% & 60.8%, respectively. The Plan can invest up to 100% in equity funds. We are confident that the Plan will generate good returns considering the improved macroeconomic and political outlook and dynamic equity allocation mechanism of the Fund.
February 2019
Feb2019
(1.8%)
(2.3%)
Rolling12 Months
(2.4%)
(2.7%)
FY2018
(7.8%)
(3.8%)
FYTD2019
(0.7%)
(1.4%)
Since Launch*May 26 , 2017
(7.9%)
(7.1%)
NAFA Islamic Active Allocation Plan-VI
Performance Period
Shariah Compliant Funds Cash Equivalents Others including receivables Total Leverage
92.8%6.9%0.3%
100.0%Nil
28-Feb-19
92.2%7.6%0.2%
100.0%Nil
31-Jan-19Asset Allocation (% of Total Assets)
Unit Price (28/02/2019): Rs. 86.4910
Disclaimer: This publication is for informational purposes only and nothing herein should be construed as a solicitation, recommendation or an offer to buy or sell any fund. All investments in mutual funds are subject to market risks.Past performance is not necessarily indicative of future results. Please read the Offering Documents to understand the investment policies and the risks involved.
%
Dr. Amjad Waheed, CFASajjad Anwar, CFA
Muhammad Ali Bhabha, CFA, FRMTaha Khan Javed, CFA
Hassan Raza, CFA
Notes: 1) The calculation of performance does not include cost of front end load.2) Taxes apply. Further, tax credit also available as per section 62 of the Income Tax Ordinance, 2001.
** Based on NBP Funds estimates

NAFA Islamic Active Allocation Plan-VII (NIAAP-VII) NBP FUNDSManaging Your Savings
Page 32
[Returns are net of management fee & all other expenses]
PER8.28.2
NIAAEF**KMI-30
PBV1.61.2
DY6.0%6.3%
NAFA Islamic Active Allocation Equity FundNAFA Active Allocation Riba Free Savings FundTotal
60.4%30.9%91.3%
Top Holdings (%age of total assets)(as on February 28, 2019)
* Annualized Return All Other returns are Cumulative
‘
Launch Date: June 29, 2017 Fund Size: Rs. 117 million Type: Open Ended Shariah Compliant Fund of FundsDealing Days: Daily – Monday to Friday Dealing Time: (Mon - Thr) 9:00 A.M to 4:30 P.M (Friday) 9:00 A.M to 5:00 P.MSettlement: 2-3 business days Pricing Mechanism: Forward Pricing Back end Load: Nil Management Fee: 1) On invested amount in NBP funds, no additional fee. 2) Cash in Bank account: 1.25% p.a. Total Expense Ratio (%): 0.65% p.a (including 0.12% government levies) Risk Profile: Low to moderate Listing: Pakistan Stock Exchange Custodian & Trustee: Central Depository Company (CDC) Auditors: KPMG Taseer Hadi & Co. Chartered Accountants Benchmark: Daily weighted return of KMI-30 Index & 6-month average deposit rates of three A rated Islamic Banks/Islamic windows of conventional banks as selected by MUFAP, based on Fund's actual allocation (which is combination of benchmarks of underlying schemes) Fund Manager: Sajjad Anwar, CFA Asset Manager Rating: AM1 by PACRA (Very High Quality)
The objective of the Fund is to provide investors an opportunity to earn attractive return from an actively managed portfolio of Shari’ah Compliant Equity Fund and Income Fund.
NBP Funds launched its NAFA Islamic Active Allocation Plan-VII (NIAAP-VII) in June, 2017 which is the second plan under NAFA Islamic Active Allocation Fund-II. The Active Allocation Plan is dynamically managed between dedicated equity related and income schemes managed by NBP Funds based on the Fund Manager’s outlook of the authorized asset-classes. The Plan is presently closed for new subscription. NIAAP-VII has an initial maturity of two years.
Since inception, unit price of NIAAP-VII has decreased by 4.3% p.a versus the Benchmark decline of 2.9% p.a. The current exposure in Income Fund and Equity Fund stands at 30.9% & 60.4%, respectively. The Plan can invest up to 100% in equity funds. We are confident that the Plan will generate good returns considering the improved macroeconomic and political outlook and dynamic equity allocation mechanism of the Fund.
February 2019
Feb2019
(1.8%)
(2.2%)
Rolling12 Months
(2.4%)
(2.6%)
FY2018
(6.5%)
(3.0%)
FYTD2019
(0.6%)
(1.2%)
Since Launch*June 29 , 2017
(4.3%)
(2.9%)
NAFA Islamic Active Allocation Plan-VII
Performance Period
Shariah Compliant Funds Cash Equivalents Others including receivables Total Leverage
91.3%8.4%0.3%
100.0%Nil
28-Feb-19
90.6%9.2%0.2%
100.0%Nil
31-Jan-19Asset Allocation (% of Total Assets)
Unit Price (28/02/2019): Rs. 92.8930
Disclaimer: This publication is for informational purposes only and nothing herein should be construed as a solicitation, recommendation or an offer to buy or sell any fund. All investments in mutual funds are subject to market risks.Past performance is not necessarily indicative of future results. Please read the Offering Documents to understand the investment policies and the risks involved.
%
Dr. Amjad Waheed, CFASajjad Anwar, CFA
Muhammad Ali Bhabha, CFA, FRMTaha Khan Javed, CFA
Hassan Raza, CFA
Notes: 1) The calculation of performance does not include cost of front end load.2) Taxes apply. Further, tax credit also available as per section 62 of the Income Tax Ordinance, 2001.
** Based on NBP Funds estimates

NAFA Islamic Active Allocation Plan-VIII (NIAAP-VIII) NBP FUNDSManaging Your Savings
Page 33
[Returns are net of management fee & all other expenses]
PER8.28.2
NIAAEF**KMI-30
PBV1.61.2
DY6.0%6.3%
NAFA Islamic Active Allocation Equity FundNAFA Active Allocation Riba Free Savings FundTotal
61.4%31.4%92.8%
Top Holdings (%age of total assets)(as on February 28, 2019)
* Annualized Return All Other returns are Cumulative
‘
Launch Date: November 3, 2017 Fund Size: Rs. 489 million Type: Open Ended Shariah Compliant Fund of FundsDealing Days: Daily – Monday to Friday Dealing Time: (Mon - Thr) 9:00 A.M to 4:30 P.M (Friday) 9:00 A.M to 5:00 P.MSettlement: 2-3 business days Pricing Mechanism: Forward Pricing Back end Load: Nil Management Fee: 1) On invested amount in NBP funds, no additional fee. 2) Cash in Bank account: 1.25% p.a. Total Expense Ratio (%): 0.49% p.a (including 0.12% government levies) Risk Profile: Low to moderate Listing: Pakistan Stock Exchange Custodian & Trustee: Central Depository Company (CDC) Auditors: KPMG Taseer Hadi & Co. Chartered Accountants Benchmark: Daily weighted return of KMI-30 Index & 6-month average deposit rates of three A rated Islamic Banks/Islamic windows of conventional banks as selected by MUFAP, based on Fund's actual allocation (which is combination of benchmarks of underlying schemes) Fund Manager: Sajjad Anwar, CFA Asset Manager Rating: AM1 by PACRA (Very High Quality)
The objective of the Fund is to provide investors an opportunity to earn attractive return from an actively managed portfolio of Shari’ah Compliant Equity Fund and Income Fund.
NBP Funds launched its NAFA Islamic Active Allocation Plan-VIII (NIAAP-VIII) in November, 2017 which is the third plan under NAFA Islamic Active Allocation Fund-II. The Active Allocation Plan is dynamically managed between dedicated equity related and income schemes managed by NBP Funds based on the Fund Manager’s outlook of the authorized asset-classes. The Plan is presently closed for new subscription. NIAAP-VIII has an initial maturity of two years.
Since inception, unit price of NIAAP-VIII has decreased by 0.2% p.a versus the Benchmark return of 0.3% p.a. The current exposure in Income Fund and Equity Fund stands at 31.4% & 61.4%, respectively. The Plan can invest up to 100% in equity funds. We are confident that the Plan will generate good returns considering the improved macroeconomic and political outlook and dynamic equity allocation mechanism of the Fund.
February 2019
Feb2019
(1.8%)
(2.3%)
FYTD2019
(0.6%)
(1.3%)
Rolling12 Months
(2.5%)
(2.7%)
Since Launch*November 03 , 2017
(0.2%)
0.3%
NAFA Islamic Active Allocation Plan-VIII
Performance Period
Shariah Compliant Funds Cash Equivalents Others including receivables Total Leverage
92.8%7.0%0.2%
100.0%Nil
28-Feb-1993.4%6.4%0.2%
100.0%Nil
31-Jan-19Asset Allocation (% of Total Assets)
Unit Price (28/02/2019): Rs. 99.6771
Disclaimer: This publication is for informational purposes only and nothing herein should be construed as a solicitation, recommendation or an offer to buy or sell any fund. All investments in mutual funds are subject to market risks.Past performance is not necessarily indicative of future results. Please read the Offering Documents to understand the investment policies and the risks involved.
%
Dr. Amjad Waheed, CFASajjad Anwar, CFA
Muhammad Ali Bhabha, CFA, FRMTaha Khan Javed, CFA
Hassan Raza, CFA
Notes: 1) The calculation of performance does not include cost of front end load.2) Taxes apply. Further, tax credit also available as per section 62 of the Income Tax Ordinance, 2001.
The scheme has maintained provision against Sindh Workers’ Welfare Fund’s liability to the tune of Rs 100,520/-If the same were not made the NAV per unit/ since inception return of scheme would be higher by Rs 0.0205/0.02%. For details investors are advised to read the Note 11.1 of the Financial Statements of the Scheme for the period ended December 31, 2018.
Sindh Workers' Welfare Fund (SWWF)
** Based on NBP Funds estimates

NAFA Islamic Capital Preservation Plan-I (NICPP-I) NBP FUNDSManaging Your Savings
Page 34
PER8.28.2
NIAAEF**KMI-30
PBV1.61.2
DY6.0%6.3%
NAFA Islamic Money Market FundNAFA Islamic Active Allocation Equity FundTotal
74.2%22.8%97.0%
Top Holdings (%age of total assets)(as on February 28, 2019)
* Cumulative Returns
‘
Launch Date: February 28, 2018Fund Size: Rs. 1,113 millionType: Open Ended Shariah Compliant Fund of Funds - CPPIDealing Days: Daily – Monday to FridayDealing Time: (Mon-Thr) 9:00 A.M to 4:30 P.M (Friday) 9:00 A.M to 5:00 P.MSettlement: 2-3 business daysPricing Mechanism: Forward PricingBack end Load: NilManagement Fee: 1) On invested amount in NBP funds, no additional fee. 2) Cash in Bank account: 1.0% p.a.Total Expense Ratio (%): 0.46% p.a (including 0.18% government levies)Risk Profile: Low Listing: Pakistan Stock ExchangeCustodian & Trustee: Central Depository Company (CDC)Auditors: KPMG Taseer Hadi & Co. Chartered Accountants Benchmark: Daily Weighted Return of KMI-30 Index and 3-months average deposit rate of three AA rated Islamic Banks or Islamic windows of Conventional Banks as selected by MUFAP, on the basis of actual investment by the Plan in equity and money market schemes.Fund Manager: Sajjad Anwar, CFA Asset Manager Rating: AM1 by PACRA (Very High Quality)
The objective of NAFA Islamic Capital Preservation Plan-I is to earn a potentially high return through dynamic asset allocation between Shariah Compliant Dedicated Equity and Money Market based Collective Investment Schemes, while providing Capital Preservation of the Initial Investment Value including sales load at completion of twenty four months and beyond.
NBP Funds launched its NAFA Islamic Capital Preservation Plan-I (NICPP-I) in February, 2018 which is the fourth plan under NAFA Islamic Active Allocation Fund-II. The Plan is dynamically allocated between the Equity Component and Money Market Component by using the Constant Proportion Portfolio Insurance (CPPI) Methodology. Allocation to Equity Component is generally increased when equity market is rising, while allocation to the Money Market Component is generally increased when the equity market declines. The Plan is presently closed for new subscription. NICPP-I has an initial maturity of two years.
Since inception, unit price of NICPP-I has increased by 2.6% versus the Benchmark return of 1.2%. The current exposure in Money Market Fund and Equity Fund stands at 74.2% & 22.8%, respectively. During the month, maximum multiplier stood at 3.0 whereas minimum multiplier was 2.7.
February 2019
Feb2019
(0.2%)
(0.7%)
FYTD2019
2.2%
1.0%
Rolling 12Months
2.6%
1.2%
Since LaunchFebruary 28 , 2018
2.6%
1.2%
NAFA Islamic Capital Preservation Plan-I
Performance Period
Shariah Compliant Funds Cash Equivalents Others including receivables Total Leverage
97.0%2.9%0.1%
100.0%Nil
28-Feb-19
97.0%2.9%0.1%
100.0%Nil
31-Jan-19Asset Allocation (% of Total Assets)
Unit Price (28/02/2019): Rs. 102.2100
Disclaimer: This publication is for informational purposes only and nothing herein should be construed as a solicitation, recommendation or an offer to buy or sell any fund. All investments in mutual funds are subject to market risks.Past performance is not necessarily indicative of future results. Please read the Offering Documents to understand the investment policies and the risks involved. Capital preservation only applies to unit holders who hold their investments until initial maturity of two years.
%*
Dr. Amjad Waheed, CFASajjad Anwar, CFA
Muhammad Ali Bhabha, CFA, FRMTaha Khan Javed, CFA
Hassan Raza, CFA
Notes: 1) The calculation of performance does not include cost of front end load.2) Taxes apply. Further, tax credit also available as per section 62 of the Income Tax Ordinance, 2001.
The scheme has maintained provision against Sindh Workers’ Welfare Fund’s liability to the tune of Rs 816,198/-If the same were not made the NAV per unit/ since inception return of scheme would be higher by Rs 0.075/0.08%. For details investors are advised to read the Note 11.1 of the Financial Statements of the Scheme for the period ended December 31, 2018.
Sindh Workers' Welfare Fund (SWWF)
** Based on NBP Funds estimates
The performance reported is net of management fee & all other expenses and based on dividendreinvestment gross of with-holding tax where applicable.

NAFA Islamic Capital Preservation Plan-II (NICPP-II) NBP FUNDSManaging Your Savings
Page 35
The scheme has maintained provision against Sindh Workers’ Welfare Fund’s liability to the tune of Rs 450,465/-If the same were not made the NAV per unit/ since inception return of scheme would be higher by Rs 0.0822/0.08%. For details investors are advised to read the Note 11.1 of the Financial Statements of the Scheme for the period ended December 31, 2018.
Sindh Workers' Welfare Fund (SWWF)
The performance reported is net of management fee & all other expenses and based on dividendreinvestment gross of with-holding tax where applicable.
‘
Launch Date: April 27, 2018Fund Size: Rs. 561 millionType: Open Ended Shariah Compliant Fund of Funds - CPPIDealing Days: Daily – Monday to FridayDealing Time: (Mon-Thr) 9:00 A.M to 4:30 P.M (Friday) 9:00 A.M to 5:00 P.MSettlement: 2-3 business daysPricing Mechanism: Forward PricingBack end Load: NilManagement Fee: 1) On invested amount in NBP funds, no additional fee. 2) Cash in Bank account: 1.00% p.a.Total Expense Ratio (%): 1.45% p.a (including 0.28% government levies)Risk Profile: Low Listing: Pakistan Stock ExchangeCustodian & Trustee: Central Depository Company (CDC)Auditors: KPMG Taseer Hadi & Co. Chartered Accountants Benchmark: Daily Weighted Return of KMI-30 Index and 3-months average deposit rate of three AA rated Islamic Banks or Islamic windows of Conventional Banks as selected by MUFAP, on the basis of actual investment by the Plan in equity and money market schemes.Fund Manager: Sajjad Anwar, CFA Asset Manager Rating: AM1 by PACRA (Very High Quality)
NBP Funds launched its NAFA Islamic Capital Preservation Plan-II (NICPP-II) in April, 2018 which is the fifth plan under NAFA Islamic Active Allocation Fund-II. The Plan is dynamically allocated between the Equity Component and Money Market Component by using the Constant Proportion Portfolio Insurance (CPPI) Methodology. Allocation to Equity Component is generally increased when equity market is rising, while allocation to the Money Market Component is generally increased when the equity market declines. The Plan is presently closed for new subscription. NICPP-II has an initial maturity of two years.
Since inception, unit price of NICPP-II has increased by 2.9% versus the Benchmark return of 1.4%. The current exposure in Equity Fund stands at 29.3%. During the month, maximum multiplier stood at 3.2 whereas minimum multiplier was 2.7.
February 2019
Shariah Compliant Funds Cash Equivalents Others including receivables Total Leverage
29.3%69.8%0.9%
100.0%Nil
28-Feb-19
32.1%66.9%1.0%
100.0%Nil
31-Jan-19Asset Allocation (% of Total Assets)
Unit Price (28/02/2019): Rs. 102.3531
Disclaimer: This publication is for informational purposes only and nothing herein should be construed as a solicitation, recommendation or an offer to buy or sell any fund. All investments in mutual funds are subject to market risks.Past performance is not necessarily indicative of future results. Please read the Offering Documents to understand the investment policies and the risks involved. Capital preservation only applies to unit holders who hold their investments until initial maturity of two years.
* Cumulative Returns
Feb2019
(0.4%)
(0.9%)
FYTD2019
2.4%
1.2%
Rolling 6Months
1.6%
0.8%
Since LaunchApril 27, 2018
2.9%
1.4%
NAFA Islamic Capital Preservation Plan-II
Performance Period
%*
Dr. Amjad Waheed, CFASajjad Anwar, CFA
Muhammad Ali Bhabha, CFA, FRMTaha Khan Javed, CFA
Hassan Raza, CFA
The objective of NAFA Islamic Capital Preservation Plan-II is to earn a potentially high return through dynamic asset allocation between Shariah Compliant Dedicated Equity and Money Market based Collective Investment Schemes, while providing Capital Preservation of the Initial Investment Value including sales load at completion of twenty four months and beyond.
PER8.28.2
NIAAEF**KMI-30** Based on NBP Funds estimates
PBV1.61.2
DY6.0%6.3%
NAFA Islamic Active Allocation Equity FundTotal
29.3%29.3%
Top Holdings (%age of total assets)(as on February 28, 2019)
Notes: 1) The calculation of performance does not include cost of front end load.2) Taxes apply. Further, tax credit also available as per section 62 of the Income Tax Ordinance, 2001.

NAFA Islamic Capital Preservation Plan-III (NICPP-III) NBP FUNDSManaging Your Savings
Page 36
The scheme has maintained provision against Sindh Workers’ Welfare Fund’s liability to the tune of Rs 332,052/-If the same were not made the NAV per unit/ since inception return of scheme would be higher by Rs 0.0547/0.05%. For details investors are advised to read the Note 9.1 of the Financial Statements of the Scheme for the period ended December 31, 2018.
Sindh Workers' Welfare Fund (SWWF)
The performance reported is net of management fee & all other expenses and based on dividendreinvestment gross of with-holding tax where applicable.* Cumulative Returns
‘
Launch Date: June 22, 2018Fund Size: Rs. 620 millionType: Open Ended Shariah Compliant Fund of Funds - CPPIDealing Days: Daily – Monday to FridayDealing Time: (Mon-Thr) 9:00 A.M to 4:30 P.M (Friday) 9:00 A.M to 5:00 P.MSettlement: 2-3 business daysPricing Mechanism Forward PricingBack end Load: NilManagement Fee: 1) On invested amount in NBP funds, no additional fee. 2) Cash in Bank account: 1.0% p.a.Total Expense Ratio (%) 1.63% p.a (including 0.28% government levies)Risk Profile Low Listing: Pakistan Stock ExchangeCustodian & Trustee: Central Depository Company (CDC)Auditors: KPMG Taseer Hadi & Co. Chartered Accountants Benchmark: Daily Weighted Return of KMI-30 Index and 3-months average deposit rate of three AA rated Islamic Banks or Islamic windows of Conventional Banks as selected by MUFAP, on the basis of actual investment by the Plan in equity and money market schemes.Fund Manager: Sajjad Anwar, CFA Asset Manager Rating: AM1 by PACRA (Very High Quality)
NBP Funds launched its NAFA Islamic Capital Preservation Plan-III (NICPP-III) in June, 2018 which is the first plan under NAFA Islamic Active Allocation Fund-III. The Plan is dynamically allocated between the Equity Component and Money Market Component by using the Constant Proportion Portfolio Insurance (CPPI) Methodology. Allocation to Equity Component is generally increased when equity market is rising, while allocation to the Money Market Component is generally increased when the equity market declines. The Plan is presently closed for new subscription. NICPP-III has an initial maturity of two years.
Since inception, unit price of NICPP-III has increased by 2.1% versus the Benchmark return of 1.1%. The current exposure in Equity Fund stands at 29.3%. During the month, maximum multiplier stood at 3.2 whereas minimum multiplier was 2.7.
February 2019
Since LaunchJune 22 , 2018
2.1%
1.1%
Feb2019
(0.5%)
(0.9%)
FYTD2019
Rolling6 Months
2.0%
1.0%
1.3%
0.8%
NAFA Islamic Capital Preservation Plan-III
Performance Period
Shariah Compliant Funds Cash Equivalents Others including receivables Total Leverage
29.3%68.4%2.3%
100.0%Nil
28-Feb-19
32.9%65.4%1.7%
100.0%Nil
31-Jan-19Asset Allocation (% of Total Assets)
Unit Price (28/02/2019): Rs. 101.9616
Disclaimer: This publication is for informational purposes only and nothing herein should be construed as a solicitation, recommendation or an offer to buy or sell any fund. All investments in mutual funds are subject to market risks.Past performance is not necessarily indicative of future results. Please read the Offering Documents to understand the investment policies and the risks involved. Capital preservation only applies to unit holders who hold their investments until initial maturity of two years.
%*
Dr. Amjad Waheed, CFASajjad Anwar, CFA
Muhammad Ali Bhabha, CFA, FRMTaha Khan Javed, CFA
Hassan Raza, CFA
The objective of NAFA Islamic Capital Preservation Plan-III is to earn a potentially high return through dynamic asset allocation between Shariah Compliant Dedicated Equity and Money Market based Collective Investment Schemes, while providing Capital Preservation of the Initial Investment Value including sales load at completion of twenty four months and beyond.
Notes: 1) The calculation of performance does not include cost of front end load.2) Taxes apply. Further, tax credit also available as per section 62 of the Income Tax Ordinance, 2001.
NAFA Islamic Active Allocation Equity FundTotal
29.3%29.3%
Top Holdings (%age of total assets)(as on February 28, 2019)
PER8.28.2
NIAAEF**KMI-30** Based on NBP Funds estimates
PBV1.61.2
DY6.0%6.3%

NAFA Islamic Capital Preservation Plan-IV (NICPP-IV) NBP FUNDSManaging Your Savings
Page 37
The scheme has maintained provision against Sindh Workers’ Welfare Fund’s liability to the tune of Rs 101,776/-If the same were not made the NAV per unit/ since inception return of scheme would be higher by Rs 0.0245/0.02%.-For details investors are advised to read the Note 9.1 of the Financial Statements of the Scheme for the period ended December 31, 2018.
Sindh Workers' Welfare Fund (SWWF)
The performance reported is net of management fee & all other expenses and based on dividendreinvestment gross of with-holding tax where applicable.* Cumulative Returns
‘
Launch Date: September 14, 2018Fund Size: Rs. 420 millionType: Open Ended Shariah Compliant Fund of Funds - CPPIDealing Days: Daily – Monday to FridayDealing Time: (Mon-Thr) 9:00 A.M to 4:30 P.M (Friday) 9:00 A.M to 5:00 P.MSettlement: 2-3 business daysPricing Mechanism Forward PricingBack end Load: NilManagement Fee: 1) On invested amount in NBP funds, no additional fee. 2) Cash in Bank account: 1.0% p.a.Total Expense Ratio (%) 1.57%(including 0.26% government levies) Risk Profile Low Listing: Pakistan Stock ExchangeCustodian & Trustee: Central Depository Company (CDC)Auditors: KPMG Taseer Hadi & Co. Chartered Accountants Benchmark: Daily Weighted Return of KMI-30 Index and 3-months average deposit rate of three AA rated Islamic Banks or Islamic windows of Conventional Banks as selected by MUFAP, on the basis of actual investment by the Plan in equity and money market schemes.Fund Manager: Sajjad Anwar, CFA Asset Manager Rating: AM1 by PACRA (Very High Quality)
NBP Funds launched its NAFA Islamic Capital Preservation Plan-IV (NICPP-IV) in September, 2018 which is the second plan under NAFA Islamic Active Allocation Fund-III. The Plan is dynamically allocated between the Equity Component and Money Market Component by using the Constant Proportion Portfolio Insurance (CPPI) Methodology. Allocation to Equity Component is generally increased when equity market is rising, while allocation to the Money Market Component is generally increased when the equity market declines. The Plan is presently closed for new subscription. NICPP-IV has an initial maturity of two years.
Since inception, unit price of NICPP-IV has increased by 1.0% versus the Benchmark return of 0.9%. The current exposure in Equity Fund stands at 31.6%. During the month, maximum multiplier stood at 3.2 whereas minimum multiplier was 2.6.
February 2019
Since LaunchSeptember 14 , 2018
1.0%
0.9%
Feb2019
(0.5%)
(1.0%)
NAFA Islamic Capital Preservation Plan-IV
Performance Period
Unit Price (28/02/2019): Rs. 101.0132
Disclaimer: This publication is for informational purposes only and nothing herein should be construed as a solicitation, recommendation or an offer to buy or sell any fund. All investments in mutual funds are subject to market risks.Past performance is not necessarily indicative of future results. Please read the Offering Documents to understand the investment policies and the risks involved. Capital preservation only applies to unit holders who hold their investments until initial maturity of two years.
%*
Shariah Compliant Funds Cash Equivalents Others including receivables Total Leverage
31.6%67.6%0.8%
100.0%Nil
28-Feb-19
35.0%64.1%0.9%
100.0%Nil
31-Jan-19Asset Allocation (% of Total Assets)
Dr. Amjad Waheed, CFASajjad Anwar, CFA
Muhammad Ali Bhabha, CFA, FRMTaha Khan Javed, CFA
Hassan Raza, CFA
The objective of NAFA Islamic Capital Preservation Plan-IV is to earn a potentially high return through dynamic asset allocation between Shariah Compliant Dedicated Equity and Money Market based Collective Investment Schemes, while providing Capital Preservation of the Initial Investment Value including sales load at completion of twenty four months and beyond.
Notes: 1) The calculation of performance does not include cost of front end load.2) Taxes apply. Further, tax credit also available as per section 62 of the Income Tax Ordinance, 2001.
NAFA Islamic Active Allocation Equity FundTotal
31.6%31.6%
Top Holdings (%age of total assets)(as on February 28, 2019)
PER8.28.2
NIAAEF**KMI-30** Based on NBP Funds estimates
PBV1.61.2
DY6.0%6.3%
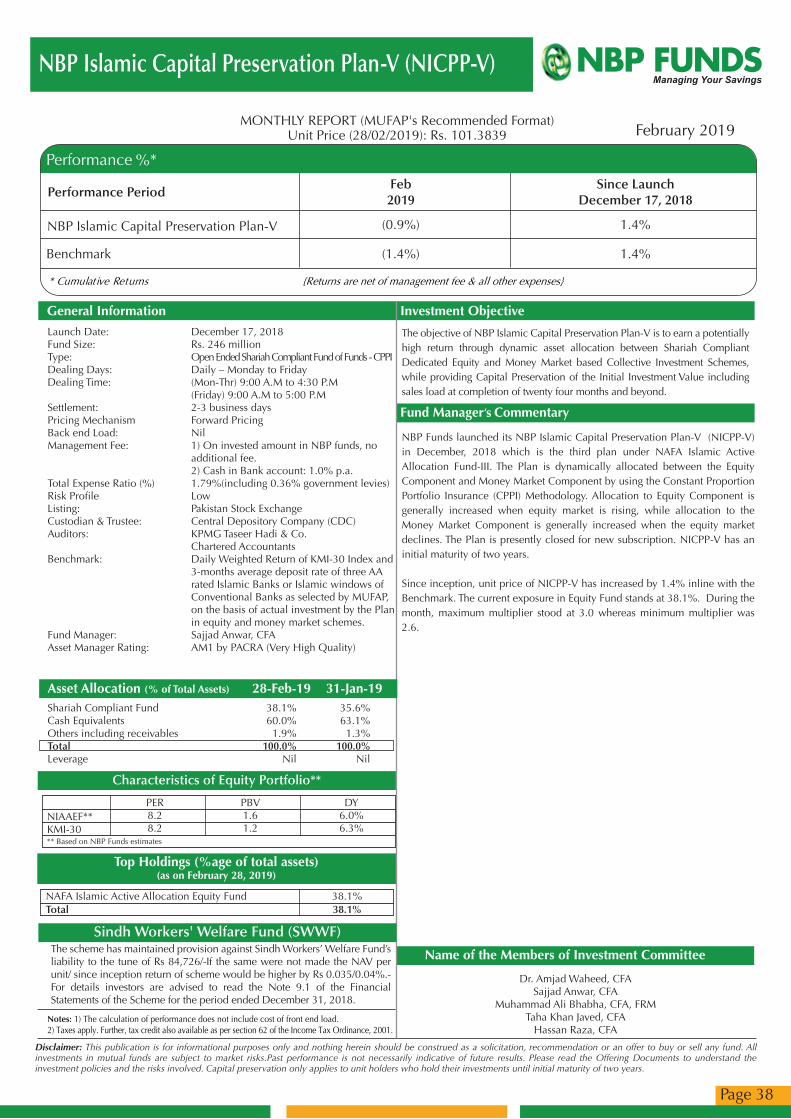
NBP Islamic Capital Preservation Plan-V (NICPP-V) NBP FUNDSManaging Your Savings
Page 38
NAFA Islamic Active Allocation Equity FundTotal
38.1%38.1%
Top Holdings (%age of total assets)(as on February 28, 2019)
{Returns are net of management fee & all other expenses}* Cumulative Returns
‘
Launch Date: December 17, 2018Fund Size: Rs. 246 millionType: Open Ended Shariah Compliant Fund of Funds - CPPIDealing Days: Daily – Monday to FridayDealing Time: (Mon-Thr) 9:00 A.M to 4:30 P.M (Friday) 9:00 A.M to 5:00 P.MSettlement: 2-3 business daysPricing Mechanism Forward PricingBack end Load: NilManagement Fee: 1) On invested amount in NBP funds, no additional fee. 2) Cash in Bank account: 1.0% p.a.Total Expense Ratio (%) 1.79%(including 0.36% government levies) Risk Profile Low Listing: Pakistan Stock ExchangeCustodian & Trustee: Central Depository Company (CDC)Auditors: KPMG Taseer Hadi & Co. Chartered Accountants Benchmark: Daily Weighted Return of KMI-30 Index and 3-months average deposit rate of three AA rated Islamic Banks or Islamic windows of Conventional Banks as selected by MUFAP, on the basis of actual investment by the Plan in equity and money market schemes.Fund Manager: Sajjad Anwar, CFA Asset Manager Rating: AM1 by PACRA (Very High Quality)
NBP Funds launched its NBP Islamic Capital Preservation Plan-V (NICPP-V) in December, 2018 which is the third plan under NAFA Islamic Active Allocation Fund-III. The Plan is dynamically allocated between the Equity Component and Money Market Component by using the Constant Proportion Portfolio Insurance (CPPI) Methodology. Allocation to Equity Component is generally increased when equity market is rising, while allocation to the Money Market Component is generally increased when the equity market declines. The Plan is presently closed for new subscription. NICPP-V has an initial maturity of two years.
Since inception, unit price of NICPP-V has increased by 1.4% inline with the Benchmark. The current exposure in Equity Fund stands at 38.1%. During the month, maximum multiplier stood at 3.0 whereas minimum multiplier was 2.6.
February 2019
Since LaunchDecember 17, 2018
1.4%
1.4%
Feb2019
(0.9%)
(1.4%)
NBP Islamic Capital Preservation Plan-V
Performance Period
Unit Price (28/02/2019): Rs. 101.3839
Disclaimer: This publication is for informational purposes only and nothing herein should be construed as a solicitation, recommendation or an offer to buy or sell any fund. All investments in mutual funds are subject to market risks.Past performance is not necessarily indicative of future results. Please read the Offering Documents to understand the investment policies and the risks involved. Capital preservation only applies to unit holders who hold their investments until initial maturity of two years.
%*
Shariah Compliant FundCash Equivalents Others including receivables Total Leverage
38.1%60.0%1.9%
100.0%Nil
28-Feb-1935.6%63.1%
1.3%100.0%
Nil
31-Jan-19Asset Allocation (% of Total Assets)
Dr. Amjad Waheed, CFASajjad Anwar, CFA
Muhammad Ali Bhabha, CFA, FRMTaha Khan Javed, CFA
Hassan Raza, CFA
The objective of NBP Islamic Capital Preservation Plan-V is to earn a potentially high return through dynamic asset allocation between Shariah Compliant Dedicated Equity and Money Market based Collective Investment Schemes, while providing Capital Preservation of the Initial Investment Value including sales load at completion of twenty four months and beyond.
Notes: 1) The calculation of performance does not include cost of front end load.2) Taxes apply. Further, tax credit also available as per section 62 of the Income Tax Ordinance, 2001.
The scheme has maintained provision against Sindh Workers’ Welfare Fund’s liability to the tune of Rs 84,726/-If the same were not made the NAV per unit/ since inception return of scheme would be higher by Rs 0.035/0.04%.-For details investors are advised to read the Note 9.1 of the Financial Statements of the Scheme for the period ended December 31, 2018.
Sindh Workers' Welfare Fund (SWWF)
PER8.28.2
NIAAEF**KMI-30** Based on NBP Funds estimates
PBV1.61.2
DY6.0%6.3%

NAFA Active Allocation Riba Free Savings Fund (NAARFSF)
Disclaimer: This publication is for informational purposes only and nothing herein should be construed as a solicitation, recommendation or an offer to buy or sell any fund. All investments in mutual funds are subject to market risks. Past performance is not necessarily indicative of future results. Please read the Offering Document to understand investment policies and the risks involved.
*Annualized Return Based on Morning Star MethodologyAll other returns are Annualized Simple Return
The performance reported is net of management fee & all other expenses andbased on dividend reinvestment gross of with-holding tax where applicable.
Launch Date: January 18, 2016Fund Size: Rs. 893 millionFund Size (excludinginvestment by Fund of Funds) Nil Type: Open-end – Shariah Compliant Income FundDealing Days: Daily – Monday to FridayDealing Time: (Mon - Thr) 9:00 A.M to 5:00 P.M (Friday) 9:00 A.M to 5:30 P.MSettlement: 2-3 business daysPricing Mechanism Forward PricingLoad: Front end: 0% Back end: 0%Management Fee: 12% of Net Income (min: 0.5% p.a., max: 1.25% p.a.) w.e.f 10-Sep-18Total Expense Ratio: 2.03% p.a. (including 0.37% government levies)Selling & Marketing expenses: 0.4% p.a.Risk Profile: LowFund stability rating "A-(f)" by PACRACustodian & Trustee: Central Depository Company (CDC)Auditors: A. F. Ferguson & Co. Chartered AccountantsBenchmark:** 6-month average deposit rates of three A rated Islamic Banks/Islamic windows of conventional banks as selected by MUFAPFund Manager: Muhammad Ali Bhabha, CFA, FRMMinimum Subscription Rs. 10,000/-Asset Manager Rating: AM1 by PACRA (Very High Quality)
To earn a reasonable rate of return along with a high degree of liquidity by investing in short-term Shari’ah Compliant bank deposits and money market/debt securities.
During the month, the Fund generated an annualized return of 8.6% against the benchmark return of 4.1%. The performance is net of management fee and all other expenses.
The Fund aims to consistently generate better return than the profit rates offered by Islamic Banks / Islamic windows of commercial banks, while also providing easy liquidity along with a high quality credit profile. The Fund is allowed to invest in Shariah Compliant Government Securities of maturity up to 3 years as well as Shariah Compliant money market and debt securities of up to 2 years maturity rated AA- or better.
Around 57% of net assets of the portfolio are allocated in bank deposits. The weighted average time-to-maturity of the Fund is 71 days.
We will rebalance the allocation of the Fund proactively based on the capital market outlook.
February 2019
Since Launch*January 18, 2016
Feb2019
8.6%
4.1%
FYTD2019
7.2%
3.1%
Rolling12 months
6.4%
2.9%
3.8%
3.1%
4.7%
3.1%
NAFA Active Allocation Riba Free Savings Fund
Performance Period
Bank Deposits GOP Ijara Sukuks - Govt. Backed Commercial Papers (Islamic) Others including receivables Total Leverage
55.1%10.8%33.3%0.8%
100.0%Nil
28-Feb-1924.2%18.1%55.6%2.1%
100.0%Nil
31-Jan-19Asset Allocation (% of Total Assets)
Unit Price (28/02/2019): 10.4979
Notes: 1) The calculation of performance does not include cost of front end load.2) Taxes apply. Further, tax credit also available as per section 62 of the Income Tax Ordinance, 2001.
Dr. Amjad Waheed, CFASajjad Anwar, CFA
Muhammad Ali Bhabha, CFA, FRMHassan Raza, CFA
Credit Quality of the Portfolio as of February 28, 2019 (% of Total Assets)
GOP Ijarah Sukuk (AAA rated)AAA+A-Others including receivablesTotal
10.8%33.4%11.4%43.6%0.8%
100.0%
** effective from September 01, 2016; Previously Average of 6-Month deposit rates (A- & above rated Islamic banks)
Note: Amount invested by fund of funds is Rs. 893 million
The scheme has maintained provisions against Sindh Workers' Welfare Fund's liability to the tune of Rs. 3,979,644/-. If the same were not made the NAV per unit/last one year return of scheme would be higher by Rs. 0.0468/0.47%. For details investors are advised to read note 10.1 of the financial statements of the Scheme for the period ended December 31, 2018.
Sindh Workers' Welfare Fund (SWWF)
FY2017
4.7%
3.1%
Last 3years*
4.1%
2.4%
FY2018
%
NBP FUNDSManaging Your Savings
Page 39

NAFA Islamic Active Allocation Equity Fund (NIAAEF)
Notes: 1) The calculation of performance does not include cost of front-end load.2) Taxes apply. Further, tax credit also available as per section 62 of the Income Tax Ordinance, 2001.
Top Ten Holdings (as on February 28, 2019)
Pak Petroleum Ltd
Oil & Gas Dev Co Ltd
Engro Corporation Ltd
Pakistan Oilfields Ltd
Engro Fertilizer Ltd
Hub Power Company Ltd
Meezan Bank Ltd
Nishat Mills Ltd
Lucky Cement Ltd
Mari Petroleum Co Ltd
5.4%
5.0%
5.0%
4.7%
3.5%
10.8%
10.3%
7.4%
6.2%
6.0%
% of TotalAssets
% of TotalAssets
PER8.28.2
NIAAEFKMI-30
PBV1.61.2
DY6.0%6.3%
Note: Amount invested by fund of funds is Rs 2,496 million.
Disclaimer: This publication is for informational purposes only and nothing herein should be construed as a solicitation, recommendation or an offer to buy or sell any fund. All investments in mutual funds are subject to market risks.Past performance is not necessarily indicative of future results. Please read the Offering Documents to understand the investment policies and the risks involved.
* Annualized ReturnAll Other returns are Cumulative
‘
Launch Date: January 18, 2016Fund Size: Rs. 2,496 millionFund Size: (Excludinginvestment by fund of funds) NilType: Open Ended Shariah Compliant Equity SchemeDealing Days: Daily – Monday to FridayDealing Time: (Mon - Thr) 9:00 A.M to 4:30 P.M (Friday) 9:00 A.M to 5:00 P.MSettlement: 2-3 business daysPricing Mechanism: Forward PricingLoad: Front end-0% Back end-0%Management Fee: 2% p.aRisk Profile: HighTotal Expense Ratio (%) 3.62% p.a. (including 0.38% government levies)Selling & Marketing Expenses: 0.4% per annum
Custodian & Trustee: Central Depository Company (CDC)Auditors: A. F. Ferguson & Co. Chartered AccountantsBenchmark: KMI-30 IndexFund Manager: Taha Khan Javed, CFAAsset Manager Rating: AM1 by PACRA (Very High Quality)
The objective of the Fund is to provide investors with long term capital growth from an actively managed portfolio of Shari’ah Compliant listed equities.
NBP Funds launched its second open-end Islamic Equity Fund namely NAFA Islamic Active Allocation Equity Fund (NIAAEF) in January, 2016. The aim of the Fund is to provide growth to the investment of unit holders over the long-term in approved Shariah Compliant equities. NIAAEF started off the month with an allocation of around 93% in equities, which decreased to around 87% towards the end of the month. NIAAEF outperformed the Benchmark in February as the Fund was underweight in select Oil & Gas Marketing Companies, Transport, and Refinery sectors stocks which underperformed the market and overweight in select Commercial Banks, Cement, Technology & Communication, and Glass & Ceramics sectors stocks which outperformed the market. During the month, the allocation was increased primarily in Commercial Banks, Oil & Gas Exploration Companies, and Vanaspati & Allied Industries sectors, whereas it was reduced primarily in Oil & Gas Marketing Companies, Power Generation & Distribution Companies, Fertilizer, and Chemical sectors.
February 2019
Since Launch*January 18, 2016
7.8%
7.5%
Feb2019
FYTD2019
(4.9%)
(7.8%)
(3.1%)
(4.0%)
FY2017
30.1%
18.8%
Last 3years*
8.4%
6.8%
FY2018
(14.1%)
(9.6%)
Rolling12 Months
(8.0%)
(10.4%)
NAFA Islamic Active Allocation Equity Fund
Performance Period
Equities / Stocks Cash Equivalents Others including receivables Total Leverage
86.6%12.7%0.7%
100.0%Nil
28-Feb-1993.3%6.2%0.5%
100.0%Nil
31-Jan-19Asset Allocation (% of Total Assets)
Unit Price (28/02/2019) Rs. 10.7906
Dr. Amjad Waheed, CFASajjad Anwar, CFA
Taha Khan Javed, CFAHassan Raza, CFA
%
Top Five Sectors (% of Total Assets) (as on February 28, 2019)
Oil & Gas Exploration Companies Fertilizer Cement Power Generation & Distribution Oil & Gas Marketing Companies Others
30.8%13.4%10.2%6.3%5.4%
20.5%
The performance reported is net of management fee & all other expenses and based on dividend reinvestmentgross of with-holding tax where applicable.
The scheme has maintained provision against Sindh Workers’ Welfare Fund’s liability to the tune of Rs 29,057,183/-If the same were not made the NAV per unit/ last one year return of scheme would be higher by Rs 0.1256/1.07%. For details investors are advised to read the Note 8 of the Financial Statements of the Scheme for the period ended December 31, 2018.
Sindh Workers' Welfare Fund (SWWF)
** Based on NBP Funds estimates
NIAAEF, 27.5%KMI-30, 21.9%
0.0%
20.0%
40.0%
60.0%
80.0%
100.0%
29-F
eb-1
6
30-A
pr-1
6
30-Ju
n-16
31-A
ug-1
6
31-O
ct-1
6
31-D
ec-1
6
28-F
eb-1
7
30-A
pr-1
7
30-Ju
n-17
31-A
ug-1
7
31-O
ct-1
7
31-D
ec-1
7
28-F
eb-1
8
30-A
pr-1
8
30-Ju
n-18
31-A
ug-1
8
31-O
ct-1
8
31-D
ec-1
8
28-F
eb-1
9
NIAAEF KMI-30Annualized Return 8.4% 6.8%Risk (Std. Deviation) 15.6% 18.5%
Relative Performance of NAFA Islamic Active Allocation Equity Fund (NIAAEF)for the Last Three Years
Cum. Return
NBP FUNDSManaging Your Savings
Page 40

Sialkot Gujranwala
7 -Noon Avenue, Canal Bank,Muslim Town, Lahore.Fax # 042- 35861095
LahoreMultanNBP City Branch, Hussain-a-Gahi,Multan.Ph # 061- 4502204Fax # 061- 4502203
Shop # 1, Ground Floor, Islamic Plaza,Plot # SB-2, Block 13-B, KDA Scheme 24,Gulshan-e-Iqbal, Karachi.Ph # 021- 34825043-52 (10 Lines)
Mehar Plaza, Plot # 2, Sherpao Colony,Committe Chowk, Muree Road,Rawalpindi.Ph # 051- 5781931-38 (08-Lines)
Shop # 55/T-5, Haider Road, Saddar,Rawalpindi.Ph # 051- 5580140-45, 5120148(07 Lines)
Saddar
SadiqabadShop # DT 183-184, Chirah Road,Sadiqabad, Muslim Town, Rawalpindi.Ph # 051- 4573804 -08 (05 Lines)
Paris RoadOffice # B1-16-S, Paris Road, Sialkot.Ph # 052 - 4581501-8 (08-Lines)
Bhatia Nagar GT RoadBuilding 94,96 Street # 2 Mohallah BhatiaNagar GT Road Gujranwala.Ph # 055 - 3842601-06, 38426083252911 (08-Lines)
Main Boulevard DHA Phase VIPlot # 114, Sector Main BoulevardDHA Phase 6-C Lahore.Ph # 042 - 37135560-2,37135564-8 (07 Lines)
Main Market Gulberg IIRegional Office 21-E Main MarketGulberg II Lahore.Ph# 042 - 35752782-83, 35752734-40,35752790-92 (12 Lines)
Commercial Area Cavalry GroundShop # 1 Plaza 65 Commercial Area Cavalry Ground Lahore.Ph # 042 - 36670171-75 (05 lines),36619878
North NazimabadShop # 2 & 3, Famous Tower Plot # B-153, Block – H,North Nazimabad, Karachi.Ph # 021-36620280-85 (06 Lines)
Islamabad1st Floor, Ranjha Arcade,Main Double Road, Gulberg Greens,Islamabad.
Karachi
Hyderabad
Lahore
Faisalabad
Rawalpindi
Azad Jammu & Kashmir
Islamic Savings Center
7th Floor Clifton Diamond Building,Block No. 4, Scheme No. 5, Clifton,Karachi.Ph # 0800-20002Fax # 021-35825329
HyderabadNational Bank of Pakistan, FatimaJinnah Branch, 1st Floor, NBP Funds,Fatima Jinnah Road, Hyderabad.
BahadurabadShop # 10, Silver Line Apartments,Mian Jamal Uddin Afghani Road,Plot # 15/5, Block-3, Bihar MuslimCooperative Housing Society, Karachi.Ph # 021- 34929933-35 (03 Lines)
Chaklala Scheme 313/4, Awan Plaza, Bilal Shaheed ChowkChaklala Scheme - III, Rawalpindi.Ph # 051-5766129, 5766240-1,5766244-5 (05-Lines)
Mirpur - Azad Jammu & KashmirAl Manzar building, Allama Iqbal road,Plot # 2, Nangi Mirpur Azad Jammu &Kashmir.Ph # 058 - 27448627-31 (05-Lines)
Ghari KhataPlot # 1054 station road near HaiderChowk Ghari Khata Hyderabad.Ph # 022-2720912-19 (08 Lines)
Faisal Town926-C Maulana Shaukat Ali Road,Faisal Town, Lahore.Ph # 042 - 35175501-7 (07 Lines)
Liaqat RoadP-74 First Floor Liaqat Road Faisalabad.Ph # 041- 2610157-63 (07-Lines)
Office # 5, Ground Floor, Plot # 99-F,Sama Arcade 3, Spring North, Phase 7,Bahria Town, Rawalpindi.Ph # 051- 5412014-18 (05-Lines)
Peshawar2nd Floor, National Bank Building,University Road, Opposite Gul Haji Plaza.Ph # 091-5703200Fax # 0915703202
Head Office Branch Office
Regional Offices
Shop # 1, Plot # 34-C, Street # 10,Badar Commercial, Phase-V Ext, DHA,Karachi.Ph # 021- 35851541-43 (03 Lines)
D.H.A - Badar CommercialGround floor, Rufi Lake Drive,Gulistan-e-Jauhar, Block - 18,Karachi.Ph # 021- 34160350-57 (08 Lines)
Gulistan-e-JauharShop # 12-A, Rahat Residency,Plot # 34-C, Rahat Commercial Area,Lane 3, Phase VI, DHA, Karachi.Ph # 021- 35853487-89 (03 Lines)
Khayaban-e-Rahat
Gulshan-e-Iqbal
Committee ChowkBharia Town
ADDRESSESIslamabadPlot # 395-396, Industrial Area,Sector I-9/3. Islamabad.Fax # 051- 4859029
Contact our Investment Consultant for free Investment advice
Call 0800-20002 SMS INVEST to 9995 www.nbpfunds.com [email protected]