manchester computing supercomputing, visualization & escience celia russell, stephen pickles and...
TRANSCRIPT
Man
ch
este
r C
om
pu
tin
gSup
erc
om
puti
ng,
Vis
ualiz
ati
on &
eSci
ence
Celia Russell, Stephen Pickles and Mike Jones
Combining Data WorkshopESRC Research Methods ProgrammeManchester, December 18, 2002
SAMDSAMD
Seamless Access to Multiple Datasets
A ESRC/DTI e-Science demonstrator project
http://www.sve.man.ac.uk/Research/AtoZ/SAMD

Supercomputing, Visualization & eScience2
SAMD
Seamless Access to Multiple Datasets
A project to demonstrate the benefits of applying e-Science grid technologies to an ordinary social science query
We solve a genuine problem from the UK academic social science community - a multivariate analysis using a complex mathematical algorithm
Based on a major social science databank, the Office for National Statistics Time Series Data, hosted at MIMAS

Supercomputing, Visualization & eScience3
The problem
Published as Sensier, M., Osborn D.R. and Öcal N. (2002) ‘Asymmetric Interest Rate Effects for the UK Real Economy’ , Oxford Bulletin of Economics and Statistics, Volume 64, September 2002, n°4
The research query looks at the effect interest rate changes had on Gross Domestic Product in the UK over the period 1960 – 2000

Supercomputing, Visualization & eScience4
Interest Rates in the UK

Supercomputing, Visualization & eScience5
UK GDP – quarterly changes

Supercomputing, Visualization & eScience6
The Model
Where y is the quarterly change in GDP and z is the quarterly change in interest rates

Supercomputing, Visualization & eScience7
Before SAMD
Supercomputing, Visualization & eScience8
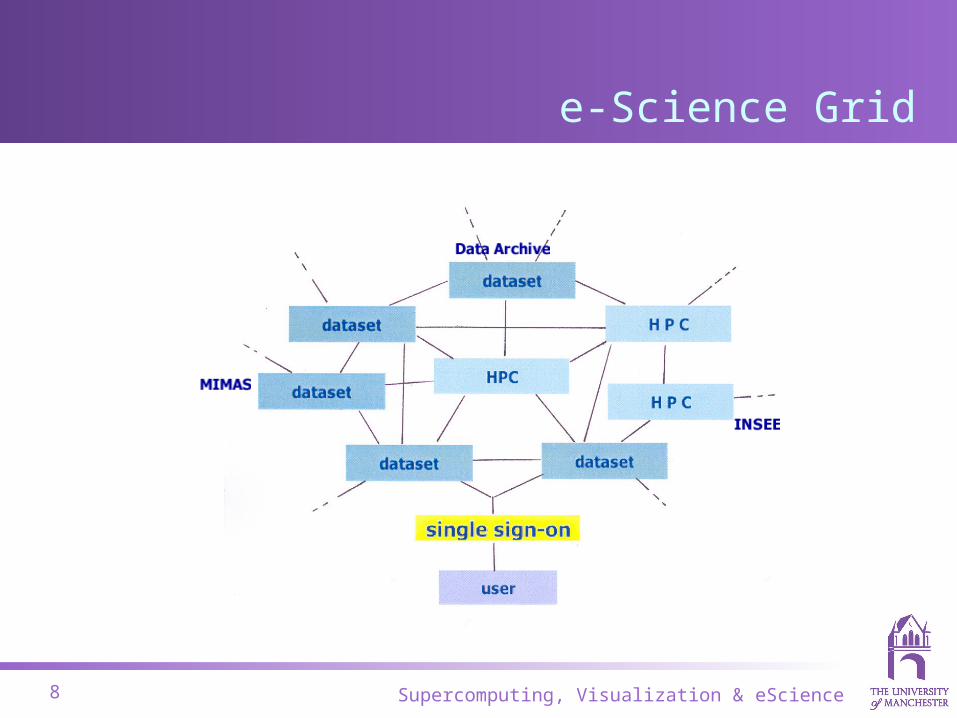
e-Science Grid

Supercomputing, Visualization & eScience9
SAMD Methodology
We built a mini demonstrator grid for SAMD by: Grid-enabling the NS Time Series Databank Parallelising the code to represent the HPC facilities Using Grid protocols for data transfer Creating a graphical user interface that included a
single sign-on It all worked, and cut the data collection and analysis
time down to around 8 minutes.

Supercomputing, Visualization & eScience10
Extending SAMD
The approach and methods of SAMD are applicable to more general social science applications involving data collection and analysis
More efficient handling of datasets – data is moved to where it's needed, not just to web browser
The single sign-on for all databanks means users can cross search datasets and perform cross analyses of multiple datasets from different providers
Grants access to high performance computing facilities on the grid without the user having to learn how to use them
Can automate routine enquiries Cuts the time taken to run computing intensive problems by a
factor of around 100

Supercomputing, Visualization & eScience11
Scaling up with the Grid
E-Science Grids allow the social scientist to scale up their quantitative research by:
Including many more data points in their analysis Developing more complex models incorporating more
variables Dropping assumptions Visualising data Creating new communities and collaborations Exploring new types of analyses

Man
ch
este
r C
om
pu
tin
gSup
erc
om
puti
ng,
Vis
ualiz
ati
on &
eSci
ence
SAMD Architecture

Supercomputing, Visualization & eScience13
Motivation
Web-based access to socio-economic datasets such as Office of National Statistics Time series data has lead to greatly increased use, but:-
No standard authentication or authorisation– too many usernames and passwords to remember
To automate search and retrieval, can only emulate navigation through "screen scraping"
– breaks whenever the interface is "improved"– discourages third party developments and periodic re-analysis
Data must be downloaded and saved to local disk– not necessarily the system on which subsequent analysis is to be
performed– inefficient, especially for large datasets

Supercomputing, Visualization & eScience14
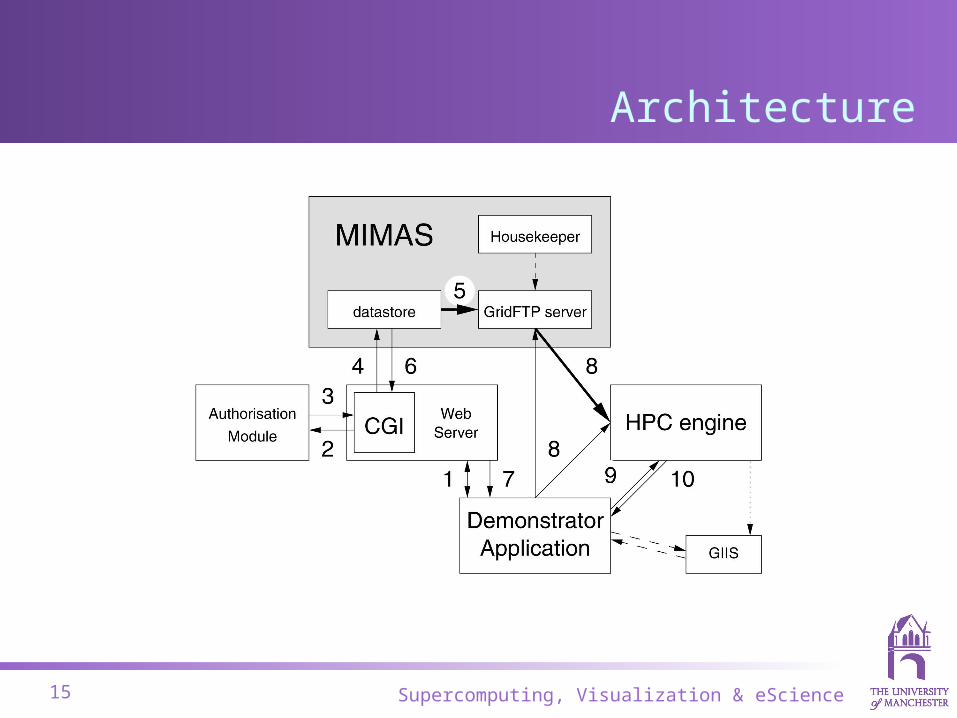
The SAMD solution
Use Grid Security Infrastructure for "single sign-on" authentication everywhere
– Modified standard Apache web server to accept proxy credentials• Permits re-use of existing CGI code
Use third party file transfers (grid-ftp) to move data directly to where it's needed
Use standard globus mechanisms to– Locate HPC facility for analysis– Stage analysis binary from local repository and run analysis job on
HPC facility– Retrieve results
Supercomputing, Visualization & eScience15
Architecture
Supercomputing, Visualization & eScience16
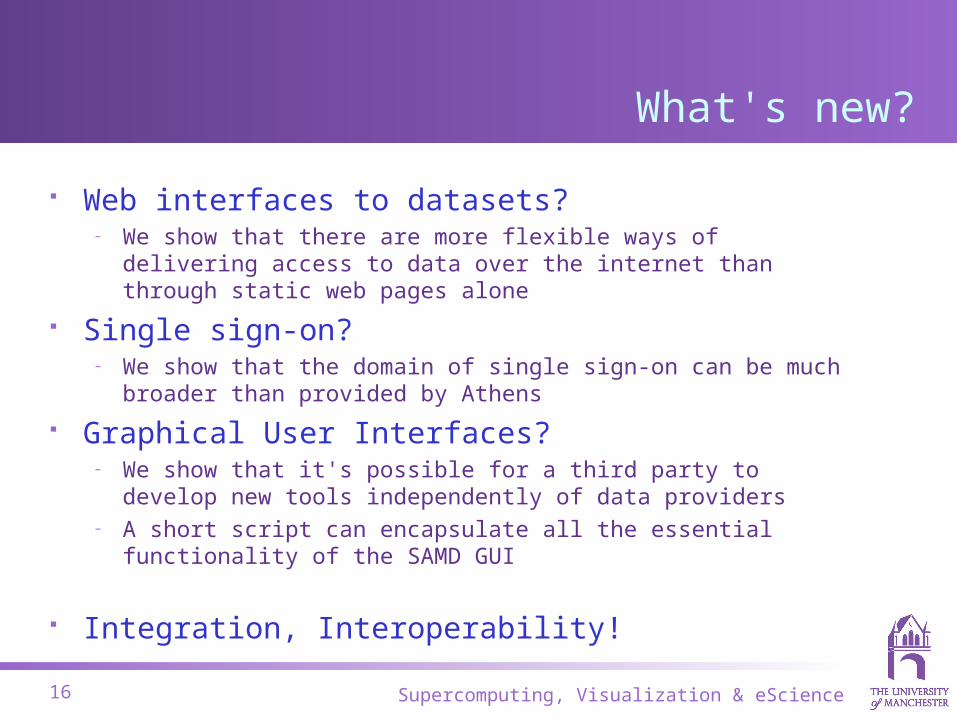
What's new?
Web interfaces to datasets?– We show that there are more flexible ways of delivering access to
data over the internet than through static web pages alone
Single sign-on?– We show that the domain of single sign-on can be much broader
than provided by Athens
Graphical User Interfaces?– We show that it's possible for a third party to develop new tools
independently of data providers– A short script can encapsulate all the essential functionality of the
SAMD GUI
Integration, Interoperability!

Supercomputing, Visualization & eScience17
What's needed?
Culture of Standards
If key datasets are Grid-enabled in a commonly understood, well-documented way, we create an environment in which third parties can develop tools and services that add real value by bringing together independent datasets
SAMD shows that such an environment is technically possible, but does not by itself establish any standard.
– Look to Web services, Grid services, OGSA-DAI…

Man
ch
este
r C
om
pu
tin
gSup
erc
om
puti
ng,
Vis
ualiz
ati
on &
eSci
ence
SAMDUser Interfaces

Supercomputing, Visualization & eScience19
GUI: Single Sign-on
Panel located at the top left Uses X509 proxy certificates grid-proxy-init
– Creates your proxy credential
grid-proxy-destroy– Removes your proxy credential

Supercomputing, Visualization & eScience20
GUI: Data Acquisition
The Interface to the SAMD-ONS web server, steps 1 to 8

Supercomputing, Visualization & eScience21
Data Search
Search by Keyword
1 Request and Mutual Authentication using a proxy credential
2,3 Authorisation
4 Query Data Store

Supercomputing, Visualization & eScience22
Data Request
Data moved to GridFTP server 1: send references to data 1,2,3: authentication & authorisation 4: ask datastore to move data (5) 6,7: datastore returns XML ticket

Supercomputing, Visualization & eScience23
Data Transfer
Data moved to HPC engine 8: third party file transfer
– from MIMAS to HPC engine, ready for analysis

Supercomputing, Visualization & eScience24
Finding an HPC Resource
GIIS MDS Server e.g. ginfo.grid-support.ac.uk
Search for: OS type eg: IRIX64 Minimum No. Processors Jobmanager
or manually enter your favourite
Data Analysis panel

Supercomputing, Visualization & eScience25
Select an executable on the local machine
Stage job using Globus Check status using Globus Retrieve results using Globus Clean-up using Globus Even delete job using Globus
Data Analysis panel
Using the HPC Resource

Supercomputing, Visualization & eScience26
Command line automation
Not everyone has the expertise or time to write a special- purpose GUI.
Given a GSI-enabled web server and documented protocol to communicate with it, a few lines of shell script can do all the essential steps
Use grid-proxy-init to sign on Use curl to talk https to the web server Use GridFTP to move data to the HPC engine Use globus-commands to
– (stage and) run executable.– retrieve results– and clean-up

Supercomputing, Visualization & eScience27
Acknowledgments
Funded by the and the
Keith Cole
Celia Russell
Marianne Sensier
Geoff Lane
Tim Hateley
Mark Riding
Kevin Roy