mangrove redd+ reduction of co2 emission and enhancement of
TRANSCRIPT

FY2014 Feasibility studies
towards visualization of contribution by Japanese companies
for prevention from deforestation and degradation in developing countries
(Ministry of Economy, Trade and Industry)
Mangrove REDD+ Reduction of CO2 Emission and
Enhancement of Carbon Fixation
Feasibi l i ty Study Report for JCM (Summary Version)
Report
March, 2015 YL Building Co., Ltd.
1
1. Summary 1.1 Purpose Approximately 17% of the global GHG emission is caused by deforestation and degradation in developing counties according to IPCC. Measures against deforestation and degradation in developing countries (REDD+), which was agreed on the Bali Action Plan in 2007 as one of the mitigation actions for the next framework, have got more attention by developing countries and discussed internationally for establishment of the system. Indonesia, the host country of this REDD+ project, owns the 3rd
largest tropical forest area in the world, and 70% of their land is cover by forest. Also, they are the country with the largest forest county in Asia. Their national action plan of GHG emission reduction specifies that 88% of reduction is supposed to be from REDD+ sector which includes peat land, so we can easily see that they have focused on REDD+ activities the most. Developed countries are also interested in Indonesia REDD+ so that their support and surveys have been introduced to Indonesia regarding as a potential country for emission reduction.
Our REDD+ project is for mangroves. Indonesia owns the largest mangroves in the world. Since Indonesia has been and will be exposed to the negative impacts of nature such as earthquake, high waves, and sea level rise, the functions of mangroves as a disaster preventer in coastal area which include mitigation of tsunami and prevention from coast erosion have been reviewed and got more attention for adaptation for climate change. On the other hand, Japanese government has implemented projects to reduce emissions applying our techniques and technologies and proceeded establishment of Joint Crediting Mechanism (JCM) which appropriately evaluates our contribution to emission reduction which is achieved through those projects. This new mechanism, JCM, covers REDD+. While Indonesia is promoting and developing preparation of actual REDD+ projects, there are not so many who obtained a permission for REDD+ projects. Active project design and operation in Indonesia is needed to show our superior to other countries and contribution.

2
In the project, we continuously proceeded preparation of operation of a REDD+ project in Indonesia through our past feasibility studies for the period from 2011 to 2013, obtained a REDD+ project permission for the protection forests in coastal area of Organ Komering Ilir (OKI), South Sumatra in 2013, and started operation of the project with the permission in 2014. We aim at visualization of contribution to Indonesia by our country through our project. 1.2 Overview Our REDD+ project is for OKI, South Sumatra, Indonesia. The project area covers 66,500ha of the protection forest in coastal area of OKI. While the entire protection forest area is 105,000ha, the project site is 66,500ha which is the area between Sungai Sugihan and Sungai Lumpur with 180km of coastline. The 66,500ha majorly consists of mangroves and tree species for inland wetland forests. According to Dinas Kehutanan Kabupaten OKI, 65% of the area has been exposed to deforestation and forest degradation. While the protection forest in OKI was designated by the Ministry of Forestry in 1986, people had lived there before designation. Therefore, there are still some villages at the mouse of relatively big rivers. We will implement measures against deforestation and forest degradation, promotion of forest rehabilitation and growth through conservation activities, and planting in grassland and bare land in the project. Those REDD+ activities include establishment of a system and organization framework to protect the forest with local residents through development of human resources of local communities within the protection forest, establishment of an organization system and mechanism, and encouragement of villages’ active participation in the project. We have proceeded development of a phased project operation and a methodology, examination of biomass estimation, preparation of organization system, and coordination with local communities since 2011 when we started the feasibility study. We visited and inspected the rivers and all villages in the 66,500 in 2011 to understand the condition of the forest and villages in the project area. Also, we identified the necessity of development of a new methodology since we found out that there were no available methodology for the project through our research and

3
examination We implemented field surveys and detailed forest surveys applying aircraft “Lidar” for biomass estimation and established a high accurate method of biomass estimation in 2012. Also, we developed a new versatile methodology “Methodology for REDD+ Activities in the Degraded Area of Mangrove Habitats.” We examined a method of biomass estimation for large area, improved the methodology we developed in 2012, and obtained a REDD+ project permission which is called “IUPJL-HL (the use of environmental services for enhancement of carbon stock in preserved forests)” in 2013. While the entire project area is 66,500ha, we obtained the permission only for 23,500ha which is the northern part of the project area since the southern area is under quite different natural condition. This was decided following the consultation with Dinas Kehutanan Kabupaten OKI. After obtaining the permission, we obtained the approval for Project Plan (RKU) and Annual Project Plan (RKT) as well. With those, all the preparation for operation of the REDD+ got to be ready. We started the project operation with the permission we obtained in 2013. The operation includes establishment of an on-site office within the project area, employment of 4 staff from local communities, planting in a pilot project area, and activity to improve water cycle. We also held an official meeting with Climate Change Working Group of Forestry Ministry and Protection Forests Division of Direktorat Perlindungan Hutan dan Konservasi Alam as well as a meeting of safeguards with a representative group of Sungai Batang. Moreover, we prepared a PDD and examined items of safeguards aiming at registration of a JCM project. 2. Project Outline 2.1 Purpose This is a REDD+ project for the protection forest in coastal area of Organ Komering Ilir (OKI), South Sumatra, Indonesia. The project aims at reduction of CO2 emission and enhancement of carbon stock through forest conservation and rehabilitation activities as well as generation and obtain of carbon credits. Now we are working on visualization of the REDD project’s contribution to Indonesia while

4
proceeding essential research and preparation for implementation of the project under Joint Crediting Mechanism (JCM), which has been agreed between Indonesian and Japanese government 2.2 Overview According to the announcement by Dinas Kehutanan Kabupaten OKI, deforestation and forest degradation is ongoing in 65% of the protection forest in coastal area of OKI. Although the entire protection forest covers approximately 105,000ha, we designated 66,500ha between the Sugihan River and the Lumpur River as a planned project are after consultation with Dinas Kehutanan Kabupaten OKI. We obtained a REDD+ project permission for 23,500ha between the Sugihan River and Cape Tapah in 2013. We will start the operation of the REDD+ project in the 23,500ha as the first step. Our project will realize the reduction of CO2 emission by controlling deforestation and forest degradation with appropriate preventive measures against those drivers. Moreover, carbon stock will be enhanced through promotion of growth of forests which have gradually rehabilitated by themselves and young forests and plantation in grassland and bare land. While the project area has been designated as a protection forest by government, nevertheless there are some communities living at the mouth of natural rivers in the area. Although residence in protection forests is not allowed in Indonesia, the governor of OKI has approved those communities as administrative villages since they started living there before designation of the protection forest. We will carry out REDD+ project activities in the project cooperating with the communities and local residents in the protection forest. Since we believe that REDD+ projects will never be realized without local residents’ awareness of forest protection, we will establish a system which actively involves them in the project. Especially regarding field works such as monitoring, forest conservation, and plantation activities in the protection forest, it is planned for them to carry out those general works by themselves eventually with our provision of education and technique transfer to them. Our REDD+ project will bring employment opportunities and increase of cash income into the local residents. Improvement of their awareness of environment and forest conservation can be also expected

5
through their direct participation in the activities. 2.3 Project Area
2.3.1 Location 66,500ha of the protection forest in coastal area of OKI (105,000ha) is planned as our REDD+ project area. We have already obtained a permission for 23,000ha (northern area) in 2013. The project area is long and narrow, and it covers approximately 180km of coastline with 2.5km to 15km width. It is adjacent to the sea in the north and production area in the west. The project area was designated as a protection forest by the Forestry Minister in 1986. While it is the state land, the local government of OKI manages, controls, and operates the protection forest and Dinas Kehutanan Kabupaten OKI is in charge of the practice. There are some communities at the mouse of the natural rivers in the protection forest.
Table 2-1 Project Area Project site Protection forests in Organ Komering Ilir
Regency, South Sumatra Province, Republic of Indonesia
Area Approximately 66,500ha (Small changes in the future can be expected depending on the level of receding/prograding shoreline.) The project permission for the 23,500ha of 66,500ha has already been obtained.
GPS East Longitude 105°33′-106°05′ South Latitude 2°23′-3°25′
Distance of shoreline Approximately 180km Area width Approximately 2.5km-15km Boundary North:The Sugihan River
South:The protection forestss of OKI East:the Bangka Strait. West;Inland production forest area
Main tree species Mangroves and tropical inland tree species Condition Deforestation and forest degradation can be
recognized in 65% of the entire protection forest

6
While 66,500ha is our planned project area, we have obtained a project permission only for 23,000ha which is the northern part of the 66,500ha. We divided the area into 2 parts (northern and southern area) since there is a possibility that a different type of project concession might be applied for those area due to their different condition; forest cover relatively remains in the northern area, but little remains in the southern area due to the progressive development of aquaculture ponds. This is all based on the consultation with Dinas Kehutanan Kabupaten OKI.

7
Figure 2-1 Organ Komering Ilir, South Sumatra, Indonesia

8
Figure 2-2 Planned project site in the protection forests of Organ Komering I
Figure 2-3 23,500ha with a project permission (encircled with red line)
Cape Tapah

9
2.3.2 Vegetation distribution The figure below shows land cover classification of the 23,500ha of the project area in 2012.
Figure 2-4 Land cover classification with satellite images of RapidEye

10
Figure 2-4 is a land cover map. Vegetation can be recognized in the area other than the white colored area which shows clouds, black colored area which shows cloud shadows, and blue colored area which shows water. The dark and light green colored area shows distribution of Rhizophora sp. and Bruguiera sp., the yellowish green colored area shows distribution of Avicennia sp., the light pink colored area shows distribution of Nypa sp., the dark violet colored area shows distribution of secondary forest, the light orange colored area shows distribution of glass land, and the gray colored area shows distribution of bare land. There are Melareuca sp. and other species naturally growing in the part of the secondary forest which turned glass land due to forest fires and land cultivation in the past. The table below shows the distribution ratio in the project area. However, the area with water, clouds, and cloud shadows are excluded.
Table 2-2 Vegetation distribution and its ratio Vegetation Ratio
Rhizophora sp. and Bruguiera sp. 44.3% Avicennia sp. 3.4% Nypa sp. 2.0% Secondary forest ( Melaleuca sp. and others)
18.8%
Glass land 22.6% Bare land(no major vegetation) 9.0%
2.4 Drivers of deforestation We identified the drivers of deforestation in 66,500ha of the planned REDD+ project area. A REDD+ project permission has already been obtained for the northern area between the Sugihan River and Cape Tapah of the 66,500ha. Since the drivers in the northern and southern area differ greatly, we divided the entire project area into 2 parts and analyzed them respectively.
2.4.1 Northern area The area of 52,700 ha between the Sugihan River and Cape Kait is considered as the northern area.

11
【Driver 1】Fire spreads from the neighboring production forest and suspected arson attacks
There is a production forest on inland side of the project area, and a channel was constructed as a border between the production and protection forests. However, the fire from intentional burn in the production forest sometimes crosses the border (channel) and spreads into the protection forest. Intentional burn is usually started right before the rainy season starts expecting natural fire-extinguishing by rain, but fire spreads into larger area can be often seen these days since the fire-extinguishing is delayed due to the late start of the rainy season following the climate change. Moreover, the fire spreads from illegal logging which is mentioned in the section of “Driver 2” often happen as well. 【Driver 2】Illegal logging for timber use Illegal logging is still ongoing in the protection forest now. While giant mangroves used to be logged, Melaleuca sp. has been logged instead these days.
Mangroves were logged at the mouse of the Batang River for the period from the mid to the late of 1990s. Although giant mangroves were logged as a construction material with 20 lumber mills scattered around the Batang River during the peak period, all of them were closed according to strengthening of control over illegal logging in the protection forest in 2000. These days logging has been carried out near the rivers without villages other than the Batang River and artificial channels. We could confirm the actual condition visiting the site for field surveys this time. Melaleuca sp. is often used for scaffoldings and pillars of high-floor type residences above water for its high water resistance to be a major lumber in coastal area. Moreover, it grows very fast and reaches the height enough to be used as a lumber in 5years. The fire was applied for logging on every site we visited this time (several sites) where trees were cut down. Since Melaleuca sp. has a narrow tree canopy, high height, and small tree crown, undergrowth easily grows around it. Also, vines grow creeping and climbing the Melaleuca. Therefore, fire is used to burn off the undergrowth and vines and to secure a safe foothold for works before logging. It is assumed that the logging method with fire has been applied for Melaleuca sp. as its wooden core which is covered by many and thick layers of bark can be used as lumber despite fires. Some logging sites could be found along rivers and channels, and all logged trees were carried to the mouse of the rivers and heaped up in piles. Name tags of owners attached on them were also found. They might be transported

12
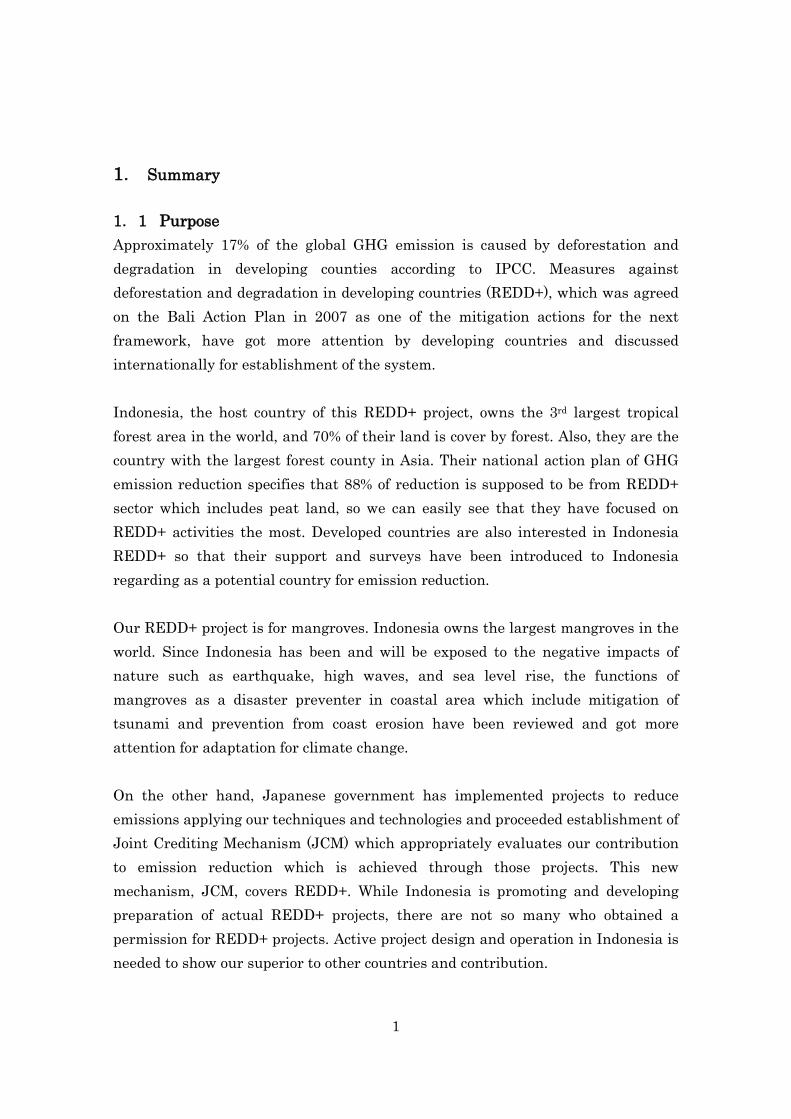
by sea later, we assume. Those illegal loggers are from Bangka Island, which locates the opposite shore, according to the information from local residents in Batang village, which is the only village in the surrounding area. It takes only 1hours by speed boat from Bangka Island when waves subside. Some villagers told us that they saw a boat which came from Bangka Island for fishing going back with heaped up lumbers loaded on. The next 5 photos shows the condition of logging site and the lumbers which were heaped up in piles.
Photo 2-1 Condition of logging site1
13
Photo 2-2 Condition of logging site 2
Photo 2-3 Condition of logging site 3

14
Photo 2-4 Lumbers which were heaped up in piles1
Photo 2-5 Name tag which was attached on the heaped up lumbers

15
【Driver 3】Development of aquaculture ponds Most of the illegal logging and land conversion for development of aquaculture ponds were done by trespassers from outside area. Although aquaculture industry has prospered in Lampung province, which locates on the south side of OKI, development of aquaculture ponds within the province reached the saturation so that it has gone into OKI seeking for the new land to be developed. The aquaculture ponds have been constructed in the halfway across the river to secure a water stream, so the ponds are hardly recognized from sea side. Such location realizes no influence by sea waves.
Most aquaculture ponds in the northern area are not in operation but abandoned now. 2 types of aquaculture ponds could be identified in our survey of the abandoned aquaculture ponds. Major type was the aquaculture ponds which were constructed with clearing mangroves along rivers, and another is those which were constructed with the use of small streams (water is brought from the streams by excavating trenches as a frame of the pond and damming up the streams for culturing space). Since the latter does not involve logging and cause remarkable land cover change, the construction is hardly found.
Now those aquaculture ponds have been abandoned. Those have helped forest natural rehabilitation. However, there is a high possibility that the development of aquaculture ponds will be re-accelerated. 3reasons for the possibility can be considered. Firstly, the number of shrimp farmers will increase following the rises in shrimp price in recent years. Secondly, there is no room for development of aquaculture ponds in the southern area where the development has saturated. Since construction of aquaculture ponds has been progressed in Banyuasin, a province which is adjacent on the north side of OKI, it is easily expected that the protection forests for our REDD+ project will be targeted for development for its good location (between Banyuasin and Lampung and along coastline). Thirdly, establishment of a shrimp fry hatchery in Banyuasin is planned by a shrimp fry supplier.
Since there is no shrimp fry hatchery around this area so far, only the hatcheries in Lampung are available when purchasing. However, this forces vulnerable shrimp fries to be exposed a long distance transportation. Therefore, establishment of hatchery around this area will reduce the risk of weakening of shrimp fries for the

16
long distance transportation and will promote further participation by local residents in shrimp aquaculture industry.
We assume high possibility of re-prosperity of development of aquaculture ponds in the area for those reason. It could be the biggest reason for deforestation in the future.
Photo 2-6 The site of an aquaculture pond
【Driver 4】Forest degradation due to environmental change which is caused by
construction of channels and soil sedimentation ≪Construction of artificial channels≫ There are channels for carrying logs which were constructed by forestry production enterprises to connect production forest area which is adjacent to inland to the sea crossing over the protection forest. They were constructed with cranes by excavating and piling up soil along the channels. Since the soil which has been piled up dams up the natural water flow of the river, it has caused withering vegetation and deforestation in the surrounding area due to poorer hydrological cycle. There are about 10 artificial channels identified in the project area with different frequency of use. While construction of channels in protection forests requires a permission by Forestry Ministry, OKI has issued permissions for those 10 channels

17
instead. Therefore, the central government (Forestry Ministry) has not grasped the existence of those channels. Moreover, changes in hydrological cycle and vegetation due to construction of those channels have not been recognized even by OKI local government.
Photo 2-7 Artificial channels Forest degradation in the area between the Batang River and Cape Tapah which was caused by construction of channels is remarkable. The figures below show the historical change from 1989 to 2012 captured by satellite images of LANDSAT and Rapid Eye. The yellow line shows boundary, and the perpendicular boundaries from coastline towards inland are excluded from the project area as a buffer zone of the channels. Although the channels are hardly recognized with the image of 2004, they are easily recognized with the image of 2009. Therefore, it can be said that those channels were constructed during the period from 2004 to 2009 and have caused forest degradation.

18
Figure 2-5 Historical change of the southern part of the project area

19
≪Natural soil sedimentation≫ Deforestation and forest degradation have progressed in the center part of the cape which locates in the south of the Sugihan River. Also, regular water stagnation over the area was revealed by field surveys. Vegetation of Rhizophora sp. and Avicennia sp. could be recognized in the area, Rhizophora sp. still stood but has withered with rotting canopy. Acivennia sp. also still stood but was withering with less foliage biomass in the canopy. The canopy cover in those deforestation/degradation area is about 10% to 50%. Higher water temperature and salinity level which is caused by regular water stagnation can be considered as a driver of those forest decline. Although identification of the water stagnation needs further research, we assume that the prograding shoreline of the cape has a big impact on this; while the soil which was lost for water flow are piled up in front of the shoreline and causes the prograding, the soil sedimentation in front of the shoreline dams up the water flow from inland so that the water is stuck and stays in the center part of the cape which is in the north.
Photo 2-8 Central area of the north point with inland water dammed up
We confirmed a big impact on hydrological cycle in the project area by environmental changes due to construction of cannels and soil sedimentation through our field surveys.

20
It can be confirmed that the area with less covered or water stagnation in the project area has expanded according to the monitoring of historical changes with satellite images.

21
Figure 2-6 Satellite images of north part of the project area with a point
(Blue or light blue colored area shows water stagnation or low land covered level)

22
【Driver 5】Misrecognition of a boarder and development The boarder of the protection forest is unclear in the area between the Batang River and Cape Tapah. While the yellowish green colored area on the map below shows protection forest, the light orange colored area shows production forest. Although the area which is encircled with red line is the REDD+ project area with a permission, the border between protection and production forests on the map below is not reflected correctly. This is because development of production forest has progressed in the protection forest as well due to misrecognition of the border by forestry production enterprises. Those area are not covered by the REDD+ project permission we obtained. Clarification of the border is essential for correct recognition of the protection forest area.
Figure 2-7 Southern area of the project area
2.4.2 Southern area
We decided to regard 13,800ha of the 66,500ha (the entire project area) between Cape Kait and the Lumpur River as a southern area. Since we have not obtained a project permission for this area yet, we assumed deforestation drivers based on our 4 field surveys and analysis of satellite images. Although further surveys on the drivers are necessary, following is the driver we have identified so far. 【Driver】Logging for development of aquaculture ponds Aquaculture ponds are distributed over the southern coastal area. While forests which include mangroves used to cover over the entire area, they were cleared and converted into aquaculture ponds. All small square plots which can be seen on the

23
satellite image of the southern area below are aquaculture ponds. There are some villages at the mouse of the rivers, and aquaculture business has still been in operation by the villagers. There is the biggest village of this protection forest in this area for the location which can be easily accessed from/to Lampung and is linked to inland towns via the Lumpur River. Since many villagers devote themselves into aquaculture business, it is hardly expected that those aquaculture ponds will be abandoned and turn forests again.
Figure 2-8 Southern area
2.5 Project activities This is the REDD+ project not only for control over deforestation and forest degradation, which is a general element of REDD, but also for active evaluation on CO2 emission reduction and enhancement of carbon stock with quantitative and qualitative forest expansion by planting as well as promotion of growth of young trees and natural restoration through forest management.
【Elements of CO2 emission reduction and enhancement of carbon stock in this

24
project】 ① CO2 emission reduction by controlling over deforestation and forest
degradation ② Enhancement of carbon stock through promotion of growth of young trees and
forest rehabilitation in the area where forests tend to rehabilitate naturally. ③ Enhancement of carbon stock through planting activities in degraded area
such as grassland and bare land
Figure 2-9 CO2 emission reduction and enhancement of carbon stock by this project

25
2.5.1 Implementation system This is an organization map for implementation of the project.
Figure 2-10 Organization system for implementation of the project

26
● YL Group YL Group will develop and supervise the REDD+ project. The tasks include project design, development of a methodology, study on safeguards, preparation of a PDD, fund operation, and coordination of all stakeholders. YL Group is a project developer and a joint implementer with a contract of collaboration for REDD+ project with PT. Tiara Asia Permai. YL Group owns PT. Yamamoto Asri, the local subsidiary in Indonesia. PT. Yamamoto Asri will support establishment of a robust relationship and cooperation between YL Group in Japan and PT. Tiara Asia Permai in Indonesia.
● PT.Tiara Asia Permai
PT. Tiara Asia Permai is an Indonesian company (BUMS) with 100% Indonesian capital led by an Indonesian representative. The development manager of YL Building Co., Ltd. and the director of PT. Yamamoto Asri (concurrently) assumed office as a director and obtained a project permission (IUPJL-HL) with a contract of collaboration for the REDD+ project with YL Group. The task includes supervision on field works, technique transfer, development of human resources, construction of a framework for work implementation, organization of working groups, coordination with local communities, implementation of safeguards, reporting to related ministries and agencies, and implementation of an awareness building and facilitation activities. An on-site office which is like a base camp was built in Sungai Batang in 2014, and now 2 staff from Sungai Batang and 2 staff from Sungai Sugihan have been hired as regular employees and stationed in the office. Regarding the activities which are related to the on-site office, we will describe the details on Chapter 9 “Operation of a pilot project” in this document.
● Sungai Batang Community
Sungai Batang has organized a Klompok (working group), which consists of a leader (the head of the village) and 80 villagers. Since villagers based on the Klompok play a roll of on-site works, meetings, seminars, technique transfers, and development of human resources will be implemented in the village. The technique will be transferred to members of the Klomplok first to develop the human resources who can play a core role in on-site works. Then, they will

27
transfer the technique to the villagers. Since most part of the actual works in the protection forests are heavy works, main participants in the on-site works will be men. However, we would like to promote women to participate in administrative works within the village such as aggregation of data and preparation of reports as well to provide men and women with equal opportunity of participation in the REDD+ activities. The ordering of on-site works and payment to Sungai Batang for the works will be done through Koperasi, which is a cooperative association in Sungai Batang.
● Sungai Sugihan Community
Organization of Klompok and establishment of framework for activity implementation will be carried out. Sungai Sugihan locates on the river which is a border between OKI and Banyuasin but belongs to Banyuasin. Since it is difficult for Sungai Batang to carry out all works for the REDD+ project in 23,500ha alone concerning the number of the villagers but there is no other village around Sungai Batang, we have requested Sungai Sugihan, which is adjacent to the project area and the closest community from Sungai Batang, to participate in the project as well although they locates in a different regency. Also, as they have supported and participated in mangrove planting activities in tidal flats for the project which has been implemented by PT. Yamamoto Asri since 2007, a robust relationship is already established with an understanding for REDD+ projects. Therefore, we considered that they are appropriate for our REDD+ project this time. The coordination of activities with Sungai Sugihan will be done through CV. Dua Putri as done for planting activities for PT. Yamamoto Asri in the past.
● Direktorat Perlindungan Hutan dan Konservasi Alam
Direktorat Perlindungan Hutan dan Konservasi Alam is an organization to manage protection forests and conservation area and formulate and implement related policies. Since the project permission we obtained this time is for the use of environmental services in protection forests, it is required to implement the project in accordance with regulations and rules for protection forests. The sector of Forestry Ministry which has a jurisdiction over protection forests is Direktorat Perlindungan Hutan dan Konservasi Alam. Therefore, it is obliged

28
to consult and coordinate with them and to report the projects in protection forests to them. According to the Directorate General of Use of Environmental Services of Protection Forests in Protection Zone, Direktorat Perlindungan Hutan dan Konservasi Alam, they will start formulating policies soon since there are not many rules for REDD+ projects in protection forests yet so far. Therefore, we have developed our project with the direct confirmation about prohibited matters and consultation about technical matters with him. A new president of Indonesia was inaugurated in 2014 and merged Forestry Ministry and Living Environment Ministry into Ministry of Environment and Forestry. Now reorganization of all Directorate General of Ministry of Environment and Forestry has been proceeded. It means there is a possibility that Direktorat Perlindungan Hutan dan Konservasi Alam will be changed into a new Directorate General. In that case, we will coordinate with new Directorate General which is in charge of protection forests instead.
● OKI prefectural government
The permission of our REDD+ project, which is called “Izin Usaha Pemanfaatan Jasa Lingkungan di Hutan Lindung(IUPJL-HL)”, were issued by the governor of OKI in accordance with Indonesian laws and regulations. After obtaining the permission, we have prepared a project plan for next 10years and submitted it to the governor of OKI with confirmation and agreement by the Director of Dina Kehutanan Kabuoaten OKI. Also, we have submitted an annual implementation when starting the project and an annual report when finishing the project every year while submitting all their copies to Directorate General of Use of Environmental Services of Protection Forests in Protection Zone, the Director of Dinas Kehutanan Provinsi Sumatera Selatan, the Head of Balai Konservasi Sunber Daya Alam Palembang, the Head of Balai Pengelolaan Hutan Mangrove Wilayah Ⅱ Medan, and the Head of Balai Pengelolaan hutan Mangrove Wilayah Ⅱ Palembang as well.
● Dinas Kehutanan Kabaupaten OKI
We have established a robust cooperative relationship for our REDD+ project with Dinas Kehutanan Kabaupaten OKI and carried out field surveys together. They also have advised us for preparation of annual implementation plan and report.

29
● Dinas Kehutanan Provinsi Sumatera Selatan
We have reported our REDD+ project by submitting our annual implementation plan and report. We have established cooperative relationship through regular information exchange and sharing and invitation to meetings and seminars of REDD+ and forest related CSR.
● Balai Konservasi Sunber Daya Alam Palembang
We have reported our REDD+ project by submitting our annual implementation plan and report. They provide coordination and consultation concerning animals and endangered species in the protection forests.
● Balai Pengelolaan Hutan Mangrove Wilayah Ⅱ Medan
We have reported our REDD+ project by submitting our annual implementation plan and report. Since our project area has many mangroves and we will plant mangroves within, reports of our project progress to them is necessary.
● Balai Pengelolaan Hutan Mangrove WilayahⅡ Palembang
We have reported our REDD+ project by submitting our annual implementation plan and report. Since our project area is forest, regular report of our project progress to them is necessary.
2.5.2 Activities
The table 2-3 shows on-site activities for each element of CO2 emission reduction and carbon stock in the project. Since the northern and southern area are in quite different natural condition, the activities for those area also differ. Therefore, we will implement measures agains drivers of deforestation and planting and monitoring activities in the northern area and facilitation of Silvofishery and monitoring activities in the southern area.
Table 2-3 Activities for each project element Northern area 1 Measurement for
drivers of deforestation
Activities for project element 1) CO2 emission reduction through forest protection and 2) Enhancement of carbon stock through natural rehabilitation and growth of forests

30
2 Planting, promotion of growth, and management
Activities for project element 3) Strengthening of carbon stock through planting
3 Monitoring Monitoring for incentives (credits) corresponding to the project performance
Southern area 4 Facilitation of
Silvofishery Since most of the area are used for development of aquaculture ponds by clearing forests, we will aim at strengthening of carbon stock through forest rehabilitation by introducing Silvofihery
5 Monitoring Monitoring for incentives (credits) according to the project performance
1) Measures against deforestation
We have identified drivers of deforestation which was described in 2.4 Drivers of deforestation”. Identified drivers in 52,700ha of the northern area were
【Driver 1】Fire spreads from neighboring production forests and suspected arson attacks
【Driver 2】Illegal logging for timber use 【Driver 3】Development of aquaculture ponds 【Driver 4】Forest degradation due to environmental change which is
caused by construction of channels and soil sedimentation 【Driver 5】Misrecognition of a boarder and development
1. Fire prevention
This is the measure activity for fire spreads from neighboring production forests and suspected arson attacks. As described in the section of “Driver 1”, the fire for intentional burn in the production forest sometimes crosses the border (channels) and spreads into the protection forest. This is because the weeds growing along both sides of the channels so as to cover all over the channels promote the fire spreads through plants which are easily fired. Therefore, we will implement regular weeding along the channels (border) to prevent fire spreads by securing enough space of channels (border).

31
Regarding suspected arson attacks, since forest fires are sometimes caused by carelessness about tobacco during the dry season, we will establish rules with the villages to pay careful attention to actions which lead to suspected arson attacks and will prepare a system to remind and alert each other during the dry season.
2. Awareness building of illegal logging and prohibition Illegal logging of any tree species is not allowed in the project area since it locates within the protection forest. This is the measure against Driver 2, Driver 3, and Driver 5. We will promote people, enterprises, and organizations who come to the area from outside for logging and will prohibit the logging to be aware that logging in protection forests is illegal for. A few cases of logging by local residents in the protection forest for the timber use as a construction material or collection of Nypa leaves for roof could be also identified. Therefore, we will establish rules with the villages to completely prohibit logging which includes mangroves and Nypa. Also, we will install signboards to clearly inform that the area is in a protection forest, that we have implemented a REDD+ project in the area, and that severe punishment will be inflicted on illegal logging in accordance with laws and regulations.
3. Patrol and observation We will patrol the forests to control illegal logging and land development. This is the measure against Driver 1, Driver 2, Driver 3, and Driver 5. We will organize patrol teams based on Klompok in Sungai Batang and Sungai Sugihan and will implement regular patrol in the project area. The patrol includes identification of trespassers, appropriate warning and explanation to them, and supervision on forest fires and illegal logging as well as observation of progress of deforestation/forest degradation, forest rehabilitation/growth, and newly planted area.
4. Sustainable forest management of a community forest
As mentioned on 2. “Awareness building of illegal logging and prohibition”, we still have the logging not for commercial use but for private use by local

32
residents from the villages in the protection forest. Those logging must be prohibited completely for implementation of the REDD+ project although the timber is necessary for their life. Therefore, we will build a circulation type community forest to be used for their life in 200ha of the land which was officially provided as a part of the Sungai Batang village area with a sustainable management system. While OKI prefectural government has secured 200ha as resident space for Sungai Batang villagers, only 5ha has been currently used and the rest (195ha) has not been used. The use of the 195ha as a community forest is legally allowed since it is designated as a part of the resident area which is excluded from the protection forest area. Establishment of a sustainable management system for the 195ha community forest to keep covering the lives of 1,000 villages by regular planting and logging is essential.
5. Clarification of a boarder
As mentioned in the section of Driver 5, correct recognition of the border between the protection and production forests is necessary since misrecognition has caused the extended development of the protection forest by forestry production enterprises. We will collaborate with Dinas Kehutanan Kabupaten OKI to improve the border condition and request the forestry production enterprises to retreat from the protection forest with their correct recognition of the border.
6. Trench excavation for drain and water supply This is the measure againist Driver 4. We will excavate trenches in the area where artificial or natural geographical change has caused water stagnation and improve water cycle with natural water supply by tidal action.
2) Planting, growth promotion, and management We will carry out planting activities in bare and degraded land with deforestation and forest fires. The appropriate tree species which are suitable for the land to be planted will be selected according to our vegetation surveys considering their effect on biodiversity and environment.

33
Then, we will promote and manage the forests which consist of newly planted trees. Those activities include supplemental planting in the area where trees fail to grow (withering or non-rooting) and weeding undergrowth which prevents them from growing. According to Forestry Ministry of Indonesia, logging of trees is not allowed while weeding of undergrowth to promote growth of trees is allowed in protection forests. Weeding will be needed until the height of the planted trees exceeds undergrowth.
3) Monitoring
Monitoring will be implemented mainly by Klomplok with villagers of Sungai Batang and Sungai Sugihan according to the prepared monitoring plan. Therefore, we will transfer the technique such as those for monitoring, organization of collected data, and preparation of reports before the monitoring.
4) Facilitation of Silvofishery
As mentioned in the above section “4.4 Drivers of deforestation”, most parts of the forest in the southern area have been cleared and converted into aquaculture ponds. Therefore, we will aim at mainly strengthening of forest rehabilitation and its capacity of carbon stock by introducing Silvofishery into those aquaculture ponds rather than addressing drivers for deforestation in this area. Securing enough production in those aquaculture ponds by Silvofishery will prevent from construction of new ponds; addressing the drivers of deforestation. Since Silvofishery is not widely known yet, we will describe the purpose and technical details of Silvofishery which is introduced in the project in the following section.
1. Purpose
Mangroves in the southern part of the protection forest were cleared and converted into aquaculture ponds. Since it is a protection forest, the forest rehabilitation is essential. However, there are many villagers who runs aquaculture ponds for a living, and it is difficult and unrealistic to turn all the ponds into forest again. Therefore, coexistence of forest rehabilitation and stabilized local residents’ livelihood by Sivofishery will be aimed.
2. Overview
“Silvofishery” is the word which is combined “Silviculture” and “Fishery”. We

34
will plant mangroves in aquaculture ponds and facilitate an environmental symbiotic type aquaculture technique which enable coexistence of forest and aquaculture.
3. Current condition of aquaculture ponds
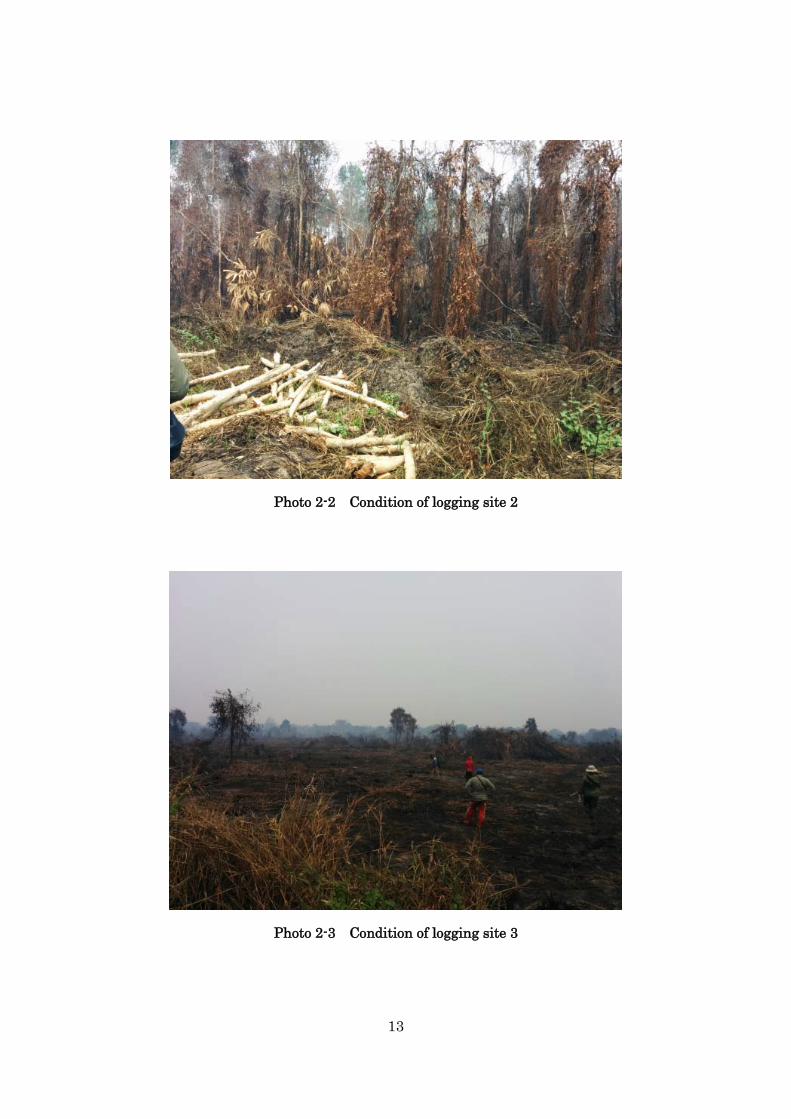
Current aquaculture method which is widely applied is Semi Intensive with construction of aquaculture ponds by clearing mangroves. Shrimp fries are released into the ponds where a lot of chemical feed and water quality agent (PH) are used in this method. Moreover, antibiotics is also used to reduce the risk of spread of diseases among shrimps. Those chemicals are piled up at the bottom of the ponds to be polluted sludge and causes water and soil pollution. It costs a lot as well. While shrimps can be harvested for a while after the ponds are constructed, production amount will decrease dramatically in 1 to 5 years due to the soil and water pollution, and shrimps will unable to survive in the ponds. Therefore, fishes which can be cultured even under such a poor condition have taken the place of shrimps to be cultured these days. Since the fishes are marketed at 1/3 to 1/5 price of shrimps, it has caused poorer livelihood of people who engage in aquaculture business with a significant income decrease.
35
Figure 2-11 Transition of intensive aquaculture ponds
4. Silvofishery technique When preparation of the land for Silvofishery, a waterway for aquaculture and mound for mangrove planting are constructed. Mangroves are planted in the center part of aquaculture ponds while fishes and shrimps are cultured in the surrounding waterway. Silvofishery aquaculture ponds don’t need chemical feed since enough microbes will naturally grow following the growth of mangroves in the center part. Moreover, mangroves will perform a function of biofilter to improve

36
water and soil quality even without water quality control agent or antibiotics. Sustainable operation of aquaculture business will be realized as well as improvement of pond environment.
Figure 2-12 Silvofishery pond
5. Outcomes
Since the environment of ponds is improved in 3 to 5 years after the introduction of Silvofishery, shrimp aquaculture in the ponds where fishes are currently cultured can be resumed. Compared to Semi Intensive ponds, the production amount in Silvofishery ponds will be less due to the limited space for aquaculture. However, the stable production can be expected instead. Since Silvofishery ponds will lower the fatality rate of shrimps, production amount of shrimps will increase compared to the number of shrimp fries which are released into the pond. They cost less without the use of feed and chemicals, so cost-effectiveness of aquaculture will be improved with less operation cost eventually. Also, the organic shrimps which are harvested in Silvofishery ponds without the use of chemicals are potential to be widely marketed with added value concerning food safety.

37
We will plant mangroves on irrigation channels and walkways as well as in Silvofishery ponds. The mangrove capacity for bank protection will reinforce embankments. We will aim at enhancement of carbon stock by implementing mangroves planting around the ponds to expand forest area not only in the pond area but also in the whole area.
2.5.3 Safeguards
While the project area is within the protection forest, there are some villages living there. We will encourage them in the area to actively participate in the REDD+ project and will establish a system that they can protect the forest by themselves and receive forests benefits in the future. 1) Effect on local residents’ livelihood
Mangroves have been logged illegally around Sungai Batang (the northern part of the project area) since the late 1990s when the area was crowded with lumber mills. Although the local residents used to participate in the logging for securing income by selling timers, the lumber mills were closed after strengthening of control over illegal logging in 2000. While there were many villagers who started illegal logging leaving fishery which had been their original income from, most of them make a living by fishing now. Since there are no villages which make a living by logging now, implementation of the REDD+ project won’t cause decrease in their income or effect on their livelihood. According to the interview with local residents, loss of natural resources due to logging caused a significant decrease in the catch when the lumber mills were in operation. We also got the information that the catch has been improved for recovery of forest function following forest natural rehabilitation after the lumber mills were closed. The villagers of Sungai Batang understand that expansion of natural resources is essential for stabilization of their livelihood by fishing. Therefore, the REDD+ project is welcomed by the whole village. It is planned that the villagers (mainly Klompok) of Sungai Batang will participate in on-site activities in the project. Therefore, opportunities of participation in the project will bring them an additional cash income source

38
other than their original income from fishing. In the southern area, most part of the coastal area were converted into aquaculture ponds. We will introduce Silvofishery technique to those ponds and plant mangroves in the ponds without seizing land of the ponds. So the residents can continue operation of their aquaculture business to secure their life and livelihood. We will assist preparation of the land and mangrove planting both technically and financially when traditional aquaculture ponds are shifted into Silvofishery ponds and establish a framework and system which encourage them to introduce the technique into their ponds. Also, we will contribute to stabilization of their livelihood by permanent forest maintenance and stabilization aquaculture production amount by managing mangrove growth in the Silvofishery ponds, transferring techniques, and providing support concerning aquaculture. It can be said that the REDD+ project can stabilize local residents’ life and livelihood in the whole project area without negative factors.
Although any forest logging is prohibited in protection forests, the timber use is a part of local resident’s life. Therefore, construction of a community forest within a village is planned to secure construction materials for residence and fishery. We will construct it in the residential area which is excluded from protection forest and support the local residents to secure a sustainable timber supply by continuous planting and promotion of the growth after logging and management of timber ration at the village level. Through those activities, the source of the timber for villagers’ life will be secured without any damage on the protection forest. We will proceed this activity consulting and coordinating with the protection forest related division of Direktorat Perlinadungan Hutan dan Konservasi Alam.
While the protection forest has some body of water and brackish water area with mangrove habitats, inland plants are growing in other area. In those area, Melaleuca sp has naturally consisted the secondary forest where Jelutong and Pulai used to consist a primeval forest. Therefore, we are planning to plant Jelutong, the native tree species in the area. The tap of Jeluton can be collected like lubber trees and used as a raw material of chewing gum and latex. Also, since it can be collected for a long period, it can

39
bring a long-term profit source into the local residents. Like this, benefits of forest can be received though forest protection and promotion of their growth without logging.
2) Participation in the project and disparity caused by the participation
The on-site activities in the project can be put into 2 categories; one is field work, and another is administrative work in the village. The field works include a lot of heavy works such as trench excavation, monitoring with long distance travel in the forest, and planting. It is expected that those activities will be carried out mainly by men. However, since administration works such as collecting, counting and selecting of seeds, aggregation of monitoring data, and preparation of reports can be carried out without physical limitation on the other hand, women and the olds can participate in those activities. The REDD+ project will encourage participation not only by men but also women with appropriate work sharing and pay careful attention to disparity for gender. We established an on-site office which is like a base camp within the project area in 2014. Now 4 staff who were singled out from villages have been stationed and served as mediator between local residents and us. The office is opened to collect local residents’ requests and opinions as well as their concerns, questions, and complaints about the REDD+ project, and the local residents can access the office anytime. This office will help strengthening the understanding and sense of security of the project by local residents to promote their willingness to participation as well. Moreover, we will maintain the same payment rate for works and will disclose the information of profits by carbon credits which will be generated in the future and income distribution from byproducts which include Jelutong to secure fairness of whole villages. This includes installation of a notice board in front of the office to disclose all those information so that all residents can confirm and understand the REDD+ project.
3) Concerns for biodiversity While we carry out planting activities in the project, we won’t bring foreign species in the area but plant native species in appropriate area and will pay

40
careful attention and prevent from destroying them. There are animals living in the protection forest which includes endangered species. We will pay careful attention to those and prevent from hurting them or threating their living space. Also, we will report to and coordinate with Balai Konservasi Sunber Daya Alam Palembang concerning how to treat those species in accordance with Indonesian laws and regulations.
3. Development of approaches to wide area monitoring 3.1 Approaches to wide area monitoring that was designed before FS2014 In FS2012, we have developed a highly accurate method by combination of ground survey and remote sensing technologies in the pilot area (approximately 2,100 ha). In FS2013, based on the novel methodology developed in FS2012, we have developed a method for wide area monitoring by comparing spatial volume’s based on ALOS/PRISM and spatial volume's based on airborne Lidar. And we performed monitoring of carbon stocks in Northern part of the region planned for the project (23,500 ha). In FS2014, we performed monitoring of carbon stocks in Southern part of the region planned for the project (43,000 ha) using the method developed by FS2013. 3.2 Approach to wide area monitoring improved in FS2014 and its results 3.2.1 Target region Among the region planned for the project 66,500ha, the target area is 43,000ha from Cape Tapa to the Lumpur River. 3.2.2 Understanding of the current status of land use/land cover by satellite
imagery 1) Land use/land cover classification by RapidEye satellite imagery Figure 3-1 is the RapidEye satellite image featuring the entire target region and Figure 3-2 is the land use/land cover classification map. The types of the land use/land cover classification presented here have been slightly modified from those

41
in FS2013 and include the following 11 types: High Density Rhizophora sp. + Bruguiera sp. (hereinafter called “HD Rhizophora sp. + Bruguiera sp”), Low Density Rhizophora sp. + Bruguiera sp. (hereinafter called “LD Rhizophora sp. + Bruguiera sp”), Avicennia sp., Melaleuca sp., Secondary Forest, Nypa sp., Grassland, Bareland, Water, Cloud, and Cloud Shadow. Avicennia sp. is approximately equally distributed along the coast, extending approximately 8 km from the shoreline in the northern area of the target region. Rhizophora sp. and Bruguiera sp. are distributed further inland than Avicennia sp., extending approximately 2 to 3 km inland from the shoreline. Distribution of Nypa sp. concentrates along the river and the furthest inland side of the target region is covered extensively by Melaleuca sp. and Secondary Forest. Although Avicennia sp. is distributed along the coast in the southern area of the target region, Bareland is distributed inland by the development of fishponds.

42
Figure 3-1 RapidEye satellite image

43
Figure 3-2 Land cover map generated from RapidEye satellite image
44
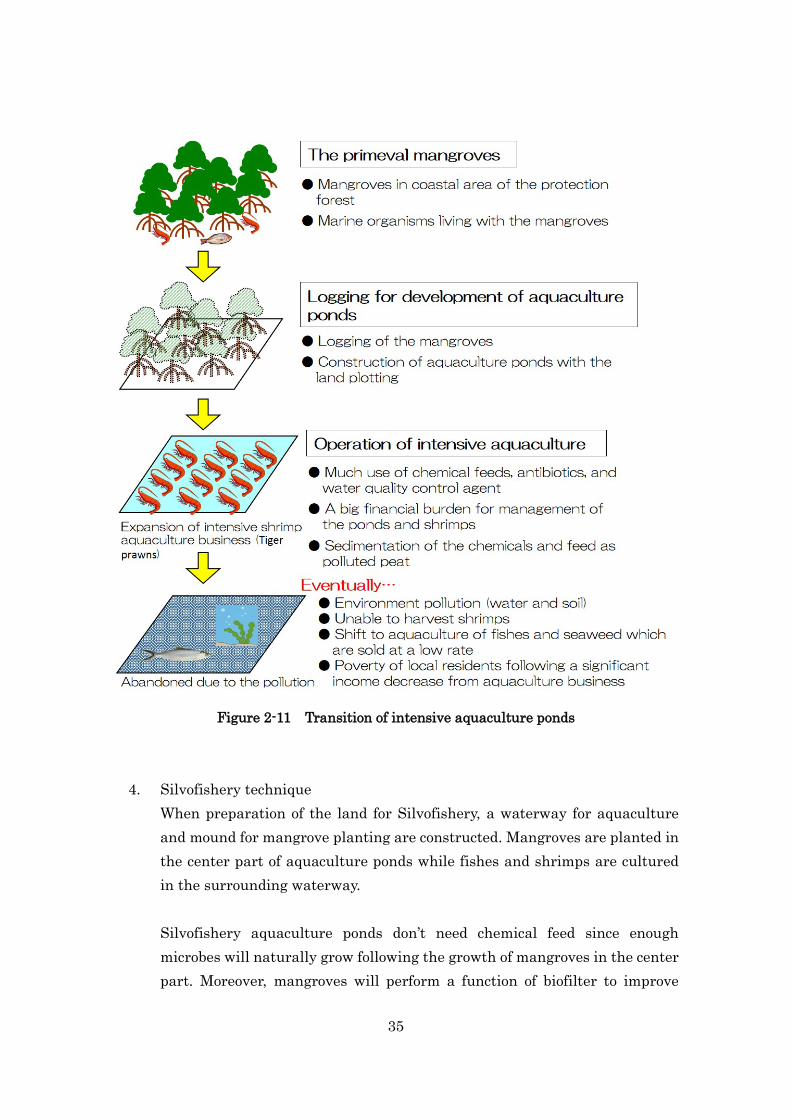
2) Acquisition of verification data The Guidelines for Implementing REDD+ (Forestry and Forest Products Research Institute) define the required accuracy levels of the land use/land cover classification at 80% or above for classifying accuracy of forest/non-forest and 70% or 80% for distinguishing accuracy per forest category. Accordingly, we acquired verification data of the 12 samples by ground truth from November 7, 2014 through November 11, 2014 so as to assess accuracy of the land use/land cover classification resulting from the RapidEye satellite imagery. Locations of verification samples and ground-truthing travel track are shown in Figure 3-3.
Figure 3-3 Locations of verification samples
3) Accuracy Evaluation of Land Use/Land Cover Classification Map

45
Results of the accuracy evaluation of the land use/land cover classification map are displayed on Table 3-1. The overall accuracy was 75%, thereby ascertaining that the required accuracy level has been satisfied. Table 3-1 Results of accuracy evaluation of land use/land cover classification map
*Forest : HD Rhizophora sp. + Bruguiera sp, LD Rhizophora sp. + Bruguiera sp, Avicennia sp., Melaleuca sp., Secondary Forest, Nypa sp. *Non forest : Grassland, Bareland, Water
3.2.3 Estimation of carbon stocks in the target region Carbon stocks in the entire target region were estimated by multiplying the areas by classification type of land use/land cover of the entire target region based on the RapidEye imagery by the carbon stock factor (Table 3-3). The results are shown in Table 3-4. Thus, the carbon stocks in the entire target region were estimated at 1,073,898 t-C.
Table 3-4 Carbon stocks in the entire target region
Area(ha) CSF (t C/ha) CS (t C)
HD Rhizophola sp.+ Bruguiera sp. 4,305 114.9 494,481LD Rhizophola sp.+ Bruguiera sp. 2,531 92.2 233,449Avicennia sp. 361 170.0 61,321Melaleuca sp. 1,665 14.7 24,473Secondary Forest 1,220 199.0 242,745Nypa sp. 512 34.0 17,429Grassland 8,477 0.0 0Bareland 9,009 0.0 0Water 1,726 0.0 0Cloud and Cloud Shadow 13,195 0.0 0
Total 43,000 1,073,898
CSF : Carbon Stock FactorCS : Carbon Stock
46
3.2.4 Understanding of temporal profiles of land use/land cover using satellite
imagery in chronological order Temporal profiles of land use/land cover have been identified by estimating areas of land use/land cover from previous LANDSAT imagery. The LANDSAT imagery which we utilized was acquired at the following four time points to be used in FS2012. The benchmark year for the temporal profile analysis was set at 2012, when the RapidEye satellite images were acquired.
June 19/March 31, 1989 LANDSAT4 TM 23 years ago April 14, 2000 LANDSAT7 ETM+ 12 years ago August 7, 2004 LANDSAT5 TM 8 years ago August 5, 2009 LANDSAT5 TM 3 years ago August 4, 2012/September 14, 2012 RapidEye Benchmark year
Figure 3-8 displays the LANDSAT satellite imagery taken in 1989, 2000, 2004, and 2009. The previous land use/land cover classification maps were revised by locating changes based on the land use/land cover classification map created in 2012 from RapidEye satellite imagery so as to produce land use/land cover classification maps for the respective years. The land use/land cover classification maps for 1989, 2000, 2004, and 2009 are displayed in Figure 3-9.

47
(a)1989 (b)2000
(c)2004 (d)2009
Figure 3-8 Previous LANDSAT imagery

48
(a)1989 (b)2000
(c)2004 (d)2009
Figure 3-9 Previous land use/land cover classification maps

49
The areas by land use/land cover classification type for each time point and the proportion are shown in Table 3-5 and Figure 3-10, respectively. Additionally, to make conservative estimates of carbon stocks, the areas which were classified as Cloud or Cloud Shadow in a land use/land cover classification map at any one time point of 1989, 2000, 2004, 2009, and 2012 were defined as Cloud or Cloud Shadow for all time points. Table 3-5 and Figure 3-10 imply the following tendency of the changes in land use/land cover for the target region: From 1989 through 2000, HD Rhizophora sp. + Bruguiera sp. tends to decrease
dramatically by the fish ponds development. Then, from 2000 through 2009, HD Rhizophora sp. + Bruguiera sp. showed an increasing trend which is likely to be attributable to the growth of LD Rhizophora sp. + Bruguiera sp. and the recovery of the abandoned fish ponds. But, from 2009 through 2012, HD Rhizophora sp. + Bruguiera sp. showed slight decrease again. This decrease trend attributed to the fish ponds development in the southern target area and the natural extinction associated with the expansion of the Bareland.
LD Rhizophora sp. + Bruguiera sp. tended to marked decrease from 1989 through 2004, whereas it showed a slight increase from 2004 through 2012.
The area of Avicennia sp. tends to increase slightly. The Melaleuca sp. tends to increase from 1989 through 2009 whereas it showed
a slight decrease from 2009 through 2012. Neither extreme change in area nor systematic increasing/decreasing trend is
noted for Secondary forest. Nypa sp. tends to increase.
Grassland tends to decrease dramatically. Bareland increased from 1989 through 2009 by the fish ponds development, but
showed a slight decrease from 2009 through 2012 due to the recovery of the abandoned fish ponds.

50
There is territory classified into cloud and the cloud shadow 13,195 ha, and it accounts for 30% of the whole. It's future's problem to make the cloud-free landcover maps by using radar satellite imageries like the "ALOS-2" launched from Japan in May, 2014.
Table 3-5 Areas by land use/land cover classification type for each time point
Figure 3-10 Proportion of areas by land use/land cover classification type for each
time point
(ha) 1989 2000 2004 2009 2012HD Rhizophola sp.+ Bruguiera sp. 9,703 3,104 4,164 4,519 4,305LD Rhizophola sp.+ Bruguiera sp. 3,620 1,281 911 1,045 2,531Avicennia sp. 274 230 248 261 361Melaleuca sp. 906 1,253 1,637 1,837 1,665Secondary Forest 913 231 370 365 1,220Nypa sp. 158 226 375 593 512Grassland 12,001 12,551 10,824 8,889 8,477Bareland 103 9,545 9,624 10,466 9,009Water 2,126 1,385 1,652 1,830 1,726Cloud and Cloud Shadow 13,195 13,195 13,195 13,195 13,195
Total 43,000 43,000 43,000 43,000 43,000

51
3.2.5 Estimation of temporal profiles of carbon stocks in the target region Table 3-6 and Figure 3-11 present the temporal profiles of carbon stocks in the entire target region. Although the carbon stocks in the entire target region decreased by approximately 1,110,000 t-C from 1989 through 2000 due to the development of fish ponds. The carbon stocks in 2012 are lower than those in 1989 by approximately 620,000 t-C although the quantity is increasing slowly as Rhizophora sp. + Bruguiera sp.—which once turned into bareland due to the development of fish ponds in the northern area—is recovering gradually.
Table 3-6 Temporal profiles of carbon stocks in the target region
1989 2000 2004 2009 2012HD Rhizophola sp.+Bruguiera sp.
2,962,930 1,114,489 356,557 478,340 519,063 494,481
LD Rhizophola sp.+Bruguiera sp.
866,033 333,955 118,130 84,073 96,426 233,449
Avicennia sp. 233,527 46,601 39,172 42,092 44,341 61,321Melaleuca sp. 107,263 13,316 18,411 24,067 26,996 24,473Secondary Forest 616,502 181,741 45,870 73,562 72,584 242,745Nypa sp. 63,389 5,379 7,678 12,748 20,154 17,429Grassland 0 0 0 0 0 0Bareland 0 0 0 0 0 0Water 0 0 0 0 0 0
Total 4,849,644 1,695,481 585,817 714,882 779,565 1,073,898
CSF:Carbon Stock FactorCS: Carbon Stock
Landuse / Landcover CSF(t C/ha)
CS(t-C)

52
Figure 3-11 Temporal profiles of carbon stocks in the target region
4. Results of calculation based on novel methodology 4.1 Establishment of REL 4.1.1 Establishment of REL in the target area (43,000 ha) Changes in areas of HD Rhizophora sp. + Bruguiera sp., LD Rhizophora sp. + Bruguiera sp., Avicennia sp., Melaleuca sp., Secondary Forest, and Nypa sp.—which fall under the criteria of forest—were aggregated by defining the level in 2013, when the concession for the target region was granted, as benchmark. The results are shown in Table 4-1. Further, when cloud-free landcover maps will complete it using radar satellite images, these value changes because an area change is being totaled except for the

53
territory classified into cloud and the cloud shadow as it was told in 3.2.3.
Table 4-1 Changes in areas by forest category by setting 2013 as benchmark
(target region)
Fig. 4-1 presents the results of plotting based on Table 4-1 with x-axis and y-axis showing observation years and areas by forest category, respectively. Future forest area was estimated by modeling the temporal profiles of the areas by forest category using logistic regression based on Fig. 4-1 and extrapolating them. Extreme deforestation by fish pond development brings about "HD Rhizophora sp.+Bruguiera sp." and "LD Rhizophora sp.+Bruguiera sp." categories from 1989 to 2000. Therefore, temporal profiles of the areas were modeled except 1989 because continuity with their area change in after 2000 weren't seen. Furthermore, illegal cutting occurs periodically as a "Melaleuca sp." and "Secondary Forest" categories referred in the drivers of deforestation. Because trends of increase/decrease couldn't be found, the average area of 1989, 2000, 2004, 2009 and 2012 were regarded as future forest area.

54
(a) HD Rhizophora sp.+Bruguiera sp.
(b) LD Rhizophora sp.+Bruguiera sp.

55
(c) Avicennia sp.
(d) Melaleuca sp.
(e) Secondary Forest

56
(f) Nypa sp.
Figure 4-1 Changes in areas by forest category and regression equation (target region)
4.1.2 Establishment of REL for the region planned for the project (66,500 ha) Based on the results of the analysis conducted in FS2013 of the temporal profiles of the land use/land cover of the Northern part of the region planned for the project (23,500 ha) and the results of the analysis conducted in FS2014 of the temporal profiles of the land use/land cover of the Southern part of the region planned for the project (43,000 ha), changes in areas of Rhizophora sp. + Bruguiera sp., Avicennia sp., Melaleuca sp., and Nypa sp. were aggregated setting the level in 2013 as benchmark. The results are shown in Table 4-2. Further, when cloud-free landcover maps will complete it using radar satellite images, these value changes because an area change is being totaled except for the territory classified into cloud and the cloud shadow as it was told in 3.2.3. Table 4-2 Changes in areas by forest category by setting 2013 as benchmark (region
planned for the project)

57
Figure 4-2 presents the results of plotting based on Table 4-2 with x-axis and y-axis showing observation years and areas by forest category, respectively. Future area of HD Rhizophora sp.+Bruguiera sp.,LD Rhizophora sp.+Bruguiera sp.,Melaleuca sp. and Secondary Forest was estimated by the same process as chapter 4.1.1.
(a) Rhizophora sp.+Bruguiera sp.
(b) LD Rhizophora sp.+Bruguiera sp.

58
(c) Avicennia sp.
(d) Melaleuca sp.
(e) Secondary Forest

59
(f) Nypa sp.
Figure 4-2 Changes in areas by forest category and regression equation (region planned for the project)
4.2 Future forecast (prevention of deforestation) 4.2.1 Future forecast in the target region (43,000 ha) (prevention of deforestation) Based on the regression models by forest category presented in Figure 4-1, future forest area in the target region (43,000 ha) was forecasted. The results are shown in Table 4-3 and Figure 4-3. The forest area in the target region is expected to diminish by degrees; the areas to be decreased will be 107 ha in 5 years, 461 ha in 10 years, 1,318 ha in 20 years, 1,967 ha in 30 years, 2,435 ha in 40 years, and 3,315 ha in 50 years. Table 4-4 and Figure 4-4 show the results of forecasting for future carbon stocks by multiplying the results of forecasting for forest area by carbon stock factor. The carbon stocks in the target region are expected to decrease constantly, which is likely to result in decrements in carbon stock of 18,109 t-C in 5 years, 61,424 t-C in 10 years, 161,684 t-C in 20 years, 236,460 t-C in 30 years, 290,209 t-C in 40 years, and 290,209 t-C in 50 years. In a project scenario assuming mangrove deforestation is reduced by REDD+ activities and held at the level as of the time when the activities commenced, the future forecasts for emission reductions associated with the prevention of
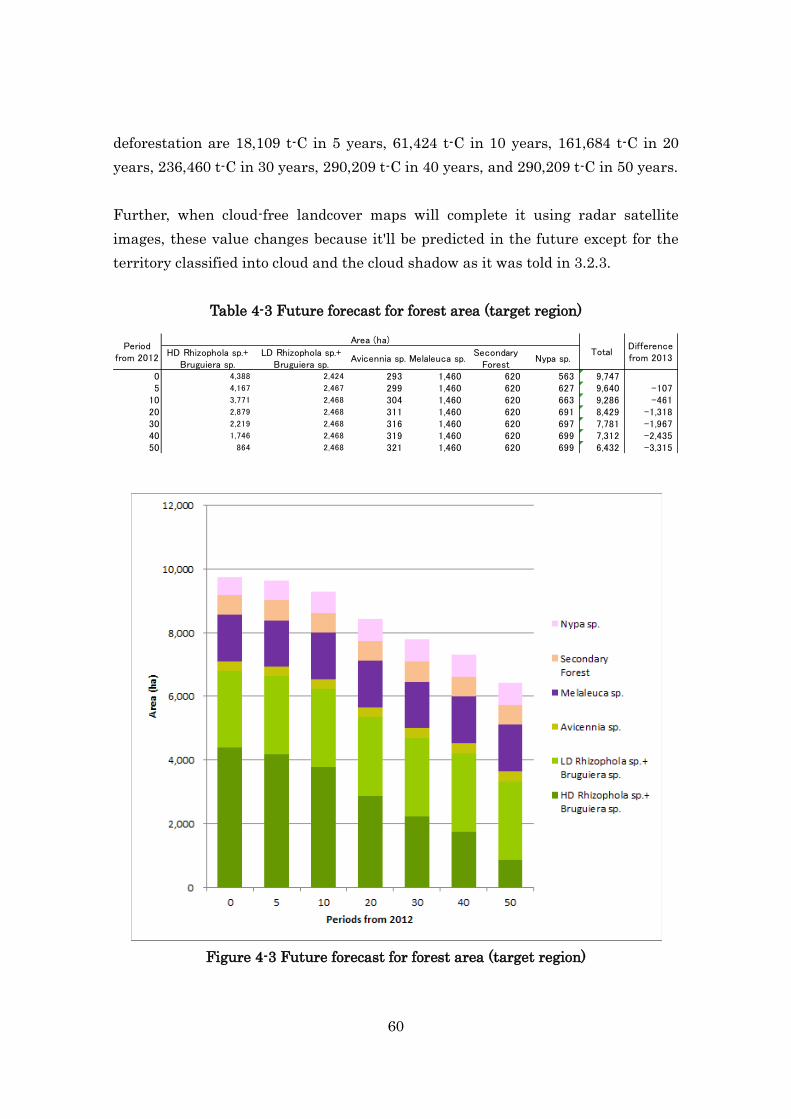
60
deforestation are 18,109 t-C in 5 years, 61,424 t-C in 10 years, 161,684 t-C in 20 years, 236,460 t-C in 30 years, 290,209 t-C in 40 years, and 290,209 t-C in 50 years. Further, when cloud-free landcover maps will complete it using radar satellite images, these value changes because it'll be predicted in the future except for the territory classified into cloud and the cloud shadow as it was told in 3.2.3.
Table 4-3 Future forecast for forest area (target region)
Figure 4-3 Future forecast for forest area (target region)
HD Rhizophola sp.+Bruguiera sp.
LD Rhizophola sp.+Bruguiera sp.
Avicennia sp. Melaleuca sp.Secondary
ForestNypa sp.
0 4,388 2,424 293 1,460 620 563 9,7475 4,167 2,467 299 1,460 620 627 9,640 -107
10 3,771 2,468 304 1,460 620 663 9,286 -46120 2,879 2,468 311 1,460 620 691 8,429 -1,31830 2,219 2,468 316 1,460 620 697 7,781 -1,96740 1,746 2,468 319 1,460 620 699 7,312 -2,43550 864 2,468 321 1,460 620 699 6,432 -3,315
Differencefrom 2013
Periodfrom 2012
Area (ha)Total

61
Table 4-4 Future forecast for carbon stocks (target region)
Figure 4-4 Future forecast for carbon stocks (target region) 4.2.2 Future forecast in the region planned for the project (66,500 ha) (prevention
of deforestation) Based on the regression models by forest category presented in Figure 4-2, future forest area in the region planned for the project (66,500 ha) was forecasted. The results are shown in Table 4-5 and Figure 4-5.
HD Rhizophola sp.+Bruguiera sp.
LD Rhizophola sp.+Bruguiera sp.
Avicennia sp. Melaleuca sp.Secondary
ForestNypa sp.
0 503,996 223,606 49,716 21,460 123,380 19,144 941,3025 478,615 227,605 50,795 21,460 123,380 21,339 923,192 -18,109
10 433,108 227,702 51,667 21,460 123,380 22,561 879,877 -61,42420 330,651 227,704 52,927 21,460 123,380 23,496 779,618 -161,68430 254,862 227,704 53,721 21,460 123,380 23,716 704,842 -236,46040 200,570 227,704 54,215 21,460 123,380 23,765 651,093 -290,20950 99,202 227,704 54,518 21,460 123,380 23,776 550,040 -391,262
Differencefrom 2013
Periodfrom 2012
Carbon Stock (t-C)Total
0
100,000
200,000
300,000
400,000
500,000
600,000
700,000
800,000
900,000
1,000,000
0 5 10 20 30 40 50
Carb
on S
tock
(t-C
)
Periods from 2012
Nypa sp.
SecondaryForest
Melaleuca sp.
Avicennia sp.
LD Rhizophola sp.+Bruguiera sp.
HD Rhizophola sp.+Bruguiera sp.

62
The forest area in the region planned for the project is expected to diminish; the areas to be decreased will be 27 ha in 5 years, 246 ha in 10 years, 897 ha in 20 years, 1,486 ha in 30 years, 1,937 ha in 40 years, and 2,566 ha in 50 years. Table 4-6 and Figure 4-6 show the results of forecasting for future carbon stocks by multiplying the results of forecasting for forest area by carbon stock factor. The carbon stocks in the region planned for the project are expected to decrease constantly and substantially, which is likely to result in decrements in carbon stock of approximately 5,000 t-C in 5 years, approximately 30,000 t-C in 10 years, approximately 100,000 t-C in 20 years, approximately 170,000 t-C in 30 years, approximately 220,000 t-C in 40 years, and approximately 300,000 t-C in 50 years. In a project scenario assuming mangrove deforestation is reduced by REDD+ activities and held at the level as of the time when the activities commenced, the future forecasts for emission reductions associated with the prevention of deforestation are approximately 5,000 t-C in 5 years, approximately 30,000 t-C in 10 years, approximately 100,000 t-C in 20 years, approximately 170,000 t-C in 30 years, approximately 220,000 t-C in 40 years, and approximately 300,000 t-C in 50 years. Further, when cloud-free landcover maps will complete it using radar satellite images, these value changes because it'll be predicted in the future except for the territory classified into cloud and the cloud shadow as it was told in 3.2.3.
Table 4-5 Future forecast for forest area (region planned for the project)
HD Rhizophola sp.+Bruguiera sp.
LD Rhizophola sp.+Bruguiera sp.
Avicennia sp. Melaleuca sp.Secondary
ForestNypa sp.
0 9,078 5,963 912 3,698 620 851 21,1225 9,022 5,964 917 3,698 620 873 21,095 -27
10 8,786 5,964 920 3,698 620 887 20,876 -24620 8,118 5,964 923 3,698 620 901 20,224 -89730 7,523 5,964 925 3,698 620 907 19,636 -1,48640 7,069 5,964 925 3,698 620 909 19,184 -1,93750 6,439 5,964 925 3,698 620 909 18,556 -2,566
Differencefrom 2013
Periodfrom 2012
Area (ha)Total

63
Figure 4-5 Future forecast for forest area (region planned for the project)
Table 4-6 Future forecast for carbon stocks (region planned for the project)
HD Rhizophola sp.+Bruguiera sp.
LD Rhizophola sp.+Bruguiera sp.
Avicennia sp. Melaleuca sp.Secondary
ForestNypa sp.
0 1,042,680 550,094 155,017 54,355 123,380 28,937 1,954,4635 1,036,330 550,183 155,885 54,355 123,380 29,695 1,949,827 -4,636
10 1,009,219 550,183 156,415 54,355 123,380 30,174 1,923,726 -30,73720 932,408 550,183 156,936 54,355 123,380 30,656 1,847,918 -106,54530 864,074 550,183 157,129 54,355 123,380 30,837 1,779,958 -174,50540 811,936 550,183 157,200 54,355 123,380 30,905 1,727,958 -226,50550 739,605 550,183 157,226 54,355 123,380 30,929 1,655,678 -298,785
Differencefrom 2013
Periodfrom 2012
Carbon Stock (t-C)Total

64
Figure 4-6 Future forecast for carbon stocks (region planned for the project)
4.3 Future forecast (Planting) In this Project, forest carbon enhancement through tree planting activities is planned. Indigenous tree species such as Dyera polyphylla and Alstonia angustiloba will be planted in grassland area, and mangrove tree species such as Rhizophora sp. in bare land area within project boundary.
To estimate carbon stock change by the growth of planted mangrove trees, following values were applied according to the result of 2013/2014 study.
- Annual increment of carbon stock 5.75t C/ha/year - Maximum carbon stock 115 t C/ha
And to estimate carbon stock change by the growth of planted indigenous trees, following values were applied according to the result of 2014/2015 study.
- Annual increment of carbon stock 9.95t C/ha/year
0
500,000
1,000,000
1,500,000
2,000,000
2,500,000
0 5 10 20 30 40 50
Carb
on S
tock
(t-C
)
Periods from 2012
Nypa sp.
SecondaryForest
Melaleuca sp.
Avicennia sp.
LD Rhizophola sp.+Bruguiera sp.
HD Rhizophola sp.+Bruguiera sp.

65
- Maximum carbon stock 199 t C/ha
4.3.1 Future forecast in the target region (43,000 ha) (Tree Plantation) The projection of carbon stock change within Target Region (43,000ha) is calculated based on following assumptions. [Grassland] - 100% of 8,477ha grassland area will be planted from 2020. - 840ha/year for 10 years. - 80% of planted area will survive. [Bare land] - 80% of 9,009ha bare land area will be planted from 2020. - 720ha/year for 10 years. - 90% of planted area will survive.
Table 4-1 Future forecast for carbon stocks (target region)
Dyera sp. +Alstonia sp.
Rhizophora sp. Total
0 0 0 05 0 0 0
10 21,283 11,250 32,53320 508,709 279,884 788,59330 1,162,015 641,596 1,803,61140 1,349,178 745,924 2,095,10250 1,349,178 745,924 2,095,102
(t C)
Period from2012

66
Figure 4-7 Future forecast for carbon stocks (target region) 4.3.2 Future Forecast in the Region Planned for the Project (66,500 ha) (Tree
Plantation) The projection of carbon stock change within the Region Planned for the Project (66,500 ha) is calculated based on following assumptions besides those above. [Grassland] - 100% of 4,204ha grassland area within 23,500 ha will be planted from 2015. - 420ha/year for 10 years. - 80% of planted area will survive. [Bare land] - 80% of 1,685 ha bare land area will be planted from 2020. - 168ha/year for 10 years. - 90% of planted area will survive.
Table 4-2 Future forecast for carbon stocks (region planned for the project)
Dyera sp. +Alstonia sp.
Rhizophora sp. Total
0 0 5 05 0 0 0
10 71,590 24,421 96,01120 860,222 371,560 1,231,78230 1,797,860 807,300 2,605,15940 2,018,455 920,322 2,938,77650 2,018,455 920,322 2,938,776
(t C)
Period from2012

67
Figure 4-8 Future forecast for carbon stocks (region planned for the project)
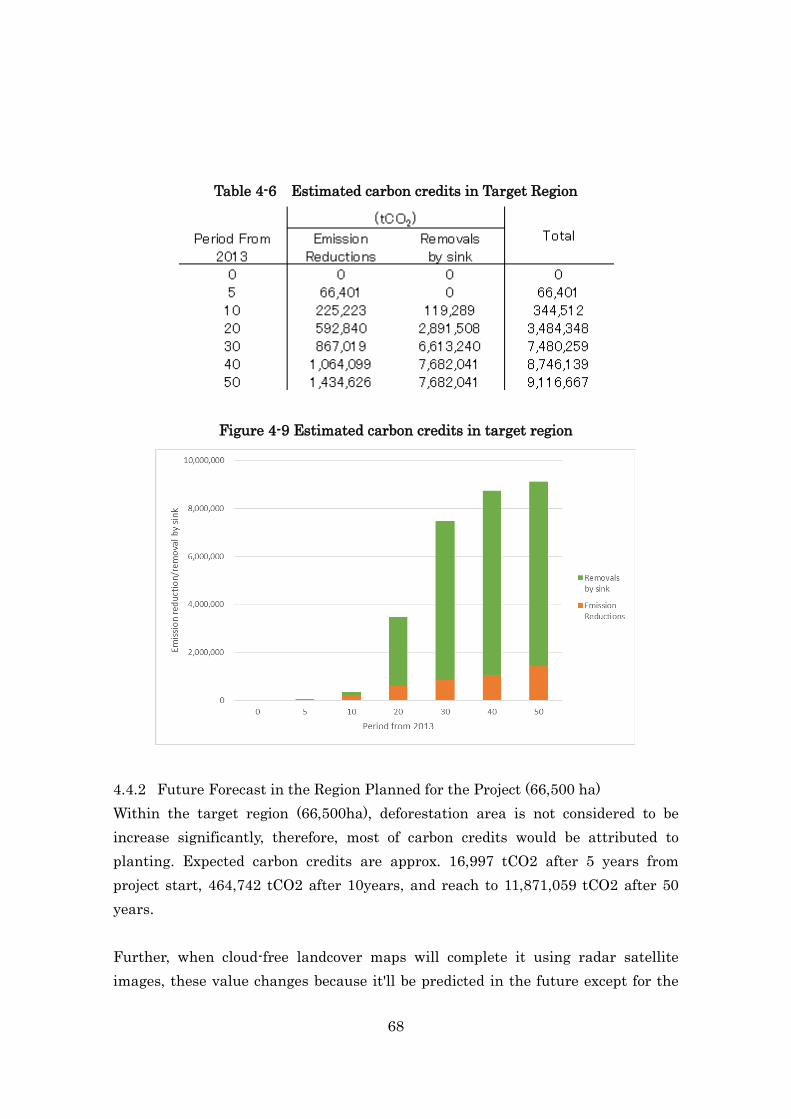
4.4 Estimation of expected carbon credits by the project implementation From the results of 4.1~4.3, expected carbon credits by this project could be calculated by following equation; Expected carbon credit = emission reductions by avoiding deforestation + removals by planted trees The values using ( t C) as unit should be converted into (t CO2) by multiplying 44/12. 4.4.1 Future forecast in the target region (43,000 ha) Within the target region (43,000ha), deforestation area is not considered to be increase significantly, therefore, most of carbon credits would be attributed to planting. Expected carbon credits are approx. 66,401 tCO2 after 5 years from project start, 344,512 tCO2 after 10years, and reach to 9,116,667 tCO2 after 50 years. Further, when cloud-free landcover maps will complete it using radar satellite images, these value changes because it'll be predicted in the future except for the territory classified into cloud and the cloud shadow as it was told in 3.2.3.
68
Table 4-6 Estimated carbon credits in Target Region
Figure 4-9 Estimated carbon credits in target region
4.4.2 Future Forecast in the Region Planned for the Project (66,500 ha) Within the target region (66,500ha), deforestation area is not considered to be increase significantly, therefore, most of carbon credits would be attributed to planting. Expected carbon credits are approx. 16,997 tCO2 after 5 years from project start, 464,742 tCO2 after 10years, and reach to 11,871,059 tCO2 after 50 years. Further, when cloud-free landcover maps will complete it using radar satellite images, these value changes because it'll be predicted in the future except for the

69
territory classified into cloud and the cloud shadow as it was told in 3.2.3.
Table4-7 Estimated carbon credits in project region
Figure 4-10 Estimated carbon credits in project region
5. Addressing REDD+ Safeguards 5.1 Consideration for REDD+ safeguards In the context of UNFCCC negotiation, all REDD+ countries are requested to address and respect REDD+ safeguards. The outline of safeguards was shown in the Cancun Agreement but more detailed indicators or further guidelines have not provided so far.
70
Therefore each REDD+ country have to prepare own national Safeguard PC Is (Principles, Criteria, Indicators) and develop SIS (Safeguard Information System) based on its national circumstances and capability. Indonesia had also tried to develop own national SIS and issued “Prinsip,Kriteria dan Indikator untuk Sistem Informasi Safeguards REDD+ (SIS-REDD+) di Indonesia” (Principles, Criteria and Indicators for a System for Providing Information on REDD+ Safeguards Implementation (SIS-REDD+) in Indonesia.) in 2013. How REDD+ safeguard should be addressed and respected in JCM project have not decided yet, but FFPRI (Forestry and Forest Products Research Institution, Japan) works for preparing draft guidance for REDD+ safeguard in JCM. We considered that even in JCM REDD+ project, Indonesian PCI should be respected and fulfilled. So we analyzed indicators shown in Indonesian PCI and referred FPIC guideline prepared Japanese NGO (Global Environmental Forum). 5.2 Preparation for safeguard activities In this year we start the preparation for safeguard activities toward full implementation of the project.
[Preparation for consensus-building between local communities] Before build consensus and make agreement between local communities, project participants have to try to let them know the purpose, activities, risks and benefits of the project, and also try to understand their rights, livelihood and uses of forest products. There for following two action had been conducted in this year. 1) Key informant meeting In the meeting project participants shared the project plan to the key persons and listened their thoughts.

71
According the village chief of Sungai Batang village, they were also worried about forest resources, especially illegal logging conducted by outsiders. He welcomed the REDD+ project and agreed to continue discussion toward making agreement. 2) Build the basecamp office within the project area and hire some staff The basecamp office had been built in Sungai Batang village. And 4 staff were hired from local communities. Their role is “pipeline” between local communities and project participants. After the local staff finish training, they will work for information sharing and collection in the village. [Forest Conservation] Field survey had been conducted to understand the drivers of deforestation and forest degradation within project area. Based on the result of filed survey, “reversal risks” and “emission displacement risk” were identified. “Reversal risk” includes development of shrimp pond, water condition change due to cannel building and illegal logging. The project will make management plan to address these risks and work with local communities. “Emission displacement risk” is usually the displacement of agricultural activities within project area. But in this project, main livelihood of communities is fishery and displacement is not likely occurred. [Conversion of natural forest] This project area is designated as protection forest (Hutan Lindung) and the project doesn’t contain any plan to cut trees in natural forest and convert another land use. [Biodiversity Conservation] According to Balai Konservasi Sumber Daya Alam Sumatera Selatan (Natural Resource Conservation Office, South Sumatra), 18 wild animals exist within project area. Project participants will consult to BKSDA to prepare and implement biodiversity management plan.

72
Table 5-6 Wild animals living in the project area Evaluation Wild animals 1 NT Kera Ekor Panjang ( Macaca Fascicularis ) 2 ― Musang ( Paradoxurus Hermaproditus ) 3 LC Rusa ( Cervus Unicolor ) 4 ― Kubung ( Cynocephallus Variegates ) 5 ― Bajing ( Lariscus Insignis ) 6 LC Babi Hutan ( Sus Scrofa ) 7 VU Binturung ( Arcitis Binturung ) 8 EN Kucing Bakau ( Felis Veiverina )
9 VU Beruang Madu ( Helarcos Malayanus )
10 VU Buaya Sinyulong ( Tomistoma Schelegelii )
11 ― Bangau Putih ( Egreta Alba )
12 ― Elang ( Spilornis Cheela )
13 ― Raja Udang ( Halcyon Smyrnesis )
14 ― Elang ( Spilornis Cheela )
15 ― Raja Udang ( Halcyon Smyrnensis )
16 LC Beo ( Sturnidae Gracula )
17 ― Labi-labi Besar ( Citra Induscus )
18 EN Gajah ( Elephas Maxsimus )
(EX (Extinction)– EW – CR – EN – VU (
Endangered Species)– NT – LC (Least Concern )
6. Drafting of a Project Design Document PDD form specific for REDD+ project under JCM scheme is not yet provided. Therefore REDD+ PDD form should be designed based on existing PDD form for emission reduction projects. We made add a blank in section “C” to fill the description of REL development and some blanks in section “D” to describe how the project plan to address and respect REDD+ safeguards. A. Project description

73
A.1. Title of the JCM project A.2. General description of project and applied technologies and/or measures A.3. Location of project, including coordinates A.4. Name of project participants A.5. Duration A.6. Contribution from developed countries
B. Application of an approved methodology(ies) B.1. Selection of methodology(ies) B.2. Explanation of how the project meets eligibility criteria of the approved methodology
C. Calculation of emission reductions C.1. All emission sources & sinks and their associated greenhouse gases relevant to the JCM project C.2. Figure of how to develop Reference Forest Emission Level to the JCM project C.3. Figure of all emission sources &sinks and monitoring points relevant to the JCM project C.4. Estimated emissions reductions in each year
D. Addressing and respecting safeguards D.1. Referred safeguard standard D.2. How to address/respect to safeguards D.3. Summary of comments received and their consideration
E. References 7. Operation of a pilot project 7.1 Official meeting of the project We held an official meeting with Climate Change Working Group of Forestry Ministry on 18th
March, 2014. This meeting was for us to explain our REDD+ project and a methodology we have developed and to confirm the validity of the project permission we obtained.
Table 7-1 Agenda of the meeting Date 18th March, 2014 Time 20:00 – 21:45(Indonesian Time /Western standard time) Venue The Phoenix Hotel – Yogyakarta

74
Sponsor The Head of Climate Change Working Group of Indonesia Forestry Ministry
Participants Indonesia side 1 Dr. Yetti Rusli(Head of Climate Change Working Group) 2 Dr. Bambang Supriyanto(Director of PJLKKHL) 3 Dr. Krisfianti L.Ginoga
(Kapuslitbang PI dan kebijakan Kementerian Kehutanan/ Member of JC Forestry Sector)
4 Dr. Machfudh(Private secretary of Climate Change Working Group)
5 Dr. Gun Gun Hidayat (National Coordinator of IJ-REDD+ Project)
Project proposer side(Japan) 6 Naoto Akune
(Development Manager of YL Building Co., Ltd./Director of PT. Tiara Asia Permai) Kaori Kawazoe(YL Building Co., Ltd.) Asep Badurutamam (PT. Tiara Asia Permai,Operational manager
7 Yuhei Tanahashi (Japan International Forestry Promotion and Cooperation Center)
8 Yasuteru Imai(Kokusai Kogyo Co., Ltd.) Consultation topic
Activities by YL Building and progress of the project
The Head of Climate Change Working Group of Forestry Ministry of Indonesia shared her opinion that she welcomes the implementation of the REDD+ project which is planned by YLB since the legal process YLB followed satisfied the standards determined by laws. She also told us that further cooperation with the Director of PJLKKHL will be expected. 7.2 Project activities on site 7.2.1 Establishment of an on-site office (base camp) Establishment of an on-site office (base camp) was completed in July, 2014. It is the main base of activities for the REDD+ project with stationed local staff. The office is always opened for local residents to communicate and to establish a cooperative

75
system. It functions as a significant place for us to collect their opinions and requests, answer their questions, and disseminate the information of the project.
Photo 7-1 On-site office (base camp)
Photo 7-2 On-site office (base camp)

76
7.2.2 Stationed staff 4 staffs are stationed in the office. 2 of them were singled out from all candidates in Sungai Batang and another 2 were from those in Sungai Sugihan. The selection criteria was set to select young and motivated human resources since local residents have many new things to learn for the project. After PT. Tiara Asia Permai has employed those staff as regular employees, they started training for the project in September, 2014 and REDD+ activities in October based on the on-site office. They play a role as mediator between local residents and us (project proposer side) for smooth communication. They will promote local residents’ understanding for the project by disseminating the information of what REDD+ is, the purpose of the project, and project activities to them on a regular basis as well as collecting public opinions and requests, informing the opinions and requests to the project proposer side, and answering the questions by local residents. Regarding on-site activities, they will supervise, manage, record, and report the works. They have received a month training which includes study of the basic knowledge at an institution of Forestry Ministry and participation in seminars of OKI forests and REDD+. 7.2.3 Safeguard meeting We held a meeting of safeguards with a representative group of Sungai Batang, where our on-site office locates, on 10th
November, 2014.
Table 7-2 Meeting of safeguards with Sungai Batang Date 10th November, 2014 Time 20:00-21:00 Venue A Mosque in Sungai Batang Sponsor PT. Tiara Asia Permai Participants Representative of local residents
1 Arahman(Head of Sugai Batang Village) 2 Ahmad Wijaya (Leader of Fisherman Cooperative Association) 3 Erick G 4 Resin 5 Kepos 6 Kertika 7 Hendri 8 Hidayat 9 Devi
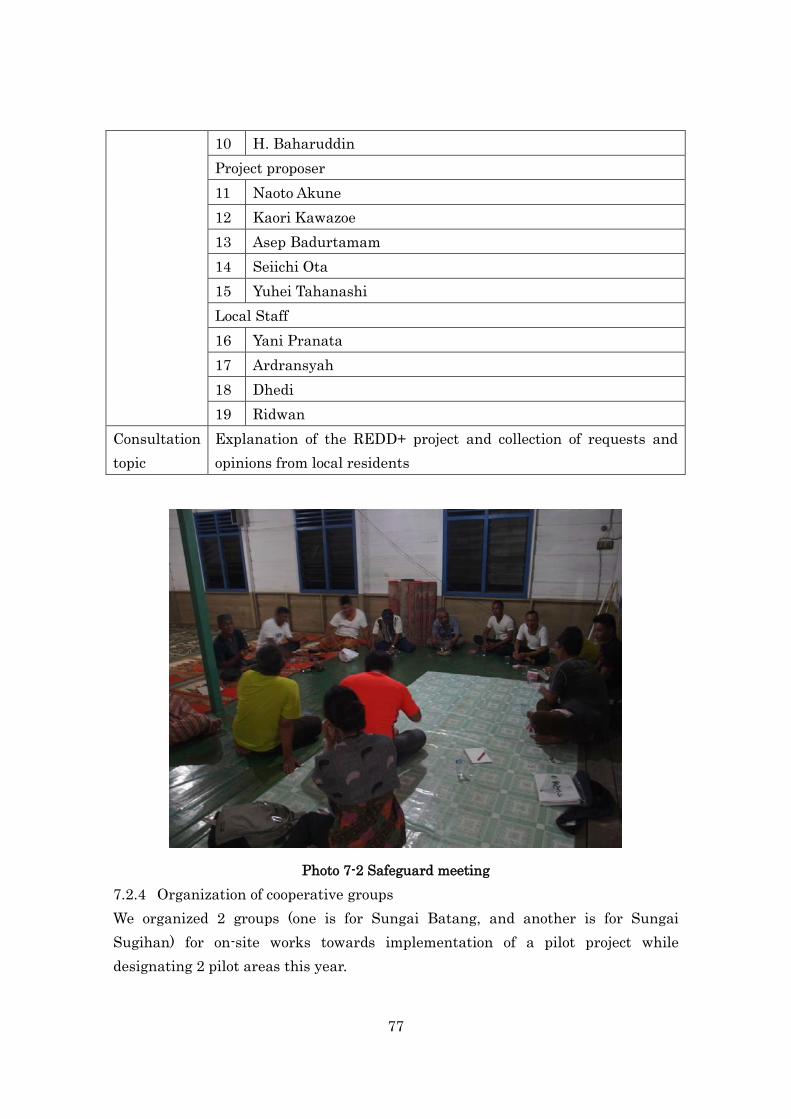
77
10 H. Baharuddin Project proposer 11 Naoto Akune 12 Kaori Kawazoe 13 Asep Badurtamam 14 Seiichi Ota 15 Yuhei Tahanashi Local Staff 16 Yani Pranata 17 Ardransyah 18 Dhedi 19 Ridwan
Consultation topic
Explanation of the REDD+ project and collection of requests and opinions from local residents
Photo 7-2 Safeguard meeting 7.2.4 Organization of cooperative groups We organized 2 groups (one is for Sungai Batang, and another is for Sungai Sugihan) for on-site works towards implementation of a pilot project while designating 2 pilot areas this year.

78
1. Working group of Sungai Batang organized based on a Cooperative Association The working group was organized based on the cooperative association of the village. Ahmad Wijaya, the leader of the cooperative association of Sungai Batang who participated in the safeguard meeting we held, represents the working group and made an agreement with TAP on the works for the pilot project. Ardransyah and Yani, staffs who are stationed in TAP office and are from Sungai Batang, will join the working group of Sungai Batang to guide them to the working site and provide technical support.
2. Working group of Sungai Sugihan
The working group of Sungai Sugihan consists of working members who were selected from villagers in Sungai Sugihan and will be supervised by CV. Dua Purti, the company H. Baharuddin represents. The working group made an agreement with CV. Dua Purti on TAP and the works for the pilot project. We requested CV. Dua Purti for the supervision since CV. Dua Purti, Sungai Sugihan, and YL Group have already established a smooth cooperative relationship through other mangrove planting project by YL group in tidal flats in front of the project site of this REDD+ project where CV. Dua Purti palys a role as meditator between Sungai Sugihan and YL group since 2007. Dhedi and Ridwan, who are stationed in the TAP office and are from Sungai Sugihan, will join the working group of Sungai Sugihan to guide them to the working site. Sungai Sugihan residents with CV. Dua Purti as a supervisor already acquired the technique of mangrove planting through their experiences since 2007.
7.2.5 Pilot project of work activities We started a pilot project designating 2 pilot project areas this year. The activities which require long-period observation such as trench excavation for improvement of water cycle and mangrove planting in abandoned aquaculture ponds and bare land have been being carried out in the pilot project since about 1 year will be needed for the observation of both activities. (Early start is preferred.) We designated the pilot project area within the area with a REDD+ project permission according to satellite image analysis and field surveys. The designated 2 areas are easily accessed from the villages which participate in the REDD+ project and observed with satellite. One is the abandoned aquaculture pond which locates in the north of a halfway of the Kumpai River, and another is the bare land which

79
locates a halfway of the artificial channel which was constructed in the west side of Cape Tapah.
Figure7-1 Location of the pilot project area
Works for the pilot project have been being carried out in the areas on the map above by 2 working groups which were described in 7.2.4 Organization of cooperative groups”. 1. The area of Kumpai River
Location An abondoned aquacutlrue pond
halfway of Kumpai River Area Approximately 8ha In charge of the works Working Group of Sungai Sugihan It is an approximately 8ha pond. While mangroves grow around the pond, those in the pond were logged. Due to the construction of channels which are assumed for aquaculture, land of the inner frame part of the pond is lower than other parts. The pond was filled with water for a full tide when we took the following photos.
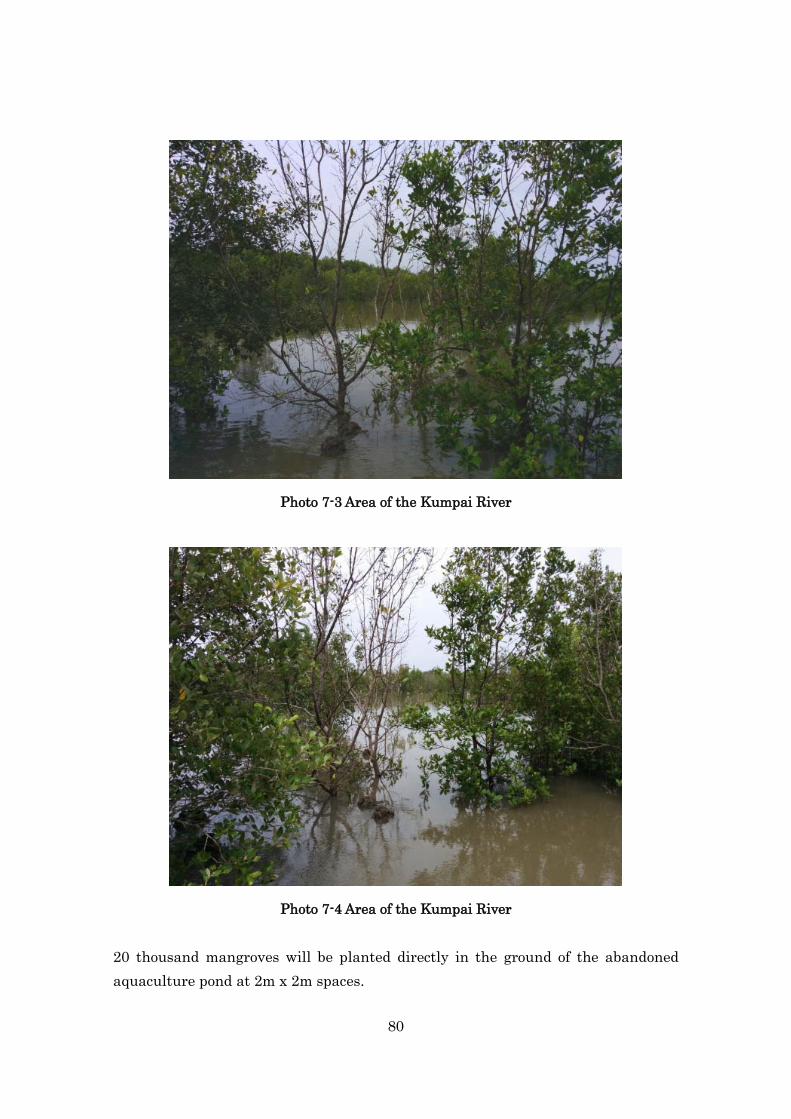
80
Photo 7-3 Area of the Kumpai River
Photo 7-4 Area of the Kumpai River 20 thousand mangroves will be planted directly in the ground of the abandoned aquaculture pond at 2m x 2m spaces.

81
2. The area of an artificial channel in Cape Tapah
Location The bare land in halfway of an artificial channel by a forestry production enterprise in the west of Cape Tapah
Area Approximately 8ha In charge of the works Working group based on the
cooperative association of Sungai Batang
Since the excavated soil was heaped up in a pile along both side of the channel when the channel was constructed, the water flow from/to surrounding area has been blocked to cause a big pool. The trees withered, and vegetation is degraded in the area.
Photo 7-5 Area of an artificial channel in Cape Tapah
The works include trench excavation with 1m width and 50cm depth on the part with heaped up soil along the channel from the area with water stagnation to the artificial channel. This will improve water cycle with water flow from/in the artificial channel. Moreover, we have planted 20 thousand mangroves directly in the ground at approximately 2m x 2m space since the securing equal space
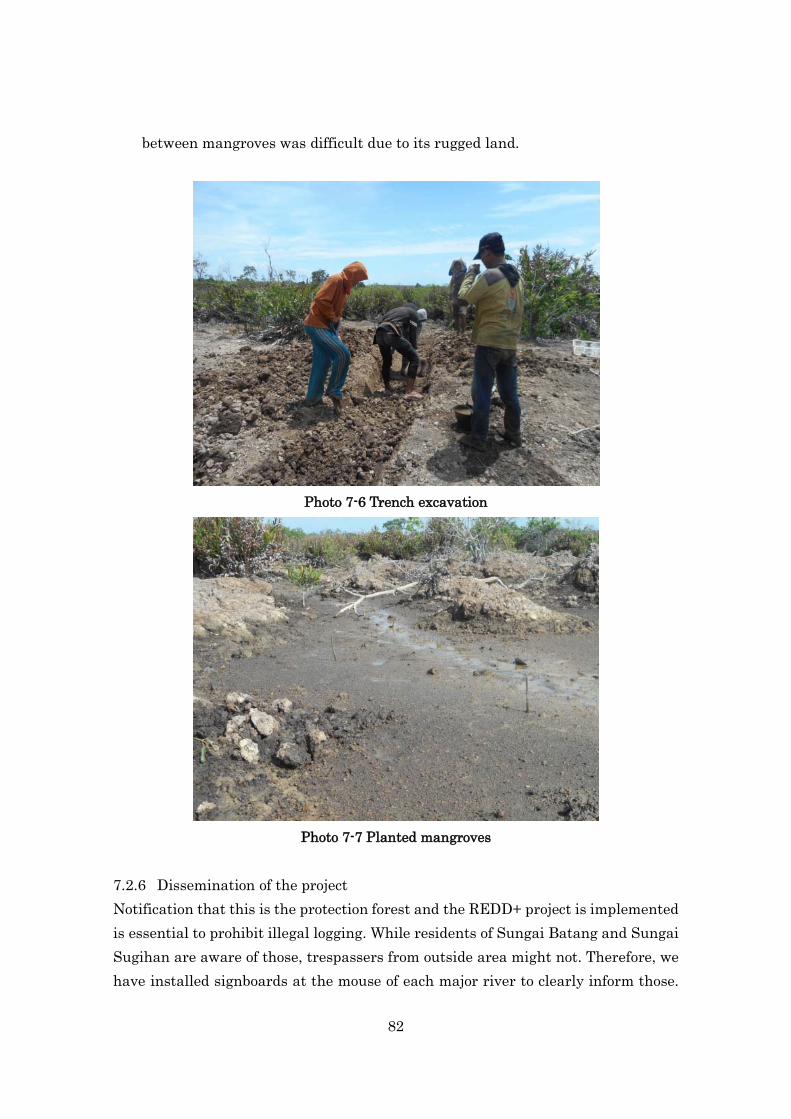
82
between mangroves was difficult due to its rugged land.
Photo 7-6 Trench excavation
Photo 7-7 Planted mangroves
7.2.6 Dissemination of the project Notification that this is the protection forest and the REDD+ project is implemented is essential to prohibit illegal logging. While residents of Sungai Batang and Sungai Sugihan are aware of those, trespassers from outside area might not. Therefore, we have installed signboards at the mouse of each major river to clearly inform those.

83
We are still working on the installation, but we will have installed the signboards at 60 points in the project this year based on the requests from the representative group of Sungai Batang in a meeting which was held in Sungai Batang.
Photo 3-8 Signboard
The signboard is 100cm x 75cm with simple and brief words considering that the education index is low in the area notifying prohibition of entry into the protection forest area without a permission, logging in the protection forest area, and acts to impede forest protection. It also says that the violators will be sentenced to 10 year imprisonment at the longest or a fine of 5,000 million Indonesia rupiah at the maximum in accordance with Article 41, paragraph 50 and 78 of Constitution of Indonesia 1999 and that the project has been implemented in 23,500ha with an IUPJL-HL which PT. Tiara Asia Permai obtained in 2013. The uniform for local residents to wear when they carry out the on-site activities is also planned. We are working on the design and will distribute them to the local residents soon. Unifying uniform will support dissemination of the REDD+ activities to people who happen to see the local residents carrying out the works on site. Also, we will prepare the fluorescent color uniform which is striking even in the dark forest for patrol teams concerning safety.
DILARANG !!!
- Memasuki Kawasan Hutan Lindung Secara Tidak Sah.- Menebang Pohon di Kawasan Hutan Lindung.- Merusak Sarana dan Prasarana Perlindungan Hutan.
Diancam Pidana Penjara 10 ( sepuluh ) Tahun dan Denda Paling Banyak Rp 5.000.000.000.00 ( lima miliar rupiah )
Pasal 50 dan 78, Undang-undang Republik Indonesia Nomor : 41 Tahun 1999 Tentang Kehutanan
PT. TIARA ASIA PERMAIKeputusan IUPJL-HL Penyerapan dan Penyimpanan Karbon
Nomor:579/KEP/D.KEHUT/2013 Tanggal:25 Juli 2013Luas:± 23.500Hektar
84
8. Finance examination JCM plans to implement issuance of non-tradable credits for the time being. Therefore, examination of finance for the implementation of the project is necessary. The following sections describe the potential funding for the project. 8.1 Funding by Japanese companies We carried out interviews about possibility of funding or collaboration as CSR or for other purpose with 10 Japanese trading companies and manufactures on our own terms. Their answers were similar to each other. The amount is too big for CSR. Since JCM credit is not tradable for the time being, we cannot sell the credits
even when they are generated. While CDM credits from forests needed to be filled, it is unclear whether
those for JCM needs to be filled as well or not.
We also carried out the survey of the possibility of funding through an investment and consultant company. According to them, collaboration for the project implementation or a large scale investment cannot be expected since JCM credits have not been generated, Japanese government is not obligated to reduce GHG emission, Japanese companies are not obligated to reduce GHG emission as well, and JCM credits are not tradable so far.
8.2 Further examination 8.2.1 Possibility of collaboration with companies which don’t aim at credits We have recognized the necessity of partners for collaboration or investment who don’t seek for credit generation until JCM is finalized. For instance, food manufactures are potential partners if they are willing to supply raw materials or products from our project site. Our REDD+ activities such as planting and forest conservation in the project area will bring us fisheries products and the sap of Jelutong as byproducts. (Fisheries products such as shrimps, crabs and fishes with less environment load for the introduction of Silvofishery into aquaculture ponds and the
sap of Jelutong which can be used for chewing gums and latex) We will continue the survey and examination about possibility of participation or cooperation in the

85
project by food manufactures by proposing them to secure the stable suppliers for those raw materials and products. 8.2.2 Application of funding mechanisms While the United Nations and the World Bank have some funding mechanisms to support REDD+ financially at national or subnational level, there is no mechanism at project level. These days the development of an evaluation method which can be applied for REDD+ project activities which are implemented by private companies at local level based on the method at national level which is approved by United Nations Framework Convention on Climate Change (UNFCCC) has been examined. Moreover, Japan International Cooperation Agency has established a platform which is called “Japan Public-Private Platform for REDD+ (Changing the world from forest)” in Japan. Business Bureau has been established for the platform and examined development of a business model with combination use of official financial assistance (support by government) and private fund. Since funding frameworks at project level has been being developed, we will pay careful attention to the trend of those funding mechanisms and examine those application for our REDD+ project. 9. Future development 9.1 Expansion of the project area While we obtained a project permission only for 23,500ha which locates in the northern area of the protection forest, 66,500ha is planned for the future project area. According to the consultation with Dinas Kehutanan Kabupaten OKI, the type of permission for 42,000ha (the rest of the project area) might differ since it is under a quite different natural condition from the northern area depending on the level of development of aquaculture ponds and most of the 42,000ha is owned by local residents; Although the protection forest is a state forest, certifications of the right of use and property have been issued by the head of villages and wards. We will research the background of the property rights (if the certifications were issued before/after designation of the protection forest). In either case, since application of the IUPJL-HL, which is the same for the northern area, is difficult in the southern area where the land is owned by local residents, we have examined to obtain a

86
permission for Hutan Kemasyarakatan. The application for the permission will be proceeded in accordance with Ministry of Forestry Regulation No. 88, 2014, which was enacted in September, 2014. 9.2 Future project plan While implementing a pilot project in the 23,500ha with a project permission until 2016, we will carry out activities in the 42,000ha aiming at obtaining a project permission for the area.
Figure 9-1 Project schedule 1. Registration of a methodology and application for a JCM project
Since we aim at generation of credits under a JCM framework through the project, we will proceed registration of the methodology we developed and application for a JCM project.
2. Activities in the pilot area Organization of working groups corresponding to each activity Technique transfer to each group, development of human resources, and
preparation of a manual Planting on site and improvement of water cycle Observation of planted trees and water cycle Estimation of activity cost Establishment of rules in villages which include safeguards
3. Safeguards for biodiversity

87
There are wild animals which include endangered species living in the project area. We will carry out surveys on those animals concerning safeguards to work out necessary measures requesting local NGO and experts for their cooperation.
4. Preparation of application for a project permission for 42,000ha
We will proceed the application for a project permission in this area which includes construction of Hutan Kemasyarakatan.
5. Surveys on the environmental change due to geographical changes
Surveys on water flow, water quality, soil quality, and vegetation in the area which can be assumed to be wet due to construction of channels or soil loss
Examination of measures against those issues
9.3 Challenges As we mentioned earlier, credits will be generated as non-tradable credits under JCM for the time being. Therefore, it can be said that securing funding is a big challenge for both our project and other REDD+ projects. We will carry out continuous surveys on funding methods. Since it is expected that formulation of new policies and development of laws will be proceeded in Indonesia due to a big organizational and personnel reform following change of the president, we will pay careful attention to the trend so that we can easily adapt to those changes.
10. Conclusion The satellite image analysis for approximately 30% area in the 66,500ha of the project area has not been carried out since clouds and its shadows due to regular clouds specific to tropical regions has made the analysis of optical satellite images of the area. Thus, we are examining complement of the optical satellite image analysis by applying a radarsat. This will lead us to modification of a REL and a project scenario and acquisition of more credits by supporting expansion of the area for analysis. While credits can be issued under JCM, they are not tradable for the time being;

88
securing the fund for the project by selling JCM credits is not available. Therefore, we have examined the joint implementation of the project with other companies and application of CSR funds to avoid dependence on credits. We expect further contribution to REDD+ and significant development by Japan through the agreement on JCM with Indonesia.

Appendix JCM_ID_F_PDD_ver01.0
1
JCM Project Design Document Form
A. Project description A.1. Title of the JCM project
REDD+ project within degraded mangrove forest protection area in South Sumatera, Indonesia
A.2. General description of project and applied technologies and/or measures
[Project Area] This “REDD+ project within degraded mangrove
forest protection area in South Sumatera, Indonesia” (hereinafter called “the project”) is planned to be implemented within 23,500ha of protection forest (Hutan Lindung) located in Organ Komering Ilir, South Sumatera, Indonesia. The main ecosystems in this area are mangrove forests (dominated by Rhizophora sp. and Bruguiera sp.) and swamp forests (dominated by Melaleuca sp. and other tree species).
[Forest degradation and deforestation in the project area] This area has been seriously affected by forest degradation and deforestation for 25 years, according to the satellite image analysis. Mangrove forest area declined about 530ha (9787ha to 9248ha) but in other hands secondary forest area and bare land area increased about 3300ha (223ha to 3503ha) and 1400ha (450ha to 1685ha) respectively. The following drivers of forest degradation and deforestation were identified by field survey, satellite image analysis and hearing survey. 1) Forest fire and illegal logging Forest fire sometimes spreads
from neighboring timber concession. And illegal timber collectors from outside lights a

Appendix JCM_ID_F_PDD_ver01.0
2
fire to make their extraction work easier. 2) Shrimp pond development Mangrove forests in this area had been destroyed by development of shrimp ponds but many of them were already abandoned. 3) Hydrological change due to channel building and natural condition In the project area there are grid pattern channels built by timber concession company and those cause hydrological changes in this area. Isolation from tidal flow is considered as the reason of degradation of mangrove forest in some location.
[Project Activities] In the project, local communities have a key role to control forest degradation and deforestation, and also reforestation. Organizing farmers group, conducting forest patrol and plantation activity are planned to implement. And other project participants will provide technical support to encourage those activities. One of the features of the project is reforestation activity within degraded forest area. It means this project is not “REDD” project but “REDD+” project. After hydrological condition changed, natural regeneration would be difficult, therefore intended reforestation activity is needed in those deforested area.
[Monitoring of carbon stock] Monitoring of carbon stock will be conducted by combination of satellite image analysis and field measurement. RapidEye images would be used to classify land cover, ALOS/PRISM data would be used to estimate carbon stock factor. Field measurement would be conducted to check the actual vegetation and gain data to estimate carbon stock factor. Further information regarding monitoring of carbon stock is described in section C.2. and C.3.
A.3. Location of project, including coordinates
Country Republic of Indonesia
Region/State/Province etc.: Organ Komering Ilir district, South Sumatra province
City/Town/Community etc: Sungai Batang village, Sungai Sugihan village
Latitude, longitude Latitude: 105°50’ E- 105°78’E Longtitude: 2°39’S - 2°74’S

Appendix JCM_ID_F_PDD_ver01.0
3
A.4. Name of project participants
The Republic of Indonesia
PT. Tiara Asia Permai, PT. Yamamoto Asri, Dinas Kehutanan Kab. OKI, Sungai Batang community, Sungai Sugihan community
Japan YL Invest Co., Ltd., Kokusai Kogyo Co., Ltd., Japan International Forestry Promotion and Cooperation Center (JIFPRO)
A.5. Duration
Starting date of project operation 201[3]
Expected operational lifetime of project [10][20][30] years
A.6. Contribution from developed countries
Feasibility study to develop methodology for this project has been supported by Ministry of Economy, Trade and Industry, Japan. And the project would contribute to Indonesia in following aspects; - Propose some methods to control forest degradation and deforestation within mangrove
forest area - Implement reforestation activity within degraded mangrove forests and swamp forests - Support livelihood of local communities
B. Application of an approved methodology(ies) B.1. Selection of methodology(ies)
Selected approved methodology No. Methodology for REDD+ activities including forest management and/or plantation within degraded mangrove habitats
Version number (Ver.1)
B.2. Explanation of how the project meets eligibility criteria of the approved methodology
Eligibility criteria
Descriptions specified in the methodology
Project information
Criterion 1 Proposed project area is degraded mangrove ecosystem.
The project area is mangrove forest dominated by Rhizophora sp. and Bruguiera sp. but this area is degrading by several drivers such as shrimp pond development and channel building.
Criterion 2 Reference scenario includes In the reference scenario, planned land use change such as shrimp pond

Appendix JCM_ID_F_PDD_ver01.0
4
planned or unplanned land use change, logging and forest fire.
development and channel building and unplanned land use change such as forest fire and illegal logging, water condition change are identified as the drivers of deforestation and forest degradation.
Criterion 3 When the project includes planting activity, planting tree species (mangrove, non-mangrove) should be selected by considering soil/water/topographical condition within the area. Any change of hydrological condition aiming to plant exotic fast grow tree species is not permitted.
The project includes plan of plantation activity but mangrove tree species will be planted in degraded mangrove area and other tree species will be planted in freshwater area.
Criterion 4 Soil disturbance due to site preparation is not occurred more than 10% of project area.
Small water intakes are planned to connect isolated area from tidal flow due to channel building but total area affected by water intake building is far smaller than 10% of the project area.
C. Calculation of emission reductions C.1. All emission sources & sinks and their associated greenhouse gases relevant to the JCM project
Reference emissions
Emission sources & sinks GHG type
Natural forest(Above ground biomass, below ground biomass) CO2
Planted forest(Above ground biomass, below ground biomass) CO2
Project emissions
Emission sources & sinks GHG type
Natural forest(Above ground biomass, below ground biomass) CO2
Planted forest(Above ground biomass, below ground biomass) CO2
Biomass burning by forest fire etc.(Above ground biomass) N2O, CH4

Appendix JCM_ID_F_PDD_ver01.0
5
C.2. Figure of how to develop Reference Forest Emission Level to the JCM project
In the project, Forest Carbon Stock in present was estimated by multiplying “Area of each land cover” by “carbon stock factor of each land cover” and sum up them. “Area of each land cover” was calculated by analysis of RapidEye (or other similar) satellite image with ground truth information. “Carbon stock factor of each land cover” was calculated by converting spatial volume to carbon stock. Spatial volume was calculated by ALOS/PRISM (or other similar) data corrected with airplane Lidar data. And correlation equation between spatial volume and carbon stock was developed by using Lidar data and sample plot measurement. The project used “historical trend” method to develop the reference forest emission level, so historical data of carbon stock was needed. But RapidEye images in the past couldn’t be got because the satellite was launched in 2008. So Landsat images were used for land cover classification in the past.
Fig. Historical change of land cover classification
Land CoverClassification
Carbon StockFactor
Forest Carbon Stock
RapidEye(+Landsat)
& Ground Truth
Lidar & ALOS/PRISM
& Sample Plot
0
10
20
30
40
50
60
70
80
90
100
1989 2000 2004 2009 2012
Perc
enta
ge
Year
Water
Bareland
Grassland
Nypa sp.
Secondary Forest
Avicennia sp.
LD Rhizophola sp.+ Bruguiera sp.
HD Rhizophola sp.+ Bruguiera sp.

Appendix JCM_ID_F_PDD_ver01.0
6
C.3. Figure of all emission sources &sinks and monitoring points relevant to the JCM project
In the project area, three monitoring methods are used for each emission source & sink. 1) Monitoring of natural forest area Monitoring method for carbon stock in natural forest area is same as the method described in section C.2. <Land Cover Classification & Land Cover Change> RapidEye (or other similar) satellite image analysis (each monitoring timing) <Carbon stock factor> ALOS/PRISM (or other similar) data analysis (each REL review timing) 2) Monitoring of planted forest area Planted forest area would be monitored separately because the carbon stock factors should be different from those of natural forests. <Land Cover Classification & Land Cover Change> Field survey and RapidEye(or other similar) satellite image analysis (each monitoring timing) <Carbon stock factor> Sample plot survey and use of allometric equation from published literatures. (each monitoring timing) 3) Monitoring of biomass burning Monitoring method of biomass burning is consistent with the method shown in IPCC GPG LULUCF. <Area affected by biomass burning> Field survey and RapidEye satellite image analysis (each monitoring timing) <Carbon stock factor> Those used in 1) and 2) (each monitoring timing) <Conversion factors to N2O and CH4> IPCC default value C.4. Estimated emissions reductions in each year
Year Estimated Emission Reductions (tCO2e)
Estimated Removals by sink(tCO2e)
Total (tCO2e)
2013 0 0 0
2014 147 0 147
2015 367 0 367
2016 653 0 653
2017 1,008 0 1,008
Project Area
1) Natural Forest Area
3)
B
2)
Pl

Appendix JCM_ID_F_PDD_ver01.0
7
2018 1,423 15,658 17,081
2019 1,899 46,762 48,661
2020 2,427 93,312 95,739
Total (tCO2e
7,927 )
155,732 163,659
D. Addressing and respecting safeguards
D.1. Referred safeguard standard
Principles, Criteria and Indicators for a System for Providing Information on REDD+ Safeguards Implementation (SIS-REDD+) in Indonesia.
D.2. How to address/respect to safeguards
[Principle 1. Legal compliance and consistency with national forest programs] The project participants had already obtained project license (IUPJL-HL) under close cooperation among Ministry of Environment and Forestry and Forestry Department of OKI district, so this principle is already fulfilled. [Principle 2. Transparency and effectiveness of national forest governance] The project participants would arrange stakeholders including government, communities and relevant actors in transparent and effective manner. [Principle 3. Rights of Indigenous and Local Communities] The project participants would conduct hearing survey to identify the rights of local communities and try to obtain consent from the communities before REDD+ activity starts. Some meetings between communities had been already held and discussed about the project purpose and role of communities. Agreement between project participants and communities is in preparation. [Principle 4. Effectiveness of Stakeholder Participation] The project participants would arrange effective stakeholder participation process and procedure to solve problems. Project office was already prepared and field staffs were employed. This office would become one of the contact point between the project and communities. [Principle 5. Conservation of Biodiversity, Social and Environmental Services] The project participants would conduct identification and assessment of potential impacts of activities on social and environmental services. No activity in the project was considered as a negative impact for social and environmental services in project design. The project participants have already acquired the list of 18 wild animals existing within project area from BKSDA (Balai Konservasi Sumber Daya Alam, Natural Resources Conservation

Appendix JCM_ID_F_PDD_ver01.0
8
Office) South Sumatra. Therefore in the next step project participants would conduct impact assessment on biodiversity, design of monitoring operation, and development of biodiversity management plan, consulting with BKSDA. The project area is designated as a protection forest (Hutan Lindung) therefore and the project doesn’t include any tree cutting activity and conversion from natural forest [Principle 6. Reducing Risk of reversals] Main potential risk of reversal in the project area is forest fire. The project includes forest patrol to reduce the risk of forest fire. By watching out illegal logger in dry season, the risk would be declined. The burnt area would be monitored in each monitoring time. [Principle 7. Reduction of Emission Displacement] No emission displacement from project area is expected.
D.3. Summary of comments received and their consideration
Stakeholders Comments received Consideration of comments received
Sungai Batang village
The project was welcomed and community was willing to join the forest patrol to conserve the forest. They requested to make the project boundary clear and reduce the project negative impact for villagers’ forest use. They also requested to contribute to livelihood improvement.
The project participants would arrange organization for forest patrol and communicate with other stakeholders. Buffer zone around the village was already established and the project participants would try to reduce negative impacts through discussion with communities. Some contribution for village life would be provided.
F. References N/A
Reference lists to support descriptions in the PDD, if any. Annex N/A
Appendix JCM_ID_F_PDD_ver01.0
9
Revision history of PDD
Version Date Contents revised
1 2015/3/31 First submission