manhattan market compass - q3 2014 report
DESCRIPTION
Manhattan Market Compass - Q3 2014 ReportTRANSCRIPT

Q3 2014
Manhattan Market Compass
LIVING. POWERED BY URBAN COMPASS.

Q3 2014
At Urban Compass, we understand the real value of data is the intelligence gleaned from it. We’ve created our inaugural Manhattan
Market Compass report to do just that: arm our agents, clients and the industry with the insights they need to make smarter decisions.
This report examines Manhattan’s residential real estate market across six metrics - Price (pp. 3-4), Price per Square Foot (p. 5),
Closings (pp. 6-7), Inventory (pp. 8-9), Contracts (pp. 10-11) and Days on Market (pp. 12-13) - using recorded sales data and sales
listing data from hundreds of brokerages. Our analysis is framed by these metrics, as we believe such a lens allows our readers to
derive the best and most useful information about the market.
We’ve also shared with you a sneak peek into what Urban Compass Research has been busy working on - Neighborhood Affinity (p.
14), Days on Market Distribution (p. 15), and Contracts by Submarket Share (p. 16). These analyses enable us to provide our agents,
clients and the industry with the creative insight needed to stay ahead of the curve.
This quarter, the Manhattan market demonstrated considerable strength, showing signs we are now entering a more stable and less
frenzied, frothy market.
Prices are rising steadily, with a 3% increase over the past year. Condo performance was particularly strong this quarter, with
an 11% increase year-over-year. Overall, price has steadily returned to pre-recession levels. PPSF has increased accordingly over
the past year (10%), with submarkets like Upper Manhattan doing particularly well.
While the volume of transactions dipped from last year, the market saw a total value of $6 billion in condo and co-op sales this quarter. This marks the highest value closed since the $7.5B peak in the second quarter of 2008.
Inventory has gone up slightly since last year, with more properties above $1M appearing on the market. There are 15% more
active condos than last year, whereas co-op inventory decreased by 3%.
There were 7% fewer contracts signed than last year, though the Upper West Side and Upper Manhattan submarkets
experienced an increase in signed contracts. Condo contracts remain level, whereas co-op contracts declined by 12%.
Days on market remains unchanged since last year, with a median time on market of 50 days. Condos are spending 9% more
time on the market than last year, though condos are still spending a shorter time on market than co-ops (49 days in comparison
to 51 days). Co-ops are spending 6% fewer days on market than last year.
We expect a strong end to 2014 given the activity of the past quarter. As we approach the last quarter of 2014, what remains to be
seen are the following: how saturated is the market with new development luxury product? Is demand for such product sustainable?
Are co-ops a better buy given the two record co-op closings this quarter? Considering condos make up only 5% of the entire housing
stock in Manhattan and are becoming increasingly expensive and exclusive, perhaps co-ops presenting a better value.
We’re Urban Compass: We do real estate differently. Please contact our agents if you have any questions related to this report, or if
we may be of further assistance. A digital copy of this report may be viewed at www.urbancompass.com/research.
Best,
Robert & Sofia
Sofia Song Head of Research & External Affairs
Robert Reffkin Founder & CEO

Q3 2014
3
MANHATTAN PRICES RISE STEADILY. Overall median closing price in Manhattan rose 3% over the past year, and 2% from the preceding quarter. The Downtown market had the largest gains, with a 21% increase since last year, while prices in the Midtown East market dropped by 7%.
CONDO PERFORMANCE STRONG. Manhattan condos, both resale and new development closings, increased by 11% since last year. The Midtown East and Upper East Side markets were the only markets to not experience gains in condo resale price. Midtown West and Upper West Side experienced the largest gains, each with a 24% increase since last year.
CO-OPS REMAIN STABLE. Co-op median prices remained stable across the majority of markets with the exception of Upper Manhattan where median resale price fell by 18%. Midtown East co-ops had the most significant price gains--5% since last year.
MEDIAN PRICE v. MEDIAN PPSF
Source: Urban Compass Research
Median price and median PPSF based upon recorded Manhattan condo closings from Q1 2008 to Q3 2014.
Manhattan median sales price hit its lowest point in 2009, when it bottomed out at $710,000. Prices have steadily returned to pre-recession levels with an average year-over-year increase of 1.3%. This quarter’s median price is $910,000, an increase of 28% from Q2 2009. Alternatively, PPSF achieved a higher growth trajectory with an average year-over-year increase of 1.5% during same time period, and 0.9% from the same time one year ago. Currently, PPSF for Q3 2014 is $1,395--13% higher than the height of the market in 2008, and over 38% higher compared to PPSF from the market’s low point in 2009.
SUMMARY Q3 2014 Q3 2013 Y/Y CHG (%) Q2 2014 Q/Q CHG (%)
MANHATTAN $910,000 $880,000 3% $895,000 2%
MIDTOWN EAST $740,000 $795,000 -7% $715,000 3%
MIDTOWN WEST $937,000 $912,500 3% $950,000 -1%
DOWNTOWN $1,200,000 $990,000 21% $1,056,336 14%
UPPER EAST SIDE $995,000 $960,000 4% $935,000 6%
UPPER WEST SIDE $1,050,000 $947,500 11% $1,050,000 0%
UPPER MANHATTAN $545,000 $490,000 11% $500,000 9%
$1,600$1,500$1,400$1,300$1,200$1,100$1,000$900$800
$1,000,000$950,000$900,000$850,000$800,000$750,000$700,000$650,000
2008 2009 2010 2011 2012 2013 2014
MEDIAN PRICE MEDIAN CONDO PPSF PRICE PPSF
Price

Q3 2014
4
Price
CO-OPS Q3 2014 Q3 2013 Y/Y CHG (%) Q2 2014 Q/Q CHG (%)
MANHATTAN $707,000 $715,000 -1% $690,000 2%
MIDTOWN EAST $615,000 $586,000 5% $565,000 9%
MIDTOWN WEST $655,000 $725,000 -10% $595,000 10%
DOWNTOWN $780,000 $750,000 4% $715,000 9%
UPPER EAST SIDE $840,100 $870,000 -3% $795,000 6%
UPPER WEST SIDE $852,500 $841,000 1% $835,000 2%
UPPER MANHATTAN $340,000 $416,000 -18% $375,000 -9%
CONDOS Q3 2014 Q3 2013 Y/Y CHG (%) Q2 2014 Q/Q CHG (%)
MANHATTAN $1,325,000 $1,199,000 11% $1,265,000 5%
MIDTOWN EAST $1,070,000 $1,215,000 -12% $1,225,000 -13%
MIDTOWN WEST $1,225,000 $990,000 24% $1,220,000 0%
DOWNTOWN $1,721,000 $1,450,000 19% $1,475,000 17%
UPPER EAST SIDE $1,445,000 $1,475,000 -2% $1,375,000 5%
UPPER WEST SIDE $1,427,000 $1,150,000 24% $1,299,000 10%
UPPER MANHATTAN $705,000 $590,000 19% $575,000 23%
MEDIAN PRICE BY PROPERTY TYPE Median closing prices for the marketplace from Q1 2008 to Q3 2014.
Median prices for the marketplace have seen slower growth patterns since Q3 2013, with typical seasonality observed in the condo market. Throughout 2014, condo price outpaced co-op price growth with an average rate of 4.3%.
OVERALL CONDO CO-OP
2008 2009 2010 2011 2012 2013 2014
$1,500,000
$1,300,000
$1,100,000
$900,000
$700,000
$500,000
Source: Urban Compass Research
PRICE
Q3 2014
5
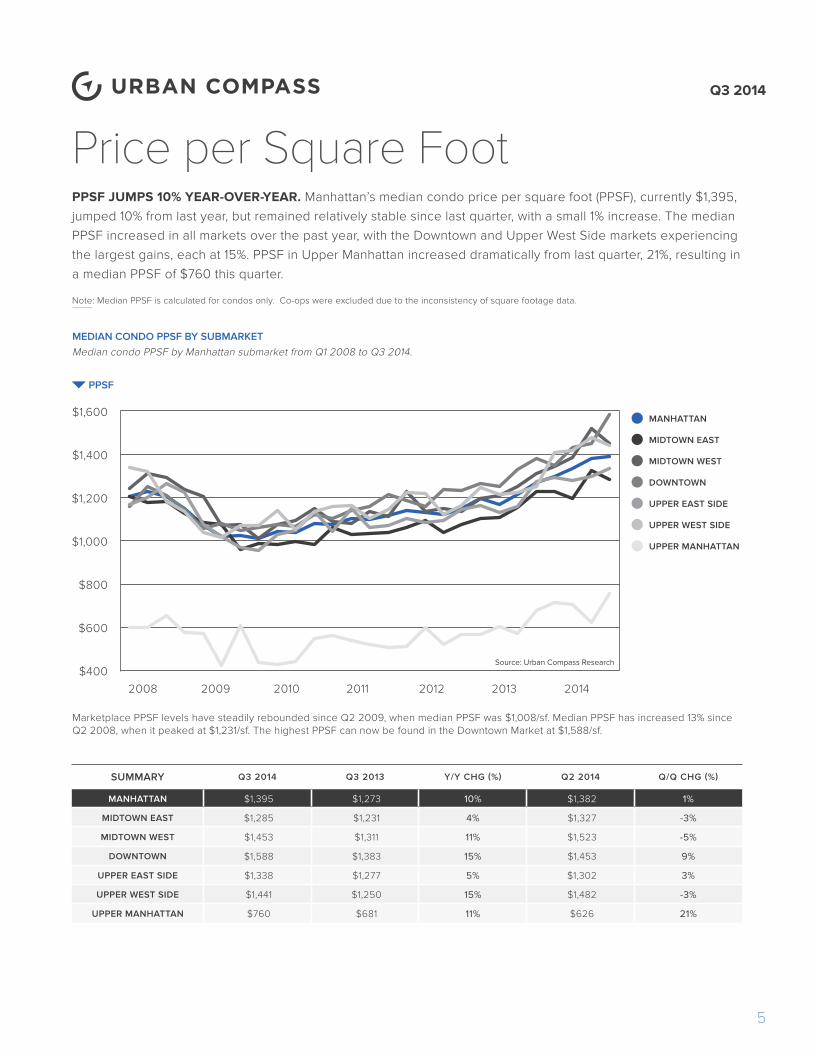
Price per Square FootPPSF JUMPS 10% YEAR-OVER-YEAR. Manhattan’s median condo price per square foot (PPSF), currently $1,395, jumped 10% from last year, but remained relatively stable since last quarter, with a small 1% increase. The median PPSF increased in all markets over the past year, with the Downtown and Upper West Side markets experiencing the largest gains, each at 15%. PPSF in Upper Manhattan increased dramatically from last quarter, 21%, resulting in a median PPSF of $760 this quarter.
Note: Median PPSF is calculated for condos only. Co-ops were excluded due to the inconsistency of square footage data.
MEDIAN CONDO PPSF BY SUBMARKET
$1,600
$1,400
$1,200
$1,000
$800
$600
$400
MANHATTAN
MIDTOWN EAST
MIDTOWN WEST
DOWNTOWN
UPPER EAST SIDE
UPPER WEST SIDE
UPPER MANHATTAN
SUMMARY Q3 2014 Q3 2013 Y/Y CHG (%) Q2 2014 Q/Q CHG (%)
MANHATTAN $1,395 $1,273 10% $1,382 1%
MIDTOWN EAST $1,285 $1,231 4% $1,327 -3%
MIDTOWN WEST $1,453 $1,311 11% $1,523 -5%
DOWNTOWN $1,588 $1,383 15% $1,453 9%
UPPER EAST SIDE $1,338 $1,277 5% $1,302 3%
UPPER WEST SIDE $1,441 $1,250 15% $1,482 -3%
UPPER MANHATTAN $760 $681 11% $626 21%
Median condo PPSF by Manhattan submarket from Q1 2008 to Q3 2014.
Marketplace PPSF levels have steadily rebounded since Q2 2009, when median PPSF was $1,008/sf. Median PPSF has increased 13% since Q2 2008, when it peaked at $1,231/sf. The highest PPSF can now be found in the Downtown Market at $1,588/sf.
2008 2009 2010 2011 2012 2013 2014
Source: Urban Compass Research
PPSF

Q3 2014
6
Closings
CONDO v. CO-OP CLOSINGS
CONDO CO-OP
Manhattan closings broken down by condos and co-ops from Q1 2008 to Q3 2014.
After the market collapse in Q4 2008, the majority of closings shifted from condos to co-ops. The difference became particularly dramatic in Q3 2010 as the market began to recover. This shift was most apparent in Q4 2012 with 941 more co-op closings than condos. Q3 2014 has seen a return to these high levels with 799 more co-op closings than condos.
SUMMARY Q3 2014 Q3 2013 Y/Y CHG (%) Q2 2014 Q/Q CHG (%)
MANHATTAN 3,319 3,694 -10% 2,862 16%
MIDTOWN EAST 525 542 -3% 449 17%
MIDTOWN WEST 203 210 -4% 163 25%
DOWNTOWN 929 1,025 -9% 922 1%
UPPER EAST SIDE 742 819 -9% 603 23%
UPPER WEST SIDE 648 807 -20% 496 31%
UPPER MANHATTAN 272 290 -6% 229 19%
MANHATTAN CLOSINGS SLOW DOWN BY 10%. The total volume of transactions in Manhattan, an estimated 3,319 this quarter, decreased by 10% since last year, but increased by 16% since last quarter. Downtown had the most closings at 929, a 9% decrease from last year.
CONDO CLOSINGS DECLINE BY 13%. Volume of condo closings in Manhattan declined by 13% year-over-year, totaling 1,260 closings. The Upper West Side experienced the largest decline in condo closings, 29%, with 240 closings this quarter, compared to 337 closings last year. Upper Manhattan, Downtown and the Upper East Side submarkets had the smallest decreases in closings activity.
CO-OP CLOSINGS DECREASE BY 8%. Co-ops fared similarly to condos with total volume of closings decreasing by 8% compared to a year ago. The Midtown West submarket had a 36% increase in closings since last year and Midtown East also experienced an increase of 4% from the preceding year. Both Downtown and Upper West Side submarkets declined 13% from a year ago.
3,000
2,500
2,000
1,500
1,000
500
0
Note: Due to the lag in the recording of sales after closing, Q3 2014 numbers are estimated and will be updated in our next quarterly report.
2008 2009 2010 2011 2012 2013 2014
CLOSINGS
Source: Urban Compass Research

Q3 2014
7
CO-OPS Q3 2014 Q3 2013 Y/Y CHG (%) Q2 2014 Q/Q CHG (%)
MANHATTAN 2,059 2,244 -8% 1,637 26%
MIDTOWN EAST 352 339 4% 294 20%
MIDTOWN WEST 80 59 36% 65 23%
DOWNTOWN 484 559 -13% 405 19%
UPPER EAST SIDE 552 621 -11% 450 23%
UPPER WEST SIDE 408 470 -13% 315 29%
UPPER MANHATTAN 183 196 -7% 108 69%
CONDOS Q3 2014 Q3 2013 Y/Y CHG (%) Q2 2014 Q/Q CHG (%)
MANHATTAN 1,260 1,450 -13% 1,225 3%
MIDTOWN EAST 173 203 -15% 155 11%
MIDTOWN WEST 123 151 -19% 98 26%
DOWNTOWN 445 466 -5% 517 -14%
UPPER EAST SIDE 189 198 -5% 153 24%
UPPER WEST SIDE 240 337 -29% 181 32%
UPPER MANHATTAN 90 94 -4% 121 -25%
CONDO & CO-OP CLOSINGS BY SUBMARKET
Condo and co-op closings broken down by submarket for Q3 2014.
Condos and co-ops had similar share compositions of closings for all submarkets, with the exception of Upper East Side and Downtown. Downtown had the largest proportion of condo closings at 36%. Alternatively, the Upper East Side market made up the bulk of co-op closings.
ClosingsCLOSINGS v. TRANSACTION DOLLAR VOLUME
CLOSINGS VOLUME ($)
The total number of Manhattan closings and total dollar volume of transactions from Q1 2008 to Q3 2014.
The market has seen a total value of $6.0B in condo and co-op sales in Q3 2014, the highest value closed since the $7.5B peak in Q2 2008. Quarter-over-quarter growth has slowed to a rate of 0.6% from Q2 2014.
4,5004,0003,5003,0002,5002,0001,5001,000
5000
$8B$7B$6B$5B$4B$3B$2B$1B$0
2008 2009 2010 2011 2012 2013 2014
CLOSINGS
Source: Urban Compass Research
BILLIONS ($)
CONDO36%
12%9%
16%
7%
20%
CO-OP
24%
16%
4%27%
9%
20%

Q3 2014
8
Inventory
7,000
6,000
5,000
4,000
3,000
2,000
1,000
0
1,500
1,000
500
0
-500
-1,000
-1,500
SUMMARY Q3 2014 Q3 2013 Y/Y CHG (%) Q2 2014 Q/Q CHG (%)
MANHATTAN 7,465 7,119 5% 7,847 -5%
MIDTOWN EAST 1,288 1,398 -8% 1,398 -8%
MIDTOWN WEST 499 432 16% 533 -6%
DOWNTOWN 2,182 2,013 8% 2,194 -1%
UPPER EAST SIDE 1,757 1,717 2% 1,895 -7%
UPPER WEST SIDE 1,157 1,072 8% 1,301 -11%
UPPER MANHATTAN 588 488 20% 529 11%
INVENTORY v. CONDO TO CO-OP SHARE DIFFERENCECondo and co-op inventory, and the share difference between them. Values above zero indicate greater condo inventory. Values below zero indicate greater co-op inventory.
In Q1 2008, the Manhattan market had 1,391 more condo properties than co-ops on the market. Since then, condo inventory declined until Q2 2012, when there were 1,289 fewer condo properties on the market than co-ops. As new condo product entered the market, the difference in the number of condo and co-op properties diminished, while in Q3 2014, there were 299 fewer condo properties than co-ops.
OVERALL INVENTORY LEVELS RISE 5%. Manhattan inventory--the number of unique properties actively on the market at any point in the quarter--increased by 5% over the past year. All Manhattan submarkets, except for Midtown East, experienced an increase in inventory, with the most significant gains in Upper Manhattan and Midtown West markets, at 20% and 16% respectively.
CONDO INVENTORY INCREASES BY 15%. There are currently 15% more condo properties on the market in Manhattan than a year ago. Condo product increased by double-digit percentages in each market except Midtown East, which experienced a 3% loss. Midtown West experienced the greatest gains, with a 27% increase in inventory.
3% FEWER CO-OPS AVAILABLE. Co-op inventory in Manhattan declined by 3% since last year. The Upper West Side and Upper Manhattan were the only markets to experience gains in co-op inventory, with the Upper Manhattan market increasing by 20%.
CONDO CO-OP SHARE DIFFERENCE
2008 2009 2010 2011 2012 2013 2014
INVENTORY SHARE DIFFERENCE
Source: Urban Compass Research

Q3 2014
9
Inventory
CO-OPS Q3 2014 Q3 2013 Y/Y CHG (%) Q2 2014 Q/Q CHG (%)
MANHATTAN 3,882 4,003 -3% 4,222 -8%
MIDTOWN EAST 801 897 -11% 883 -9%
MIDTOWN WEST 135 145 -7% 160 -16%
DOWNTOWN 791 821 -4% 858 -8%
UPPER EAST SIDE 1,185 1,247 -5% 1,288 -8%
UPPER WEST SIDE 690 659 5% 789 -13%
UPPER MANHATTAN 280 234 20% 244 15%
CONDOS Q3 2014 Q3 2013 Y/Y CHG (%) Q2 2014 Q/Q CHG (%)
MANHATTAN 3,583 3,116 15% 3,625 -1%
MIDTOWN EAST 487 501 -3% 515 -5%
MIDTOWN WEST 364 287 27% 373 -2%
DOWNTOWN 1,391 1,192 17% 1,336 4%
UPPER EAST SIDE 572 470 22% 607 -6%
UPPER WEST SIDE 467 413 13% 512 -9%
UPPER MANHATTAN 308 254 21% 285 8%
The composition of Manhattan inventory by price category and bedroom size in Q3 2014.
Q3 2014 INVENTORY BREAKDOWN BY PRICE CATEGORY
15%
26%
33%
10%
9%6%
Source: Urban Compass Research
<$500K
$500K - 1M
$1M - 3M
$3M - 5M
$5M - 10M
$10M+
Q3 2014
Q3 2014 INVENTORY BREAKDOWN BY BEDROOM TYPE
STUDIO
1BR
2BR
3BR
4BR+
Source: Urban Compass Research
15%10%
14%
28%33%
Q3 2014
Q3 2014 v. Q3 2013 INVENTORY BY BEDROOM TYPE
The bulk of inventory was 1BRs. However, there has been an increase in the number of 4BR+ listings in Q3 2014.
2014 Q3 2013 Q3
3,5003,0002,5002,0001,5001,000
5000
STUDIO 1BR 2BR 3BR 4BR+
INVENTORY
Source: Urban Compass Research
-6%
-10%
0%
-3% +19%
Q3 2014 v. Q3 2013 INVENTORY BY PRICE BUCKET
While inventory priced below $1M diminished, inventory above $1M grew. The majority of properties are within the $1M-3M range.
2014 Q3 2013 Q3
3,0002,5002,0001,5001,000
5000
<$500K $500K - 1M $1M - 3M $3M - 5M $5M - 10M $10M+
Source: Urban Compass Research
INVENTORY
-24%
-14%+1%
+13% +21%+41%

Q3 2014
10
Contracts7% FEWER CONTRACTS. The volume of signed contracts in Manhattan, a total of 2,859, decreased by 7% over the past year. The Upper West Side and Upper Manhattan markets were the only markets to experience gains, with an increase of 27% and 15%, respectively. In contrast, the number of contracts in the Midtown East and Upper East Side markets decreased significantly, with each dropping by 19%.
CONDO CONTRACTS REMAIN LEVEL. Condo contracts remained constant over the year, despite declines in all submarkets except the Upper West Side. Condos on the Upper West Side had a dramatic 86% increase, driven by the 143 contracts signed at Extell’s One Riverside Park.
12% FEWER CO-OP CONTRACTS. Co-ops in Manhattan decreased 12% over the past year. Upper East Side co-ops experienced the greatest loss, with a 20% decrease in signed contracts. Upper Manhattan was the only market to see an increase in co-op signings at 14%.
SUBMARKET CONTRACT TOTALS% OF TOTAL CONTRACTS
MEDIAN CONTRACT PRICE
MEDIAN CONTRACT PPSF
MEDIAN CONTRACT DAYS ON MARKET
MANHATTAN 2,859 100% $1,095,000 $1,344 50
MIDTOWN EAST 426 15% $750,000 $1,119 64
MIDTOWN WEST 148 5% $1,085,000 $1,524 58
DOWNTOWN 821 29% $1,450,000 $1,609 43
UPPER EAST SIDE 567 20% $1,140,000 $1,124 59
UPPER WEST SIDE 628 22% $1,395,000 $1,525 48
UPPER MANHATTAN 271 10% $495,000 $647 49
$10M+ $5M - 10M$3M - 5M$1M - 3M$500K - 1M<$500K
CONTRACTS BY PRICE CATEGORYThe breakdown of contracts by price category for Q3 2014.
1%
2%
1%
3%
1%
0%
2%18%
28%
12%
9%
18%
11%
52%
28%
28%
26%
33%
35%
36%
28%
9% 6%
5% 3%
10% 2%
11% 9%
9% 7%
5%12%
42%
42%
37%
42%
29%
34% 13%
MANHATTAN
MIDTOWN EAST
MIDTOWN WEST
DOWNTOWN
UPPER EAST SIDE
UPPER WEST SIDE
UPPER MANHATTAN
SUBMARKETS
0% 10% 20% 30% 40% 50% 60% 70% 80% 90% 100%
Source: Urban Compass Research
CONTRACTS BREAKDOWNThe composition of contracts by submarket for Q3 2014.
The majority of all contracts signed in Q3 2014 were within the $1M-3M range. The Midtown West, Downtown and Upper West Side markets each have 42% of contract shares within that range. However, Upper Manhattan saw 52% of its contracts occur on properties less than $500K.

Q3 2014
11
Contracts
CO-OPS Q3 2014 Q3 2013 Y/Y CHG (%) Q2 2014 Q/Q CHG (%)
MANHATTAN 1,514 1,729 -12% 2,004 -24%
MIDTOWN EAST 286 334 -14% 374 -24%
MIDTOWN WEST 42 51 -18% 65 -35%
DOWNTOWN 342 401 -15% 503 -32%
UPPER EAST SIDE 405 505 -20% 544 -26%
UPPER WEST SIDE 310 325 -5% 397 -22%
UPPER MANHATTAN 129 113 14% 121 7%
CONDOS Q3 2014 Q3 2013 Y/Y CHG (%) Q2 2014 Q/Q CHG (%)
MANHATTAN 1,345 1,341 0% 1,381 -3%
MIDTOWN EAST 140 190 -26% 175 -20%
MIDTOWN WEST 106 120 -12% 128 -17%
DOWNTOWN 479 542 -12% 519 -8%
UPPER EAST SIDE 162 197 -18% 205 -21%
UPPER WEST SIDE 318 171 86% 214 49%
UPPER MANHATTAN 142 123 15% 141 1%
SUMMARY Q3 2014 Q3 2013 Y/Y CHG (%) Q2 2014 Q/Q CHG (%)
MANHATTAN 2,859 3.070 -7% 3,385 -16%
MIDTOWN EAST 426 524 -19% 549 -22%
MIDTOWN WEST 148 171 -13% 193 -23%
DOWNTOWN 821 943 -13% 1,022 -20%
UPPER EAST SIDE 567 702 -19% 749 -24%
UPPER WEST SIDE 628 496 27% 611 3%
UPPER MANHATTAN 271 236 15% 262 3%
CONTRACTS v. MEDIAN CONDO PPSFTotal number of contracts and the median contracted PPSF from Q1 2008 to Q3 2014.
Despite the seasonality of contract volume, median PPSF has risen consistently since its low point in Q4 2009.
5,000
4,500
4,000
3,500
3,000
2,500
2,000
1,500
1,000
$1,450
$1,350
$1,250
$1,150
$1,050
$950
$850
$7502008 2009 2010 2011 2012 2013 2014
CONTRACTS MEDIAN CONDO PPSF CONTRACTS PPSF
Source: Urban Compass Research

Q3 2014
12
Days on Market
SUMMARY Q3 2014 Q3 2013 Y/Y CHG (%) Q2 2014 Q/Q CHG (%)
MANHATTAN 50 50 0% 40 25%
MIDTOWN EAST 64 58 10% 46 39%
MIDTOWN WEST 58 47 23% 35 66%
DOWNTOWN 43 44 -2% 39 10%
UPPER EAST SIDE 59 56 5% 45 31%
UPPER WEST SIDE 48 46 4% 35 37%
UPPER MANHATTAN 49 55 -11% 41 20%
DAYS ON MARKET REMAIN LEVEL. Year-over-year, median days on market for contracted Manhattan condo and co-op resales has stayed at 50 days. Midtown East properties spent the longest time on the market with a median of 64 days this quarter, a 10% increase from last year. Midtown West properties had the largest increase in days on market, 23% since last year, with a median of 58 days on the market. This quarter, Downtown saw the shortest median days on market at 43 days, a 2% decrease from a year ago. Upper Manhattan had the largest decrease in median days on the market, 11% fewer days than last year.
CONDOS SPEND 9% LONGER ON MARKET. While condos had a slightly shorter time on the market than co-ops—49 days compared to 51 days—condos spent 9% longer on the market than last year, and 20% longer than last quarter. Midtown East condos spent the longest time on the market, with 67 days--56% jump from a year ago, and a 68% jump from last quarter.
CO-OPS SPEND 6% FEWER DAYS ON MARKET. Co-ops spent a median of 51 days on the market, a 6% decrease from a year ago. Midtown West co-ops spent 53% more time on market at 75 days.
MEDIAN DAYS ON MARKET v. CONTRACTS
Total number of Manhattan contracts and the median number of days contracts spent on the market.
Beginning in 2012, there was a resurgence in consumer confidence as indicated by decreased days on market and increased contracts signed.
4,500
4,000
3,500
3,000
2,500
2,000
1,500
1,000
500
0
200
180
160
140
120
100
80
60
40
20
02008 2009 2010 2011 2012 2013 2014
CONTRACTS MEDIAN DAYS ON MARKET CONTRACTS DAYS
Source: Urban Compass Research

Q3 2014
13
Days on Market
CO-OPS Q3 2014 Q3 2013 Y/Y CHG (%) Q2 2014 Q/Q CHG (%)
MANHATTAN 51 54 -6% 39 31%
MIDTOWN EAST 64 67 -4% 46 39%
MIDTOWN WEST 75 49 53% 31 142%
DOWNTOWN 41 44 -7% 34 21%
UPPER EAST SIDE 60 56 7% 43 40%
UPPER WEST SIDE 46 45 2% 35 31%
UPPER MANHATTAN 50 66 -24% 41 22%
CONDOS Q3 2014 Q3 2013 Y/Y CHG (%) Q2 2014 Q/Q CHG (%)
MANHATTAN 49 45 9% 41 20%
MIDTOWN EAST 67 43 56% 40 68%
MIDTOWN WEST 49 45 9% 35 40%
DOWNTOWN 48 43 12% 44 9%
UPPER EAST SIDE 59 54 9% 52 13%
UPPER WEST SIDE 48 46 4% 33 45%
UPPER MANHATTAN 45 48 -6% 39 15%
DAYS ON MARKET BREAKDOWNThe detailed breakdown of days on market trends for contracted listings by price category, bedroom size and submarket in Q3 2014.
In Q3 2014, 62% of contracts priced between $500K-$1M were on the market for fewer than 60 days. Similarly, 62% of 1BRs went into contract within 60 days. Downtown had 63% of its listings enter into contract within 60 days.
<30 DAYS 30-59 DAYS 60-119 DAYS 120-179 DAYS 180+ DAYS
MIDTOWN EASTMIDTOWN WEST
DOWNTOWNUPPER EAST SIDEUPPER WEST SIDE
UPPER MANHATTAN
STUDIO1BR
2BR3BR
4BR+
<$500K$500K - 1M
$1M - 3M$3M - 5M
$5M - 10M$10M+PR
ICE
CAT
EGO
RYB
EDR
OO
M S
IZE
SUB
MA
RK
ET
0% 10% 20% 30% 40% 50% 60% 70% 80% 90% 100%Source: Urban Compass Research
22%
32%
30%
24%
17%
23%
25%
30%
28%
27%
19%
23%
23%
32%
24%
32%
28%
30%
30%
29%
16%
18%
7%
29%
32%
26%
22%
16%
24%
30%
31%
26%
27%
29%
28%
22%
26%
28%
26%
30%
27%
22%
28%
25%
15%
30%
26%
21%
27%
25%
24%
9%
7%
8%
15%
25%
10%
9%
8%
8%
12%
24%
9%
11%
9%
11%
8%
6%
11%
10%
8%
17%
13%
30%
10%
9%
10%
15%
26%
14%
10%
8%
11%
9%
13%

14
Q3 2014
Sneak PeekAt Urban Compass, we collect a lot of data, and strive to look at it through as many different lenses as possible to provide our agents, our clients, and the industry with creative insights.
Here is the first sneak peek at what Urban Compass Research is working on: Neighborhood Affinity. In this map, we display which neighborhoods are searched for the most, denoted by the size of the circle. When we zoom in on the Upper West Side, we can see which other neighborhoods are searched by the same users when looking for homes in the Upper West Side, as denoted by the thickness of the line.
In this example, people searching in the Upper West Side are most likely to also search in the Upper East Side, followed by Chelsea, the West Village, and Williamsburg.
NEIGHBORHOOD AFFINITY
Source: Urban Compass Research

Q3 2014
Sneak PeekHere is another sneak peek into Urban Compass Research: Days on Market Distribution. In this chart, we analyzed all properties that went into contract from January 1, 2013 to September 15, 2014. We mapped out the percentage of these properties over the number of days on market. 10% of all properties went into contract in the first 14 days. 40% of properties went into contract between the 15th and 36th days. 50% of contracted properties in this time period happened after the 36th day.
DAYS ON MARKET DISTRIBUTION
Source: Urban Compass Research
10% 40% 50%
PER
CEN
TAG
E O
F C
ON
TRA
CTS
SIG
NED
DAYS ON MARKET
0
0%
0.5
%1%
1.5%
2%
2.5
%
14 20 30 36 50 60 70 80 90 100 110 120
15

Q3 2014
16
Sneak PeekBecause great things come in threes, here is one last sneak peak into Urban Compass Research: Signed Contract Market Share Maps. In this marimekko chart, we plot the asking price of every listing that went into contract during the third quarter of 2014. Each column represents a submarket in Manhattan. The width of each column indicates the share of in-contract listings by dollar volume, proportionate to Manhattan’s total dollar volume of signed contracts. Each box shows listings that fall into the specified bedroom category. The height of each box represents the share of contracts of each bedroom category in its respective market. Inside each box, we include three statistics: number of contracts, average price and average price per square foot.
For example: Downtown represents 36% of total contract dollar value in Manhattan, while two-bedroom units account for 34% of all Downtown contracts. With a total of $632M in contract dollar value, two-bedroom units in Downtown Manhattan represent 12% of all contracts in Manhattan.
CONTRACTS BY SUBMARKET SHARE
Source: Urban Compass Research
31($9.7M)
$2,617/sf37
($9.4M)$2,770/sf
35($6M)
$1853/sf
9($4.9M)$1,443/sf
2 ($3M) 1,123
3 ($1.8M)$1,007/sf
38
($958K)
$754/sf
96
($668K)
$669/sf
114
($440K)
$668/sf
20 ($315K)$712/sf
10
($3.2M)
$2,553/sf
39($2.5M)$1,950/
sf
69
($1M)
$1,467/sf
30($588K)$1282/sf
28($3.3M)$1,652/sf
111 ($1.9M)$1,612/sf
168 ($793K) $1,120/sf
110($453K) $893/sf
72($3.6M)$1744/sf
200($1.8M)$1418/sf
187($777M)$964/sf
73 ($410M) $931/sf
104($3.4M)
$2,001/sf
214($1.9M)
$1,601/sf
203($872K)
$1,265/sf
68 ($578K) $1,307/sf
94($4.9M)
$2,300/sf
252($2.5M)
$1,795/sf
317($1.2M)
$1,482/sf
127 ($650K) $1132/sf
Manhattan 2014 Q3 Contracts: Total Contract Value = $5.03BTotal Contracts: = 2,859Average Price = $1.8MAverage PPSF = $1,465
100%
0%DOWNTOWN UPPER WEST UPPER EAST MIDTOWN EAST MW UM
25%
50%
75%
STUDIO 1 BED 2 BEDS 3 BEDS 4+ BEDS AVERAGE PRICE
$1.8B $1.3B $1B $532M $263M $132M

Our Manhattan Market Compass Report uses recorded sales data from ACRIS and sales listings data from hundreds of brokerages to craft insights on the Manhattan residential real estate market. Data is represented on a quarterly basis and for most metrics, tracks
activity since 2008. We chose 2008 as a starting point to compare the current market to the pre-recession market.
Urban Compass, Inc. makes no representations or warranties, express or implied, with respect to future market conditions or prices of residential product at the time the subject property or any competitive property is complete and ready for occupancy or with respect to any report, study, finding,
recommendation or other information provided by Urban Compass, Inc. herein. Moreover, no warranty, express or implied, is made or should be assumed regarding the accuracy, adequacy, completeness, legality, reliability, merchantability or fitness for a particular purpose of any information, in
part or whole, contained herein. Any and all such warranties are hereby expressly disclaimed.
2014 © Urban Compass, Inc. All Rights Reserved. This information may not be copied, used or distributed without Urban Compass, Inc.’s consent.