manitoba curriculum companion - … using the sine and cosine ratios to calculate ... in general...
TRANSCRIPT

Foundations and Pre-calculus
Mathematics
P E A R S O N
10
MANITOBACURRICULUM COMPANION
Manitoba Curriculum Companion
2 Manitoba Curriculum Companion Copyright © 2010 Pearson Canada Inc.
Manitoba Curriculum Companion for Pearson Foundations and Pre-calculus Mathematics 10
Manitoba Curriculum Planning Charts Chapter 1 page 3 Chapter 2 page 4 Chapter 4 page 5 Chapter 6 page 6 Chapter 7 page 7 Lessons to Address Manitoba-Specific Content Teaching Notes Lesson 6.7 page 8 Lesson 6.8 page 11 Lesson 6.9 page 14 Lesson 6.10 page 17 Masters 6.14 Lesson 6.7: The Length of a Line Segment page 19 6.15 Lesson 6.8: The Midpoint of a Line Segment page 25 6.16 Lesson 6.9: Scatterplots and Lines of Best Fit page 31 6.17 Lesson 6.10: Equation of the Line of Best Fit page 33 6.18 TI-Nspire Instructions for Try This Lesson 6.10 page 37 6.19 Answers for Masters 6.14 to 6.17 page 39 6.20 Lesson 6.7 Check Your Understanding Solutions page 44 6.21 Lesson 6.8 Check Your Understanding Solutions page 47 About This Module The Manitoba Curriculum Framework departs from the WNCP Common Curriculum Framework in a few specific areas, often reflected in the Achievement Indicators. Use the planning charts to get general background on such curricular discrepancies. Use the Teaching Notes and Masters for support as you implement the material unique to Manitoba.
Manitoba Curriculum Companion Copyright © 2010 Pearson Canada Inc. 3
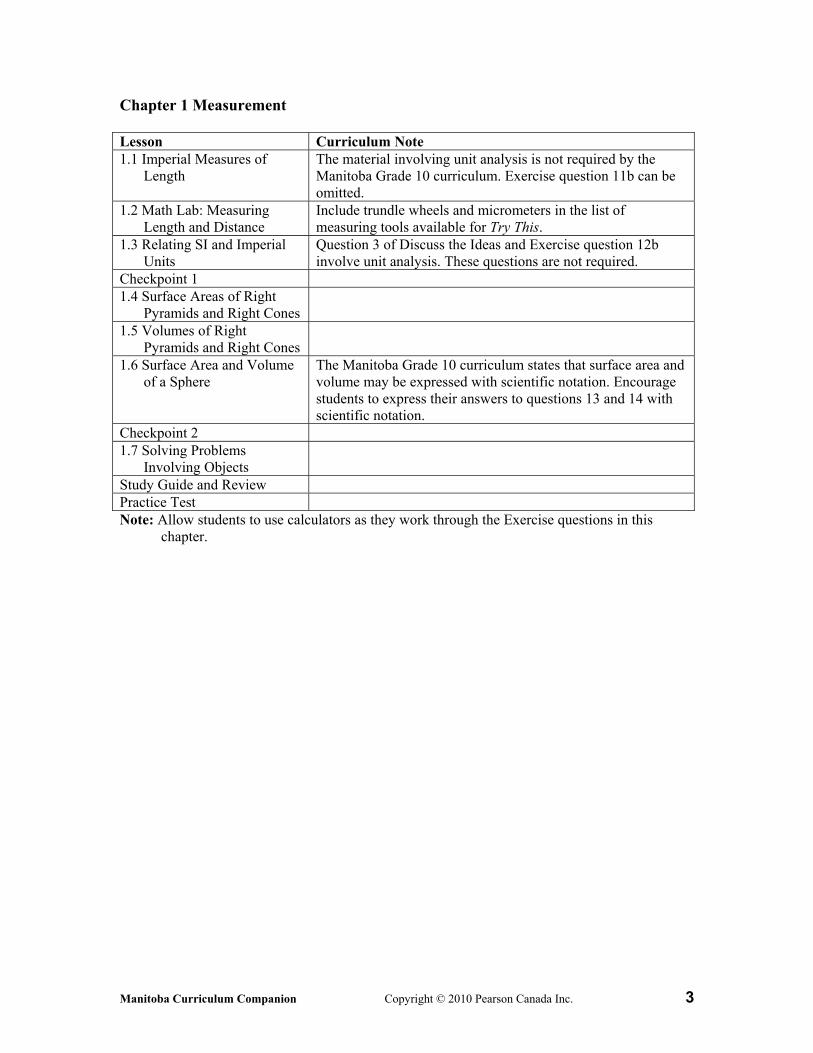
Chapter 1 Measurement Lesson Curriculum Note 1.1 Imperial Measures of
Length The material involving unit analysis is not required by the Manitoba Grade 10 curriculum. Exercise question 11b can be omitted.
1.2 Math Lab: Measuring Length and Distance
Include trundle wheels and micrometers in the list of measuring tools available for Try This.
1.3 Relating SI and Imperial Units
Question 3 of Discuss the Ideas and Exercise question 12b involve unit analysis. These questions are not required.
Checkpoint 1 1.4 Surface Areas of Right
Pyramids and Right Cones
1.5 Volumes of Right Pyramids and Right Cones
1.6 Surface Area and Volume of a Sphere
The Manitoba Grade 10 curriculum states that surface area and volume may be expressed with scientific notation. Encourage students to express their answers to questions 13 and 14 with scientific notation.
Checkpoint 2 1.7 Solving Problems
Involving Objects
Study Guide and Review Practice Test Note: Allow students to use calculators as they work through the Exercise questions in this
chapter.
4 Manitoba Curriculum Companion Copyright © 2010 Pearson Canada Inc.
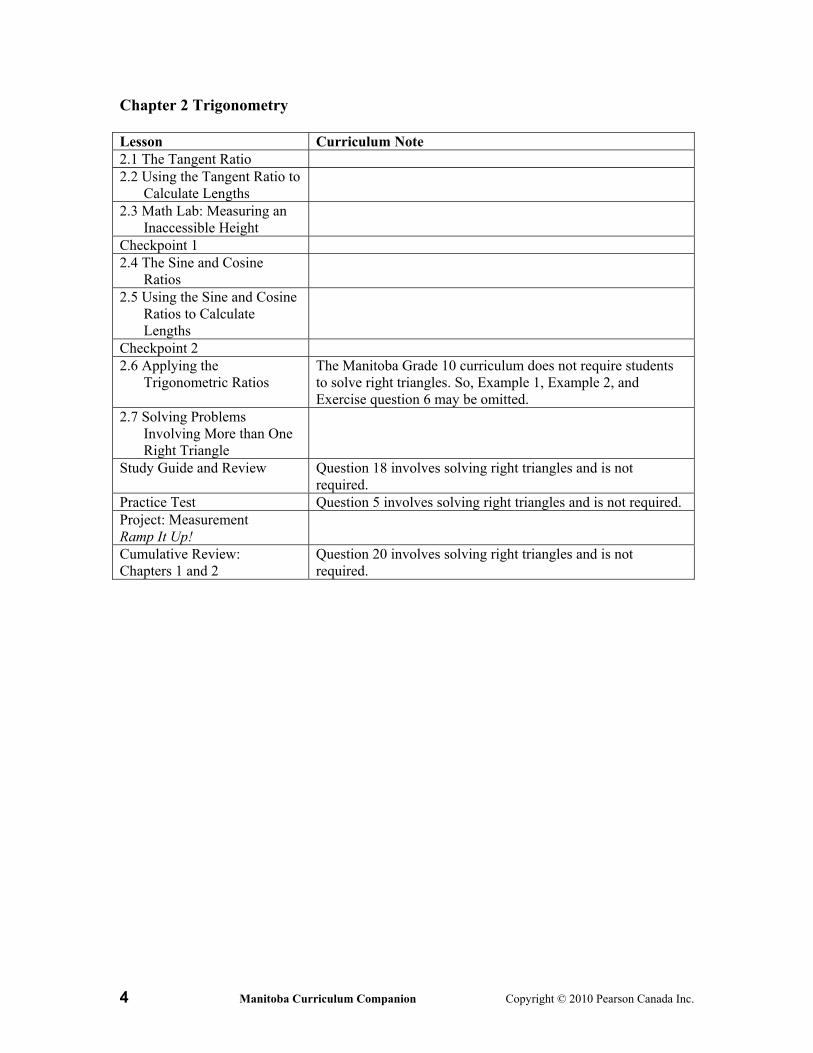
Chapter 2 Trigonometry Lesson Curriculum Note 2.1 The Tangent Ratio 2.2 Using the Tangent Ratio to
Calculate Lengths
2.3 Math Lab: Measuring an Inaccessible Height
Checkpoint 1 2.4 The Sine and Cosine
Ratios
2.5 Using the Sine and Cosine Ratios to Calculate Lengths
Checkpoint 2 2.6 Applying the
Trigonometric Ratios The Manitoba Grade 10 curriculum does not require students to solve right triangles. So, Example 1, Example 2, and Exercise question 6 may be omitted.
2.7 Solving Problems Involving More than One Right Triangle
Study Guide and Review Question 18 involves solving right triangles and is not required.
Practice Test Question 5 involves solving right triangles and is not required. Project: Measurement Ramp It Up!
Cumulative Review: Chapters 1 and 2
Question 20 involves solving right triangles and is not required.
Manitoba Curriculum Companion Copyright © 2010 Pearson Canada Inc. 5
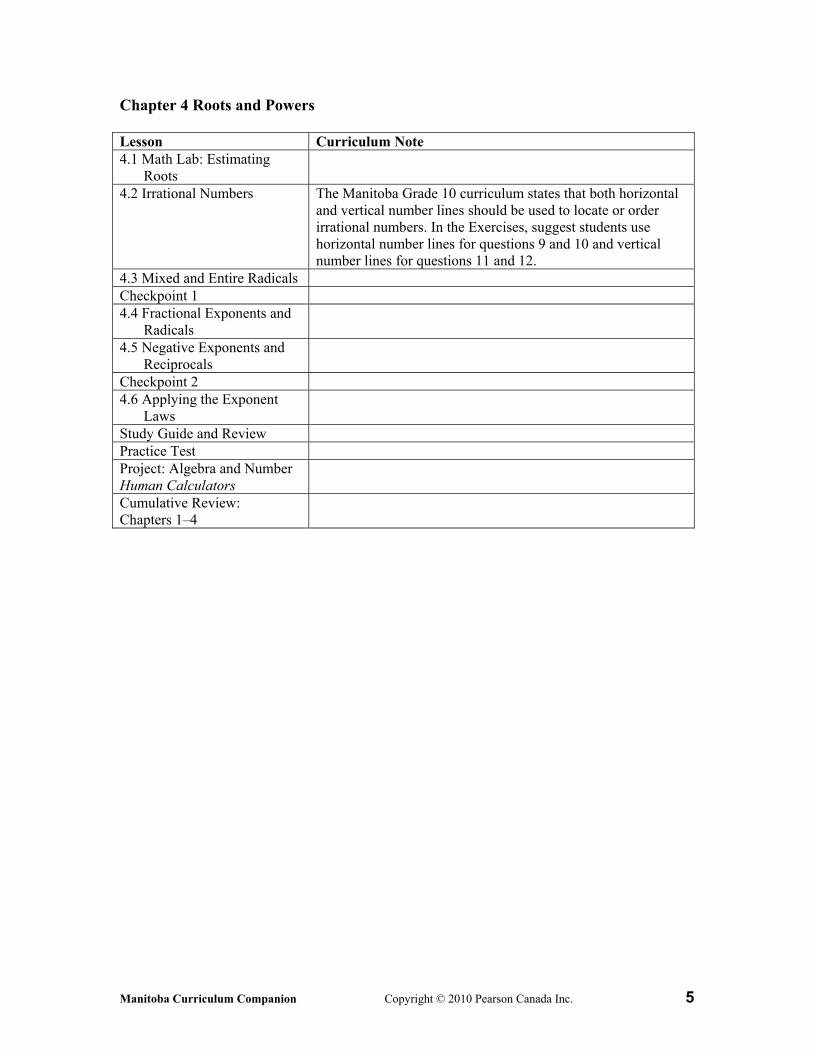
Chapter 4 Roots and Powers Lesson Curriculum Note 4.1 Math Lab: Estimating
Roots
4.2 Irrational Numbers The Manitoba Grade 10 curriculum states that both horizontal and vertical number lines should be used to locate or order irrational numbers. In the Exercises, suggest students use horizontal number lines for questions 9 and 10 and vertical number lines for questions 11 and 12.
4.3 Mixed and Entire Radicals Checkpoint 1 4.4 Fractional Exponents and
Radicals
4.5 Negative Exponents and Reciprocals
Checkpoint 2 4.6 Applying the Exponent
Laws
Study Guide and Review Practice Test Project: Algebra and Number Human Calculators
Cumulative Review: Chapters 1–4

6 Manitoba Curriculum Companion Copyright © 2010 Pearson Canada Inc.
Chapter 6 Linear Functions Lesson Curriculum Note 6.1 Slope of a Line 6.2 Slopes of Parallel and
Perpendicular Lines
Checkpoint 1 6.3 Math Lab: Investigating
Graphs of Linear Functions
6.4 Slope-Intercept Form of the Equation for a Linear Function
6.5 Slope-Point Form of the Equation for a Linear Function
The Manitoba Grade 10 curriculum does not require students rewrite the equation of a linear relation from one form to another. However, students need this skill to use technology to graph an equation. So, it is recommended that students review Example 2b and complete Exercise questions 9b and 11.
Checkpoint 2 6.6 General Form of the
Equation for a Linear Relation
The Manitoba Grade 10 curriculum does not require students rewrite the equation of a linear relation from one form to another. However, students need this skill to use technology to graph an equation, or to identify equivalent linear relations. Example 1 and Exercise questions 6, 8b, and 18 are optional and may be omitted. The Manitoba Grade 10 curriculum does not require students to compare the graphs of linear relations in different forms. So, Exercise question 19 may be omitted.
6.7 The Length of a Line Segment
Use Master 6.14, Lesson 6.7, to cover content required in Manitoba only, for RF10: Solve problems that involve the distance between two points …. AI 10.1: Determine the distance between two points on a Cartesian plane using a variety of strategies. AI 10.4: Solve a contextual problem involving distance between two points …
6.8 The Midpoint of a Line Segment
Use Master 6.15, Lesson 6.8, to cover content required in Manitoba only, for RF10: Solve problems that involve … the midpoint of a line segment. AI 10.2: Determine the midpoint of a line segment, given the endpoints of the segment, using a variety of strategies. AI 10.3: Determine an endpoint of a line segment, given the other endpoint and the midpoint, using a variety of strategies. AI 10.4: Solve a contextual problem involving … midpoint of a line segment.
6.9 Math Lab: Scatterplots and Lines of Best Fit
Use Master 6.16, Lesson 6.9, to cover content required in Manitoba only, for RF7: Determine the equation of a linear relation, given a scatterplot. AI 7.6: Determine the equation of the line of best fit from a scatterplot using technology and discuss the correlation.

Manitoba Curriculum Companion Copyright © 2010 Pearson Canada Inc. 7
6.10 Math Lab: Equation of the Line of Best Fit
Use Master 6.17, Lesson 6.10, to cover content required in Manitoba only, for RF7: Determine the equation of a linear relation, given a scatterplot. AI 7.6: Determine the equation of the line of best fit from a scatterplot using technology and discuss the correlation.
Study Guide and Review Question 21b involves rewriting an equation in general form and is not required.
Practice Test In question 3c, students are not required to rewrite the equation in general form.
Chapter 7 Systems of Linear Equations Lesson Curriculum Note 7.1 Developing Systems of
Linear Equations
7.2 Solving a System of Linear Equations Graphically
7.3 Math Lab: Using Graphing Technology to Solve a System of Linear Equations
Checkpoint 1 7.4 Using a Substitution
Strategy to Solve a System of Linear Equations
7.5 Using an Elimination Strategy to Solve a System of Linear Equations
Checkpoint 2 7.6 Properties of Systems of
Linear Equations
Study Guide and Review Practice Test Project: Relations and Functions Exercise Mind and Body
Cumulative Review: Chapters 1–7
Question 24 involves rewriting an equation in general form and is not required.
8 Manitoba Curriculum Companion • Lesson 6.7
6.7 The Length of a Line Segment
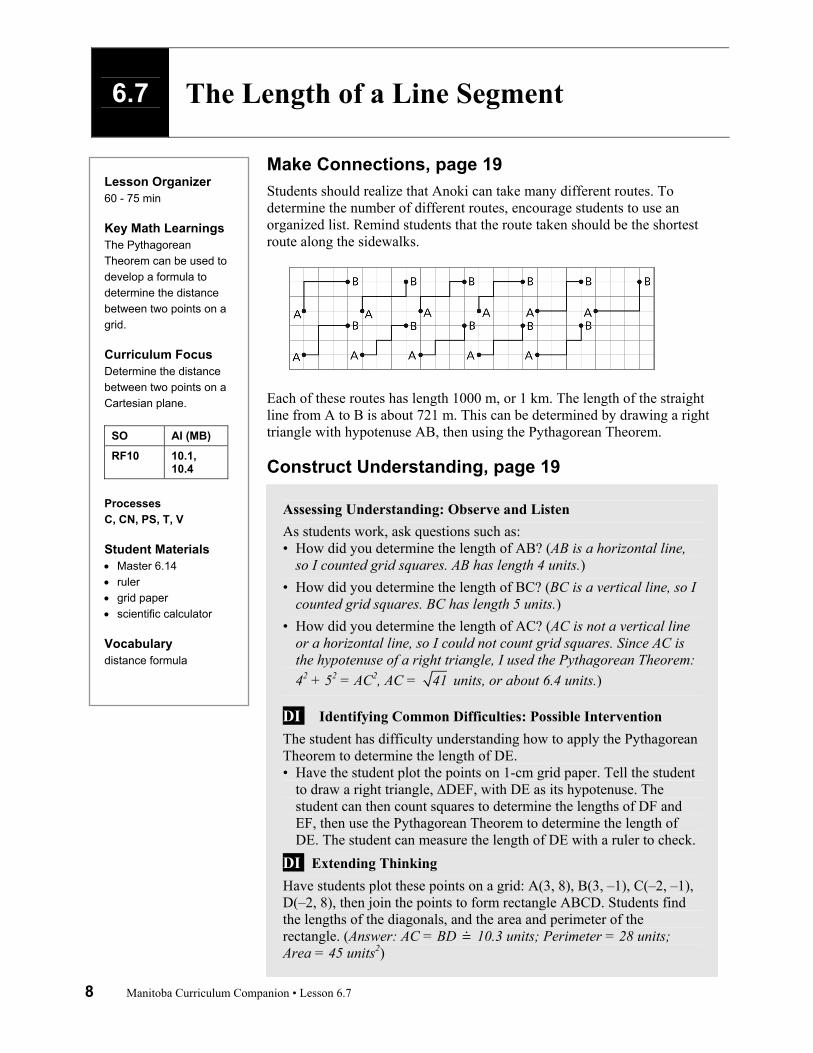
Make Connections, page 19 Students should realize that Anoki can take many different routes. To determine the number of different routes, encourage students to use an organized list. Remind students that the route taken should be the shortest route along the sidewalks.
Each of these routes has length 1000 m, or 1 km. The length of the straight line from A to B is about 721 m. This can be determined by drawing a right triangle with hypotenuse AB, then using the Pythagorean Theorem.
Construct Understanding, page 19
Assessing Understanding: Observe and Listen As students work, ask questions such as: • How did you determine the length of AB? (AB is a horizontal line,
so I counted grid squares. AB has length 4 units.) • How did you determine the length of BC? (BC is a vertical line, so I
counted grid squares. BC has length 5 units.) • How did you determine the length of AC? (AC is not a vertical line
or a horizontal line, so I could not count grid squares. Since AC is the hypotenuse of a right triangle, I used the Pythagorean Theorem: 42 + 52 = AC2, AC = 41 units, or about 6.4 units.)
DI Identifying Common Difficulties: Possible Intervention The student has difficulty understanding how to apply the Pythagorean Theorem to determine the length of DE. • Have the student plot the points on 1-cm grid paper. Tell the student
to draw a right triangle, ∆DEF, with DE as its hypotenuse. The student can then count squares to determine the lengths of DF and EF, then use the Pythagorean Theorem to determine the length of DE. The student can measure the length of DE with a ruler to check.
DI Extending Thinking Have students plot these points on a grid: A(3, 8), B(3, –1), C(–2, –1), D(–2, 8), then join the points to form rectangle ABCD. Students find the lengths of the diagonals, and the area and perimeter of the rectangle. (Answer: AC = BD 10.3 units; Perimeter = 28 units; Area = 45 units2)
Lesson Organizer 60 - 75 min
Key Math Learnings The Pythagorean Theorem can be used to develop a formula to determine the distance between two points on a grid.
Curriculum Focus Determine the distance between two points on a Cartesian plane.
SO AI (MB)
RF10 10.1, 10.4
Processes C, CN, PS, T, V
Student Materials Master 6.14 ruler grid paper scientific calculator
Vocabulary distance formula
Manitoba Curriculum Companion • Lesson 6.7 9
Debrief Try This: Assessment for Learning Have students share their strategies for determining the length of any line segment on a grid. Ask questions such as: • How did you determine the length of DE? (I drew a right triangle
with DE as its hypotenuse, then used the Pythagorean Theorem; DE is about 10.8 units long.)
• How could you determine the length of any line segment on a grid? (I could draw a right triangle with the line segment as its hypotenuse, then use the Pythagorean Theorem.)
• Did anyone discover a different strategy? Explain. (I discovered that I can square the difference in the x-coordinates of the points, then square the difference in the y-coordinates of the points. I add the results, then take the square root to determine the length of the line segment.)
As you present the distance formula, some students may be confused by the use of subscripts in the formula; students may think the subscripts are powers. Emphasize the difference between subscripts and superscripts. It may be helpful to think of P(x1, y1) as the first point chosen and Q(x2, y2) as the second point chosen.
As you present Example 3, review the properties of isosceles, equilateral, and scalene triangles.
DI Identifying Common Difficulties: Possible Intervention The student subtracts an x-coordinate from a y-coordinate, or a y-coordinate from an x-coordinate when using the distance formula. • Relate the distance formula to a general diagram. Tell the student that we
subtract two x-coordinates to determine a horizontal distance and two y-coordinates to determine a vertical distance.
DI Extending Thinking Use the question prompts on Master 6.14.
p. 19: How could you verify this length?
I could plot the points on 1-cm grid paper, then use a ruler to measure CD.
p. 20, Example 1: What other ways are there to determine the lengths of FH and GH?
Because each leg is horizontal or vertical, I could count grid squares to determine their lengths.
p. 22, Example 3: Why do we write the lengths as radicals?
When we want an exact answer for the length of a line segment, we leave it as a radical. It is one less calculation to make, and I avoid differences caused by rounding.
p. 22, Example 3: In the solution for the length of VW, the expression x2 – x1 is negative. Why did this happen? Why does it not affect the answer for the length of VW?
This happened because we subtracted a positive number from a negative number. The answer was not affected because when we square a negative number, we get a positive number.
Assessment for Learning What to look and listen for: • Students can use the
Pythagorean Theorem to determine the length of a line segment on a grid.
• Students can count squares to determine the length of a horizontal or vertical line segment.
• Students can use the distance formula to determine the distance between two points.
• Students can solve a problem involving the distance between two points.
10 Manitoba Curriculum Companion • Lesson 6.7
Assessing Understanding: Discuss the Ideas, page 23 Sample Responses 1. This triangle could be drawn in 2 different ways. For example, in Example
1, we could have drawn a right triangle by choosing the point E(3, 1) above FG. The calculations would be the same because EF and GH are congruent horizontal segments and have the same length, and EG and FH are congruent vertical segments and have the same length.
2. The Pythagorean Theorem states that for any right triangle with side lengths a and b, and hypotenuse c, c2 = a2 + b2. In the distance formula, x2 – x1 represents a, y2 – y1 represents b, and PQ represents c. The distance formula is like the Pythagorean Theorem solved for c. They are different in that x2 – x1 and y2 – y1 are differences, while a and b are lengths.
3. The formula would become PQ = 2 21 2 1 2x x y y . The length of
the line segment would not change because once you square the difference between the coordinates, you get the same result whether you square a number or its opposite.
Exercises, page 23
Assessment of Learning – selected questions
AI (MB) 10.1 10.4 Question number
9 18
Sample Response: Reflect, page 24 To calculate the length of a line segment, I can:
• Draw a right triangle with the line segment as the hypotenuse, then use the Pythagorean Theorem.
• Count squares if the line segment is vertical or horizontal. • Use the distance formula. When I use the formula, it doesn’t matter which
point I call P and which point I call Q because when I square the differences, I will always get positive numbers. I also know that when I want an exact answer, I leave the answer as a radical unless the radicand is a perfect square.

Manitoba Curriculum Companion • Lesson 6.8 11
6.8 The Midpoint of a Line Segment
Make Connections, page 25 Ask how many students have played number-guessing games. Invite a volunteer to describe a strategy Stephanie might have used. What you might hear:
• Stephanie guesses the median number from the available numbers each time, depending on Vince’s response. For example: From 1 to 100: 50 Less From 1 to 50: 25 Less From 1 to 25: 12 Less From 1 to 12: 6 Less From 1 to 6: 3 Less From 1 to 3: 2 Less Less than 2: 1 Correct
Have students play the guessing games in pairs for numbers 1 to 1000. Students should discover that the number can be guessed in no more than 10 tries, using the same strategy as above.
Construct Understanding, page 25
Ensure students understand that the midpoint of a line segment is a point on the line segment that is the same distance from each endpoint.
Assessing Understanding: Observe and Listen As students work, ask questions such as: • How did you determine the coordinates of the midpoint of PQ?
(I counted grid squares. PQ has length 3 units, and one-half of 3 is 1.5. So, I counted 1.5 squares to the right of P. The midpoint of PQ has coordinates (0.5, 3).)
• How did you determine the coordinates of the midpoint of QR? (I counted grid squares. QR has length 6 units, and one-half of 6 is 3. So, I counted 3 squares down from Q. The midpoint of QR has coordinates (2, 1).)
• How did you determine the coordinates of the midpoint of PR? (I traced the triangle, then folded the tracing so that P coincided with R. The fold line intersected PR at (0.5, 1). This is the midpoint of PR.)
• What other strategy could you use? (I could use a ruler to measure the length of PR, divide its length in half, then mark this length on the line segment. The mark would be at (0.5, 1).)
DI Identifying Common Difficulties: Possible Intervention The student thinks that one-half the length of a horizontal line segment is the x-coordinate of its midpoint.
Lesson Organizer 60 - 75 min
Key Math Learnings The midpoint of a line segment can be determined by calculating the mean of the x-coordinates and the mean of the y-coordinates of its endpoints.
Curriculum Focus Determine the midpoint of a line segment.
SO AI (MB)
RF10 10.2, 10.3, 10.4
Processes C, CN, PS, T, V
Student Materials Master 6.15 grid paper ruler Mira scientific calculator
Vocabulary midpoint, mean, midpoint formula
12 Manitoba Curriculum Companion • Lesson 6.8
• Have the student copy ∆PQR on grid paper. The length of PQ is 3 units. The length divided by 2 is 1.5 units. Have the student plot the point M(1.5, 3), then use a ruler to measure PM and MQ. The student should discover that M is not the midpoint of PQ. Point out that the midpoint is 1.5 units from either endpoint.
DI Extending Thinking Have students determine the coordinates of the other endpoint, B, of line segment AB given that point A(2, 3) is one endpoint and M(4, 5) is its midpoint. (Answer: B(4, 5))
Debrief Try This: Assessment for Learning Have students share their strategies for determining the midpoint of any line segment on a grid. Ask questions such as: • How could you determine the midpoint of any line segment on a
grid? (I could draw a right triangle with horizontal and vertical legs and with the line segment as its hypotenuse, then determine the midpoints of the vertical and horizontal sides. I would then draw a perpendicular from the hypotenuse to each midpoint. Where the perpendiculars meet is the midpoint of the line segment.)
• Did anyone use a different strategy? Explain. (I discovered that the x-coordinate of the midpoint of any line segment is the mean of the x-coordinates of the endpoints, and its y-coordinate is the mean of the y-coordinates of the endpoints.)
Before you present the midpoint formula, you might want to review how to find the mean of two numbers; for example 12 and 54. Add the numbers: 12 + 54 = 66 Divide their sum by 2: 66 2 = 33 The mean of 12 and 54 is 33.
DI Identifying Common Difficulties: Possible Intervention The student confuses x1 + x2 and y1 + y2 in the midpoint formula with x2 – x1 and y2 – y1 in the distance formula. • Encourage the student to think of a mean. The midpoint of a line segment is
a mean, and the first step in calculating a mean is to add.
DI Extending Thinking Use the question prompts on Master 6.15.
p. 27, Example 2: Why did we use the formula and not draw a graph?
The coordinates of the points are very large. My graph would have to be very big or the scales on the axes would have to be very large. It is more efficient to use the formula.
Assessment for Learning What to look and listen for: • Students can count
squares to determine the midpoint of a horizontal or vertical line segment.
• Students can use a Mira, a ruler, paper folding, or other strategies to determine the midpoint of a line segment.
• Students can use the midpoint formula to determine the midpoint of a line segment, given the endpoints of the segment.
• Students can use different strategies to determine an endpoint of a line segment, given the other endpoint and the midpoint.
• Students can solve a problem involving the midpoint of a line segment.

Manitoba Curriculum Companion • Lesson 6.8 13
Assessing Understanding: Discuss the Ideas, page 29 Sample Responses 1. I could place the Mira so that it passes through the midpoint and is
perpendicular to the segment. I would look through the Mira and mark a point where I see the reflection image of the given endpoint. This is the other endpoint. I could use a ruler to extend the segment to the other side of the midpoint. I would measure the distance between the midpoint and the endpoint, then mark a point the same distance on the other side of the midpoint. This is the other endpoint.
2. From a diagram, the midpoint can be located visually or by measuring, but it is not accurate unless the coordinates are integers. If the endpoints are far apart, graphing is not practical; if the scales on the axes are adjusted to fit the line segment on the grid, the accuracy of visually locating the midpoint is reduced. Using the midpoint formula, no graphing is required and it is an accurate method of determining the coordinates of the midpoint. However, errors may occur in calculations.
3. I can calculate the distance from the midpoint to each of the endpoints. If the coordinates are correct, the distances should be equal. For example, to verify that M(2, 3) is the midpoint of the line segment with endpoints A(–1, –3) and B(5, 9):
AM = ( ) ( )2 22 1 3 3 = 9 36 = 45
MB = 2 25 2 9 3 = 9 36 = 45 Since AM = MB, the coordinates of the midpoint are correct.
Exercises, page 29
Assessment of Learning – selected questions
AI (MB) 10.2 10.3 10.4 Question number
7 13 17
Sample Response: Reflect, SB page 30 To determine the midpoint of a line segment, I can: • Count squares when the line segment is horizontal or vertical. • Measure the segment with a ruler, divide its length in half, then mark this
length on the line segment. • Fold the paper so that one end of the segment coincides with the other end,
then mark the point where the crease intersects the segment. • Place a Mira on the segment so that one end of the segment coincides with
the other end, then mark the point where the Mira intersects the line segment.
• Use the midpoint formula.
14 Manitoba Curriculum Companion • Lesson 6.9
6.9 Math Lab: Scatterplots and Lines of Best Fit
Make Connections, page 31 Invite students to look at the graph of the cost of McIntosh apples. Have volunteers explain how they would estimate. What you might hear:
• To estimate the cost of 2.5 kg of apples, I would begin at 2.5 on the Mass axis, draw a vertical line to the graph, then draw a horizontal line from the graph to the Cost axis. This line intersects the Cost axis at about 3.25. So, the cost of 2.5 kg of apples is about $3.25.
• To estimate the cost of 3.5 kg of apples, I would extend the grid so the Mass axis shows at least 3.5 kg, then use a ruler to extend the graph. I would begin at 3.5 on the Mass axis, draw a vertical line to the graph, then draw a horizontal line from the graph to the Cost axis. This line intersects the Cost axis at about 4.5. So, the cost of 3.5 kg of apples is about $4.50.
These costs are approximate because their points do not lie where grid lines intersect.
Construct Understanding, page 31
Have one pair of students model what to measure for the arm span; the arms should be stretched out to the left and right, parallel to the floor. The measurement is from the tip of the longest finger on one hand to the tip of the longest finger on the other hand.
Assessing Understanding: Observe and Listen As students work, ask questions such as: • From the table, does there appear to be a relationship between arm
span and height? Explain. (Yes, a person’s arm span is close to his or her height.)
• From the graph, what relationship do you see? (The relationship appears to be close to linear. As the arm span increases, so does the height.)
DI Identifying Common Difficulties: Possible Intervention The student has difficulty measuring the group members’ heights accurately. • Suggest that each person be measured in the same way. Since the
soles and heels of shoes can vary, ensure students remove their shoes. Then, to locate the top of a person’s head, place a book horizontally on her or his head, then measure to the bottom of the book.
Lesson Organizer 60 - 75 min
Key Math Learnings The line of best fit drawn on a scatterplot suggests a possible relationship between the two sets of data.
Curriculum Focus Draw the line of best fit for a set of data.
SO AI (MB)
RF7 7.6
Processes C, CN, PS, R, V
Student Materials Master 6.16 tape measure or metre
stick grid paper ruler
Vocabulary scatterplot, line of best fit
Manitoba Curriculum Companion • Lesson 6.9 15
DI Extending Thinking Based on the data from the table, students could determine who has the shape of a square (arm span = height) and who has the shape of a rectangle (arm span height). Students could then take the same measurements on family members to determine if all members of the same family have approximately the same “shape.”
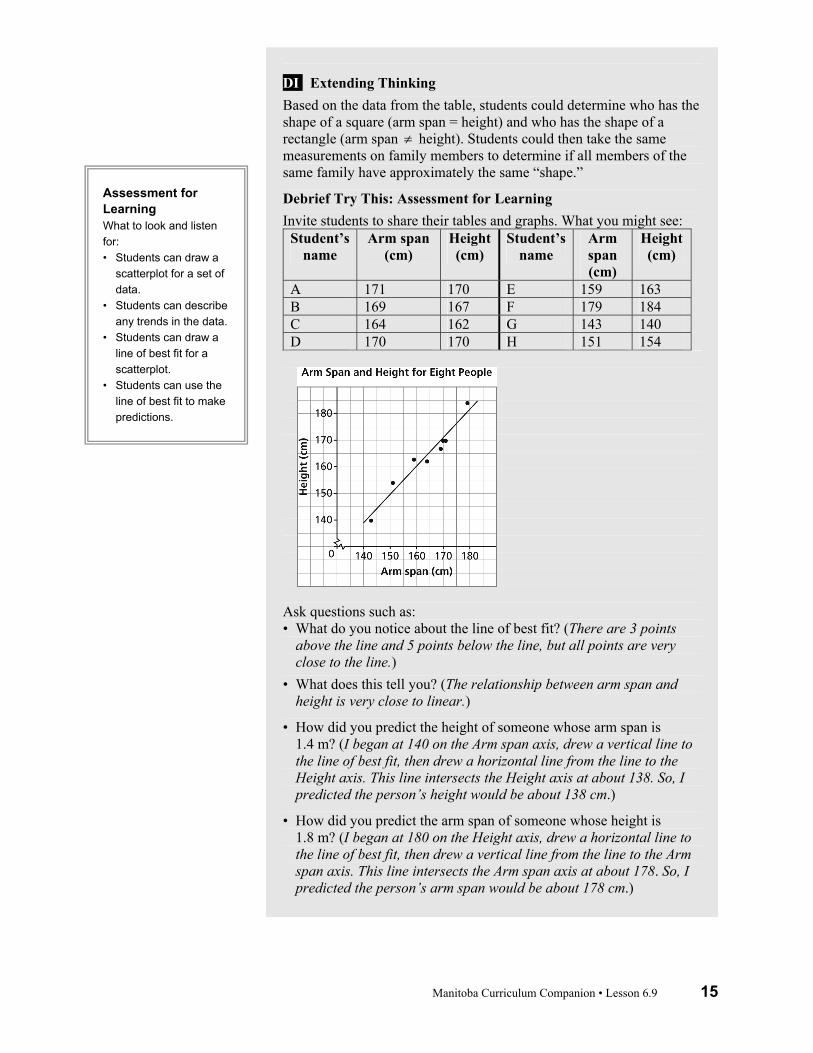
Debrief Try This: Assessment for Learning Invite students to share their tables and graphs. What you might see:
Student’s name
Arm span (cm)
Height (cm)
Student’s name
Arm span (cm)
Height (cm)
A 171 170 E 159 163 B 169 167 F 179 184 C 164 162 G 143 140 D 170 170 H 151 154
Ask questions such as: • What do you notice about the line of best fit? (There are 3 points
above the line and 5 points below the line, but all points are very close to the line.)
• What does this tell you? (The relationship between arm span and height is very close to linear.)
• How did you predict the height of someone whose arm span is 1.4 m? (I began at 140 on the Arm span axis, drew a vertical line to the line of best fit, then drew a horizontal line from the line to the Height axis. This line intersects the Height axis at about 138. So, I predicted the person’s height would be about 138 cm.)
• How did you predict the arm span of someone whose height is 1.8 m? (I began at 180 on the Height axis, drew a horizontal line to the line of best fit, then drew a vertical line from the line to the Arm span axis. This line intersects the Arm span axis at about 178. So, I predicted the person’s arm span would be about 178 cm.)
Assessment for Learning What to look and listen for: • Students can draw a
scatterplot for a set of data.
• Students can describe any trends in the data.
• Students can draw a line of best fit for a scatterplot.
• Students can use the line of best fit to make predictions.
16 Manitoba Curriculum Companion • Lesson 6.9
DI Identifying Common Difficulties: Possible Intervention The student always starts each axis at 0, and this often results in the line of best fit being very imprecise. • Remind the student that he or she can use zigzag marks on the axes so that
the data points are more spread out, and not all located in the top right corner of the graph. This way, the line of best fit will be more accurate.
DI Extending Thinking Use the question prompts on Master 6.16.
p. 31: Suppose you had graphed heights horizontally and arm spans vertically. How would your graph change? Would this affect your predictions?
Because arm span and height are close in value, the graph would not change significantly. My predictions would not change; for example, to predict the height of someone whose arm span is 1.4 m, I would now begin at 140 on the Arm span axis, draw a horizontal line to the line of best fit, then draw a vertical line from the line to the Height axis. The result would not change.
Assess Your Understanding, page 32 Assessment of Learning – selected questions
AI (MB) 7.6 Question number
2
Manitoba Curriculum Companion • Lesson 6.10 17
6.10 Math Lab: Equation of the Line of Best Fit
Make Connections, page 33 Invite students to look at the graph of the annual cost of a car-sharing plan. Have volunteers answer the questions. What you might hear:
• The slope of the graph is 7. It represents the additional cost of $7 per hour driven.
• The C-intercept is 80. It represents the annual membership fee of $80, which includes the application fee.
• An equation that describes the graph is: C = 7h + 80
Construct Understanding, page 33
Pair a student who has good graphing calculator skills with a student who has difficulties with a graphing calculator. Distribute copies of Master 6.18 to students who are using a TI-Nspire calculator.
Assessing Understanding: Observe and Listen As students work, ask questions such as: • Does there appear to be a linear relation between the two sets of
data? (As the year increases, the winning time tends to decrease. The relation between year and time is fairly linear.)
• What is the equation of the line of best fit? (The equation is: y = –0.666x + 1449.39)
• How well does the line fit the data? (The line fits the data very closely. Five data points are above the line and 4 data points are below the line; all points are close to the line.)
DI Identifying Common Difficulties: Possible Intervention The student expects the equation to be written in the form y = mx + b and is confused when the calculator displays values for a and b. • Tell the student that the calculator displays an equation in slope-
intercept form as y = ax + b, where a represents the slope of the line. The student should relate the value of a to the value of m in the equation y = mx + b.
DI Extending Thinking Have students research the winning times for the men’s 1500-m speed-skating event since 1976. Have them graph the data and determine the equation of the line of best fit. Students explain the similarities and differences between the graphs and the lines of best fit for the men’s and women’s winning times.
Lesson Organizer 75 - 90 min
Key Math Learnings The correlation coefficient is a measure of how well the line of best fit fits the data.
Curriculum Focus Determine the equation of the line of best fit for a scatterplot.
SO AI (MB)
RF7 7.6
Processes C, CN, PS, R, T, V
Student Materials Masters 6.17 and 6.18 graphing calculator or
computer with graphing software
Vocabulary equation of the line of best fit, correlation coefficient

18 Manitoba Curriculum Companion • Lesson 6.10
Debrief Try This: Assessment for Learning Invite students to share their predictions for the winning time in 2016. Ask questions such as: • What is your prediction for the winning time in 2016?
(About 106.37 s) • What other strategy could you use to determine the winning time?
(I could substitute x = 2016 into the equation of the line of best fit, then solve for y. OR On my TI-83 calculator, I could press y r À, then enter X = 2016. The calculator shows Y = 106.374.)
As you introduce the correlation coefficient, tell students that not all data sets are necessarily linear, or close to linear. When r is close to 0, the points on the scatterplot are more random and do not show a linear trend.
Some students may be tempted to calculate the correlation coefficient for a set of data without graphing the data. For example, suppose a student calculated r = 0.542. This tells the student that the line of best fit does not fit the data very well, and so the points do not lie on or near a line. If the student had graphed the data, he or she might have discovered that only one point does not fit the trend of the graph, maybe as the result of a recording error. If this point were ignored, the correlation coefficient would be much closer to 1. For this reason, encourage students to start by graphing the data.
DI Identifying Common Difficulties: Possible Intervention The student has difficulty tracing along the line of best fit to make a prediction because the cursor will not move beyond the window boundaries. • Remind the student that when he or she wants to go to the left or right of
the plotted points, it may be necessary to change the window settings to ensure that the required value is included in the domain or range.
DI Extending Thinking Use the question prompts on Master 6.17.
p. 34: What do a and b represent? a represents the slope of the line of best fit and b represents its vertical intercept.
Technology Note: Students who are not using a TI-83, TI-84, or TI-Nspire calculator may have to consult their calculators’ handbooks for instructions on how to construct a scatterplot and determine the line of best fit.
Assess Your Understanding, page 35 Assessment of Learning – selected questions
AI (MB) 7.6 Question number
3
Assessment for Learning What to look and listen for: • Students can use
technology to draw a scatterplot and the line of best fit for a set of data.
• Students can determine the equation of the line of best fit for a set of data.
• Students can determine the correlation coefficient for a line of best fit and describe how well the line fits the data.
• Students can use the line of best fit to make predictions.
Name: ______________________ Date: _________________
Copyright © 2010 Pearson Canada Inc. The Length of a Line Segment 19
Master 6.14a
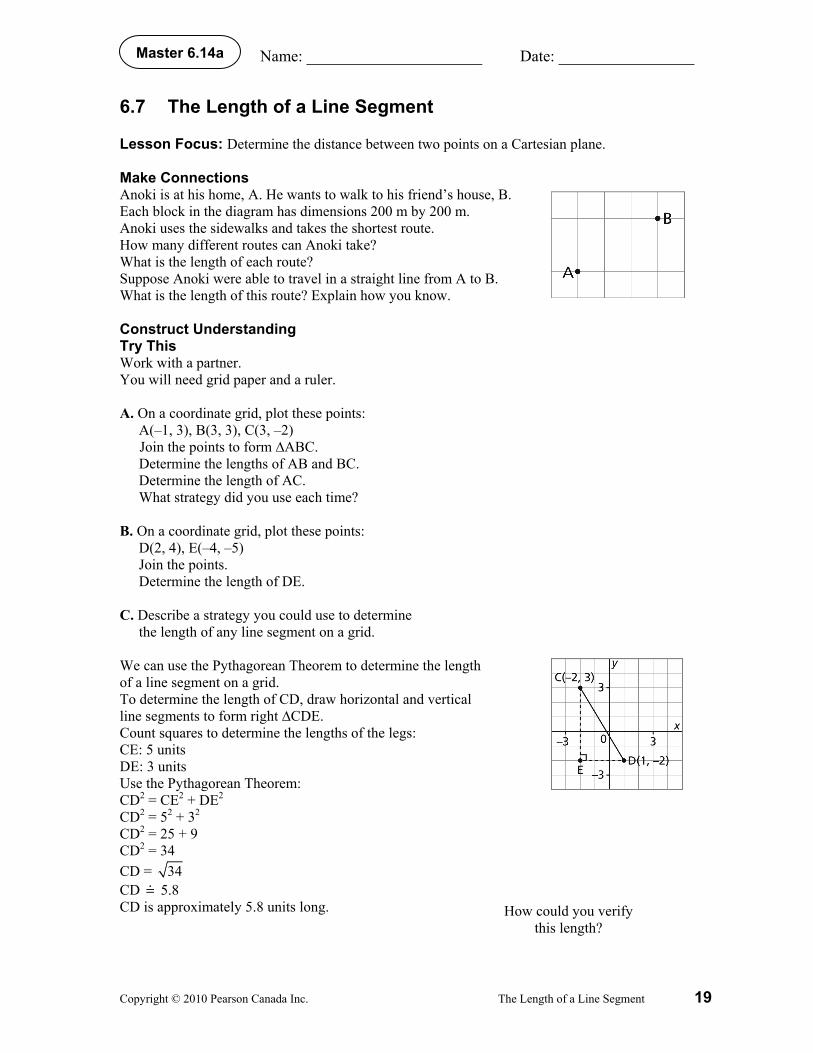
6.7 The Length of a Line Segment Lesson Focus: Determine the distance between two points on a Cartesian plane. Make Connections Anoki is at his home, A. He wants to walk to his friend’s house, B. Each block in the diagram has dimensions 200 m by 200 m. Anoki uses the sidewalks and takes the shortest route. How many different routes can Anoki take? What is the length of each route? Suppose Anoki were able to travel in a straight line from A to B. What is the length of this route? Explain how you know. Construct Understanding Try This Work with a partner. You will need grid paper and a ruler. A. On a coordinate grid, plot these points:
A(–1, 3), B(3, 3), C(3, –2) Join the points to form ∆ABC. Determine the lengths of AB and BC. Determine the length of AC. What strategy did you use each time?
B. On a coordinate grid, plot these points: D(2, 4), E(–4, –5) Join the points. Determine the length of DE.
C. Describe a strategy you could use to determine the length of any line segment on a grid.
We can use the Pythagorean Theorem to determine the length of a line segment on a grid. To determine the length of CD, draw horizontal and vertical line segments to form right ∆CDE. Count squares to determine the lengths of the legs: CE: 5 units DE: 3 units Use the Pythagorean Theorem: CD2 = CE2 + DE2 CD2 = 52 + 32
CD2 = 25 + 9 CD2 = 34 CD = 34 CD 5.8 CD is approximately 5.8 units long.
How could you verify this length?
Name: ______________________ Date: _________________
20 The Length of a Line Segment Copyright © 2010 Pearson Canada Inc.
Master 6.14b
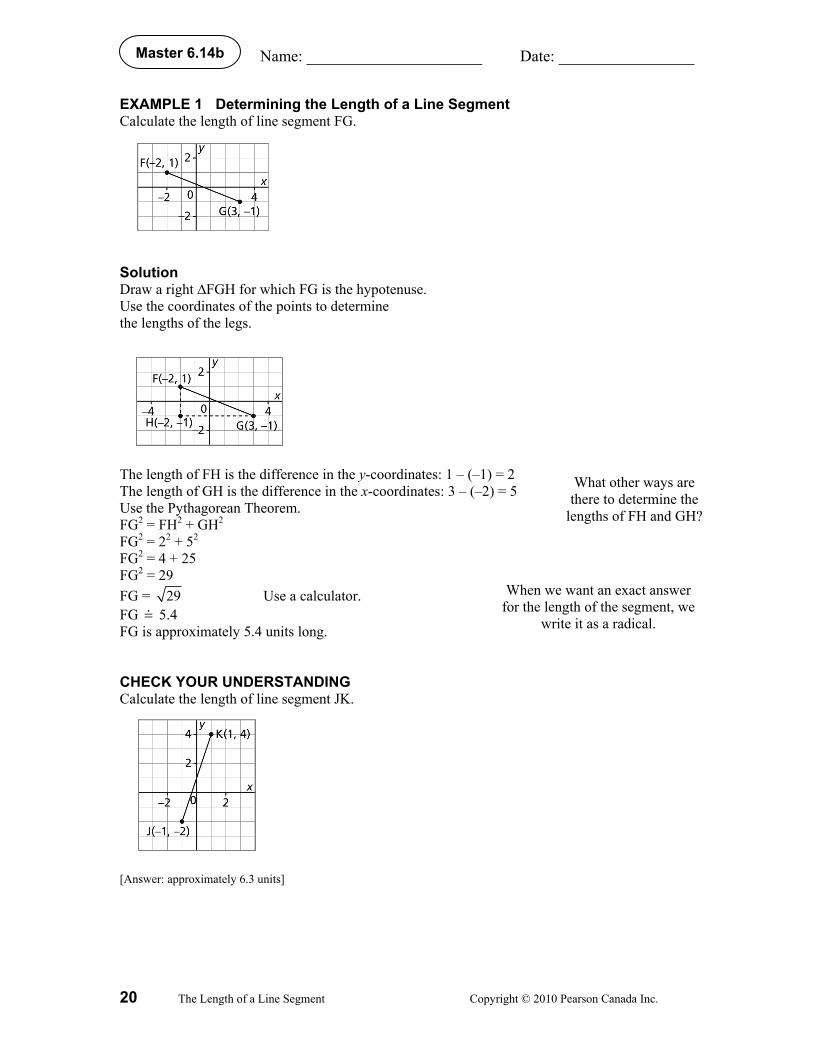
EXAMPLE 1 Determining the Length of a Line Segment Calculate the length of line segment FG. Solution Draw a right ∆FGH for which FG is the hypotenuse. Use the coordinates of the points to determine the lengths of the legs. The length of FH is the difference in the y-coordinates: 1 – (–1) = 2 The length of GH is the difference in the x-coordinates: 3 – (–2) = 5 Use the Pythagorean Theorem. FG2 = FH2 + GH2 FG2 = 22 + 52
FG2 = 4 + 25 FG2 = 29 FG = 29 Use a calculator. FG 5.4 FG is approximately 5.4 units long. CHECK YOUR UNDERSTANDING Calculate the length of line segment JK. [Answer: approximately 6.3 units]
What other ways are there to determine the
lengths of FH and GH?
When we want an exact answer for the length of the segment, we
write it as a radical.
Name: ______________________ Date: _________________
Copyright © 2010 Pearson Canada Inc. The Length of a Line Segment 21
Master 6.14c
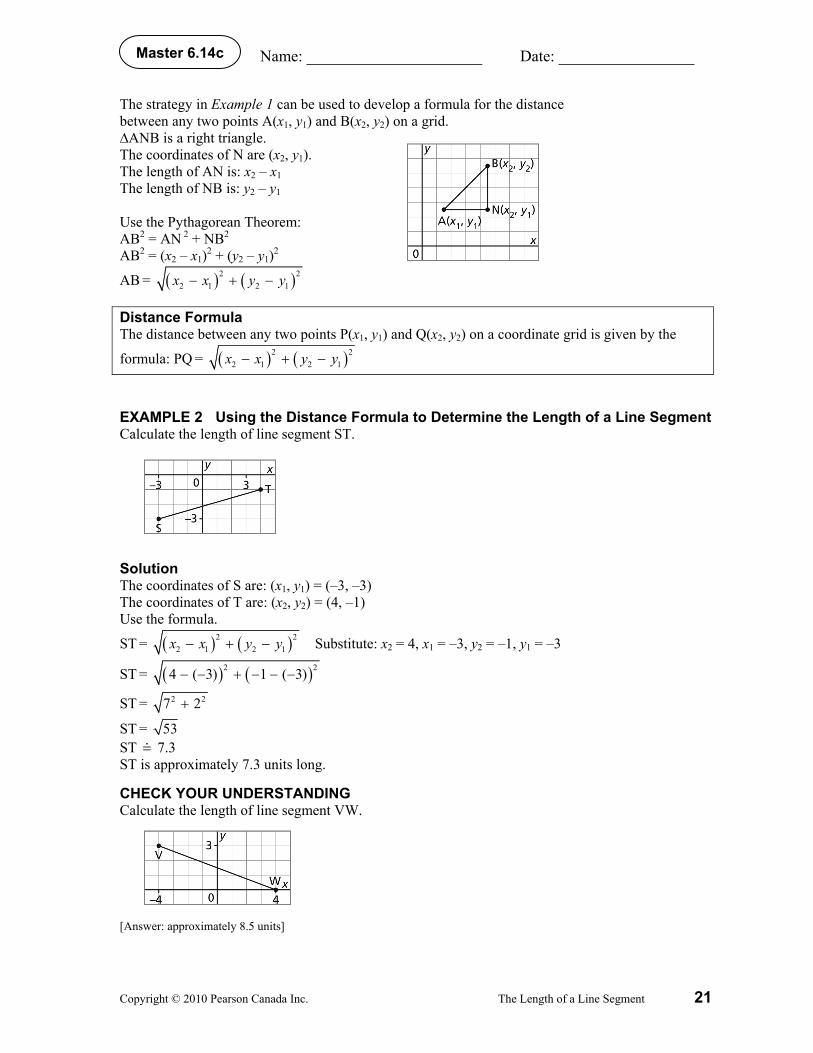
The strategy in Example 1 can be used to develop a formula for the distance between any two points A(x1, y1) and B(x2, y2) on a grid. ∆ANB is a right triangle. The coordinates of N are (x2, y1). The length of AN is: x2 – x1 The length of NB is: y2 – y1 Use the Pythagorean Theorem: AB2 = AN 2 + NB2 AB2 = (x2 – x1)2 + (y2 – y1)2
AB = ( ) ( )2 22 1 2 1− + −x x y y
Distance Formula The distance between any two points P(x1, y1) and Q(x2, y2) on a coordinate grid is given by the
formula: PQ = ( ) ( )2 22 1 2 1− + −x x y y
EXAMPLE 2 Using the Distance Formula to Determine the Length of a Line Segment Calculate the length of line segment ST. Solution The coordinates of S are: (x1, y1) = (–3, –3) The coordinates of T are: (x2, y2) = (4, –1) Use the formula.
ST = ( ) ( )2 22 1 2 1− + −x x y y Substitute: x2 = 4, x1 = –3, y2 = –1, y1 = –3
ST = ( ) ( )2 24 ( 3) 1 ( 3)− − + − − −
ST = 2 27 2+
ST = 53 ST 7.3 ST is approximately 7.3 units long. CHECK YOUR UNDERSTANDING Calculate the length of line segment VW. [Answer: approximately 8.5 units]
Name: ______________________ Date: _________________
22 The Length of a Line Segment Copyright © 2010 Pearson Canada Inc.
Master 6.14d
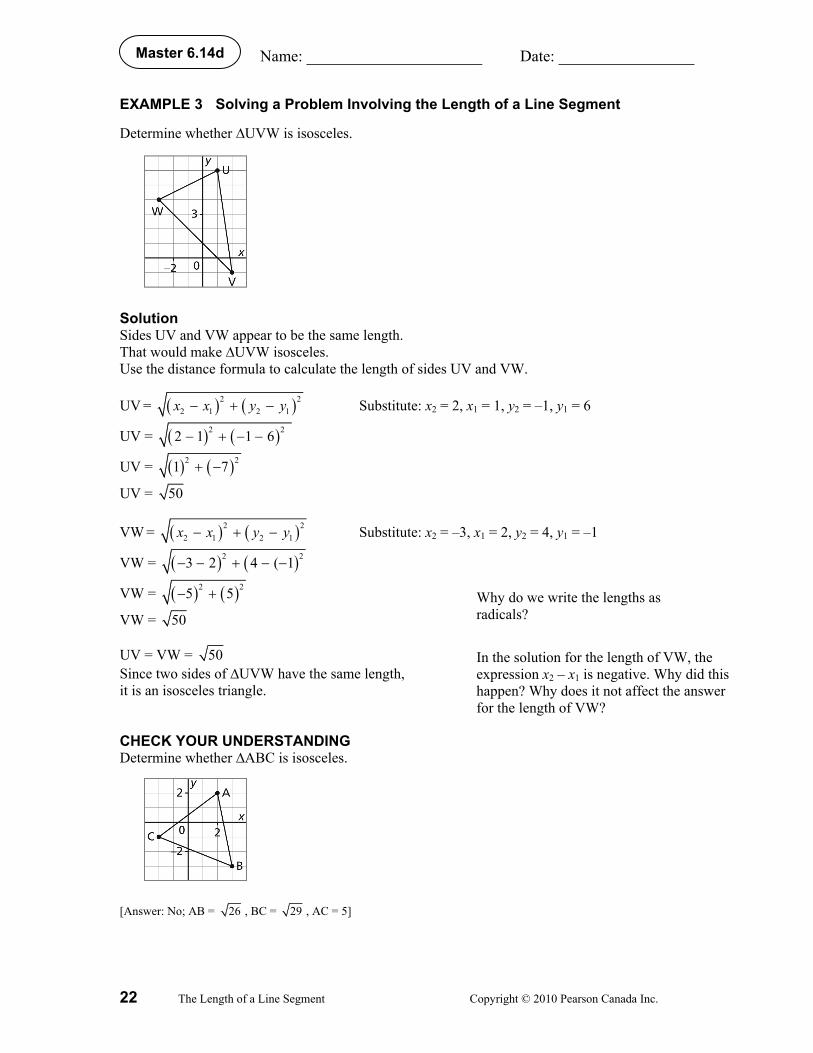
EXAMPLE 3 Solving a Problem Involving the Length of a Line Segment Determine whether ∆UVW is isosceles. Solution Sides UV and VW appear to be the same length. That would make ∆UVW isosceles. Use the distance formula to calculate the length of sides UV and VW.
UV = ( ) ( )2 22 1 2 1− + −x x y y Substitute: x2 = 2, x1 = 1, y2 = –1, y1 = 6
UV = ( ) ( )2 22 1 1 6− + − −
UV = ( ) ( )2 21 7+ −
UV = 50
VW = ( ) ( )2 22 1 2 1− + −x x y y Substitute: x2 = –3, x1 = 2, y2 = 4, y1 = –1
VW = ( ) ( )2 23 2 4 ( 1− − + − −
VW = ( ) ( )2 25 5− +
VW = 50
UV = VW = 50 Since two sides of ∆UVW have the same length, it is an isosceles triangle. CHECK YOUR UNDERSTANDING Determine whether ∆ABC is isosceles. [Answer: No; AB = 26 , BC = 29 , AC = 5]
Why do we write the lengths as radicals?
In the solution for the length of VW, the expression x2 – x1 is negative. Why did this happen? Why does it not affect the answer for the length of VW?
Name: ______________________ Date: _________________
Copyright © 2010 Pearson Canada Inc. The Length of a Line Segment 23
Master 6.14e
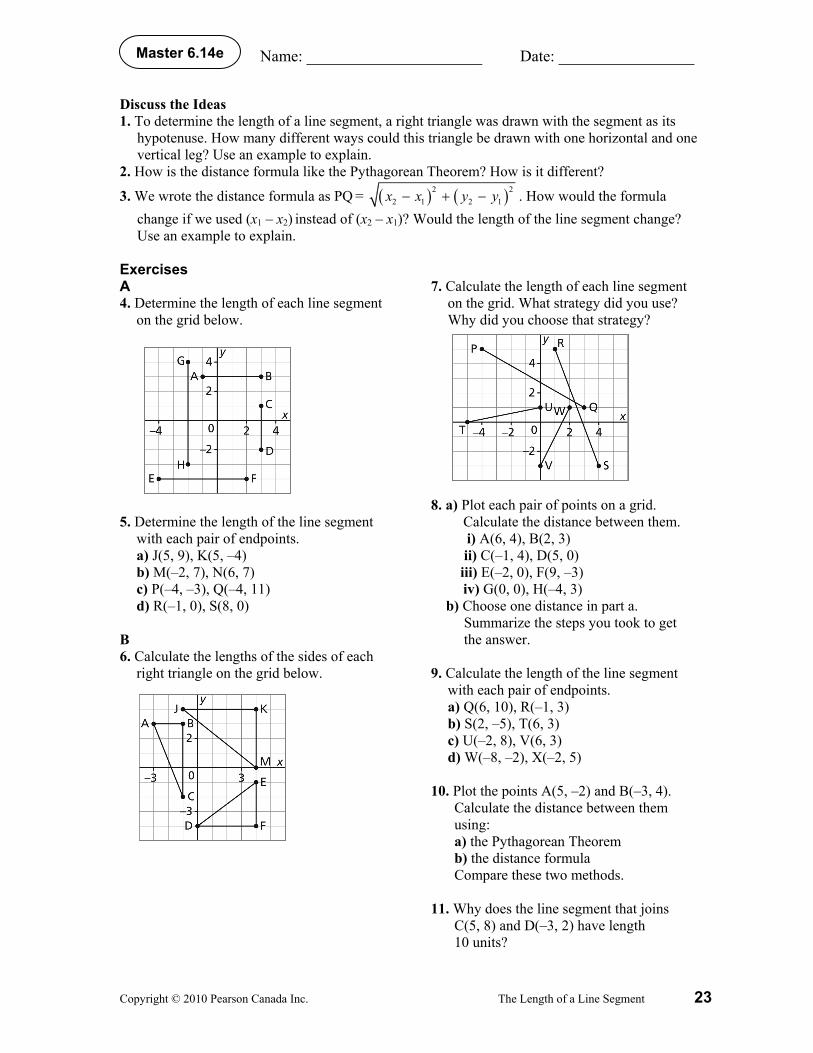
Discuss the Ideas 1. To determine the length of a line segment, a right triangle was drawn with the segment as its
hypotenuse. How many different ways could this triangle be drawn with one horizontal and one vertical leg? Use an example to explain.
2. How is the distance formula like the Pythagorean Theorem? How is it different?
3. We wrote the distance formula as PQ = ( ) ( )2 22 1 2 1− + −x x y y . How would the formula
change if we used (x1 – x2) instead of (x2 – x1)? Would the length of the line segment change? Use an example to explain.
Exercises A 4. Determine the length of each line segment
on the grid below. 5. Determine the length of the line segment
with each pair of endpoints. a) J(5, 9), K(5, –4) b) M(–2, 7), N(6, 7) c) P(–4, –3), Q(–4, 11) d) R(–1, 0), S(8, 0)
B 6. Calculate the lengths of the sides of each
right triangle on the grid below.
7. Calculate the length of each line segment
on the grid. What strategy did you use? Why did you choose that strategy?
8. a) Plot each pair of points on a grid.
Calculate the distance between them. i) A(6, 4), B(2, 3) ii) C(–1, 4), D(5, 0) iii) E(–2, 0), F(9, –3) iv) G(0, 0), H(–4, 3)
b) Choose one distance in part a. Summarize the steps you took to get the answer.
9. Calculate the length of the line segment
with each pair of endpoints. a) Q(6, 10), R(–1, 3) b) S(2, –5), T(6, 3) c) U(–2, 8), V(6, 3) d) W(–8, –2), X(–2, 5)
10. Plot the points A(5, –2) and B(–3, 4).
Calculate the distance between them using: a) the Pythagorean Theorem b) the distance formula Compare these two methods.
11. Why does the line segment that joins
C(5, 8) and D(–3, 2) have length 10 units?
Name: ______________________ Date: _________________
24 The Length of a Line Segment Copyright © 2010 Pearson Canada Inc.
Master 6.14f
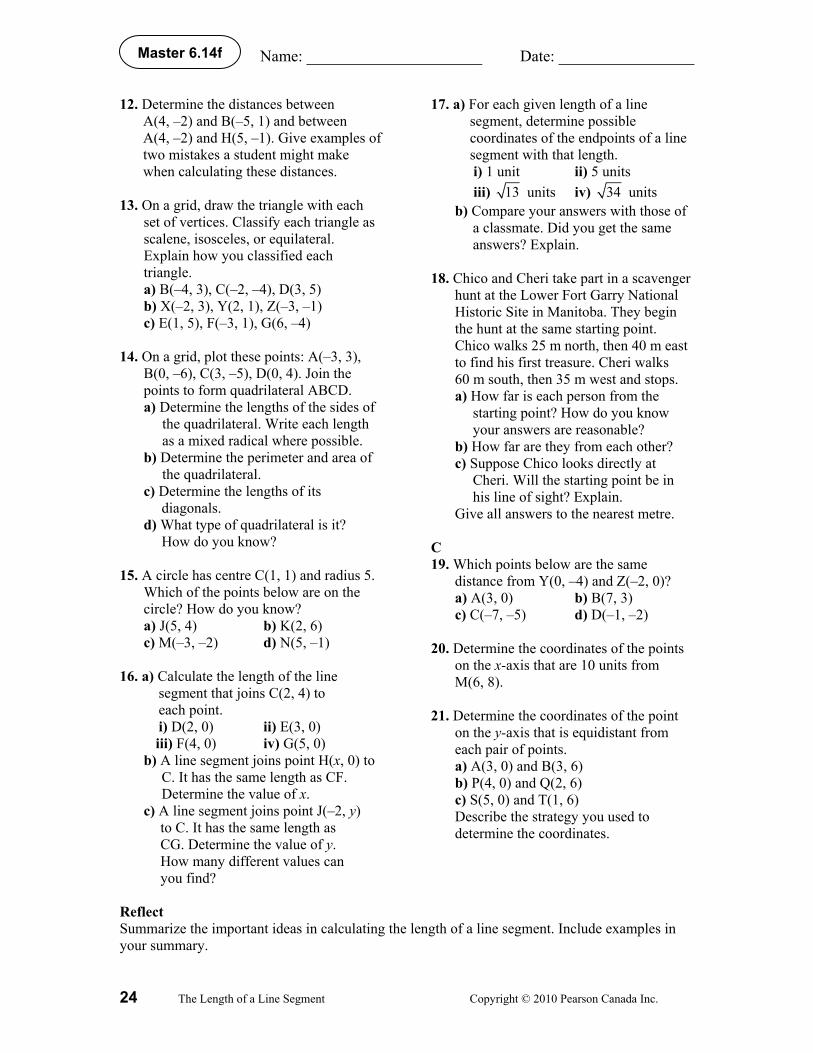
12. Determine the distances between A(4, –2) and B(–5, 1) and between A(4, –2) and H(5, –1). Give examples of two mistakes a student might make when calculating these distances.
13. On a grid, draw the triangle with each
set of vertices. Classify each triangle as scalene, isosceles, or equilateral. Explain how you classified each triangle. a) B(–4, 3), C(–2, –4), D(3, 5) b) X(–2, 3), Y(2, 1), Z(–3, –1) c) E(1, 5), F(–3, 1), G(6, –4)
14. On a grid, plot these points: A(–3, 3),
B(0, –6), C(3, –5), D(0, 4). Join the points to form quadrilateral ABCD. a) Determine the lengths of the sides of
the quadrilateral. Write each length as a mixed radical where possible.
b) Determine the perimeter and area of the quadrilateral.
c) Determine the lengths of its diagonals.
d) What type of quadrilateral is it? How do you know?
15. A circle has centre C(1, 1) and radius 5.
Which of the points below are on the circle? How do you know? a) J(5, 4) b) K(2, 6) c) M(–3, –2) d) N(5, –1)
16. a) Calculate the length of the line segment that joins C(2, 4) to each point. i) D(2, 0) ii) E(3, 0) iii) F(4, 0) iv) G(5, 0)
b) A line segment joins point H(x, 0) to C. It has the same length as CF. Determine the value of x.
c) A line segment joins point J(–2, y) to C. It has the same length as CG. Determine the value of y. How many different values can you find?
17. a) For each given length of a line segment, determine possible coordinates of the endpoints of a line segment with that length. i) 1 unit ii) 5 units iii) 13 units iv) 34 units
b) Compare your answers with those of a classmate. Did you get the same answers? Explain.
18. Chico and Cheri take part in a scavenger
hunt at the Lower Fort Garry National Historic Site in Manitoba. They begin the hunt at the same starting point. Chico walks 25 m north, then 40 m east to find his first treasure. Cheri walks 60 m south, then 35 m west and stops. a) How far is each person from the
starting point? How do you know your answers are reasonable?
b) How far are they from each other? c) Suppose Chico looks directly at
Cheri. Will the starting point be in his line of sight? Explain.
Give all answers to the nearest metre. C 19. Which points below are the same
distance from Y(0, –4) and Z(–2, 0)? a) A(3, 0) b) B(7, 3)
c) C(–7, –5) d) D(–1, –2) 20. Determine the coordinates of the points
on the x-axis that are 10 units from M(6, 8).
21. Determine the coordinates of the point
on the y-axis that is equidistant from each pair of points. a) A(3, 0) and B(3, 6) b) P(4, 0) and Q(2, 6) c) S(5, 0) and T(1, 6) Describe the strategy you used to determine the coordinates.
Reflect Summarize the important ideas in calculating the length of a line segment. Include examples in your summary.

Name: ______________________ Date: _________________
Copyright © 2010 Pearson Canada Inc. The Midpoint of a Line Segment 25
Master 6.15a
6.8 The Midpoint of a Line Segment Lesson Focus: Determine the midpoint of a line segment. Make Connections Vince thinks of a number from 1 to 100. Stephanie says she can guess his number in no more than 7 tries. With each guess, Vince either says “greater” or “less.” What strategy might Stephanie use? How many tries would it take to guess a number from 1 to 1000? Construct Understanding Try This Work with a partner. A. Determine the coordinates of the midpoint of PQ
and the midpoint of QR. What method did you use?
B. Determine the coordinates of the midpoint of PR.
Did you use the same method as you used in step A? If not, describe how you determined the coordinates of this midpoint.
C. Explain the steps you could use to determine
the midpoint of any line segment on a grid. Draw an oblique line segment on a grid. Use your strategy to determine the midpoint of the line segment.
We can count squares to determine the midpoint of a horizontal or vertical line segment on a grid when its endpoints are on lattice points. The length of CD is 5 units. One-half of 5 is 2.5. So, the midpoint of CD is 2.5 units to the right of C, or 2.5 units to the left of D. The midpoint of CD is M, with coordinates (0.5, –3).

Name: ______________________ Date: _________________
26 The Midpoint of a Line Segment Copyright © 2010 Pearson Canada Inc.
Master 6.15b
EXAMPLE 1 Determining the Midpoint of a Line Segment Determine the coordinates of the midpoint, M, of line segment AB. Solution Method 1 Place a Mira perpendicular to AB. Move the Mira until A coincides with B. Mark the point where the Mira intersects the line segment. Label the point M. This is the midpoint of segment AB. It appears to have coordinates (4, 3). Method 2 Draw a right ∆ABC for which AB is the hypotenuse. Determine the midpoint of AC. AC is 4 units long. One-half of 4 is 2. So, the midpoint of AC is 2 units down from A. Label the point D. It has coordinates (1, 3).
Determine the midpoint of BC. BC is 6 units long. One-half of 6 is 3. So, the midpoint of BC is 3 units to the left of B. Label the point E. It has coordinates (4, 1).
Draw the perpendicular to AC at D. Draw the perpendicular to BC at E. The perpendiculars meet at M, the midpoint of AB. The coordinates of M are (4, 3). So, the midpoint M of segment AC is M(4, 3). CHECK YOUR UNDERSTANDING Determine the coordinates of the midpoint, M, of line segment CD. [Answer: M(3, 4)]

Name: ______________________ Date: _________________
Copyright © 2010 Pearson Canada Inc. The Midpoint of a Line Segment 27
Master 6.15c
The strategy in Method 2 of Example 1 can be used to develop a formula for the midpoint of a line segment on a grid. In the diagram above, A has coordinates (1, 5) and B has coordinates (7, 1). The coordinates of M are the means of the coordinates of A and B.
x-coordinate of M = 1 7
2
+
= 4
y-coordinate of M = 5 1
2
+
= 3 The coordinates of M are (4, 3). Midpoint Formula When M is the midpoint of a line segment with endpoints P(x1, y1) and Q(x2, y2),
the coordinates of M are: 1 2 1 2,2 2+ +⎛ ⎞
⎜ ⎟⎝ ⎠
x x y y
EXAMPLE 2 Solving a Problem Using the Midpoint of a Line Segment An engineer has to design a highway so that it is the same distance from Port Whitby, located at P(6826, 2014), and Comet, located at C(6792, 1996). Determine the coordinates of one point on the highway. Solution One point on the highway is the midpoint, M, of the line segment PC. Use the formula.
x-coordinate of M = 1 2
2+x x
= 6826 6792
2
+
= 13 6182
= 6809
y-coordinate of M = 1 2
2+y y
= 2014 1996
2
+
= 4010
2
= 2005 The coordinates of M are (6809, 2005). One point on the highway has coordinates (6809, 2005). CHECK YOUR UNDERSTANDING An engineer has to design a highway so that it is the same distance from Red Soil, located at R(5312, 4308), and White Springs, located at W(5368, 4344). Determine the coordinates of one point on the highway. [Answer: (5340, 4326)]
The mean of 2 numbers is the sum of the numbers
divided by 2.
Why did we use the formula and not draw a graph?
Substitute: x1 = 6826 and x2 = 6792
Substitute: y1 = 2014 and y2 = 1996

Name: ______________________ Date: _________________
28 The Midpoint of a Line Segment Copyright © 2010 Pearson Canada Inc.
Master 6.15d
EXAMPLE 3 Determining an Endpoint of a Line Segment Given the Other Endpoint and the Midpoint Point J(–3, 4) is one endpoint of line segment JK. Point M(2, 1) is its midpoint. Determine the coordinates of the other endpoint, K. Solution Method 1 Plot J and M on a grid. Join the points. Count squares. To get from J to M, move 3 units down and 5 units right. Since M is the midpoint of JK, to get from M to K, move 3 units down and 5 units right. Plot point K. Join K and M. K has coordinates (7, –2). Method 2 Let the endpoint K have coordinates (x2, y2). One endpoint is J(–3, 4). The midpoint is M(2, 1). Use the midpoint formula to determine the coordinates of K.
The x-coordinate of M is:
2 = 1 2
2+x x Substitute: x1 = –3
2 = 232
x− + Multiply each side by 2.
2(2) = 232
2 x− +⎛ ⎞⎜ ⎟⎝ ⎠
4 = –3 + x2 Add 3 to both sides to isolate x2. 3 + 4 = –3 + 3 + x2
x2 = 7 The y-coordinate of M is:
1 = 1 2
2+y y Substitute: y1 = 4
1 = 242+ y Multiply each side by 2.
2(1) = 242
2 +⎛ ⎞⎜ ⎟⎝ ⎠
y
2 = 4 + y2 Subtract 4 from both sides to isolate y2. 2 – 4 = 4 – 4 + y2
y2 = –2 The coordinates of K are (7, –2). CHECK YOUR UNDERSTANDING Point P(–1, 5) is one endpoint of line segment PQ. Point M(3, 2) is its midpoint. Determine the coordinates of the other endpoint, Q. [Answer: Q(7, –1)]
Name: ______________________ Date: _________________
Copyright © 2010 Pearson Canada Inc. The Midpoint of a Line Segment 29
Master 6.15e
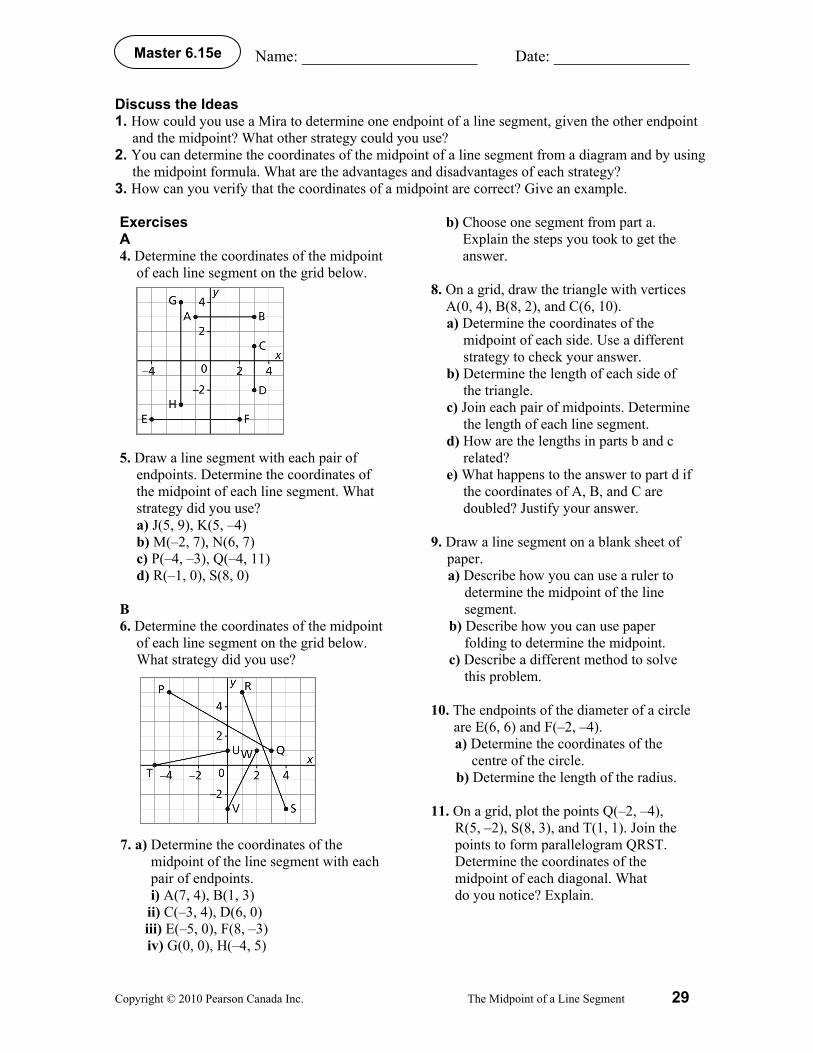
Discuss the Ideas 1. How could you use a Mira to determine one endpoint of a line segment, given the other endpoint
and the midpoint? What other strategy could you use? 2. You can determine the coordinates of the midpoint of a line segment from a diagram and by using
the midpoint formula. What are the advantages and disadvantages of each strategy? 3. How can you verify that the coordinates of a midpoint are correct? Give an example. Exercises A 4. Determine the coordinates of the midpoint
of each line segment on the grid below. 5. Draw a line segment with each pair of
endpoints. Determine the coordinates of the midpoint of each line segment. What strategy did you use? a) J(5, 9), K(5, –4) b) M(–2, 7), N(6, 7) c) P(–4, –3), Q(–4, 11) d) R(–1, 0), S(8, 0)
B 6. Determine the coordinates of the midpoint
of each line segment on the grid below. What strategy did you use?
7. a) Determine the coordinates of the
midpoint of the line segment with each pair of endpoints. i) A(7, 4), B(1, 3) ii) C(–3, 4), D(6, 0) iii) E(–5, 0), F(8, –3) iv) G(0, 0), H(–4, 5)
b) Choose one segment from part a. Explain the steps you took to get the answer.
8. On a grid, draw the triangle with vertices
A(0, 4), B(8, 2), and C(6, 10). a) Determine the coordinates of the
midpoint of each side. Use a different strategy to check your answer.
b) Determine the length of each side of the triangle.
c) Join each pair of midpoints. Determine the length of each line segment.
d) How are the lengths in parts b and c related?
e) What happens to the answer to part d if the coordinates of A, B, and C are doubled? Justify your answer.
9. Draw a line segment on a blank sheet of
paper. a) Describe how you can use a ruler to
determine the midpoint of the line segment.
b) Describe how you can use paper folding to determine the midpoint.
c) Describe a different method to solve this problem.
10. The endpoints of the diameter of a circle
are E(6, 6) and F(–2, –4). a) Determine the coordinates of the
centre of the circle. b) Determine the length of the radius.
11. On a grid, plot the points Q(–2, –4),
R(5, –2), S(8, 3), and T(1, 1). Join the points to form parallelogram QRST. Determine the coordinates of the midpoint of each diagonal. What do you notice? Explain.

Name: ______________________ Date: _________________
30 The Midpoint of a Line Segment Copyright © 2010 Pearson Canada Inc.
Master 6.15f
12. On a grid, plot the points D(–2, 4), E(3, 0), F(1, –3), and G(–5, 1). Join the points to form quadrilateral DEFG. Determine the coordinates of the midpoint of each diagonal. Is DEFG a parallelogram? How do you know?
13. a) Each point Q is one endpoint and M the midpoint of a line segment. Determine the coordinates of the other endpoint of each segment. i) Q(8, –1), M(5, –5)
ii) Q(–5, 2), M(0, 5) iii) Q(–6, –4), M(–3, –2)
b) Explain the steps you took to get the answer to part i.
14. How could you use a rotation to
determine the coordinates of the other endpoints in question 13a?
15. The numerical coordinates of a map are
in kilometres. The town of Saddleville is at (3.5, 6.9) and Pedal Place is at (10.7, 4.1). A bicycle path is to be built in a straight line joining the two towns. Each town is responsible for the construction of the path to the midpoint. The cost of construction is $47 000 per kilometre. a) Determine the coordinates of the
midpoint of the bicycle path. b) Determine the cost of the construction
for Saddleville, to the nearest dollar. c) What is the total cost of the bicycle
path, to the nearest dollar? Think of another way you could solve this problem.
16. Many people say that Red Deer is half-way between Edmonton and Calgary. When a coordinate grid is superimposed on a map, the coordinates for the cities are: Edmonton (4887, 7824), Calgary (5438, 7811), and Red Deer (5168, 7820). Is Red Deer really half-way between Edmonton and Calgary? Justify your answer.
17. Mia and an old school friend decide to meet at a location midway between their homes. Mia used a website to find the midpoint of the direct line between their two addresses. The numerical coordinates of the map are in kilometres. Mia’s home is at (2.2, 17.9) and her friend’s home is at (11.3, 1.4). The computer suggested they meet at (7.8, 10.7). Is this location midway between their homes? If yes, how far does each person have to travel? If not, what are the coordinates of the point midway between their homes?
18. A line segment has endpoints A(–2, –6)
and B(8, 4). Determine the coordinates of the 3 points that divide AB into 4 equal parts. Describe the strategy you used.
C 19. A line segment has endpoints E(x1, y1)
and F(x2, y2). Determine expressions for the coordinates of the points that divide EF into 4 equal parts.
20. A line segment has endpoints S(4, 8) and
T(–2, –1). Determine the coordinates of the points that divide ST into 3 equal parts. Explain the steps you used.
21. A line segment has endpoints C(x1, y1)
and D(x2, y2). Determine expressions for the coordinates of the points that divide CD into 3 equal parts.
22. A square has vertices S(3, 1), T(10, 4),
U(7, 11), and V(0, 8). a) Calculate the mean of the
x-coordinates and the mean of the y-coordinates of the vertices.
b) Use the results of part a as the coordinates of a point W. How is point W related to the square? Why do you think this result occurs?
Reflect Describe different methods you can use to determine the midpoint of a line segment.

Name: ______________________ Date: _________________
Copyright © 2010 Pearson Canada Inc. Math Lab: Scatterplots and Lines of Best Fit 31
Master 6.16a
6.9 Math Lab: Scatterplots and Lines of Best Fit Lesson Focus: Draw the line of best fit for a set of data. Make Connections This graph shows the costs of different masses of McIntosh apples at St. Norbert Farmers’ Market in Winnipeg. The points lie on a straight line. How could we use the graph to determine: • the cost of 2.5 kg of apples? • the cost of 3.5 kg of apples? Are these costs approximate or exact? Construct Understanding Try This Work in a group of 4. You will need a tape measure or a metre stick, and grid paper. A. Measure and record your arm spans with your arms stretched out as much as possible.
Measure and record your heights. Combine your data with those of another group. Record the data in a table.
B. Plot the data on a grid. Represent Arm span on the horizontal axis and
Height on the vertical axis. Describe any trends in the data. What appears to be the relationship between arm span and height?
C. Place a ruler so that it passes as close as possible to all the plotted points (use a transparent
ruler, if possible). Draw a straight line along the ruler. D. Use the line you drew.
• Predict the height of someone whose arm span is 1.4 m. • Predict the arm span of someone whose height is 1.8 m.
Student’s name Arm span (cm) Height (cm)
Suppose you had graphed heights horizontally and arm spans vertically. How would your graph change? Would this affect your predictions?
Name: ______________________ Date: _________________
32 Math Lab: Scatterplots and Lines of Best Fit Copyright © 2010 Pearson Canada Inc.
Master 6.16b
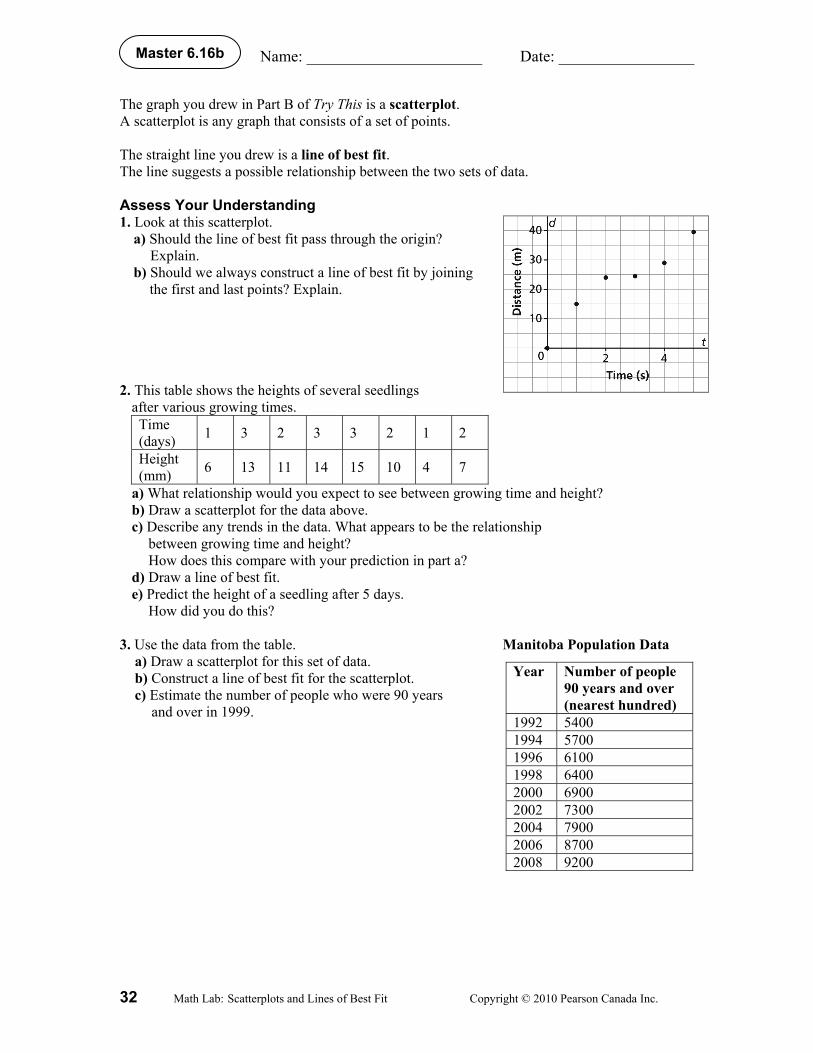
The graph you drew in Part B of Try This is a scatterplot. A scatterplot is any graph that consists of a set of points. The straight line you drew is a line of best fit. The line suggests a possible relationship between the two sets of data. Assess Your Understanding 1. Look at this scatterplot.
a) Should the line of best fit pass through the origin? Explain.
b) Should we always construct a line of best fit by joining the first and last points? Explain.
2. This table shows the heights of several seedlings
after various growing times. Time (days) 1 3 2 3 3 2 1 2
Height (mm) 6 13 11 14 15 10 4 7
a) What relationship would you expect to see between growing time and height? b) Draw a scatterplot for the data above. c) Describe any trends in the data. What appears to be the relationship
between growing time and height? How does this compare with your prediction in part a?
d) Draw a line of best fit. e) Predict the height of a seedling after 5 days.
How did you do this? 3. Use the data from the table. Manitoba Population Data a) Draw a scatterplot for this set of data.
b) Construct a line of best fit for the scatterplot. c) Estimate the number of people who were 90 years
and over in 1999.
Year Number of people 90 years and over (nearest hundred)
1992 5400 1994 5700 1996 6100 1998 6400 2000 6900 2002 7300 2004 7900 2006 8700 2008 9200

Name: ______________________ Date: _________________
Copyright © 2010 Pearson Canada Inc. Math Lab: Equation of the Line of Best Fit 33
Master 6.17a
6.10 Math Lab: Equation of the Line of Best Fit Lesson Focus: Determine the equation of the line of best fit for a scatterplot. Make Connections Winnipeg is studying the idea of bringing a car-sharing co-operative to the city. Car sharing has been successful in Vancouver since 1997. This graph shows the annual rates for a member on an occasional driver’s plan in Vancouver, where the annual membership fee, including the application fee, is $80. Determine the slope and C-intercept of the graph. What do they represent? Write an equation to describe the graph. Construct Understanding Try This Work with a partner. You will need a graphing calculator. In the 2006 Turin Winter Olympics, Cindy Klassen of Winnipeg, Manitoba became the first Canadian to win five medals in one Olympic Games. IOC President Jacques Rogge called her the “woman of the games.” This table shows the winning times for the women’s 1500-m speed skating event since 1976. Year Gold Medalist Time (s) 1976 Galina Stepanskaya, URS 136.58 1980 Annie Borckink, NED 130.95 1984 Karin Enke, GDR 123.42 1988 Yvonne van Gennip, NED 120.68 1992 Jacqueline Börner, GER 125.87 1994 Emese Hunyady, AUT 122.19 1998 Marianne Timmer, NED 117.58 2002 Anna Friesinger, GER 114.02 2006 Cindy Klassen, CAN 115.30
Name: ______________________ Date: _________________
34 Math Lab: Equation of the Line of Best Fit Copyright © 2010 Pearson Canada Inc.
Master 6.17b
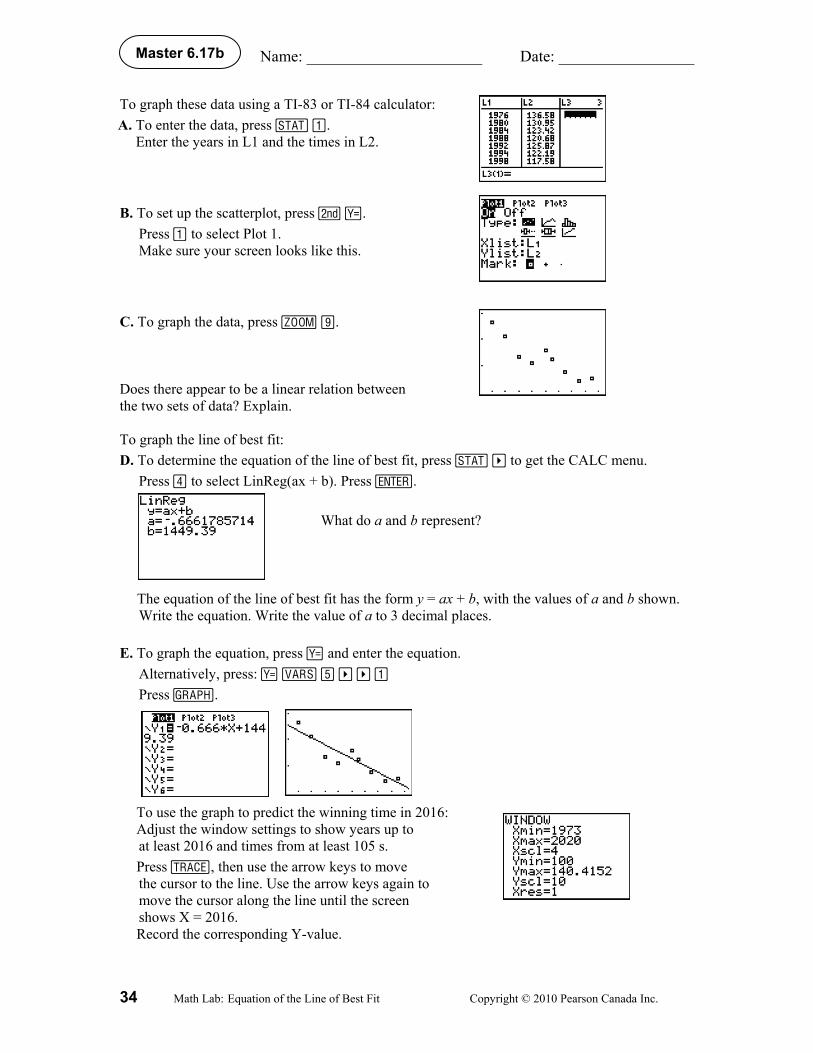
To graph these data using a TI-83 or TI-84 calculator: A. To enter the data, press … À.
Enter the years in L1 and the times in L2. B. To set up the scatterplot, press y o.
Press À to select Plot 1. Make sure your screen looks like this.
C. To graph the data, press q ®. Does there appear to be a linear relation between the two sets of data? Explain. To graph the line of best fit: D. To determine the equation of the line of best fit, press … ~ to get the CALC menu.
Press ¶ to select LinReg(ax + b). Press Í.
The equation of the line of best fit has the form y = ax + b, with the values of a and b shown. Write the equation. Write the value of a to 3 decimal places.
E. To graph the equation, press o and enter the equation.
Alternatively, press: o · ~ ~ À Press s.
To use the graph to predict the winning time in 2016: Adjust the window settings to show years up to at least 2016 and times from at least 105 s. Press r, then use the arrow keys to move the cursor to the line. Use the arrow keys again to move the cursor along the line until the screen shows X = 2016. Record the corresponding Y-value.
What do a and b represent?
Name: ______________________ Date: _________________
Copyright © 2010 Pearson Canada Inc. Math Lab: Equation of the Line of Best Fit 35
Master 6.17c
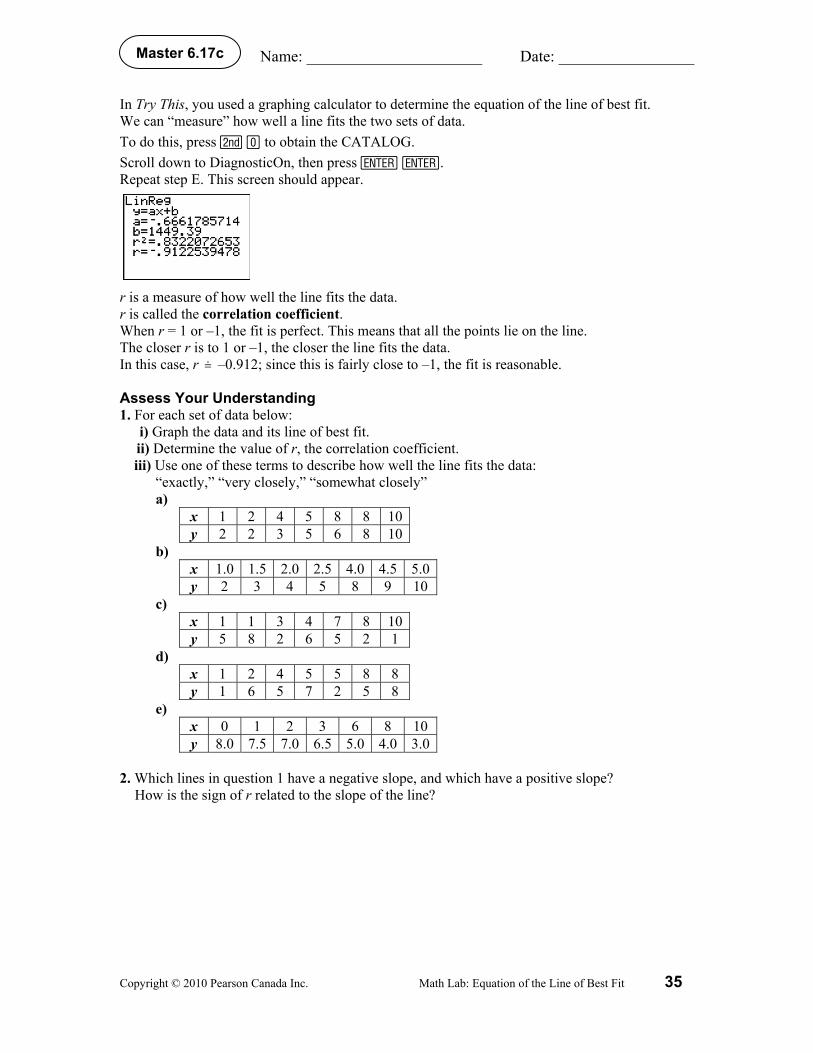
In Try This, you used a graphing calculator to determine the equation of the line of best fit. We can “measure” how well a line fits the two sets of data. To do this, press y Ê to obtain the CATALOG. Scroll down to DiagnosticOn, then press Í Í. Repeat step E. This screen should appear. r is a measure of how well the line fits the data. r is called the correlation coefficient. When r = 1 or –1, the fit is perfect. This means that all the points lie on the line. The closer r is to 1 or –1, the closer the line fits the data. In this case, r –0.912; since this is fairly close to –1, the fit is reasonable. Assess Your Understanding 1. For each set of data below:
i) Graph the data and its line of best fit. ii) Determine the value of r, the correlation coefficient. iii) Use one of these terms to describe how well the line fits the data:
“exactly,” “very closely,” “somewhat closely” a)
x 1 2 4 5 8 8 10y 2 2 3 5 6 8 10
b) x 1.0 1.5 2.0 2.5 4.0 4.5 5.0y 2 3 4 5 8 9 10
c) x 1 1 3 4 7 8 10y 5 8 2 6 5 2 1
d) x 1 2 4 5 5 8 8 y 1 6 5 7 2 5 8
e) x 0 1 2 3 6 8 10 y 8.0 7.5 7.0 6.5 5.0 4.0 3.0
2. Which lines in question 1 have a negative slope, and which have a positive slope?
How is the sign of r related to the slope of the line?
Name: ______________________ Date: _________________
36 Math Lab: Equation of the Line of Best Fit Copyright © 2010 Pearson Canada Inc.
Master 6.17d
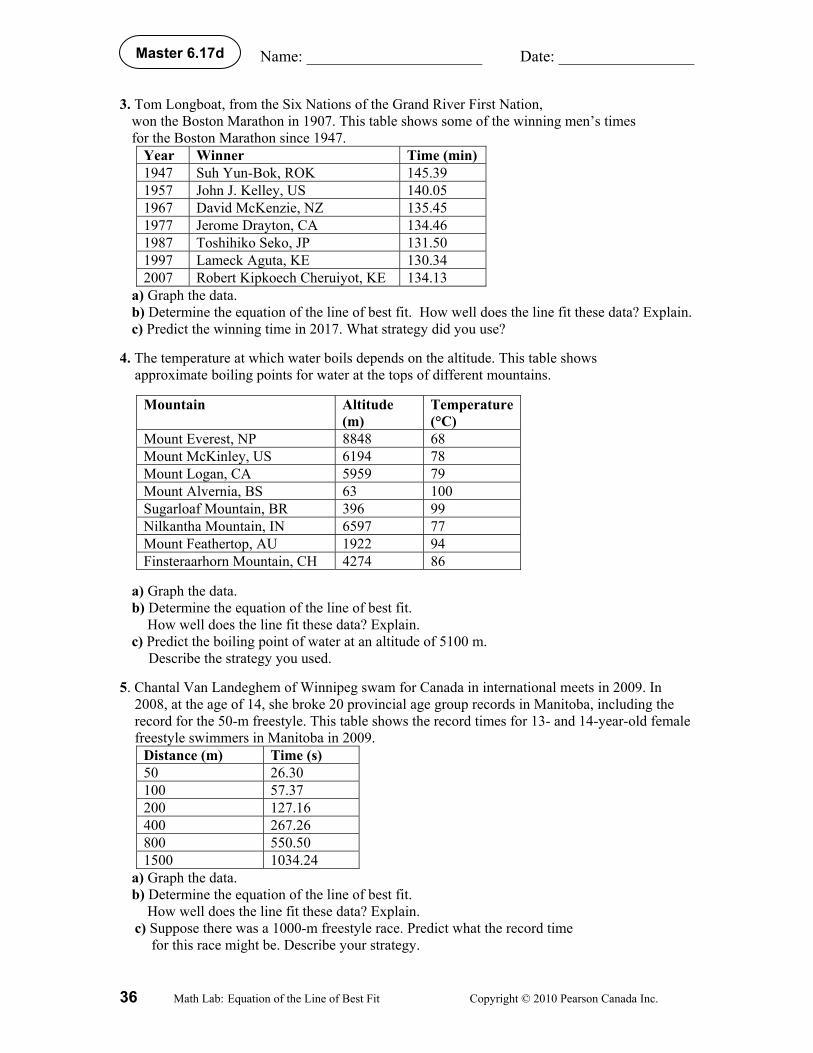
3. Tom Longboat, from the Six Nations of the Grand River First Nation, won the Boston Marathon in 1907. This table shows some of the winning men’s times for the Boston Marathon since 1947.
Year Winner Time (min) 1947 Suh Yun-Bok, ROK 145.39 1957 John J. Kelley, US 140.05 1967 David McKenzie, NZ 135.45 1977 Jerome Drayton, CA 134.46 1987 Toshihiko Seko, JP 131.50 1997 Lameck Aguta, KE 130.34 2007 Robert Kipkoech Cheruiyot, KE 134.13
a) Graph the data. b) Determine the equation of the line of best fit. How well does the line fit these data? Explain. c) Predict the winning time in 2017. What strategy did you use?
4. The temperature at which water boils depends on the altitude. This table shows
approximate boiling points for water at the tops of different mountains.
Mountain Altitude (m)
Temperature (°C)
Mount Everest, NP 8848 68 Mount McKinley, US 6194 78 Mount Logan, CA 5959 79 Mount Alvernia, BS 63 100 Sugarloaf Mountain, BR 396 99 Nilkantha Mountain, IN 6597 77 Mount Feathertop, AU 1922 94 Finsteraarhorn Mountain, CH 4274 86
a) Graph the data. b) Determine the equation of the line of best fit. How well does the line fit these data? Explain. c) Predict the boiling point of water at an altitude of 5100 m.
Describe the strategy you used. 5. Chantal Van Landeghem of Winnipeg swam for Canada in international meets in 2009. In
2008, at the age of 14, she broke 20 provincial age group records in Manitoba, including the record for the 50-m freestyle. This table shows the record times for 13- and 14-year-old female freestyle swimmers in Manitoba in 2009.
Distance (m) Time (s) 50 26.30 100 57.37 200 127.16 400 267.26 800 550.50 1500 1034.24
a) Graph the data. b) Determine the equation of the line of best fit.
How well does the line fit these data? Explain. c) Suppose there was a 1000-m freestyle race. Predict what the record time
for this race might be. Describe your strategy.

Name: ______________________ Date: _________________
Copyright © 2010 Pearson Canada Inc. TI-Nspire Instructions 37
Master 6.18a
TI-Nspire Instructions for Try This Lesson 6.10 To graph these data: A. Press c, then select 3: Lists and Spreadsheets to insert
a Lists and Spreadsheets page. Enter the years in column A and the times in column B. Enter year and time as headings.
B. To set up the scatterplot, press c, then select 5: Data and Statistics
to add a Data and Statistics page. Move the cursor to the bottom of the screen. When a box appears, click and select year, then press ·. Move the cursor to the left of the screen. When a box appears, click and select time, then press ·.
Is there a linear relation between the two sets of data? Explain. To graph the line of best fit: C. Press b, then select 4: Analyze > 6: Regression >
1: Show Linear (mx + b), then press ·. The line of best fit and its equation appears
on the scatterplot.
Use the equation or the graph. Predict the winning time in 2016. If you use the graph, adjust the window settings: Press b, then select 5: Window/Zoom > 1: Window Settings. Adjust the settings to show Xmax as 2016 and Ymin as 105. Press ·. To trace along the graph, press b, then select 4: Analyze > A: Graph Trace. Press ·. Move the cursor along the line until the first coordinate of a point is 2016. If the cursor does not show 2016, choose values of time on either side of 2016, then calculate the mean of these times.
Name: ______________________ Date: _________________
38 TI-Nspire Instructions Copyright © 2010 Pearson Canada Inc.
Master 6.18b
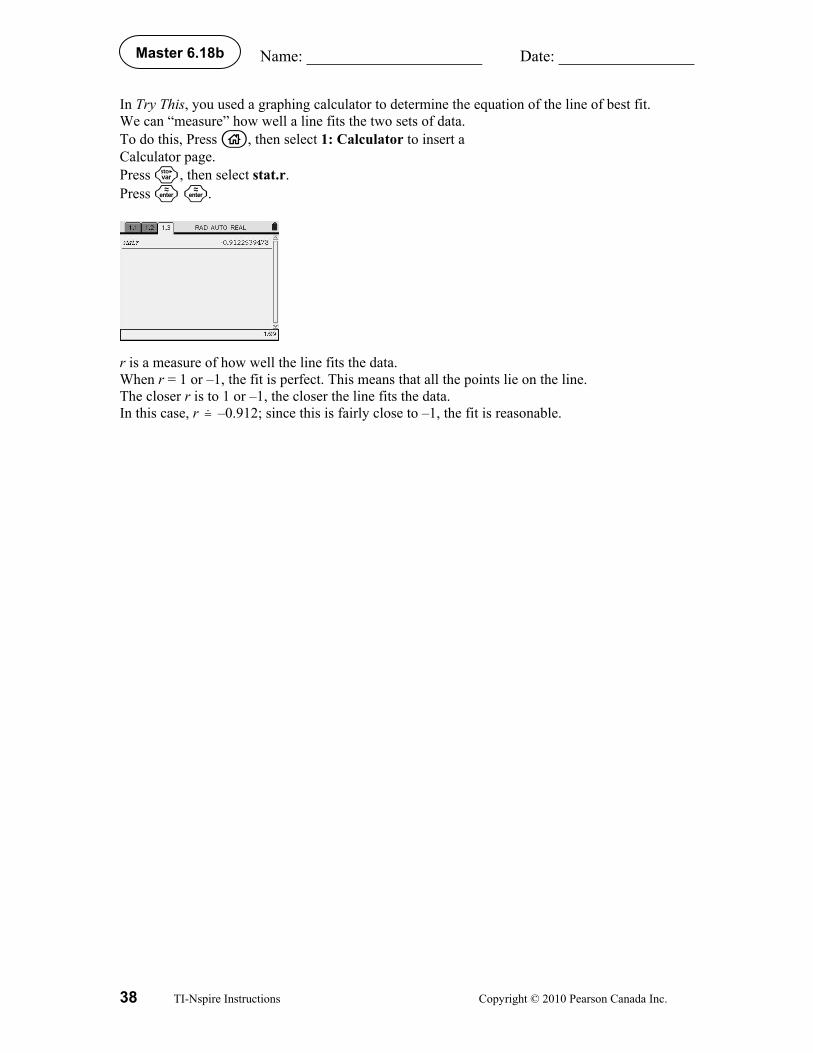
In Try This, you used a graphing calculator to determine the equation of the line of best fit. We can “measure” how well a line fits the two sets of data. To do this, Press c, then select 1: Calculator to insert a Calculator page. Press h, then select stat.r. Press · ·. r is a measure of how well the line fits the data. When r = 1 or –1, the fit is perfect. This means that all the points lie on the line. The closer r is to 1 or –1, the closer the line fits the data. In this case, r –0.912; since this is fairly close to –1, the fit is reasonable.

Name: ______________________ Date: _________________
Master 6.19a 39 Copyright © 2010 Pearson Canada Inc.
Master 6.19a
Answers for Masters 6.14 to 6.17 Master 6.14, for Manitoba Lesson 6.7 4. AB: 4 units; CD: 3 units; EF: 6 units; GH: 7 units 5. a) 13 units b) 8 units c) 14 units d) 9 units 6. AB: 2 units; BC: 5 units; AC: 29 units
JK: 5 units; KM: 4 units; JM: 41 units DE: 5 units; EF: 3 units; DF: 4 units
7. PQ: 65 units; RS: 73 units; TU: 26 units; VW: 20 units For example, I used the Pythagorean Theorem because I could count squares.
8. a) i) 17 units ii) 52 units iii) 130 units iv) 5 units b) Answers may vary.
9. a) 98 units b) 80 units c) 89 units d) 85 units 10. a) 10 units b) 10 units
I got the same answer using both methods. To use the Pythagorean Theorem, I counted squares. To use the distance formula, I subtracted the coordinates.
11. The line segment has length 10 units because the horizontal distance between the points is
8 units, the vertical distance is 6 units, and 2 28 6 = 100 , or 10.
12. AB: 90 units; AH: 2 units A student might add the coordinates instead of subtracting them:
AB = 2 24 ( 5) 2 1
= 2 21 1
= 2 A student might think AB and AH have the same length because the coordinates of B and H are opposite integers.
13. a) BC: 53 units; CD: 106 units; BD: 53 units ∆BCD is isosceles because it has 2 equal sides.
b) XY: 20 units; YZ: 29 units; XZ: 17 units ∆XYZ is scalene because no sides are equal.
c) EF: 32 units; FG: 106 units; EG: 106 units ∆EFG is isosceles because it has 2 equal sides.
14. a) AB: 3 10 units; BC: 10 units; CD: 3 10 units; AD: 10 units b) 8 10 units; 30 units2
c) 10 units; 10 units d) Rectangle; opposite sides are equal and the diagonals are equal.
15. J(5, 4) and M(–3, –2) are both on the circle because the distance from each of these points to the centre of the circle is 5 units.
16. a) i) 4 units ii) 17 units iii) 20 units iv) 5 units b) x = 0 c) y = 1 or y = 7

Name: ______________________ Date: _________________
40 Master 6.19b Copyright © 2010 Pearson Canada Inc.
Master 6.19b
Answers continued 17. Answers may vary. For example:
a) i) (1, 0), (1, 1) ii) (0, 5), (0, 0) iii) (0, 0), (2, 3) iv) (5, 4), (0, 1) b) No, there are many different line segments with each length. 18. a) Chico: approximately 47 m; Cheri: approximately 69 m; for each person, the distance I
calculated is greater than the two distances given, but less than their sum. b) Approximately 113 m c) No, 47 m + 69 m 113 m
19. a, c, d 20. (0, 0) and (12, 0) 21. a) (0, 3) b) (0, 2) c) (0, 1)
Master 6.15, for Manitoba Lesson 6.8 4. AB: (1, 3); CD: (3, –0.5); EF: (–1, –4); GH: (–2, 0.5) 5. a) (5, 2.5) b) (2, 7) c) (–4, 4) d) (3.5, 0)
For example, because the lines are horizontal or vertical, I counted squares to determine the midpoints.
6. PQ: (–0.5, 3); RS: (2.5, 1); TU: (–2.5, 0.5); VW: (1, –1) For example, I used a Mira to find the midpoints.
7. a) i) (4, 3.5) ii) (1.5, 2) iii) (1.5, –1.5) iv) (–2, 2.5) b) Answers may vary.
8. a) AB: (4, 3); BC: (7, 6); AC: (3, 7) b) AB: 68 units; BC: 68 units; AC: 72 units c) 17 units; 17 units; 18 units d) The radicands of the lengths in part b are 4 times the radicands in part c. So, the lengths
in part b are 4 = 2 times as long as the lengths in part c. e) The lengths of the sides of the triangle and the lengths of the line segments joining the
midpoints are double their original lengths. But, the lengths in part b are still twice as long as the lengths in part c.
9. a) I could measure the segment with a ruler, divide its length in half, then mark this length on the line segment.
b) I could fold the paper so that one end of the segment coincides with the other end, then mark the point where the crease intersects the segment.
c) I could place a Mira on the segment so that one end of the segment coincides with the other end, then mark the point where the Mira intersects the line segment.
10. a) (2, 1) b) 41 units 11. QS: (3, –0.5); RT: (3, –0.5)
The diagonals have the same midpoints. 12. DF: (–0.5, 0.5); EG: (–1, 0.5)
DEFG is not a parallelogram because the midpoints of the diagonals are different. 13. a) i) (2, –9) ii) (5, 8) iii) (0, 0)
b) Answers may vary. 14. I could trace each line segment, then rotate point Q 180° about point M to locate the other
endpoint.
Name: ______________________ Date: _________________
Master 6.19c 41 Copyright © 2010 Pearson Canada Inc.
Master 6.19c
Answers continued 15. a) (7.1, 5.5) b) $181 544 c) $363 088
I could determine the length of the bicycle path and its total cost of construction, then divide the cost by 2 to get the cost for Saddleville.
16. Red Deer is very close to half-way between Edmonton and Calgary. The coordinates of the point halfway between the two cities are (5162.5, 7817.5).
17. No; (6.75, 9.65) 18. (0.5, –3.5), (3, –1), (5.5, 1.5)
First I found the midpoint, M, of AB. Then, I found the midpoints of AM and BM.
19. 1 2 1 23 3,
4 4
x x y y , 1 2 1 2,2 2
x x y y , 1 2 1 23 3,
4 4
x x y y
20. (2, 5), (0, 2)
21. 1 2 1 22 2,
3 3
x x y y , 2 1 2 12 2,
3 3
x x y y
22. a) 5; 6 b) W(5, 6) is the centre of the square.
Master 6.16, for Manitoba Lesson 6.9 1. a) No; a line that is as close as possible to all the plotted points does not pass through
the origin. b) No, by joining the first and last points, all other points may not be as close as possible
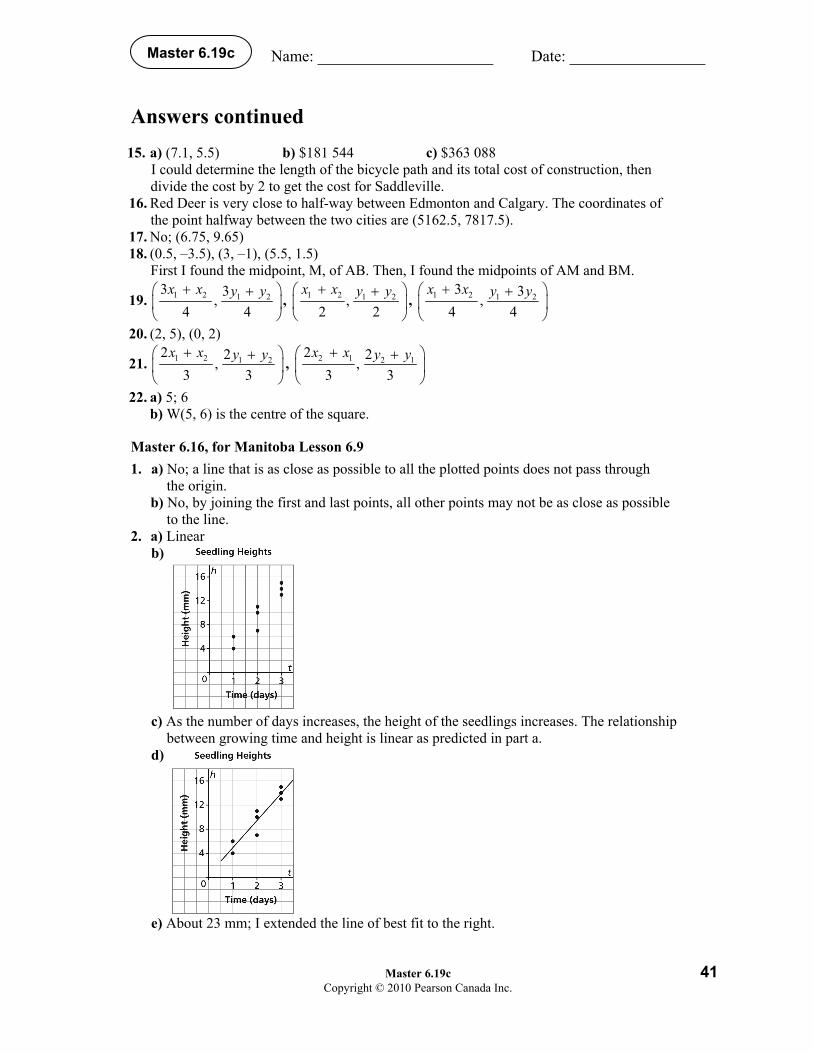
to the line. 2. a) Linear
b) c) As the number of days increases, the height of the seedlings increases. The relationship
between growing time and height is linear as predicted in part a. d) e) About 23 mm; I extended the line of best fit to the right.
Name: ______________________ Date: _________________
42 Master 6.19d Copyright © 2010 Pearson Canada Inc.
Master 6.19d
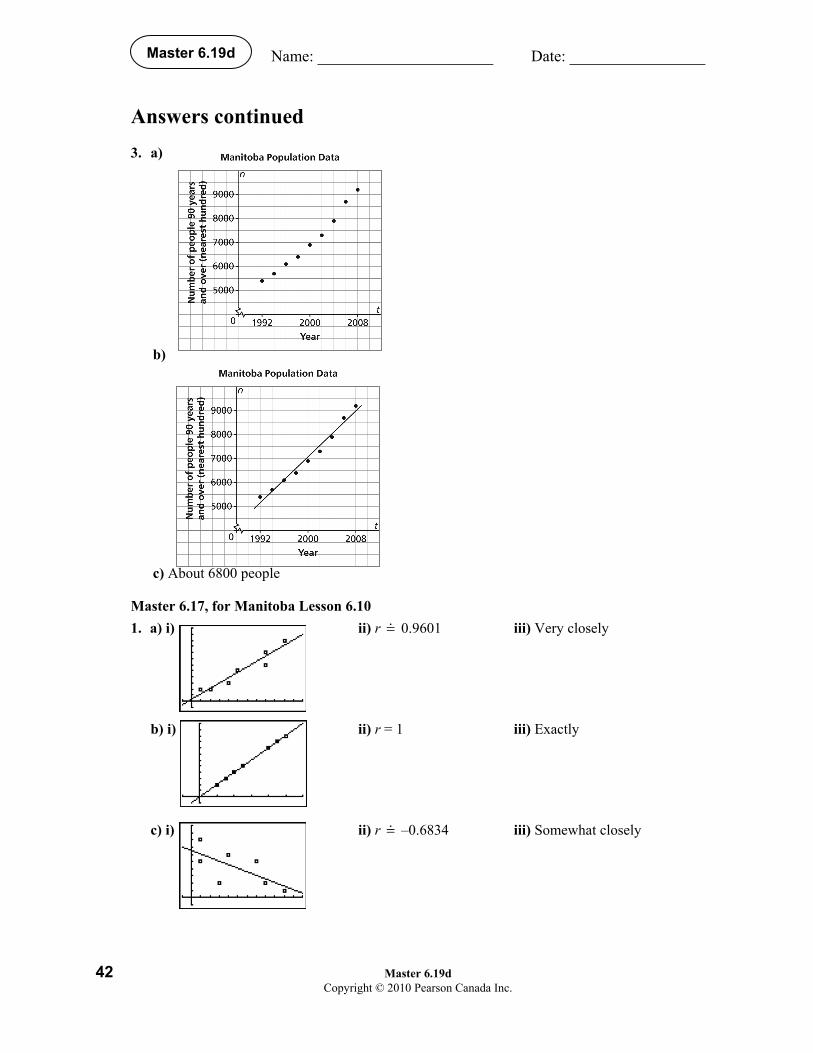
Answers continued 3. a)
b) c) About 6800 people
Master 6.17, for Manitoba Lesson 6.10 1. a) i) ii) r 0.9601 iii) Very closely
b) i) ii) r = 1 iii) Exactly c) i) ii) r –0.6834 iii) Somewhat closely
Name: ______________________ Date: _________________
Master 6.19e 43 Copyright © 2010 Pearson Canada Inc.
Master 6.19e
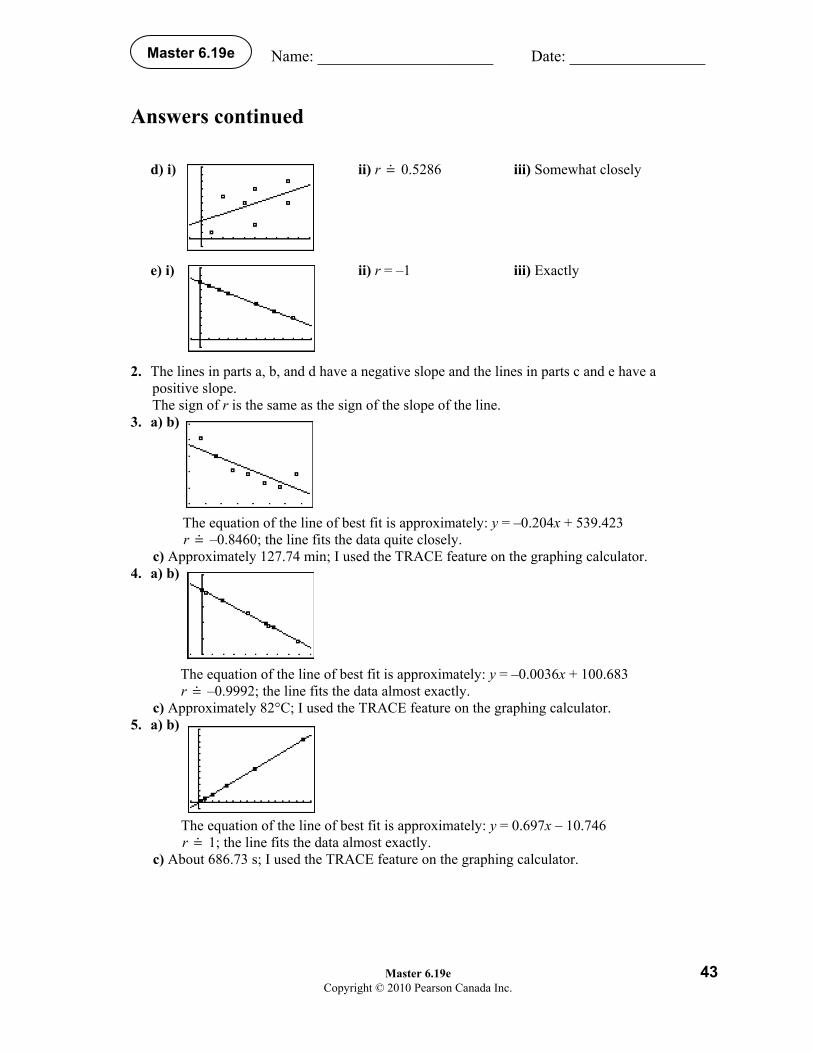
Answers continued d) i) ii) r 0.5286 iii) Somewhat closely e) i) ii) r = –1 iii) Exactly
2. The lines in parts a, b, and d have a negative slope and the lines in parts c and e have a
positive slope. The sign of r is the same as the sign of the slope of the line.
3. a) b)
The equation of the line of best fit is approximately: y = –0.204x + 539.423 r –0.8460; the line fits the data quite closely.
c) Approximately 127.74 min; I used the TRACE feature on the graphing calculator. 4. a) b)
The equation of the line of best fit is approximately: y = –0.0036x + 100.683 r –0.9992; the line fits the data almost exactly.
c) Approximately 82°C; I used the TRACE feature on the graphing calculator. 5. a) b)
The equation of the line of best fit is approximately: y = 0.697x – 10.746 r 1; the line fits the data almost exactly.
c) About 686.73 s; I used the TRACE feature on the graphing calculator.
Lesson 6.7 Check Your Understanding
44 Master 6.20a Copyright © 2010 Pearson Canada Inc.
Master 6.20a
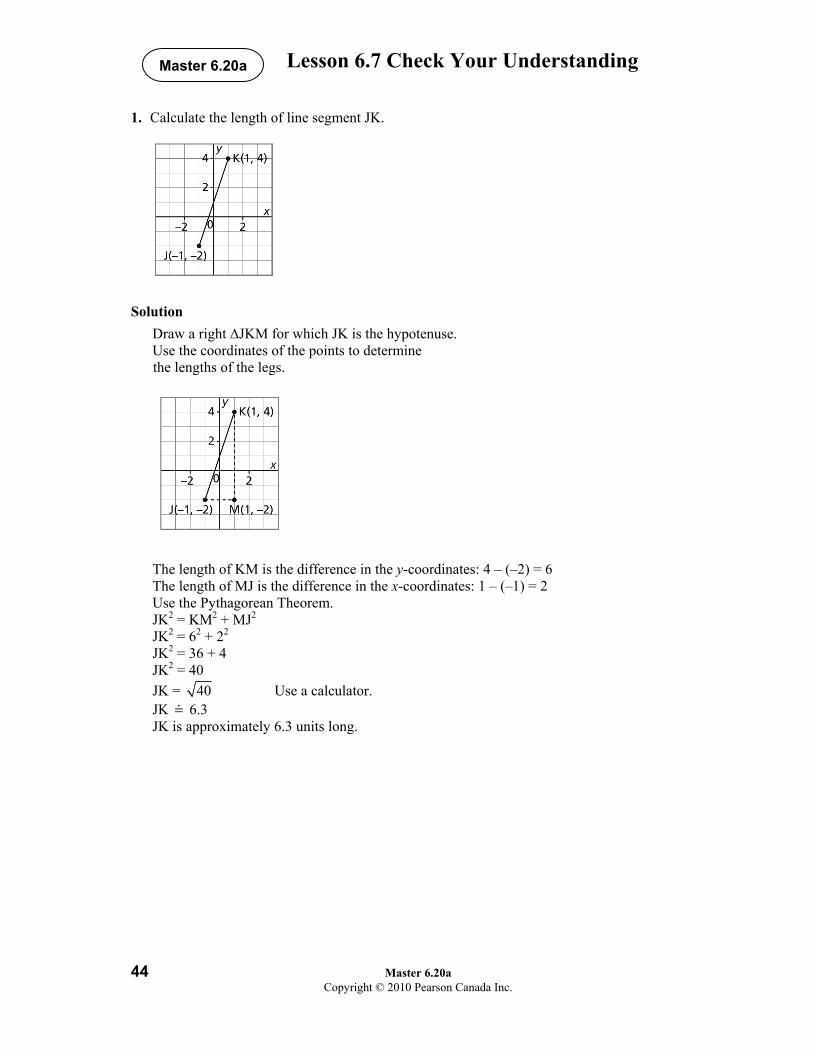
1. Calculate the length of line segment JK.
Solution
Draw a right ∆JKM for which JK is the hypotenuse. Use the coordinates of the points to determine the lengths of the legs. The length of KM is the difference in the y-coordinates: 4 – (–2) = 6 The length of MJ is the difference in the x-coordinates: 1 – (–1) = 2 Use the Pythagorean Theorem. JK2 = KM2 + MJ2 JK2 = 62 + 22
JK2 = 36 + 4 JK2 = 40 JK = 40 Use a calculator. JK 6.3 JK is approximately 6.3 units long.
Lesson 6.7 Check Your Understanding
Master 6.20b 45 Copyright © 2010 Pearson Canada Inc.
Master 6.20b
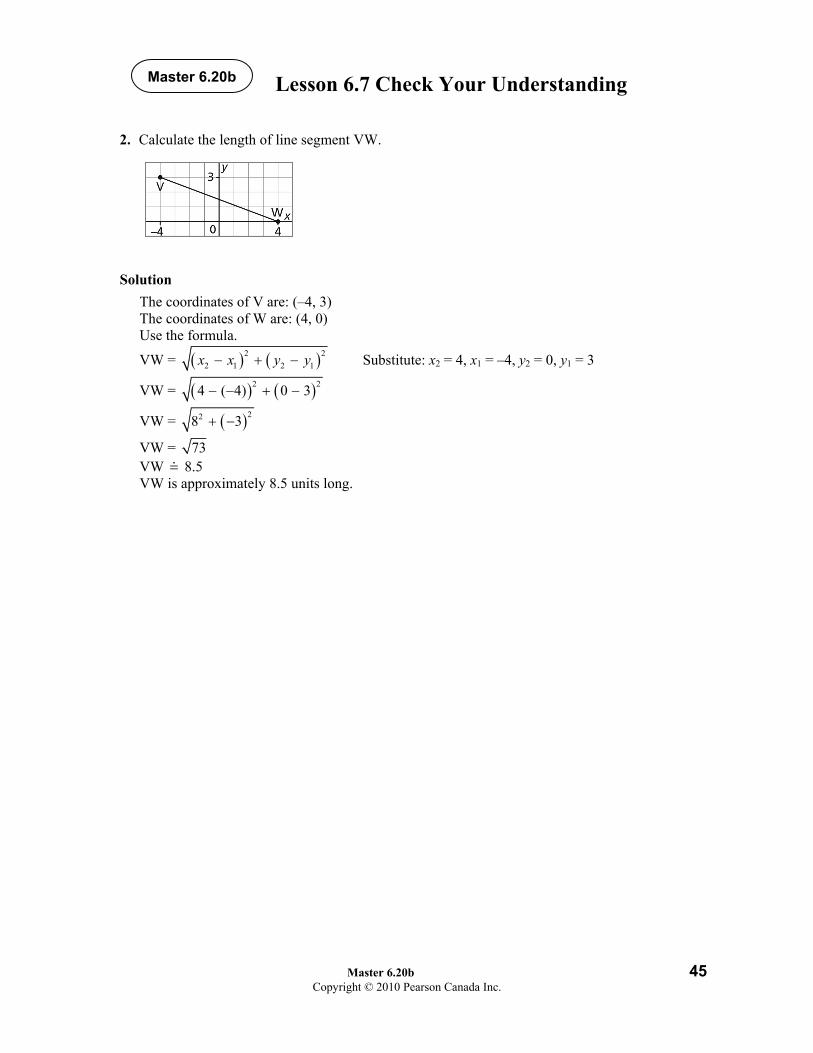
2. Calculate the length of line segment VW.
Solution The coordinates of V are: (–4, 3) The coordinates of W are: (4, 0) Use the formula.
VW = ( ) ( )2 22 1 2 1− + −x x y y Substitute: x2 = 4, x1 = –4, y2 = 0, y1 = 3
VW = ( ) ( )2 24 ( 4) 0 3− − + −
VW = ( )228 3+ −
VW = 73 VW 8.5 VW is approximately 8.5 units long.

Lesson 6.7 Check Your Understanding
46 Master 6.20c Copyright © 2010 Pearson Canada Inc.
Master 6.20c
3. Determine whether ∆ABC is isosceles.
Solution The coordinates of the vertices of the triangle are: A(2, 2), B(3, –3), C(–2, –1) Use the distance formula to calculate the length of each side.
AB = ( ) ( )2 22 1 2 1− + −x x y y Substitute: x2 = 3, x1 = 2, y2 = –3, y1 = 2
AB = ( ) ( )2 23 2 3 2− + − −
AB = ( ) ( )2 21 5+ −
AB = 26
BC = ( ) ( )2 22 1 2 1− + −x x y y Substitute: x2 = –2, x1 = 3, y2 = –1, y1 = –3
BC = ( ) ( )2 22 3 1 ( 3)− − + − − −
BC = ( ) ( )2 25 2− +
BC = 29
CA = ( ) ( )2 22 1 2 1− + −x x y y Substitute: x2 = 2, x1 = –2, y2 = 2, y1 = –1
CA = ( )( ) ( )( )2 22 2 2 1− − + − −
CA = ( ) ( )2 24 3+
CA = 25 CA = 5 Since no two sides of ∆ABC have the same length, it is not an isosceles triangle.
Lesson 6.8 Check Your Understanding
Master 6.21a 47 Copyright © 2010 Pearson Canada Inc.
Master 6.21a
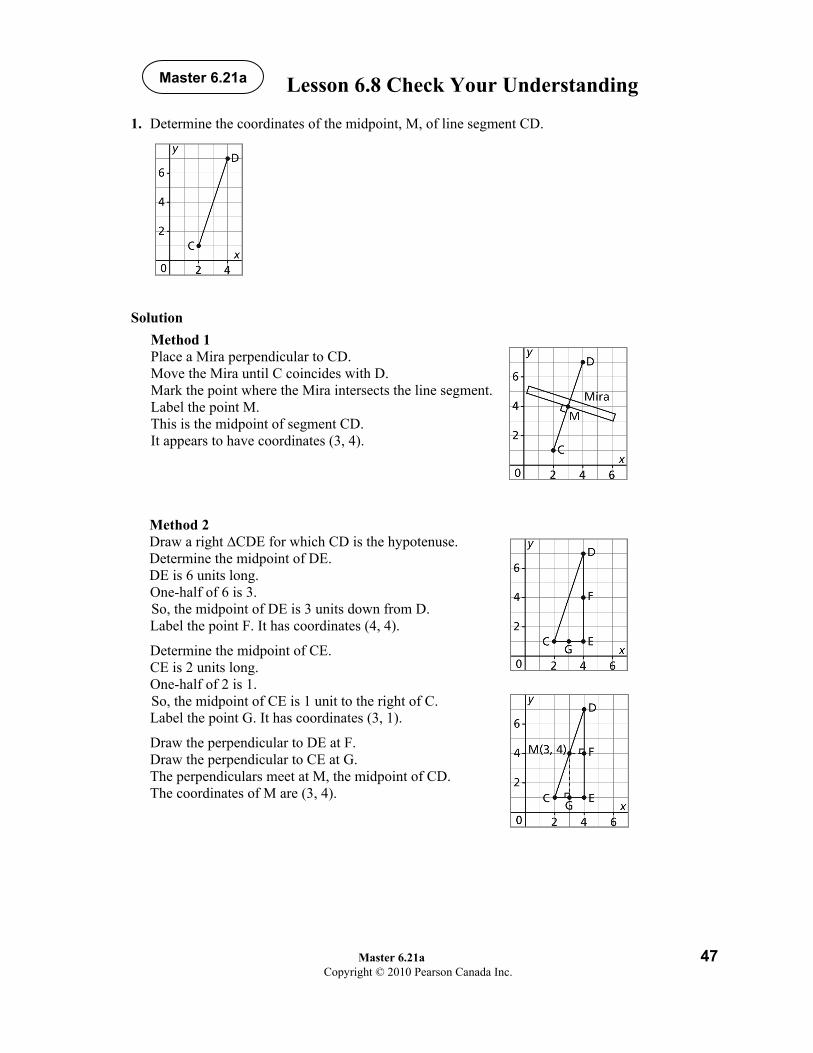
1. Determine the coordinates of the midpoint, M, of line segment CD.
Solution
Method 1 Place a Mira perpendicular to CD. Move the Mira until C coincides with D. Mark the point where the Mira intersects the line segment. Label the point M. This is the midpoint of segment CD. It appears to have coordinates (3, 4).
Method 2 Draw a right ∆CDE for which CD is the hypotenuse. Determine the midpoint of DE. DE is 6 units long. One-half of 6 is 3. So, the midpoint of DE is 3 units down from D. Label the point F. It has coordinates (4, 4).
Determine the midpoint of CE. CE is 2 units long. One-half of 2 is 1. So, the midpoint of CE is 1 unit to the right of C. Label the point G. It has coordinates (3, 1).
Draw the perpendicular to DE at F. Draw the perpendicular to CE at G. The perpendiculars meet at M, the midpoint of CD. The coordinates of M are (3, 4).

Lesson 6.8 Check Your Understanding
48 Master 6.21b Copyright © 2010 Pearson Canada Inc.
Master 6.21b
2. An engineer has to design a highway so that it is the same distance from Red Soil, located at R(5312, 4308), and White Springs, located at W(5368, 4344). Determine the coordinates of one point on the highway.
Solution One point on the highway is the midpoint, M, of the line segment RW. Use the formula.
x-coordinate of M = 1 2
2+x x
= 5312 5368
2
+
= 10 6802
= 5340
y-coordinate of M = 1 2
2+y y
= 4308 4344
2
+
= 8652
2
= 4326 The coordinates of M are (5340, 4326). One point on the highway has coordinates (5340, 4326).
Substitute: x1 = 5312 and x2 = 5368
Substitute: y1 = 4308 and y2 = 4344
Lesson 6.8 Check Your Understanding
Master 6.21c 49 Copyright © 2010 Pearson Canada Inc.
Master 6.21c
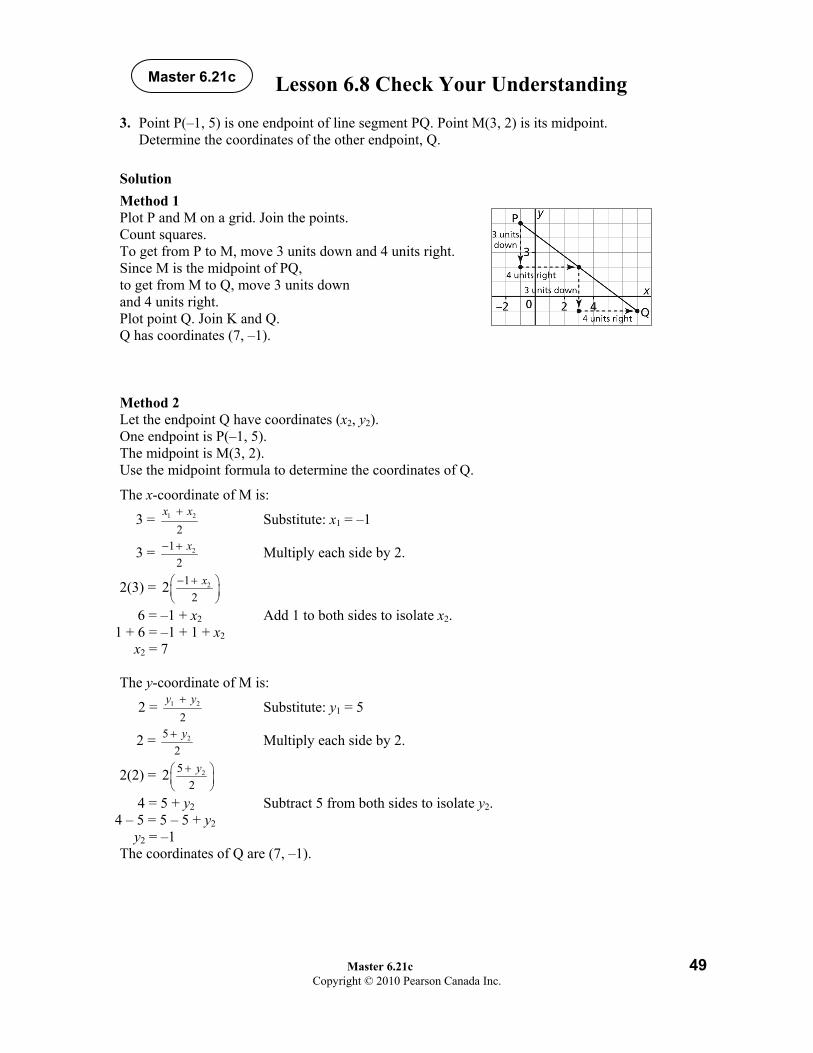
3. Point P(–1, 5) is one endpoint of line segment PQ. Point M(3, 2) is its midpoint. Determine the coordinates of the other endpoint, Q.
Solution Method 1 Plot P and M on a grid. Join the points. Count squares. To get from P to M, move 3 units down and 4 units right. Since M is the midpoint of PQ, to get from M to Q, move 3 units down and 4 units right. Plot point Q. Join K and Q. Q has coordinates (7, –1). Method 2 Let the endpoint Q have coordinates (x2, y2). One endpoint is P(–1, 5). The midpoint is M(3, 2). Use the midpoint formula to determine the coordinates of Q.
The x-coordinate of M is:
3 = 1 2
2+x x Substitute: x1 = –1
3 = 212
x− + Multiply each side by 2.
2(3) = 212
2 x− +⎛ ⎞⎜ ⎟⎝ ⎠
6 = –1 + x2 Add 1 to both sides to isolate x2. 1 + 6 = –1 + 1 + x2
x2 = 7 The y-coordinate of M is:
2 = 1 2
2+y y Substitute: y1 = 5
2 = 252
y+ Multiply each side by 2.
2(2) = 252
2 y+⎛ ⎞⎜ ⎟⎝ ⎠
4 = 5 + y2 Subtract 5 from both sides to isolate y2. 4 – 5 = 5 – 5 + y2
y2 = –1 The coordinates of Q are (7, –1).


Foundations and Pre-calculus
Mathematics
P E A R S O N
Robert BerglindGarry DavisEdward DoolittleDavid EllisJack HopeDelcy RolheiserDavid SufrinChris Van BergeykDavid Van BergeykDavid Zimmer
Copyright © 2010 Pearson Canada Inc.All rights reserved.
This publication is protected by copyright, and permission should be obtained from the publisher prior toany prohibited reproduction, storage in a retrieval system, or transmission in any form or by any means,electronic, mechanical, photocopying, recording, or likewise. For information regarding permission, write tothe Permissions Department.
Pages identified as line masters may be copied by the purchasing school for classroom use.
Printed and bound in Canada
1 2 3 4 5 – – 14 13 12 11 10
10
DPC