mann et al ., 2009 - meteo.psu.edu reconstruction procedure, associated statisti-cal validation and...
TRANSCRIPT
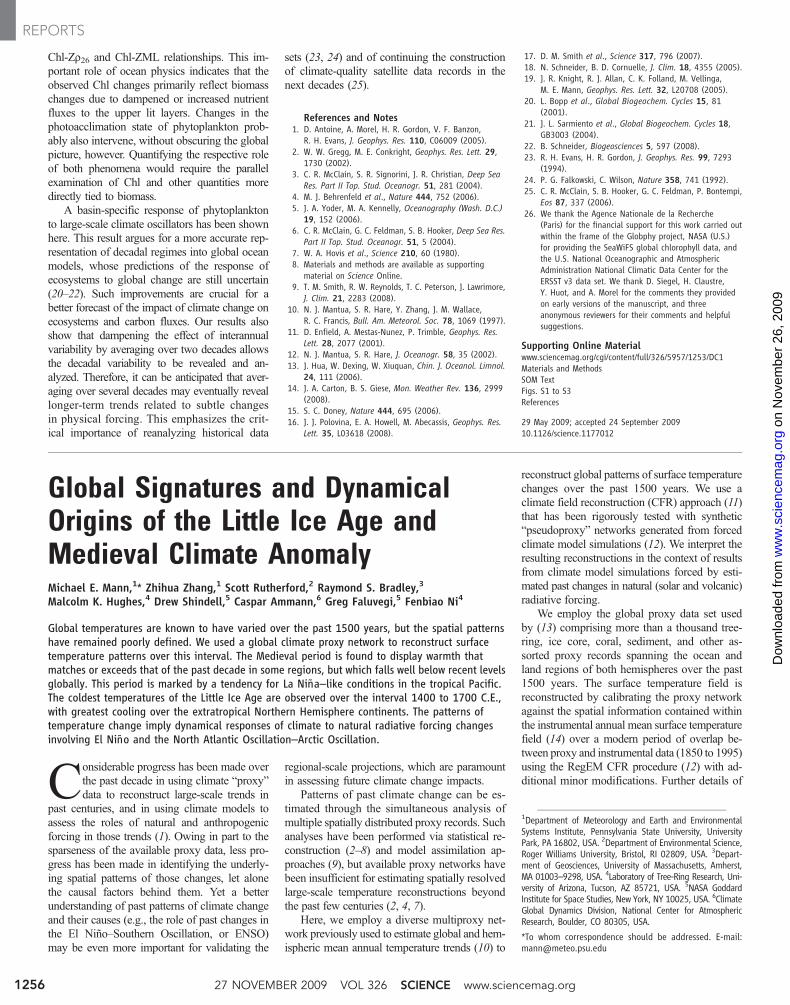
Chl-Zr26 and Chl-ZML relationships. This im-portant role of ocean physics indicates that theobserved Chl changes primarily reflect biomasschanges due to dampened or increased nutrientfluxes to the upper lit layers. Changes in thephotoacclimation state of phytoplankton prob-ably also intervene, without obscuring the globalpicture, however. Quantifying the respective roleof both phenomena would require the parallelexamination of Chl and other quantities moredirectly tied to biomass.
A basin-specific response of phytoplanktonto large-scale climate oscillators has been shownhere. This result argues for a more accurate rep-resentation of decadal regimes into global oceanmodels, whose predictions of the response ofecosystems to global change are still uncertain(20–22). Such improvements are crucial for abetter forecast of the impact of climate change onecosystems and carbon fluxes. Our results alsoshow that dampening the effect of interannualvariability by averaging over two decades allowsthe decadal variability to be revealed and an-alyzed. Therefore, it can be anticipated that aver-aging over several decades may eventually reveallonger-term trends related to subtle changesin physical forcing. This emphasizes the crit-ical importance of reanalyzing historical data
sets (23, 24) and of continuing the constructionof climate-quality satellite data records in thenext decades (25).
References and Notes1. D. Antoine, A. Morel, H. R. Gordon, V. F. Banzon,
R. H. Evans, J. Geophys. Res. 110, C06009 (2005).2. W. W. Gregg, M. E. Conkright, Geophys. Res. Lett. 29,
1730 (2002).3. C. R. McClain, S. R. Signorini, J. R. Christian, Deep Sea
Res. Part II Top. Stud. Oceanogr. 51, 281 (2004).4. M. J. Behrenfeld et al., Nature 444, 752 (2006).5. J. A. Yoder, M. A. Kennelly, Oceanography (Wash. D.C.)
19, 152 (2006).6. C. R. McClain, G. C. Feldman, S. B. Hooker, Deep Sea Res.
Part II Top. Stud. Oceanogr. 51, 5 (2004).7. W. A. Hovis et al., Science 210, 60 (1980).8. Materials and methods are available as supporting
material on Science Online.9. T. M. Smith, R. W. Reynolds, T. C. Peterson, J. Lawrimore,
J. Clim. 21, 2283 (2008).10. N. J. Mantua, S. R. Hare, Y. Zhang, J. M. Wallace,
R. C. Francis, Bull. Am. Meteorol. Soc. 78, 1069 (1997).11. D. Enfield, A. Mestas-Nunez, P. Trimble, Geophys. Res.
Lett. 28, 2077 (2001).12. N. J. Mantua, S. R. Hare, J. Oceanogr. 58, 35 (2002).13. J. Hua, W. Dexing, W. Xiuquan, Chin. J. Oceanol. Limnol.
24, 111 (2006).14. J. A. Carton, B. S. Giese, Mon. Weather Rev. 136, 2999
(2008).15. S. C. Doney, Nature 444, 695 (2006).16. J. J. Polovina, E. A. Howell, M. Abecassis, Geophys. Res.
Lett. 35, L03618 (2008).
17. D. M. Smith et al., Science 317, 796 (2007).18. N. Schneider, B. D. Cornuelle, J. Clim. 18, 4355 (2005).19. J. R. Knight, R. J. Allan, C. K. Folland, M. Vellinga,
M. E. Mann, Geophys. Res. Lett. 32, L20708 (2005).20. L. Bopp et al., Global Biogeochem. Cycles 15, 81
(2001).21. J. L. Sarmiento et al., Global Biogeochem. Cycles 18,
GB3003 (2004).22. B. Schneider, Biogeosciences 5, 597 (2008).23. R. H. Evans, H. R. Gordon, J. Geophys. Res. 99, 7293
(1994).24. P. G. Falkowski, C. Wilson, Nature 358, 741 (1992).25. C. R. McClain, S. B. Hooker, G. C. Feldman, P. Bontempi,
Eos 87, 337 (2006).26. We thank the Agence Nationale de la Recherche
(Paris) for the financial support for this work carried outwithin the frame of the Globphy project, NASA (U.S.)for providing the SeaWiFS global chlorophyll data, andthe U.S. National Oceanographic and AtmosphericAdministration National Climatic Data Center for theERSST v3 data set. We thank D. Siegel, H. Claustre,Y. Huot, and A. Morel for the comments they providedon early versions of the manuscript, and threeanonymous reviewers for their comments and helpfulsuggestions.
Supporting Online Materialwww.sciencemag.org/cgi/content/full/326/5957/1253/DC1Materials and MethodsSOM TextFigs. S1 to S3References
29 May 2009; accepted 24 September 200910.1126/science.1177012
Global Signatures and DynamicalOrigins of the Little Ice Age andMedieval Climate AnomalyMichael E. Mann,1* Zhihua Zhang,1 Scott Rutherford,2 Raymond S. Bradley,3Malcolm K. Hughes,4 Drew Shindell,5 Caspar Ammann,6 Greg Faluvegi,5 Fenbiao Ni4
Global temperatures are known to have varied over the past 1500 years, but the spatial patternshave remained poorly defined. We used a global climate proxy network to reconstruct surfacetemperature patterns over this interval. The Medieval period is found to display warmth thatmatches or exceeds that of the past decade in some regions, but which falls well below recent levelsglobally. This period is marked by a tendency for La Niña–like conditions in the tropical Pacific.The coldest temperatures of the Little Ice Age are observed over the interval 1400 to 1700 C.E.,with greatest cooling over the extratropical Northern Hemisphere continents. The patterns oftemperature change imply dynamical responses of climate to natural radiative forcing changesinvolving El Niño and the North Atlantic Oscillation–Arctic Oscillation.
Considerable progress has been made overthe past decade in using climate “proxy”data to reconstruct large-scale trends in
past centuries, and in using climate models toassess the roles of natural and anthropogenicforcing in those trends (1). Owing in part to thesparseness of the available proxy data, less pro-gress has been made in identifying the underly-ing spatial patterns of those changes, let alonethe causal factors behind them. Yet a betterunderstanding of past patterns of climate changeand their causes (e.g., the role of past changes inthe El Niño–Southern Oscillation, or ENSO)may be even more important for validating the
regional-scale projections, which are paramountin assessing future climate change impacts.
Patterns of past climate change can be es-timated through the simultaneous analysis ofmultiple spatially distributed proxy records. Suchanalyses have been performed via statistical re-construction (2–8) and model assimilation ap-proaches (9), but available proxy networks havebeen insufficient for estimating spatially resolvedlarge-scale temperature reconstructions beyondthe past few centuries (2, 4, 7).
Here, we employ a diverse multiproxy net-work previously used to estimate global and hem-ispheric mean annual temperature trends (10) to
reconstruct global patterns of surface temperaturechanges over the past 1500 years. We use aclimate field reconstruction (CFR) approach (11)that has been rigorously tested with synthetic“pseudoproxy” networks generated from forcedclimate model simulations (12). We interpret theresulting reconstructions in the context of resultsfrom climate model simulations forced by esti-mated past changes in natural (solar and volcanic)radiative forcing.
We employ the global proxy data set usedby (13) comprising more than a thousand tree-ring, ice core, coral, sediment, and other as-sorted proxy records spanning the ocean andland regions of both hemispheres over the past1500 years. The surface temperature field isreconstructed by calibrating the proxy networkagainst the spatial information contained withinthe instrumental annual mean surface temperaturefield (14) over a modern period of overlap be-tween proxy and instrumental data (1850 to 1995)using the RegEM CFR procedure (12) with ad-ditional minor modifications. Further details of
1Department of Meteorology and Earth and EnvironmentalSystems Institute, Pennsylvania State University, UniversityPark, PA 16802, USA. 2Department of Environmental Science,Roger Williams University, Bristol, RI 02809, USA. 3Depart-ment of Geosciences, University of Massachusetts, Amherst,MA 01003–9298, USA. 4Laboratory of Tree-Ring Research, Uni-versity of Arizona, Tucson, AZ 85721, USA. 5NASA GoddardInstitute for Space Studies, New York, NY 10025, USA. 6ClimateGlobal Dynamics Division, National Center for AtmosphericResearch, Boulder, CO 80305, USA.
*To whom correspondence should be addressed. E-mail:[email protected]
27 NOVEMBER 2009 VOL 326 SCIENCE www.sciencemag.org1256
REPORTS
on
Nov
embe
r 26
, 200
9 w
ww
.sci
ence
mag
.org
Dow
nloa
ded
from
the reconstruction procedure, associated statisti-cal validation and skill assessments, uncertaintyestimation procedures, data used, andMATLABsource codes for the analysis procedures areprovided in the Materials and Methods.
Earlier proxy-based large-scale surface tem-perature reconstructions (2, 15) resolved only asingle statistical degree of freedom before the15th century, precluding the possibility of in-vestigating spatial patterns of surface temper-
ature variation in earlier centuries. By contrast,the current reconstructions resolve multiple de-grees of freedom in the surface temperature fieldback through the 6th century, allowing us tomeaningfully interpret spatial features in the
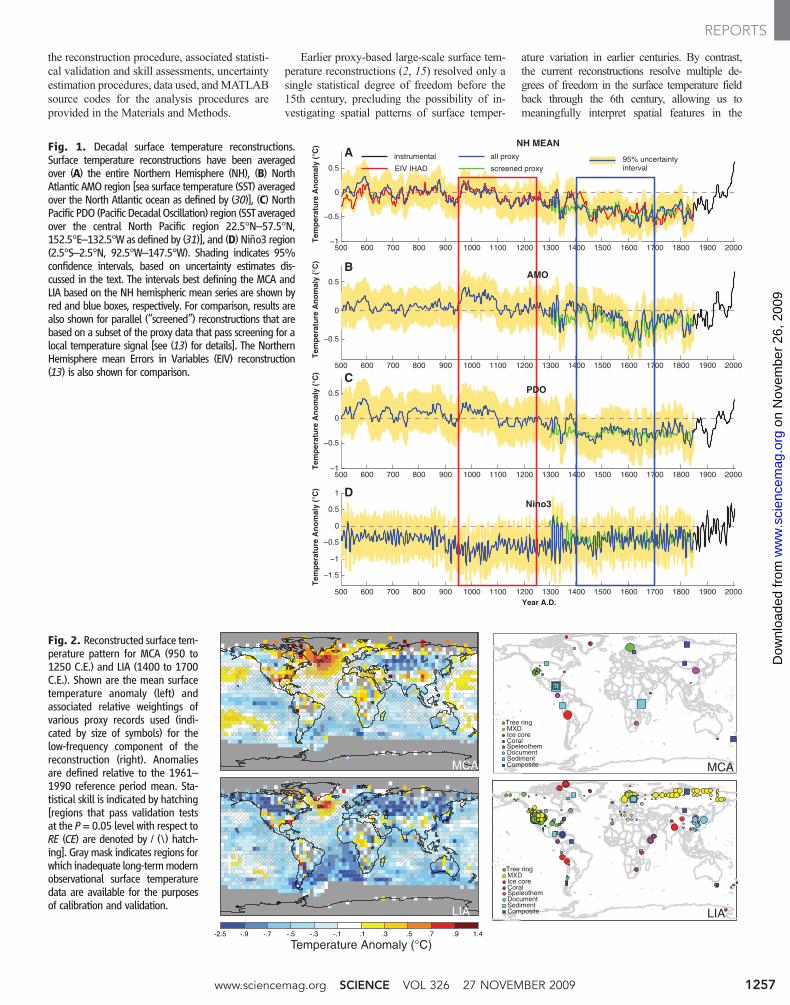
Fig. 1. Decadal surface temperature reconstructions.Surface temperature reconstructions have been averagedover (A) the entire Northern Hemisphere (NH), (B) NorthAtlantic AMO region [sea surface temperature (SST) averagedover the North Atlantic ocean as defined by (30)], (C) NorthPacific PDO (Pacific DecadalOscillation) region (SST averagedover the central North Pacific region 22.5°N–57.5°N,152.5°E–132.5°W as defined by (31)], and (D) Niño3 region(2.5°S–2.5°N, 92.5°W–147.5°W). Shading indicates 95%confidence intervals, based on uncertainty estimates dis-cussed in the text. The intervals best defining the MCA andLIA based on the NH hemispheric mean series are shown byred and blue boxes, respectively. For comparison, results arealso shown for parallel (“screened”) reconstructions that arebased on a subset of the proxy data that pass screening for alocal temperature signal [see (13) for details]. The NorthernHemisphere mean Errors in Variables (EIV) reconstruction(13) is also shown for comparison.
500 600 700 800 900 1000 1100 1200 1300 1400 1500 1600 1700 1800 1900 2000−1
−0.5
0
0.5
NH MEAN
Tem
per
atu
re A
no
mal
y (°
C)
500 600 700 800 900 1000 1100 1200 1300 1400 1500 1600 1700 1800 1900 2000
−0.5
0
0.5
Tem
per
atu
re A
no
mal
y (°
C)
500 600 700 800 900 1000 1100 1200 1300 1400 1500 1600 1700 1800 1900 2000−1
−0.5
0
0.5
Tem
per
atu
re A
no
mal
y (°
C)
500 600 700 800 900 1000 1100 1200 1300 1400 1500 1600 1700 1800 1900 2000
−1.5
−1
−0.5
0
0.5
1
Year A.D.
Tem
per
atu
re A
no
mal
y (°
C)
AMO
PDO
Nino3
instrumental
EIV IHAD
all proxy
screened proxy95% uncertaintyinterval
A
B
C
D
Fig. 2. Reconstructed surface tem-perature pattern for MCA (950 to1250 C.E.) and LIA (1400 to 1700C.E.). Shown are the mean surfacetemperature anomaly (left) andassociated relative weightings ofvarious proxy records used (indi-cated by size of symbols) for thelow-frequency component of thereconstruction (right). Anomaliesare defined relative to the 1961–1990 reference period mean. Sta-tistical skill is indicated by hatching[regions that pass validation testsat the P= 0.05 level with respect toRE (CE) are denoted by / (\) hatch-ing]. Gray mask indicates regions forwhich inadequate long-termmodernobservational surface temperaturedata are available for the purposesof calibration and validation.
-.1 .1 .3 .5 .9-.3-.5-.7-.9 1.4-2.5 .7
Temperature Anomaly (°C)
Tree ringMXDIce coreCoralSpeleothemDocumentSedimentComposite MCAMCA
LIALIA
Tree ringMXDIce coreCoralSpeleothemDocumentSedimentComposite
www.sciencemag.org SCIENCE VOL 326 27 NOVEMBER 2009 1257
REPORTS
on
Nov
embe
r 26
, 200
9 w
ww
.sci
ence
mag
.org
Dow
nloa
ded
from

reconstructions. Nonetheless, certain caveats mustbe kept in mind in interpreting the proxy-basedsurface temperature reconstructions. Before 1600C.E., the low-frequency component of the sur-face temperature reconstructions is described asa linear combination of just two leading pat-terns of temporal variation, so that regional fea-tures in the temperature field are represented bya spatiotemporally filtered approximation. More-over, as decadal-resolution proxy data wereused in addition to annual-resolution data, onlyinterdecadal and longer-term variations are mean-ingfully resolved; i.e., the details of individualyears and even individual decades should notbe emphasized. Thus, it is the longer-term, andlarger-scale, variations resolved by the recon-structions that are most meaningful.
The large-scale surface temperature recon-structions, when spatially averaged, e.g., overthe Northern Hemisphere, yield a long-termhistory very similar to the hemispheric meanreconstructions of (13) (Fig. 1A). However, thespatial reconstructions can also be averaged toyield other indices of interest [Fig. 1, B to E;other regional average series are shown in theSupporting OnlineMaterial (SOM) Text]. Thoughthere are relatively few distinct patterns of vari-ation resolved by the reconstructions, particularlybefore 1600 C.E., there are notable differences ofbehavior among the various diagnosed indices.The Atlantic Multidecadal Oscillation (AMO)series, for example, is marked by substantialmultidecadal variability, consistent with previousproxy studies of North Atlantic variability [e.g.,(16)]. The high-frequency fluctuations of theNiño3 series are consistent with the oscillatorynature of ENSO. TheNiño3 index suggests strongand persistent La Niña conditions around 1000years ago, as discussed further below.
Our reconstructions span two climatologicallyinteresting periods, the so-called Little Ice Age(LIA) and Medieval Climate Anomaly (MCA).For the purpose of investigating the associatedspatial patterns (Fig. 2), we defined the LIA andMCA in terms of distinct three-century-long in-tervals (1400 to 1700 C.E. and 950 to 1250 C.E.,respectively), which both correspond to relativecold and warm hemispheric conditions, respec-tively (Fig. 1), and are distinct with regard to theestimated external radiative forcing of the climate(1, 17). The observed patterns are not, however,sensitive to the precise time intervals used to de-fine these periods (fig. S9). The MCA pattern isbased on a smaller number of predictors than theLIA pattern (Fig. 2) and, accordingly, on fewerresolved spatial degrees of freedom (SOM Text).
The reconstruction skill diagnostics suggestthat the MCA and LIA reconstructions are mostreliable (Fig. 2) over the Northern Hemisphereand tropics, and least reliable in the SouthernHemisphere, particularly in the extratropics. Toassess if the larger-scale features of the earlierMCA pattern are robust, we used only the morerestricted network of proxy data available backthrough the beginning of the MCA interval to
reconstruct temperatures for the LIA interval.This analysis gave a reconstruction very similarto the LIA reconstruction based on the full dataset (fig. S10).
The reconstructed MCA pattern is charac-terized by warmth over a large part of the NorthAtlantic, Southern Greenland, the Eurasian Arctic,and parts of North America, which appears to
Fig. 3. Spatial pattern of MCA-LIAsurface temperature difference inreconstructions and model simula-tions. (A) Proxy-based temperaturereconstructions, (B) GISS-ER (usingthe same solar forcing differenceused in the NCAR simulation—shown is the ensemble mean; seethe SOM for example results fromone of six realizations), and (C) NCARCSM 1.4 simulation (using the sameMCA and LIA time intervals as de-fined above). The observational maskhas been applied to both model pat-terns for ease of comparison. Statis-tical skill for (A) is indicated with thesame conventions as in Fig. 2 (statis-tical significance here indicates thatthe particular test statistic indepen-dently passed during both the MCAand LIA intervals).
Temperature Anomaly (°C)
MCA-LIA Reconstruction
MCA-LIA GISS
MCA-LIA NCAR
A
B
C
NCAR CSM 1.4 GISS-ER
MCA-LIA SLP (mb) MCA-LIA SLP (mb)
A B
Fig. 4. Spatial pattern of MCA-LIA sea-level pressure difference in model simulations. (A) NCAR CSM1.4 and (B) GISS-ER. For the NCAR model, a single run was available (23). For the GISS-ER coupledmodel, we show the ensemble mean of six realizations; see SOM section 5 for further details.
27 NOVEMBER 2009 VOL 326 SCIENCE www.sciencemag.org1258
REPORTS
on
Nov
embe
r 26
, 200
9 w
ww
.sci
ence
mag
.org
Dow
nloa
ded
from

substantially exceed that of the modern late–20th century (1961–1990) baseline and is com-parable to or exceeds that of the past one-to-twodecades in some regions. This finding is con-sistent with that of a recent tree-ring–based studyof high-latitude Eurasian temperatures (18).Relative warmth in the central North PacificMCA is consistent with the expected extratrop-ical signature of the strong observed La Niña–like pattern in the tropical Pacific (strong coolingin the east and warming in the west). Certainregions, such as central Eurasia, northwesternNorth America, and (with less confidence) partsof the South Atlantic, exhibit anomalous cool-ness. The LIA pattern is characterized primarilyby pronounced cooling over the Northern Hemi-sphere continents, but with some regions—e.g.,parts of the Middle East, central North Atlantic,Africa, and isolated parts of the United States,tropical Eurasia, and the extratropical PacificOcean—displaying warmth comparable to thatof the present day. In some places, e.g., northernLabrador, apparent LIA warmth is a product, atleast in part, of the relatively cool nature of the1961–1990 reference period in the region.
For comparison with model simulation re-sults, it is useful to eliminate the influence ofthe choice of modern reference period by ex-amining the pattern of the MCA-LIA differenceitself (Fig. 3). The MCA-LIA pattern highlightsthe extent to which the MCA is both more “LaNiña–like” [e.g., (17, 19–21)] and, with en-hanced warmth over interior North Americaand the Eurasian Arctic, and cooling over cen-tral Eurasia, suggestive of the positive phase ofthe North Atlantic Oscillation (NAO) andclosely related Arctic Oscillation (AO) sea-levelpressure (SLP) pattern (17, 22), as discussedfurther below.
We examined results for two different cou-pled model simulations of the past millennium,driven with those factors (solar irradiance changesand stratospheric aerosols from explosive volcan-ic eruptions) that can most plausibly explain theclimate changes of the past millennium (17): (i)the National Center for Atmospheric Research(NCAR) Climate SystemModel (CSM) 1.4 cou-pled model driven with estimated solar plus vol-canic forcing over the past millennium [see (23)for details]; and (ii) the Goddard Institute forSpace Studies–ER (GISS-ER) coupled modelwith solar (but no volcanic) forcing (SOM Text),scaled for an MCA-LIA solar radiative forcing atthe tropopause of 0.37 W/m2 (equivalent to theMCA-LIA solar forcing difference used in theNCAR simulation). Both simulations give verysimilar estimates of the global mean MCA-LIAtemperature difference (0.16° and 0.24°C forNCAR and GISS, respectively; the latter is iden-tical to the proxy reconstructed mean surface tem-perature difference of 0.24°C). The spatial patternsof response for the two models (Fig. 3), however,are quite different, as discussed further below.
The La Niña–like nature of the MCA-LIApattern is not reproduced in either of the two
different coupled model simulations analyzed.On the other hand, such a pattern is reproducedin simulations (19) using the low-order Cane-Zebiak (24) model of the tropical Pacific cou-pled ocean-atmosphere system. The discrepancyin the model responses may arise because thetropical Pacific “thermostat” mechanism (25) isnot active in either the NCAR or GISS simu-lations. In (19), this mechanism is responsiblefor the La Niña–like response to the positivetropical radiative forcing of the MCA that arisesfrom a combination of relatively high solar irra-diance and inactive tropical volcanism. Althoughthere is still a vigorous debate regarding the na-ture of the response of the tropical Pacific toanthropogenic radiative forcing [e.g., (26)], paleo-climate evidence examined here, as elsewhere[e.g., (19, 27)], appears to support a thermostat-like response, at least for natural radiativelyforced climate changes in past centuries.
The NCAR simulation also does not re-produce the enhanced warming over the EurasianArctic, high-latitude North Atlantic, and NorthAmerican region evident in the reconstructedMCA-LIA pattern. As discussed previously, thissurface temperature pattern is consistent with arelative positive (negative) NAO-AO atmospher-ic circulation anomaly during the MCA (LIA),associated with annular bands of positive (nega-tive) SLP anomalies in the subtropics and mid-latitudes, and negative (positive) SLP anomaliesin the subpolar latitudes. Such a pattern has beeninferred in paleoclimate studies of the past mil-lennium (5, 17, 22, 28, 29), and the negativephase of this pattern has been produced as adynamical response to decreased solar radiativeforcing during the LIA using a previous versionof the NASA GISS model that incorporates theeffects of ozone photochemistry on the verticalstructure of the atmosphere (28, 29). These ef-fects are not accounted for in the NCAR sim-ulation, which is limited to 36 km in verticalextent. The GISS-ERmodel used here extends to~80 km and does incorporate these processesand, indeed, reproduces roughly the observed pat-tern of enhanced North American, high-latitudeNorth Atlantic, and Arctic Eurasian warming, asa dynamical response to the imposed radiativeforcing. These surface temperature changes are,in turn, associated with an annular atmosphericcirculation response (Fig. 4) reminiscent of thepositive phase of the NAO-AO pattern, thoughwith some differences [in particular, (i) thehigh- and low-pressure regions in the NorthAtlantic sector are somewhat asymmetric andgeographically shifted relative to the conven-tional pattern—hence, for example, the relativeabsence of warming in western Europe; and (ii)there is a positive SLP anomaly over NorthernGreenland and part of the Eurasian Arctic Oceanthat is absent in the conventional pattern]. Com-parisons over the Pacific sector and neighboringregions, by contrast, are of limited utility, giventhe inability of the GISS-ER model to reproducethe aforementioned LaNiña–like feature ofMCA-
LIA pattern, which strongly affects the Pacificbasin. There is no evidence of a positive NAO-AO response in the NCAR simulation (Fig. 4).
The observed patterns of change, even whenaveraged over multicentury intervals, are unlike-ly to be entirely forced in nature, as there is alsoa potentially important role for purely internal,natural variability (9). Consistent with this view,we find that individual realizations of the GISS-ER transient response to the MCA-LIA solarforcing difference yield patterns that differ mod-estly in their details. For at least one realization,for example, the reconstructed warm anomalyover Western Europe is reproduced. In mostcases, the basic features discussed above arenonetheless evident (SOM Text).
The paleoclimate reconstructions presentedhere hold important implications for future cli-mate change. For example, if the tropical Pacificthermostat response suggested by our analysesof past changes applies to anthropogenic climatechange, this holds profound implications forregional climate change effects such as futuredrought patterns. Continued refinement of paleo-climate reconstructions through expanded proxydatabases and refinements of CFR methodol-ogy, improved estimates of past radiative forcing,and a better understanding of the influence ofradiative forcing on large-scale climate dynam-ics should remain priorities as we work towardimproving the regional credibility of climatemodel projections.
References and Notes1. E. Jansen et al., in Climate Change: The Physical Science
Basis. Contribution of Working Group I to the FourthAssessment Report of the Intergovernmental Panel onClimate Change, S. Solomon et al., Eds. (Cambridge Univ.Press, New York, 2007), pp. 433–497.
2. M. E. Mann, R. S. Bradley, M. K. Hughes, Nature 392,779 (1998).
3. K. R. Briffa, P. D. Jones, F. H. Schweingruber, T. J. Osborn,Nature 393, 450 (1998).
4. K. R. Briffa et al., J. Geophys Res. Atmos. 106, 2929(2001).
5. J. Luterbacher et al., Geophys. Res. Lett. 26, 2745(1999).
6. J. Luterbacher, D. Dietrich, E. Xoplaki, M. Grosjean,H. Wanner, Science 303, 1499 (2004).
7. M. N. Evans, A. Kaplan, M. A. Cane, Paleoceanography17, 1007 (2002).
8. S. Rutherford et al., J. Clim. 18, 2308 (2005).9. H. Goosse, H. Renssen, A. Timmermann, R. S. Bradley,
M. E. Mann, Clim. Dyn. 27, 165 (2006).10. See Dataset S1 in the Materials and Methods.11. The synthetic proxy data in these tests are constructed to
have noise characteristics similar to those estimated foractual proxy data. The calibration process, as withreal-world reconstructions, is performed over amodern interval that is subject to anthropogenic forcing.The ability of the method to reproduce the earliervariations is then objectively assessed. See (12) forfurther details.
12. M. E. Mann, S. Rutherford, E. Wahl, C. Ammann,J. Geophys. Res. Atmos. 112, D12109 (2007).
13. M. E. Mann et al., Proc. Natl. Acad. Sci. U.S.A. 105,13252 (2008).
14. P. Brohan, J. J. Kennedy, I. Harris, S. F. B. Tett, P. D. Jones,J. Geophys. Res. Atmos. 111, D12106 (2006).
15. M. E. Mann, R. S. Bradley, M. K. Hughes, Geophys. Res.Lett. 26, 759 (1999).
www.sciencemag.org SCIENCE VOL 326 27 NOVEMBER 2009 1259
REPORTS
on
Nov
embe
r 26
, 200
9 w
ww
.sci
ence
mag
.org
Dow
nloa
ded
from
16. T. L. Delworth, M. E. Mann, Clim. Dyn. 16, 661(2000).
17. P. D. Jones, M. E. Mann, Rev. Geophys. 42, RG2002(2004).
18. K. R. Briffa et al., Philos. Trans. R. Soc. B 363, 2271 (2008).19. M. E. Mann, M. A. Cane, S. E. Zebiak, A. Clement, J. Clim.
18, 447 (2005).20. K. M. Cobb, C. D. Charles, R. L. Edwards, H. Cheng,
M. Kastner, Nature 424, 271 (2003).21. N. E. Graham et al., Clim. Change 83, 241 (2007).22. V. Trouet et al., Science 324, 78 (2009).23. C. M. Ammann, F. Joos, D. Schimel, B. L. Otto-Bliesner,
R. Tomas, Proc. Natl. Acad. Sci. U.S.A. 104, 3713(2007).
24. S. E. Zebiak, M. A. Cane, Mon. Weather Rev. 115, 2262(1987).
25. A. C. Clement, R. Seager, M. A. Cane, S. E. Zebiak,J. Clim. 9, 2190 (1996).
26. G. A. Meehl et al., in Climate Change: The PhysicalScience Basis. Contribution of Working Group I to theFourth Assessment Report of the Intergovernmental Panelon Climate Change, S. Solomon et al., Eds. (CambridgeUniv. Press, New York, 2007), pp. 747–845.
27. J. Brad Adams, M. E. Mann, C. M. Ammann, Nature 426,274 (2003).
28. D. T. Shindell, G. A. Schmidt, M. E. Mann, D. Rind,A. Waple, Science 294, 2149 (2001).
29. D. T. Shindell, G. A. Schmidt, R. L. Miller, M. E. Mann,J. Clim. 16, 4094 (2003).
30. R. A. Kerr, Science 288, 1984 (2000).31. N. J. Mantua et al., Bull. Am. Meteorol. Soc. 78, 1069
(1997).32. M.E.M. and Z.Z. gratefully acknowledge support
from the ATM program of the National ScienceFoundation (grant ATM-0542356). R.S.B. acknowledgessupport from the Office of Science (BER), U.S.
Department of Energy (grant DE-FG02-98ER62604).M.K.H. and F.B.N. were supported by the NationalOceanic and Atmospheric Administration (grantNA16GP2914 from CCDD). D.T.S. and G.F. acknowledgesupport from NASA’s Atmospheric Chemistry, Modeling,and Analysis Program.
Supporting Online Materialwww.sciencemag.org/cgi/content/full/326/5957/1256/DC1Materials and MethodsSOM TextFigs. S1 to S11Tables S1 to S5ReferencesSOM Data
4 June 2009; accepted 5 October 200910.1126/science.1177303
Extensive, Recent Intron Gains inDaphnia PopulationsWenli Li,1* Abraham E. Tucker,1* Way Sung,2 W. Kelley Thomas,2 Michael Lynch1†
Rates and mechanisms of intron gain and loss have traditionally been inferred from alignments ofhighly conserved genes sampled from phylogenetically distant taxa. We report a population-genomic approach that detected 24 discordant intron/exon boundaries between the whole-genomesequences of two Daphnia pulex isolates. Sequencing of presence/absence loci across a collection ofD. pulex isolates and outgroup Daphnia species shows that most polymorphisms are a consequenceof recent gains, with parallel gains often occurring at the same locations in independent alleliclineages. More than half of the recent gains are associated with short sequence repeats, suggestingan origin via repair of staggered double-strand breaks. By comparing the allele-frequencyspectrum of intron-gain alleles with that for derived single-base substitutions, we also provideevidence that newly arisen introns are intrinsically deleterious and tend to accumulate inpopulation-genetic settings where random genetic drift is a relatively strong force.
Introns are noncoding sequences that inter-rupt eukaryotic exons and are removed frompremature mRNAs by the spliceosomal ma-
chinery before translation (1–3). Intron coloni-zation affects the evolution of gene structure andis a factor in the emergence of genomic and or-ganismal complexity, as newly arisen introns arethought to be intrinsically deleterious owing tothe increased mutational target that they imposeon their host genes (4, 5). The number of intronsin a genome is determined by the relative ratesof intron gain and loss over evolutionary time,which differ among lineages. Across eukaryotes,intron numbers range from >100,000 per verte-brate genome to only two in Giardia lamblia(6, 7). The fundamental causes of this variation re-main controversial (8, 9), partly because of a lackof population-level analyses with the power toinfer the properties of recent gain or loss alleles.
The early eukaryotic progenitor has beenassumed to be intron-rich on the basis of the
presence of introns in homologous positionsof orthologous genes of widely divergent eu-karyotes (10–12) and the likely presence of acomplex spliceosome in the eukaryotic ancestor(13). In this context, intron-poor lineages areassumed to reflect a long-term history of intronloss (14). Alternatively, moderate ancestralintron density followed by lineage-specific gains(15) may have occurred, even at orthologouspositions in divergent taxa (16). However, mostcomparative studies of introns have examinedonly a small subset of highly conserved genesbetween deeply divergent lineages, and althoughsome studies have documented unambiguousexamples of intron gain (17–19) and some sta-tistical procedures allow an indirect inference ofparallel gains and/or losses (20, 21), compara-tive studies of taxa with extreme sequence diver-gence have essentially no possibility of directlyinferring parallel intron gains.
Because they potentially retain the molecularsignatures of the process of intron origin, intronpresence or absence alleles segregating in nat-ural populations provide material to infer gain orloss mechanisms and to estimate taxon-specificturnover rates. Such polymorphisms do exist. Astanding intron presence/absence polymorphismwas found at a locus in natural isolates of Dro-
sophila teisseri (22), and two intron-gain allelessegregate with an intron-free version at a locusin the microcrustacean Daphnia pulex (23). Thelatter study, in particular, inspired us to lookmore deeply for evidence of recent intron gainor loss in D. pulex.
By artificially removing intron sequences fromall predicted gene sequences of the annotatedD. pulex genome [clone TCO (24)] and queryingthe exon-exon boundaries (n = 110,021) againstanother D. pulex genome sequence (TRO), we de-tected putative intron-free alleles. After filtering forparalogy and false positives, such as processedpseudogenes, we sequenced the genomic regionssurrounding 24 intron presence/absence posi-tions across 84 natural isolates of North Amer-icanD. pulex species as well as in eightDaphniaoutgroup species. Gene trees constructed fromflanking-exon sequence for each presence/absencepolymorphism revealed the phylogenetic relation-ships of the polymorphic alleles, and from thesedata we inferred that 87.5% (21/24) of the intronpolymorphisms reflect recent intron gains, withthree reflecting intron losses (figs. S1 to S24).Most of the gains (15/28)were exclusive toOregonpopulations, a genetically isolated subclade ofNorth American D. pulex (25, 26) with a histor-ically low effective population size (27). Activesplicing of all polymorphic introns was confirmedwith reverse transcription polymerase chain reac-tion sequencing.
The features of newly arisen introns in D. pulexare inconsistent with most hypothesized mecha-nisms of intron origin (7). We found no supportfor intron gains resulting from tandem duplicationsof fragments of coding DNA or insertions of trans-posable elements. Furthermore, the polymorphicintron sequences identified seem to be evolution-ary novelties absent from well-characterized eu-karyotic and prokaryotic genomes. Except forgains at one locus (Dappu-42116_2, fig. S20),Blastn searches using recently gained intron se-quences against the D. pulex genome assembly(http://wfleabase.org/blast), D. pulex genome tracefiles, and the full GenBank repository did notretrieve any homologous sequence hits.
We observed that short direct repeats, rang-ing in size from 5 to 12 base pairs, flank many
1Biology Department, Indiana University, Bloomington, IN47405, USA. 2Hubbard Center for Genome Studies, Universityof New Hampshire, Durham, NH 03824, USA.
*These authors contributed equally to this work.†To whom correspondence should be addressed. E-mail:[email protected]
27 NOVEMBER 2009 VOL 326 SCIENCE www.sciencemag.org1260
REPORTS
on
Nov
embe
r 26
, 200
9 w
ww
.sci
ence
mag
.org
Dow
nloa
ded
from