manning_3d_cloud_astm_fall_2016
TRANSCRIPT

National Aeronautics and Space Administration
Jet Propulsion LaboratoryCalifornia Institute of TechnologyPasadena, California
Atmospheric Infrared Sounder
© 2016, All rights reserved. California Institute of TechnologyGovernment sponsorship acknowledged
3D Visualization of AIRS Clouds
John Pham1,2
Evan M. Manning1
1 Jet Propulsion Laboratory, California Institute of Technology2 University of California, Riverside
Thanks to Brian Kahn, Eric Fetzer, Oleg Pariser, Victor Ardulov, Charles Thompson
19/16/2016

National Aeronautics and Space Administration
Jet Propulsion LaboratoryCalifornia Institute of TechnologyPasadena, California
Atmospheric Infrared Sounder
© 2016, All rights reserved. California Institute of TechnologyGovernment sponsorship acknowledged
Outline
• AIRS Clouds
• 3D Clouds
• 3D Clouds plus– Colors– Comparisons– Animation
• Beyond 3D– Interaction– Virtual Reality
• More– Tools– Applications– Future Directions
9/16/2016 2

National Aeronautics and Space Administration
Jet Propulsion LaboratoryCalifornia Institute of TechnologyPasadena, California
Atmospheric Infrared Sounder
© 2016, All rights reserved. California Institute of TechnologyGovernment sponsorship acknowledged
AIRS Cloud Products
• Among its many products, AIRS includes several cloud products
• The primary cloud retrieval reports effective cloud fraction (EFC) and cloud top pressure (CTP) for up to 2 cloud layers in each 15 km spot
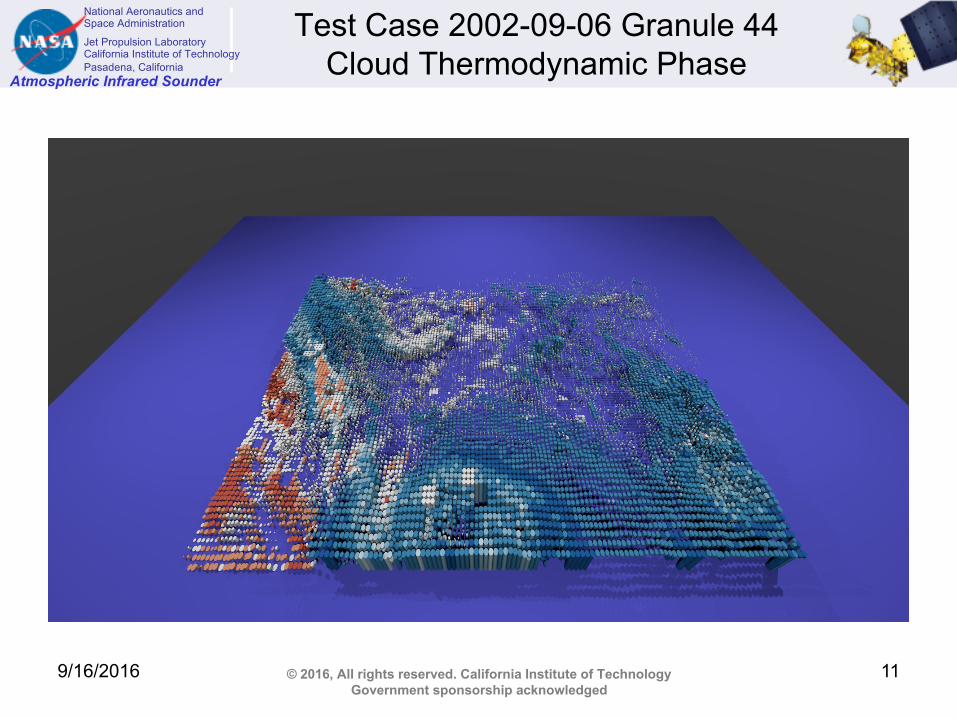
• There is also characterization of cloud thermodynamic phase (ice/liquid) from Shaima Nasiri
• A second “cirrus” retrieval from Brian Kahn for ice clouds reports:– Cloud particle effective diameter– Optical depth– Cloud top temperature
9/16/2016 3

National Aeronautics and Space Administration
Jet Propulsion LaboratoryCalifornia Institute of TechnologyPasadena, California
Atmospheric Infrared Sounder
© 2016, All rights reserved. California Institute of TechnologyGovernment sponsorship acknowledged
2-D to 3-D
9/16/2016 4

National Aeronautics and Space Administration
Jet Propulsion LaboratoryCalifornia Institute of TechnologyPasadena, California
Atmospheric Infrared Sounder
© 2016, All rights reserved. California Institute of TechnologyGovernment sponsorship acknowledged
Visualizing AIRS Primary Cloud Products
For each 15KM spot, the primary cloud retrieval provides only CTP and ECF for up to 2 cloud layers
This is not a full characterization of the clouds’ appearance:• Cloud top height (CTH) can be calculated from CTP• But what is the cloud thickness?• What is the cloud optical density? (visible or infrared)• If the cloud does not fill the FOV ellipse, then what is the spatial
distribution within the area?
9/16/2016 5

National Aeronautics and Space Administration
Jet Propulsion LaboratoryCalifornia Institute of TechnologyPasadena, California
Atmospheric Infrared Sounder
© 2016, All rights reserved. California Institute of TechnologyGovernment sponsorship acknowledged
Current Spatial Approach
The area of each cloud is adjusted to match the reported ECF
• Keeping the horizontal shape constant, the radius is multiplied by sqrt(ECF)
• This emphasizes accurately reflecting the data over photorealistic presentation
• It also allows lower cloud layers to be seen through higher ones
Depth is based on Miller et al. Cloudsat-derived climatology of cloud thickness by cloud type
• We use data from his Table 1 all-season mode for 15-45 degrees north
• For Dc and Ns, we modify this to put the cloud bottom 0.5 km above the surface
• For cloud type determination, we use IR CTP and IR ECF
– Thresholds are preliminary• The lower cloud is reduced or eliminated when
the clouds overlap vertically• Vertical coordinates are magnified 3-15x for
display
9/16/2016 6

National Aeronautics and Space Administration
Jet Propulsion LaboratoryCalifornia Institute of TechnologyPasadena, California
Atmospheric Infrared Sounder
© 2016, All rights reserved. California Institute of TechnologyGovernment sponsorship acknowledged
Volumetric vs Solid clouds
• Clouds appear volumetric in the real world – we see light scattered off particles throughout the volume, not on the surface
• Originally this effort focused on volumetric visualizations, but these proved slower to produce and harder for viewers to interpret
• They may still be useful in the future for outreach or to provide more realistic transparency in science visualizations
9/16/2016 7
National Aeronautics and Space Administration
Jet Propulsion LaboratoryCalifornia Institute of TechnologyPasadena, California
Atmospheric Infrared Sounder
© 2016, All rights reserved. California Institute of TechnologyGovernment sponsorship acknowledged
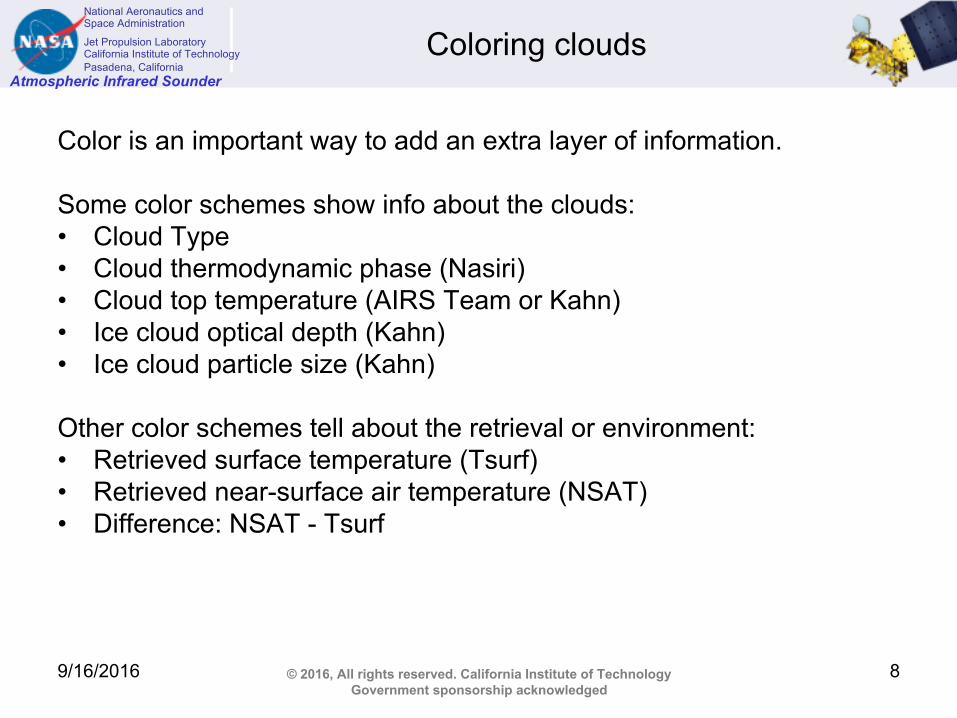
Coloring clouds
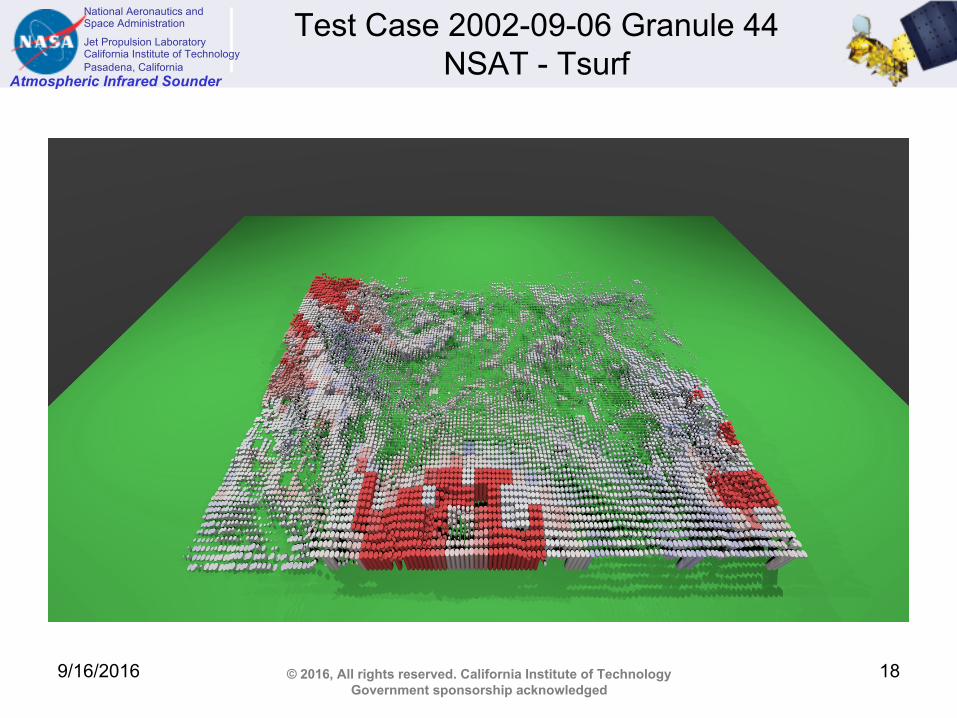
Color is an important way to add an extra layer of information.
Some color schemes show info about the clouds:• Cloud Type• Cloud thermodynamic phase (Nasiri)• Cloud top temperature (AIRS Team or Kahn)• Ice cloud optical depth (Kahn)• Ice cloud particle size (Kahn)
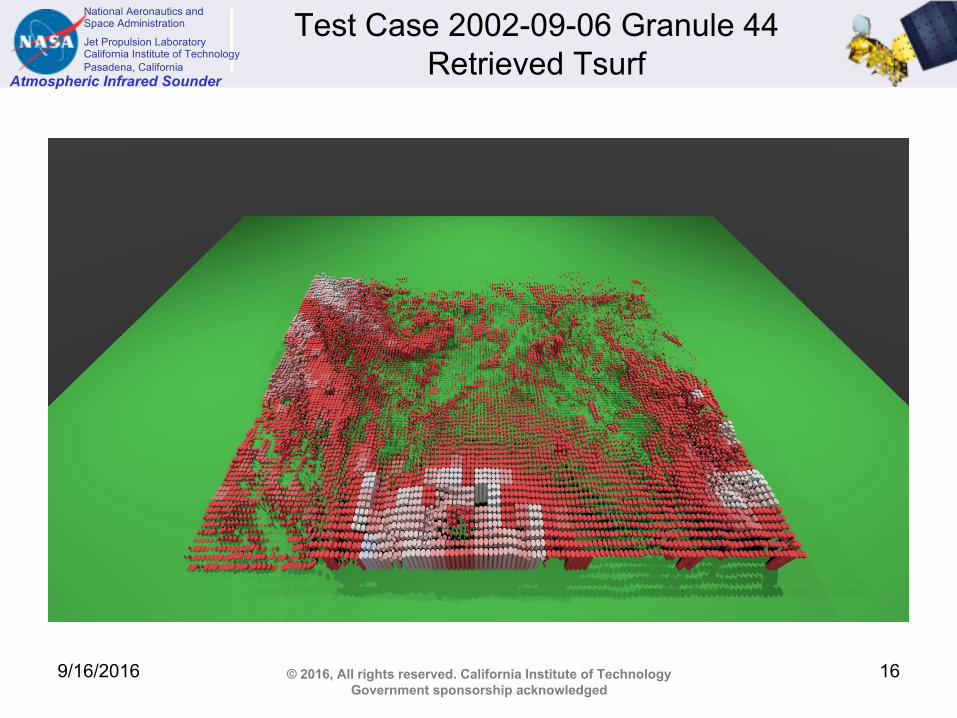
Other color schemes tell about the retrieval or environment:• Retrieved surface temperature (Tsurf)• Retrieved near-surface air temperature (NSAT)• Difference: NSAT - Tsurf
9/16/2016 8
National Aeronautics and Space Administration
Jet Propulsion LaboratoryCalifornia Institute of TechnologyPasadena, California
Atmospheric Infrared Sounder
© 2016, All rights reserved. California Institute of TechnologyGovernment sponsorship acknowledged
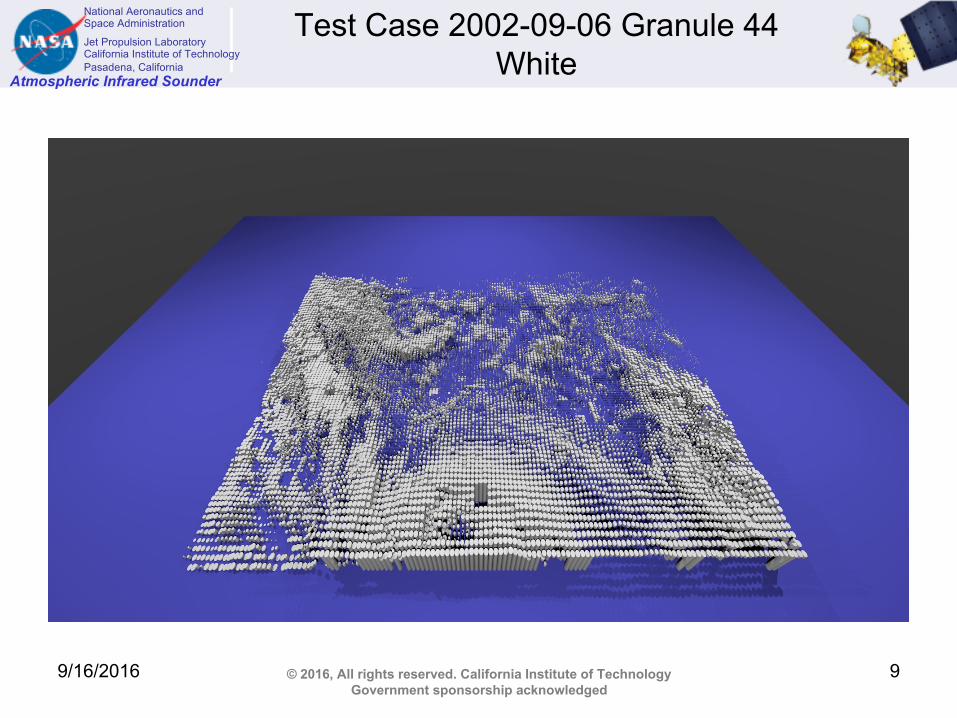
Test Case 2002-09-06 Granule 44White
9/16/2016 9

National Aeronautics and Space Administration
Jet Propulsion LaboratoryCalifornia Institute of TechnologyPasadena, California
Atmospheric Infrared Sounder
© 2016, All rights reserved. California Institute of TechnologyGovernment sponsorship acknowledged
Test Case 2002-09-06 Granule 44Cloud Type
9/16/2016 10
National Aeronautics and Space Administration
Jet Propulsion LaboratoryCalifornia Institute of TechnologyPasadena, California
Atmospheric Infrared Sounder
© 2016, All rights reserved. California Institute of TechnologyGovernment sponsorship acknowledged
Test Case 2002-09-06 Granule 44Cloud Thermodynamic Phase
9/16/2016 11

National Aeronautics and Space Administration
Jet Propulsion LaboratoryCalifornia Institute of TechnologyPasadena, California
Atmospheric Infrared Sounder
© 2016, All rights reserved. California Institute of TechnologyGovernment sponsorship acknowledged
Test Case 2002-09-06 Granule 44Cloud Top Temperature (AIRS Team)
9/16/2016 12

National Aeronautics and Space Administration
Jet Propulsion LaboratoryCalifornia Institute of TechnologyPasadena, California
Atmospheric Infrared Sounder
© 2016, All rights reserved. California Institute of TechnologyGovernment sponsorship acknowledged
Test Case 2002-09-06 Granule 44Ice Cloud Top Temperature (Kahn)
9/16/2016 13

National Aeronautics and Space Administration
Jet Propulsion LaboratoryCalifornia Institute of TechnologyPasadena, California
Atmospheric Infrared Sounder
© 2016, All rights reserved. California Institute of TechnologyGovernment sponsorship acknowledged
Test Case 2002-09-06 Granule 44Ice Cloud Optical Depth (Kahn)
9/16/2016 14

National Aeronautics and Space Administration
Jet Propulsion LaboratoryCalifornia Institute of TechnologyPasadena, California
Atmospheric Infrared Sounder
© 2016, All rights reserved. California Institute of TechnologyGovernment sponsorship acknowledged
Test Case 2002-09-06 Granule 44Ice Cloud Effective Diameter (Kahn)
9/16/2016 15
National Aeronautics and Space Administration
Jet Propulsion LaboratoryCalifornia Institute of TechnologyPasadena, California
Atmospheric Infrared Sounder
© 2016, All rights reserved. California Institute of TechnologyGovernment sponsorship acknowledged
Test Case 2002-09-06 Granule 44Retrieved Tsurf
9/16/2016 16

National Aeronautics and Space Administration
Jet Propulsion LaboratoryCalifornia Institute of TechnologyPasadena, California
Atmospheric Infrared Sounder
© 2016, All rights reserved. California Institute of TechnologyGovernment sponsorship acknowledged
Test Case 2002-09-06 Granule 44Retrieved NSAT
9/16/2016 17
National Aeronautics and Space Administration
Jet Propulsion LaboratoryCalifornia Institute of TechnologyPasadena, California
Atmospheric Infrared Sounder
© 2016, All rights reserved. California Institute of TechnologyGovernment sponsorship acknowledged
Test Case 2002-09-06 Granule 44NSAT - Tsurf
9/16/2016 18
National Aeronautics and Space Administration
Jet Propulsion LaboratoryCalifornia Institute of TechnologyPasadena, California
Atmospheric Infrared Sounder
© 2016, All rights reserved. California Institute of TechnologyGovernment sponsorship acknowledged
V5 vs v6 AIRS clouds
Case study: V5 vs V6 clouds from the AIRS science team algorithm• V5 clouds had only one cloud top temperature/pressure per FOR; V6
clouds can be more independent per FOV• V6 has new “fall back” logic to get good clouds when the main physical
retrieval fails
Visualizing the differences:• Here we present simple “blink” tests, back and forth between the two• Other options include:
– Presenting both superimposed semi-transparent– Interactive/VR with user controlling transparency and and viewpoint
• In the future similar comparisons might be used to compare among:– This algorithm– Kahn– NUCAPS, CLIMCAPS, Irion, AER– CrIMSS, IASI, MODIS
9/16/2016 19

National Aeronautics and Space Administration
Jet Propulsion LaboratoryCalifornia Institute of TechnologyPasadena, California
Atmospheric Infrared Sounder
© 2016, All rights reserved. California Institute of TechnologyGovernment sponsorship acknowledged
V5
9/16/2016 20

National Aeronautics and Space Administration
Jet Propulsion LaboratoryCalifornia Institute of TechnologyPasadena, California
Atmospheric Infrared Sounder
© 2016, All rights reserved. California Institute of TechnologyGovernment sponsorship acknowledged
V6
9/16/2016 21

National Aeronautics and Space Administration
Jet Propulsion LaboratoryCalifornia Institute of TechnologyPasadena, California
Atmospheric Infrared Sounder
© 2016, All rights reserved. California Institute of TechnologyGovernment sponsorship acknowledged
V5 Cloud Type
9/16/2016 22

National Aeronautics and Space Administration
Jet Propulsion LaboratoryCalifornia Institute of TechnologyPasadena, California
Atmospheric Infrared Sounder
© 2016, All rights reserved. California Institute of TechnologyGovernment sponsorship acknowledged
V6 Cloud Type
9/16/2016 23

National Aeronautics and Space Administration
Jet Propulsion LaboratoryCalifornia Institute of TechnologyPasadena, California
Atmospheric Infrared Sounder
© 2016, All rights reserved. California Institute of TechnologyGovernment sponsorship acknowledged
V5 Cloud Top Temperature
9/16/2016 24

National Aeronautics and Space Administration
Jet Propulsion LaboratoryCalifornia Institute of TechnologyPasadena, California
Atmospheric Infrared Sounder
© 2016, All rights reserved. California Institute of TechnologyGovernment sponsorship acknowledged
V6 Cloud Top Temperature
9/16/2016 25

National Aeronautics and Space Administration
Jet Propulsion LaboratoryCalifornia Institute of TechnologyPasadena, California
Atmospheric Infrared Sounder
© 2016, All rights reserved. California Institute of TechnologyGovernment sponsorship acknowledged
Satellite track
• This animation flips through the first 20 granules of 2002-09-06, about 1.5 orbits.
• It is a teaser of what a more advanced animation along the satellite track might show
• It hints how much data we have access to and how much conditions vary.
9/16/2016 26

National Aeronautics and Space Administration
Jet Propulsion LaboratoryCalifornia Institute of TechnologyPasadena, California
Atmospheric Infrared Sounder
© 2016, All rights reserved. California Institute of TechnologyGovernment sponsorship acknowledged
20-granule animation
9/16/2016 27

National Aeronautics and Space Administration
Jet Propulsion LaboratoryCalifornia Institute of TechnologyPasadena, California
Atmospheric Infrared Sounder
© 2016, All rights reserved. California Institute of TechnologyGovernment sponsorship acknowledged
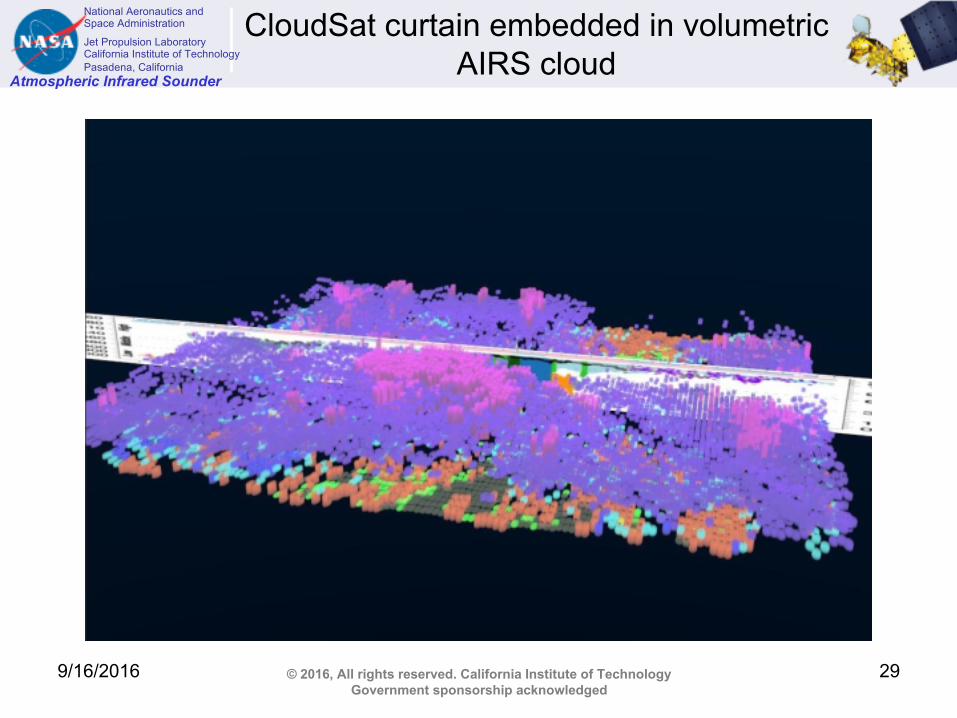
Comparing data sets
• One of the most important applications of 3D visualization is comparing data sets.
• For a sample we look at Cloudsat.• The image below (Sun Wong and Tau Wang) shows a CloudSat
“curtain” along with matched MODIS data
9/16/2016 28
National Aeronautics and Space Administration
Jet Propulsion LaboratoryCalifornia Institute of TechnologyPasadena, California
Atmospheric Infrared Sounder
© 2016, All rights reserved. California Institute of TechnologyGovernment sponsorship acknowledged
CloudSat curtain embedded in volumetric AIRS cloud
9/16/2016 29

National Aeronautics and Space Administration
Jet Propulsion LaboratoryCalifornia Institute of TechnologyPasadena, California
Atmospheric Infrared Sounder
© 2016, All rights reserved. California Institute of TechnologyGovernment sponsorship acknowledged
CloudSat curtain embedded in cut-away volumetric AIRS cloud
9/16/2016 30

National Aeronautics and Space Administration
Jet Propulsion LaboratoryCalifornia Institute of TechnologyPasadena, California
Atmospheric Infrared Sounder
© 2016, All rights reserved. California Institute of TechnologyGovernment sponsorship acknowledged
Animations
• Animations provide a good way to show a scene from multiple angles when full interactivity cannot be provided.
• This movie shows several simple 15-second animations around sample granules with different color schemes.
9/16/2016 31

National Aeronautics and Space Administration
Jet Propulsion LaboratoryCalifornia Institute of TechnologyPasadena, California
Atmospheric Infrared Sounder
© 2016, All rights reserved. California Institute of TechnologyGovernment sponsorship acknowledged
Animation reel
9/16/2016 32

National Aeronautics and Space Administration
Jet Propulsion LaboratoryCalifornia Institute of TechnologyPasadena, California
Atmospheric Infrared Sounder
© 2016, All rights reserved. California Institute of TechnologyGovernment sponsorship acknowledged
Richness/Interactivity Progression
• 2-D figures can show spatial patterns quite well
• 3-D figures add depth
• 3-D animation makes the depth more obvious and exposes different elements.
9/16/2016 33

National Aeronautics and Space Administration
Jet Propulsion LaboratoryCalifornia Institute of TechnologyPasadena, California
Atmospheric Infrared Sounder
© 2016, All rights reserved. California Institute of TechnologyGovernment sponsorship acknowledged
Richness/Interactivity Progression(2 of 3)
9/16/2016 34
A 3-D interactive environment lets users steer around and see what’s most important to them. Layers of information can be selectively highlighted or removed. This short movie was captured from a live session using WebGL.
Credit NASA JPL MIPL lab –Oleg Pariser, Victor Ardulov, Charles Thompson

National Aeronautics and Space Administration
Jet Propulsion LaboratoryCalifornia Institute of TechnologyPasadena, California
Atmospheric Infrared Sounder
© 2016, All rights reserved. California Institute of TechnologyGovernment sponsorship acknowledged
Richness/Interactivity Progression(3 of 3)
• Virtual Reality Provides perspective rendering.
• When an immersed viewer moves her head, the world responds as though it were actually before her.
• This feature provides improved perception of the relationship between objects based on that ability of moving one’s head to see the data from a new perspective.
• VR also is ideally suited for looking at the datasets from many different directions and provides the ability to render important details in front and center while at the same time allowing for a larger contextual data display.
9/16/2016 35
National Aeronautics and Space Administration
Jet Propulsion LaboratoryCalifornia Institute of TechnologyPasadena, California
Atmospheric Infrared Sounder
© 2016, All rights reserved. California Institute of TechnologyGovernment sponsorship acknowledged
Tools
• Python is a modern language that is used here to read AIRS data and create cloud objects for Blender.
• Blender is an open-source modelling program which has an embedded interface to python. With that, it is possible to script the modeling/creation of lights, objects, and cameras and create still and dynamic renders
• Unity is a game engine which also comes with an IDE. Scripts can be used to control properties such as a camera’s viewing angle from sensor data of VR headsets.
• WebGL (Web Graphics Library) is a JavaScript API for rendering interactive 3D computer graphics and 2D graphics within any compatible web browser without the use of plug-ins. [wikipedia]
• VR hardware supported: Oculus Rift, HTC Vive, GearVR by Samsung
9/16/2016 36

National Aeronautics and Space Administration
Jet Propulsion LaboratoryCalifornia Institute of TechnologyPasadena, California
Atmospheric Infrared Sounder
© 2016, All rights reserved. California Institute of TechnologyGovernment sponsorship acknowledged
3D Clouds -- Possible Applications
• NSSTM badges
• Science– Data exploration– Inter-instrument comparisons
• Algorithm development support
– Cloud algorithms– Cloud clearing & through it,
everything
• GES DISC DAAC browse images
• AWIPS terminals
• Direct broadcast
• Public outreach– Perhaps make the clouds
puffier and/or volumetric– Perhaps repair retrieval
artifacts– Formats include:
• Red/cyan glasses• Lenticular• Animations• VR
9/16/2016 37
National Aeronautics and Space Administration
Jet Propulsion LaboratoryCalifornia Institute of TechnologyPasadena, California
Atmospheric Infrared Sounder
© 2016, All rights reserved. California Institute of TechnologyGovernment sponsorship acknowledged
Future directions
• Bring in more sources of information– Clouds from other sources
• Other AIRS algorithms• CrIMSS• MODIS• CloudSat• …
– Other geophysical fields• AIRS q, T, O3, tropopause, boundary layer top, etc.• Wind, Psurf,
– Requires georeferencing
• Make images/animations of more than 1 granule– 2-3 granules– Orbital track– Daily and monthly maps
• Share tools to make 3D images and animations
• Interactive / virtual reality
9/16/2016 38

National Aeronautics and Space Administration
Jet Propulsion LaboratoryCalifornia Institute of TechnologyPasadena, California
Atmospheric Infrared Sounder
© 2016, All rights reserved. California Institute of TechnologyGovernment sponsorship acknowledged
References
Miller, S. D., and Coauthors, 2014: Estimating three-dimensional cloud structure via statistically blended satellite observations. J. Appl. Meteor. Climatol., 53, 437–455, doi:10.1175/JAMC-D-13-070.1.
S. L. Nasiri, B. H. Kahn, and H. Jin, "Progress in Infrared Cloud Phase Determination Using AIRS," in Advances in Imaging, OSA Technical Digest (CD) (Optical Society of America, 2009), paper HWA3.
9/16/2016 39

National Aeronautics and Space Administration
Jet Propulsion LaboratoryCalifornia Institute of TechnologyPasadena, California
Atmospheric Infrared Sounder
© 2016, All rights reserved. California Institute of TechnologyGovernment sponsorship acknowledged
9/16/2016 40