manual herbalife para medicos- english
TRANSCRIPT

5/7/2018 Manual Herbalife Para Medicos- English - slidepdf.com
http://slidepdf.com/reader/full/manual-herbalife-para-medicos-english 1/72
PHYSICIAN’S REFERENCE
MANUAL

5/7/2018 Manual Herbalife Para Medicos- English - slidepdf.com
http://slidepdf.com/reader/full/manual-herbalife-para-medicos-english 2/72
3rd Edition, 2007, Herbalife International, Inc.
Copyright: David Heber, M.D., Ph.D.Chairman, Herbalife Scientific and Nutrition Advisory Boards
This manual is not intended for the purpose
of preventing, diagnosing, or treating any
illness or disease. It is intended solely as a
source of information about Herbalife’s
nutritional programs. The products and
programs mentioned in this manual are
represented as foods or food supplements and
not being represented by Herbalife
International or its scientific and nutrition
advisors as being medical treatments or cures,
nor are they considered to be substitutes for
proper medical diagnosis or treatments.
This manual is intended for physicians
and health professionals as a guide to the
science of nutrition behind Herbalife’s
products and programs. The information
contained in this manual does not cover all
possible uses, actions, precautions, sideeffects, and interactions. It is not intended as
medical advice for individual problems.
Liability for individual actions or omissions
based upon the contents of this manual is
expressly disclaimed.
Please note

5/7/2018 Manual Herbalife Para Medicos- English - slidepdf.com
http://slidepdf.com/reader/full/manual-herbalife-para-medicos-english 3/72
Dear Colleague ,
Obesity is the number one nutritional problem in the world today, yet our medical
offices are not set up to deal with this epidemic that costs the health care system over
$130 billion a year. Many of your patients with diabetes, hypertension and heart
disease could benefit from a program to achieve and maintain a healthy body weight.
Despite all the drugs and surgical options for weight management available today, the
most cost-effective method of fighting this epidemic in your office is to engage your
patients using a method that works and that works for your practice.
Herbalife International–a publicly traded company listed on the New York Stock
Exchange and a leader in nutrition and weight loss for over 27 years, with $3 billion in
revenues yearly–invites you to become an Independent Distributor. You have a built-in
referral base in the patients coming into your practice every day, and Herbalife willprovide you with a business system that will enable you to help your patients, engage
your office staff and improve the economics of your practice in three ways. First, your
patients with common co-morbidities of obesity–including diabetes, hypertension and
heart disease–may require less costly medications at their ideal weight. In today’s
capitated care environment, that can make your practice much more profitable while
increasing patient satisfaction. Second, your patients will pay your office staff for the
use of supplements that are customized to their needs based on their metabolism, and
your practice will make a reasonable profit on these products. Finally, some of your
most dedicated and successful patients will want to share their success with their
friends and family, leading to more referrals to your practice, which will now have a
reputation for expertise in weight management and nutrition.
A recent survey done in the UCLA Primary Care Network found that 50 percent
of patients in typical practices were obese with a body mass index over 30. Among these
patients, almost 60 percent had low back pain, 20 percent had high cholesterol,
20 percent had diabetes, and 5 percent had sleep apnea. Yet the average primary care
practitioner finds the busy practice environment unable to accommodate a weight-
management and nutrition program. Doctors in Herbalife was developed by Herbalife
International to meet the need for a program that works both medically and financially
for busy primary care practitioners. Doctors in Herbalife is based on concepts developed
by David Heber, M.D., Ph.D., professor of medicine and public health at UCLA* and
director of the Center for Human Nutrition at the David Geffen School of Medicine at
UCLA*. Dr. Heber is chairman of both the Scientific and Nutrition Advisory Boards at
Herbalife International and directs an international group of scientific and nutrition
advisors.
Setting up a weight-management center in your office is fast, easy and profitable.
Your patients will see results and live healthier lives. You will be increasing your
practice revenue with many possibilities for international travel as you grow your
business at home.
A Letter to Doctors from Herbalife
*Dr. Heber’s name and title are for identification purposes only. The University of California does not endorse
specific products or services as a matter of policy.

5/7/2018 Manual Herbalife Para Medicos- English - slidepdf.com
http://slidepdf.com/reader/full/manual-herbalife-para-medicos-english 4/72
Doctors who currently use the Herbalife program design a quick and easy weight-
management program for their patients. Patients lose weight under medical supervision
while using some of the best foods and food supplement products on the market. As
patients achieve success, practice revenue grows. Your local involvement builds your
practice, and there are many international opportunities to grow and expand as
Herbalife is sold in 65 different countries worldwide.
This state-of-the-art program, offered to you by an industry leader with a history
of over 27 years in weight management and based on the best science available in
weight management and nutrition, will help you to provide a comprehensive program
to support your patients’ health while you improve the financial health of your
practice. Please feel free to email us with any further questions [email protected].
Sincerely,
..
PHYSICIAN’S REFERENCE MANUAL
Luigi Gratton, M.D., M.P.H.
Vice President,
Medical Affairs and Education
David Heber, M.D., Ph.D., F.A.C.P., F.A.C.N.
Chairman,
Scientific and Nutrition Advisory Boards

5/7/2018 Manual Herbalife Para Medicos- English - slidepdf.com
http://slidepdf.com/reader/full/manual-herbalife-para-medicos-english 5/72
A. Philosophy and History of Herbalife International 8B. What Is the Rationale Behind Doctors in Herbalife? 9C. Cellular Nutrition 10D. Herbalife ShapeWorks® Program 11
A. History and Future of Nutritional Science and Medicine 13B. Fundamentals of Nutrition 16B.1 Fundamentals of Cellular Nutrition 16B.2 Quality of the Diet: Good vs. Bad 16B.3 Energetics and Obesity 17B.4 Protein and Its Role in Cellular Nutrition 17B.4.1 Protein Quality 17B.4.2 Protein Requirements 19B.4.3 Optimum Protein Intake 19B.4.4 Protein’s Role in Satiety 20
B.5 Fats in Cellular Nutrition 21B.5.1 Fatty Acid Structure and Classification 21B.5.2 Fatty Acids as Cellular Signals 22
B.6 Carbohydrates in Cellular Nutrition 23B.6.1 Sugars and Starches 23B.6.2 Glycemic Index and Glycemic Load 24
B.7 Functional Foods 28B.7.1 Soy Protein 28B.7.2 Phytochemical-Rich Fruits, Vegetables and Grains 28B.7.3 Beyond the Four Food Groups 32
C. Vitamins and Minerals 38C.1 Introduction 38C.2 Pregnancy and Birth Defects 38C.3 Immune Function 39C.4 Cardiovascular Disease 39C.5 Cancer 40C.6 Obesity and Diabetes 41C.7 Safety of Vitamins 42
D. Weight Management and Meal Replacement 44D.1 Definition of Obesity 44D.2 Causes of Obesity 44D.3 Body-Fat Regulation and Function as an Endocrine Organ 45D.3.1 Female Fat 45
D.3.2 Abdominal Fat 46D.3.3 Brain Centers and Body Fat 46D.3.4 Genes and Obesity 48D.4 Meal Replacements 49D.4.1 History of Meal Replacements 49D.4.2 Nutrient Composition of Herbalife Formula 1 and High-Protein/
Low-Carb Drink Mix 50D.4.3 Clinical Research on Meal Replacements 50D.4.4 Recent Research on ShapeWorks® (Abstract) 52
E. Body Composition 55E.1 Classification According to Lean-Body Mass 55E.2 RMR and Predicted Weight Loss from Lean Body Mass 56E.3 Basic Science Behind Bioimpedance 56
SECTION IINTRODUCTION
Section IIBACKGROUND
Contents

5/7/2018 Manual Herbalife Para Medicos- English - slidepdf.com
http://slidepdf.com/reader/full/manual-herbalife-para-medicos-english 6/72
E.4 Challenges in the Clinical Use of Bioelectrical Impedance 58E.5 Future Research and Other Methods 58
F. The Safety of Caffeine and Its Effects in Weight Management 60
F.1 What is Caffeine? 60F.2 Coffee Consumption 61F.3 Caffeine Safety 61F.4 Fibrocystic Breast Disease and Caffeine Consumption 62F.5 Osteoporosis and Caffeine Consumption 62F.6 Caffeine and Blood Cholesterol 63F.7 Caffeine and Blood Pressure 63F.8 Caffeine and Heart Disease 63
G. Metabolic Syndrome and the Co-morbidities of Overweight and Obesity 64G.1 Diabesity 65G.2 Heart Disease and Hypertension 65G.3 Fatty Liver Disease and Cirrhosis 66G.3.1 Diagnosing Fatty Liver Disease 66
G.3.2 Other Causes of Fatty Liver and Liver Failure 66G.4 Cancer 67G.5 Changes with Aging in Body Fat and Chronic Disease Risk 68
PHYSICIAN’S REFERENCE MANUAL
5/7/2018 Manual Herbalife Para Medicos- English - slidepdf.com
http://slidepdf.com/reader/full/manual-herbalife-para-medicos-english 7/72
SECTION I: INTRODUCTION
A.PHILOSOPHY AND HISTORY OFHERBALIFE INTERNATIONAL
Herbalife International is a unique company that has a worldwide mission of changing
people’s lives through improved lifestyles, nutritional health and weight management.
This company, now traded on the New York Stock Exchange (symbol HLF), is the
largest manufacturer of meal replacements in the world, with over 1.6 million
Distributors in 65 countries.
How did Herbalife grow to this position as an international leader in nutrition?
Herbalife was founded in 1980 by Mark Hughes. At the time, this remarkable individual
was only in his 20s, but he had the passion to bring healthy weight-loss solutions to the
world after his mother died of complications from taking diet pills.
In his first year of business, he was able to sell $1 million of meal replacements
from the trunk of his car by offering people the opportunity to both lose weight and
make money by helping others. However, the company did more than give people a
chance to make money. Mark Hughes inspired people to change for the better in many
ways. He taught them to speak in front of groups as they received recognition. He
taught them to train others to do the same job and learn business and leadership skills
in the process.
The critical issue in weight management is adherence to diet and lifestyle change.
In our best universities, the average weight loss achieved in any trial is on the order of
5 percent of initial body weight on average, with dropout rates from clinical trials of
between 20 percent and 40 percent after one year. However, in these trials there are
always individuals who do much better than the average and some who gain weightdespite being given all of the nutritional and lifestyle tools to be successful. The key
difference between those who succeed and those who fail is found in their personal
motivation and ability to change themselves.
Through hard work and person-to-person contact, Herbalife Independent
Distributors from every walk of life move up through the ranks, at first helping their
family and friends and then developing the skills to run a small business. Through
training they can reach leadership positions in the company as President’s Team and
Chairman’s Club members. These individuals with innate business skills often have little
or no formal education, or have been unsuccessful in other businesses before coming to
Herbalife. However, by combining product results, recognition and a sense of community,
Herbalife has helped countless individuals change their health status through long-lasting
weight loss and maintenance. In the process, Herbalife has developed an army of over1.6 million agents of change throughout the world, and one of the most powerful
weapons in the war against the international epidemic of obesity.
Herbalife International was acquired from the estate of Mark Hughes in 2003 by
the investment banking firms of Whitney and Golden Gate, and is led by Chairman
and CEO Michael O. Johnson, former head of Disney International, and President and
COO Gregory Probert. Chief Scientific Officer Steven Henig, Ph.D., has an over 20-year
history in the food business, which included positions with Con-Agra, Ocean Spray ®*
and POM Wonderful®†, and was a member of the Board of Directors of the International
8
Section l Introduction
*Ocean Spray® is a registered trademark of Ocean Spray Cranberries, Inc.†POM Wonderful® is a registered trademark of POM Wonderful, LLC.

5/7/2018 Manual Herbalife Para Medicos- English - slidepdf.com
http://slidepdf.com/reader/full/manual-herbalife-para-medicos-english 8/72
Life Sciences Institute (ILSI). A prestigious Scientific Advisory Board is led by David
Heber, M.D., Ph.D., F.A.C.P., F.A.C.N., professor of medicine and public health and
director of the prestigious UCLA Center for Human Nutrition. Louis Ignarro, Ph.D.,
winner of the 1998 Nobel Prize for Physiology or Medicine, is a member of the board.
Under the leadership of Dr. Heber, Luigi Gratton, M.D., M.P.H., a clinical physician at
the University of California, Los Angeles (UCLA), administers a worldwide Nutrition
Advisory Board made up of highly qualified physicians, often with current or formerprestigious university affiliations, who work in the training of Herbalife Independent
Distributors in science-based approaches to nutrition and weight management.
B.WHAT IS THE RATIONALE BEHIND
DOCTORS IN HERBALIFE?Over the past 27 years, several hundred physicians in the United States alone, and
many others throughout the world, have discovered that they can help far more
individuals to attain and maintain a healthy lifestyle through their activities as HerbalifeDistributors than through their routine medical practice. It is very difficult to motivate
patients to achieve and maintain a healthy body weight even when you are able to take
the time to do this important job. Too often, prescriptions for drugs to lower cholesterol,
blood pressure or blood sugar take the place of lifestyle change precisely because long-
term adherence to diet and lifestyle is so problematic.
The Doctors in Herbalife initiative is meant to accelerate the Herbalife mission of
changing people’s lives by recruiting practicing doctors to be Herbalife Distributors. As
physicians, you have a constant stream of patients coming to your office who could
benefit from diet and lifestyle change. However, your education, your facilities,
reimbursement mechanisms and time constraints all make it impossible for you to
deliver this service within a traditional practice. What is rewarded is the prescription of
medications for lowering cholesterol, blood pressure and blood sugar, or referring
patients for expensive cardiovascular or bariatric surgery.
Surveys done within the UCLA Primary Care Network have shown that over
50 percent of patients are obese with BMIs of greater than 30. Among these, 58 percent
have musculoskeletal pain, such as knee or back pain. Subgroups of patients amounting
to 20 percent to 40 percent each of the total population have metabolic syndrome,
hyperlipidemia, hypertension or abnormal glucose tolerance. About 5 percent have
sleep apnea, which can be fatal. Many of these problems respond to lifestyle change,
improved nutrition and weight loss. The Diabetes Prevention Program funded by the
National Institutes of Health (NIH), demonstrated that a modest 5 percent weight loss
among individuals with impaired glucose tolerance led to a 58 percent reduction in new
cases of type 2 diabetes over a five-year period.Meal replacements work. The scientific data is presented in this manual in detail
and has appeared in the peer-reviewed medical literature. The NIH LookAHEAD trial,
examining the impact of weight loss on cardiovascular mortality in patients with
type 2 diabetes, is successfully utilizing this strategy. The Herbalife ShapeWorks®
program described in this manual applies the latest nutritional science on weight
management to provide a personalized approach based on individualizing protein
recommendations and on lean body mass. When this science-based approach is
combined with the motivational tools developed by Herbalife, successful individuals
achieve remarkable results.
Herbalife has committed to a worldwide program of outreach to the medical and
scientific communities through medical meetings and presentations at key medical
PHYSICIAN’S REFERENCE MANUAL

5/7/2018 Manual Herbalife Para Medicos- English - slidepdf.com
http://slidepdf.com/reader/full/manual-herbalife-para-medicos-english 9/72
SECTION I: INTRODUCTION
conferences. Through the Scientific and Nutrition Advisory Board and Doctors in
Herbalife, it will be possible to build an international medical alliance dedicated to
providing healthy nutrition solutions. The power of the Internet and high tech is being
coupled with the “high touch” of Herbalife Distributors worldwide to create
unprecedented efforts to prevent the spread of the international epidemics of obesity
and obesity-associated chronic diseases.
C.CELLULAR NUTRITION
Good nutrition begins at the cellular level. Not only must the nutrients be delivered,
but they must get to the appropriate cells of the body. These principles are the basis for
Cellular Nutrition. Cellular Nutrition is the overriding nutritional philosophy of
Herbalife International. A fully referenced section on Cellular Nutrition and the
Fundamentals of Human Nutrition is included in Section II of this manual.
Today, throughout the world, people are facing a lack of vital nutrients that their
cells need for good health. This occurs even in countries where overweight and obesity
are common. In the past 100 years, the human diet has changed drastically in ways that
do not fit well with our genes. Our cells are adapted to a calorie-poor environment rich
in bioactive substances from colorful fruits and vegetables, and high in dietary fiber and
healthy plant-based proteins. Our genes cannot change rapidly enough through
evolution to enable us to adjust in only the past few hundred years to a diet missing
key cellular nutrients.
For example, humans and fruit-eating bats have given up the cellular machinery
to make Vitamin C, since both our diets and those of fruit-eating bats were originally
rich in Vitamin C from plant foods. Unfortunately many individuals in the United
States go all day without eating a single piece of fruit, and so do not get enough
Vitamin C for optimum health. They often can get the tiny amount (20 milligrams)
needed to prevent scurvy from fortified foods, but not enough to get the antioxidant benefits of this essential vitamin.
Similarly, many different pathways promote retaining calories when excess food is
eaten. The key element in reaching a successful body composition is not simply eating
less but eating more of the right foods. Significant scientific evidence supports a high-
protein/low-fat diet, including meal replacements such as Herbalife’s ShapeWorks®
Formula 1, fortified (when necessary) with Performance Protein Powder, which
provides additional protein to help control hunger and support increasing muscle mass
with exercise. ShapeWorks® meal replacements taken twice a day with a healthy meal
and exercise leads to weight loss, while one meal replacement per day with two meals
and exercise can help keep weight off for life. Meal replacements work by structuring
the diet so that the healthy shake is providing better control of hunger and more
protein to support the lean body mass than do the foods normally eaten at meal time.
However, these shakes are taken in addition to at least one healthy meal per day, and
Herbalife includes a healthy, colorful meal plan recommending seven servings of fruits
and vegetables each day.
While it was generally taught in medical schools for some 20 years that the so-called
“four basic food groups” provided all the nutrition the body needed, this was not true.
Significant research, which will be reviewed in this manual, demonstrates that most
Americans are not getting what they need from their diet, and that nutritional
supplements are a useful prevention strategy for the general population.
Of course, nutritional supplements work best when combined with a healthy diet
and lifestyle. Nutritional supplements help you obtain vitamins, minerals, proteins and10

5/7/2018 Manual Herbalife Para Medicos- English - slidepdf.com
http://slidepdf.com/reader/full/manual-herbalife-para-medicos-english 10/72
other nutrients frequently missing from modern diets. Multivitamin supplements, protein
supplements, individual mineral and vitamin supplements (provided alone or in
combination), as well as botanicals, amino acids, and other forms of supplementation, are
being used by millions of consumers around the world.
Herbalife International has been providing nutritional supplements to over
1.6 million Distributors in 65 countries and is making a positive contribution to the
lives of millions around the world. With over 27 years of experience in providing thefinest nutritional supplements available, Herbalife is changing the health of the world,
one person at a time.
D.HERBALIFE ShapeWorks® PROGRAM
Over the past 27 years, Herbalife International has become the leading global
manufacturer of meal replacements for healthy nutrition and weight management. The
goal of weight management is to achieve and maintain not only a healthy weight, butalso a healthy shape. Shape is critical to achieving the health goals of weight
management, since shape includes the concept of body-fat distribution, optimizing lean
body mass and getting into a proper level of fitness. Shape means both body shape and
“getting into shape,” and so provides a valuable tool for communicating the benefits of
a healthy diet and lifestyle, regardless of body weight.
It is not simply the weight of the body that determines health, but the quality of
the body tissues in terms of lean versus fat. Simply because an individual is overweight,
normal weight, or underweight is not neccessarily a gauge of his or her nutritional
balance. Weight loss can lead to loss of lean body mass, which occurs during
unsupplemented starvation and with hypocaloric diets that are deficient in protein.
A body of scientific research is demonstrating that increased protein provided at
about one gram per pound of lean body mass (29 percent of resting metabolic rate)provides better control of hunger and maintains lean body mass better than the usually
recommended amount of protein, which is about 15 percent of total calorie intake. In
addition to research at UCLA which forms the basis for the ShapeWorks ® program,
recent studies in Australia and in Colorado demonstrate that increased protein may
be especially useful for promoting weight loss in the pre-diabetic, insulin-resistant,
obese individual.
Many Americans take in too little protein and lead a sedentary lifestyle, resulting
in loss of muscle and increase in fat or sarcopenic obesity. Attempts at rapid weight loss
by eating less of their favorite foods results in deficiencies of multiple nutrients, which
usually includes protein. In this common condition, lean tissue is deficient and
the percentage of body fat is high (>30 percent), despite a normal Body Mass Index
(BMI). Similarly, weight lifters can be overweight with a high BMI but have a normal
body-fat percentage. Their increased weight is due to increased muscle tissue, and they
require increased protein based on their lean mass, both to control hunger and
maintain muscle.
The rate at which weight is lost is a function of how much of a calorie deficit is
created from the calories required to maintain current weight. For every 500 cal/day
deficit created through calorie restriction, increased physical activity or some
combination of the two, there will be a one-pound weight loss per week. Increased
protein intake does not make weight loss more rapid, but it does result in better
maintenance of lean body mass at the same rate of weight loss when compared to a
lower protein intake. Starvation is the extreme, in which about one pound of body
PHYSICIAN’S REFERENCE MANUAL
1

5/7/2018 Manual Herbalife Para Medicos- English - slidepdf.com
http://slidepdf.com/reader/full/manual-herbalife-para-medicos-english 11/72
SECTION I: INTRODUCTION
protein is lost for every four pounds of weight lost. With exercise and increased protein
intake during weight loss, it is possible to minimize the loss of lean body mass.
Some thin women will gain weight when given adequate protein, due to an
increase in muscle mass. They may not be happy with this, and it is their choice to
remain at a lower muscle mass. However, in order to keep their body-fat percentage in
a healthy range, these women will need to burn calories daily with aerobic exercise and
carefully watch their food intake to minimize total calorie intake. Their lower musclemass means that they will need fewer calories to maintain their tiny shape.
The ultimate secret ingredient in this program is the care that each Herbalife
Distributor provides to their customers. Herbalife International provides many
resources in the form of pamphlets, DVDs and educational materials, as well as
downloadable Web-based information, to help Distributors provide the best care for
their customers. It is our hope that this manual will help you in your efforts as a Doctor
in Herbalife Distributor.
12

5/7/2018 Manual Herbalife Para Medicos- English - slidepdf.com
http://slidepdf.com/reader/full/manual-herbalife-para-medicos-english 12/72
A.HISTORY AND FUTURE OFNUTRITIONAL SCIENCE AND MEDICINE
The understanding of human nutrition has evolved throughout history in parallel to
the development of key sciences, including chemistry, biochemistry and physiology.
During the “Naturalistic Era” (400 BC–1750 AD), Hippocrates hypothesized about the
body’s “innate heat” and coined his famous phrase, “Let food be your medicine and
medicine be your food.” During the next 500 years, little happened in either the
development of scientific knowledge or nutritional science. However, the level of
knowledge that could be gleaned from careful clinical observation of the effects of foods
on physiological function was remarkable, as typified in the writings of Maimonides in
the 11th century.
The late 1700s ushered in the “Chemical-Analytical Era” (1750–1900), highlighted by Lavoisier’s calorimetry studies (McCollum, 1957). He discovered how food is
metabolized by oxidation to carbon dioxide, water and heat. He also invented the
calorimeter, crucial to further understanding heat energy. In the 19th century, Liebig
recognized that carbohydrates, proteins and fats are oxidized by the body, and he
calculated energy values for each. While chemists were examining the composition of
foods and metabolism, physicians were studying the mechanisms and process of
digestion–the means by which food is converted to useful, oxidizable components.
The “Biological Era” (1900–present) was founded on advances in chemistry,
biochemistry and the understanding of the metabolic pathways. In the early 20th century,
considerable research had been done on energy exchange and on the nature of foodstuffs.
Nutritional science took a leap forward, as evidenced by publication of the “laws of
nutrition” by Langworthy. Once understanding of macronutrients was developed and
better tools were developed, nutritional scientists turned their attention to the
understanding of micronutrients–vitamin and mineral nutrition (Pike and Brown, 1975).
The “Cellular Era” of the late 20th century (after 1955) focused on understanding
the functions of essential nutrients and the roles of micronutrients (vitamins and
minerals) as cofactors for enzymes and hormones, and their subsequent roles in
metabolic pathways. The roles of carbohydrates and fats in diseases such as diabetes and
atherosclerosis were discovered, and actual and potential mechanisms have been
uncovered (University of Vermont).
Today we are still in the era of Cellular Nutrition, but the coming era of “Molecular
and Cellular” is developing in the 21st century. It has been spurred on by the
sequencing of the human genome, but is not yet ready for application. Here is a glimpseof the future as Herbalife International uses its high-tech and international reach to
change lives around the world.
Observations of health and disease in the 20th century raised some new questions.
Why can some individuals consume high-fat diets and yet show no evidence of
atherosclerotic disease? Genetic differences certainly were suspected, but elucidating
and proving cellular, molecular and ultimately genetic-level mechanisms in both
healthy and unhealthy individuals proved to be a challenge. With the continuing
developments in tools that enable molecular-level exploration of cause-effect
phenomena, scientists have begun to develop hypotheses and conduct experiments to
lay the foundation for a deeper level of understanding of gene-nutrient interactions.
PHYSICIAN’S REFERENCE MANUAL A
1
Section II Background Material

5/7/2018 Manual Herbalife Para Medicos- English - slidepdf.com
http://slidepdf.com/reader/full/manual-herbalife-para-medicos-english 13/72
Today, an emerging field of nutritional research focuses on identifying and understanding
molecular-level interaction between nutrients and other dietary bioactives with the
human genome during transcription, translation and expression–the processes during
which proteins encoded by the genome are produced and expressed.
The UCLA Center for Human Nutrition and the Mark Hughes Cellular and
Molecular Nutrition Laboratory are at the cutting edge of this new science. Continuing
and accelerating discoveries in genomics present possibilities for an ever more dynamicera of scientific investigation based on understanding the effects of nutrients in
molecular-level processes in the body, as well as the variable effects nutrients and non-
nutritive dietary phytochemicals have on each of us as individuals. We call this new era
in nutritional science the “Genetic Era,” or nutrigenomics. There is a coming revolution
in the way nutrition and diet are viewed.
Enabling science and technology platforms and techniques are essential for
development of knowledge and advancements in science. However, the ultimate result
will require both high tech and “high touch.” The latter involves behavior and lifestyle
changes best performed on an individualized basis. What do we know about behavior that
makes Herbalife such a powerful approach?
The National Weight Control Registry includes a group of more than 3,000 men and
women who have been classified as “successful losers.” Wing and colleagues and Klemstudied these individuals and found that their long-term success was due to a
combination of a healthy, low-fat diet and regular, moderate exercise. The ShapeWorks®
program is based on sound science and the latest advances in formulating a low-fat/high-
protein diet and incorporating fitness into future messaging and image. Second, we know
that our success as physicians in a clinical setting is typically poor, with up to 50 percent
dropouts at one year.
We know what the signposts of success are. They include readiness to change, and
a step-wise approach to lifestyle change. These principles were built into the successful
Herbalife programs over the last 27 years. Moreover, they have always been based on a
proven way to enhance compliance. Meal-replacement shakes organize the diet and
simplify long-term adherence. As discussed in this background section, there is significant
evidence that higher protein levels than recommended for the general population are
particularly useful in weight management, both to control hunger and maintain lean
body mass. However, these physiological principles would be useless without the proper
behavioral approach.
A Glimpse at the Future of Nutritional Medicine
• Individual genetic differences in response to dietary components
have been evident for years: lactose intolerance, alcohol dehydrogenase
deficiency, individual and population differences in blood lipid profiles and
health outcomes after consumption of high-fat diets.
• Genomic information—including proteomics and SNPs—will be usedto understand the basis of individual differences in response to dietary
patterns.
• The resulting nutrigenomic data also will provide a sound basis for
development of safe and effective diet therapies for individuals or
subgroups of the population.
• Refined models of disease mechanism based on understanding the
genome may provide new lines of research and possibly new diets. The
elaboration of physical and genetic linkage maps combined with techniques
to catalog massive databases of genetic information will uncover genes that
may interact with diet to influence disease.
SECTION II: BACKGROUND
14
A

5/7/2018 Manual Herbalife Para Medicos- English - slidepdf.com
http://slidepdf.com/reader/full/manual-herbalife-para-medicos-english 14/72
“Personalized medicine” developed through growing knowledge of genomics has
generated a lot of well-deserved enthusiasm as an important tool for the future, but it
will require a personalized behavioral approach as well.
Who will do this? Public health officials will continue to issue vague “one size fits
all” solutions and will necessarily need to run these through the funnel of special
interests that distort nutritional advice given to the public. The drug industry, while
recognizing that nutrition may play a role, minimizes this and uses the generalgovernment guidelines in patients given drugs to ameliorate conditions driven by diet
and lifestyle, such as hypertension, hypercholesterolemia and diabetes. Food processors
marketing mainstream products will wait a long time for the products to be created and
the demand to be established.
At the present time, Herbalife International can provide you with a unique
opportunity to impact your patients and your practice using a high-tech and high-touch
approach. With the resources of a $3 billion company in 65 countries and with over
1.6 million “agents of change,” what a unique opportunity for you as a Doctor in
Herbalife to “ride the wave” of the coming advances in nutrition that will change the
way you practice medicine. You will begin to appreciate the power of the personal
touch in lifestyle change, and you can enlist the help of successful staff and patients to
help you in the mission of changing people’s lives one at a time and hundreds at a time.You will learn how you can duplicate your expertise and spread a message of health. If
you take on this challenge, you will gain satisfaction and enhance your clinical practice.
At the same time, you will be acting within the highest ethical standards of physicians
who have an obligation, not simply to prescribe drugs and surgery for the treatment of
disease, but to use the resources available to motivate and follow their patients as they
prevent disease through changes in diet and lifestyle.
REFERENCES“A History of Nutrition,” E.V. McCollum 1957 QU 145 McCol.
Nutrition; An Integrated Approach, Ruth Pike and Myrtle Brown, John Wiley & Sons, 1975, pp 4-8.“Fundamentals of Nutrition,” Course Syllabus, University of Vermont.
Biospace.com “Pharmacogenomic Medicine: Technology Outpacing the Health Care System.”
AAAS symposium on “Gene-diet Interactions in Coronary Heart Disease,” AHA press release 2/14/98.
“Attenuated hypercholesterol response to a high-cholesterol diet in subjects heterozygous for the apolipoprotein A-IV-2 allele,” Weiberget al, N Engl J Med, Vol. 331, No.11, pp 706-710.
“Attacking Heart Disease at Its Genetic Base,” Agricultural Research, 7/99.
Autism and Schizophrenia: Intestinal Disorders, Cade R et al. Nutritional Neuroscience, in press 1999.
Symposium: Interactions of diet and Nutrition with Genetic Susceptibili ty in Cancer, Journal of Nutrition, Vol. 129, 2/99, pp 550S-551S.
PHYSICIAN’S REFERENCE MANUAL A
1

5/7/2018 Manual Herbalife Para Medicos- English - slidepdf.com
http://slidepdf.com/reader/full/manual-herbalife-para-medicos-english 15/72
SECTION II: BACKGROUND
B.FUNDAMENTALS OF NUTRITION
B.1 FUNDAMENTALS OF CELLULAR
NUTRITIONDiets are made up of numerous foods in varied proportions that are prepared in many
different ways, but ultimately the purpose of foods is to contribute energy to the body
to support basic cellular energy needs. How that energy is provided as foods which are
made up of the basic macronutrients–protein, carbohydrate and fat–plays a major role
in determining the impact of dietary patterns on health and disease. Within each
category of macronutrient, there are marked differences in how different food sources
are digested, absorbed and metabolized. It is critical to understand the impact of the
specific food sources of these macronutrients.
Foods can be grouped according to their content of macronutrients combined with
their traditional use in an ethnic or societal geographic cuisine. Food groupings such as
the basic four food groups [1) Grains and Cereals, 2) Fruits and Vegetables, 3) Meat,
Beans, Nuts and Cheese and 4) Dairy Products] classify foods of very different
compositions together (such as red meat and ocean-caught fish, or muffins and whole-
grain bread). However, considerations of chemical structure, digestibility, metabolism
and functionality contribute to what is called the quality of the diet overall, as well as
for individual macronutrients.
B.2 QUALITY OF THE DIET:
GOOD VS. BADThe quality of dietary macronutrients, such as the ratio of n-3 fatty acids to n-6 fatty
acids or of whole grains to refined grains, complicates the basic considerations of the
effects of diet on the incidence of chronic diseases and efforts to organize dietary
interventions designed to reduce risk. An additional and important consideration is
the presence of phytochemicals in fruits, vegetables and whole grains leading to their
designation in some cases as functional foods. The term functional food indicates the
presence of bioactive substances that affect physiology or cellular and molecular
biology.
The term quality implies that a value judgment is being leveled against a
particular food. While there is a hierarchical ranking of fats, carbohydrates and
proteins common to the disease-prevention literature, the mechanisms underlying the
differences among foods that provide protein, fat and carbohydrate to the diet are
simply analyzed in light of fundamental principles of nutrition. Taken together, these
aspects of foods contribute to the assessment of the quality of the diet. The lowest
quality foods are called “junk foods,” since they are high in energy density but low in
nutrient density (e.g., French fries). It has been said that there are no junk foods
but simply “junk diets.” Obviously, if one combines enough junk foods, it results in a
junk diet.16
B - B.2

5/7/2018 Manual Herbalife Para Medicos- English - slidepdf.com
http://slidepdf.com/reader/full/manual-herbalife-para-medicos-english 16/72
B.3ENERGETICS AND OBESITY
Among species, smaller surface area animals such as mice burn more energy at rest per
unit body mass than large mammals such as elephants. Children have higher metabolic
rates than adults per unit body mass. Within the same species there can be significantvariations in metabolic rates. For example, the sedentary and overfed laboratory rat has
a higher metabolic rate than does the desert rat, which is better adapted to starvation
(Kalman et al., 1993). Energy efficiency may vary as well among humans. There is
evidence that the post-obese adult may have a lower metabolism than a never-obese
individual of the same size. However, the impact of excess energy is modulated by the
location of excess body fat and its effects on hormones and inflammatory cytokines.
Therefore, while energy balance is critical, it is not sufficient for an understanding of
the effects of nutrition on disease risk.
Since obesity results from an imbalance of energy intake and expenditure, certain
dietary factors have been identified as contributing to obesity. These include hidden
processed fats in foods, added refined sugars in foods and a high-glycemic-load diet rich
in refined carbohydrates. Therefore, the quality of the diet, in terms of nutrient density,can contribute to the tendency of a dietary pattern to promote the development of
obesity in genetically susceptible individuals. Low-energy density foods include all
fruits and vegetables, generally due to their high-water content. High-energy density
foods include red meats, fats, cheeses, pastries, cookies, cakes, ice cream, snack chips,
some fruit juices and refined grains.
B.4PROTEIN AND ITS ROLE IN
CELLULAR NUTRITIONProteins are involved in the growth, repair and replacement of tissue, and serve
numerous functions in the body as enzymes, antibodies, hormones, regulators of fluid
and acid-base balance, and as integral parts of most body structures, including skin,
muscle and bone. Within each cell, there is a continuous process of synthesis and
breakdown of proteins in the body, referred to as protein turnover .
The rate of protein turnover affects organ-protein mass, body size and ultimately,
the body’s protein and amino acid requirements (Matthews, 1999; Fuller, 2000). The
amino acids are the basic units in protein metabolism, and all have the same basic
structure of a central carbon atom with a hydrogen, an amino group and an acid group
attached to it. Attached to the fourth site on the carbon atom is a distinct side chain,
which defines the amino acid. Cells link these amino acids in an infinite variety to
create proteins which become metabolically essential compounds.
B.4.1PROTEIN QUALITY
There are 21 amino acids in human proteins, and 12 of these are synthesized by the
body and are, therefore, known as non-essential amino acids. The nine remaining
amino acids (histidine, isoleucine, leucine, lysine, methionine, phenylalanine,
threonine, tryptophan and valine) are either not made by the body or not made in
sufficient quantities to meet needs, and are, thus, termed essential amino acids.
PHYSICIAN’S REFERENCE MANUAL B.3 - B.4.1
1
5/7/2018 Manual Herbalife Para Medicos- English - slidepdf.com
http://slidepdf.com/reader/full/manual-herbalife-para-medicos-english 17/72
The proper balance and sufficient intake of essential amino acids, along with an
adequate amount of nitrogen for the production of non-essential amino acids, is required
for proper protein nutriture (Berdanier, 2000).
In order to manufacture proteins, cells require all the needed amino acids
simultaneously with adequate nitrogen-containing amino groups for the manufacture
of the non-essential amino acids. The amino acid composition of a food can vary widely,
and determines the nutritional quality of the dietary protein. Foods that containessential amino acids at levels that facilitate tissue growth and repair are known as
complete proteins and are supplied in the diet from animal sources and
soy protein.
There are several ways of measuring protein quality. Most commonly, the term
biological value is used, which is a measure of the efficiency of a given protein in supporting
the body’s needs. Complete proteins have a high biological value, which is an expression
of the amount of nitrogen absorbed relative to the amount of nitrogen retained by the
body. All protein sources are compared with egg white, which provides the most complete
protein and has the highest biological value of 100, indicating that 100 percent of the
nitrogen absorbed is retained.
A low concentration of one or more essential amino acids in a food lowers its biological
value. With the exception of soy, most plant proteins are deficient in one or more essentialamino acids and are, therefore, regarded as incomplete. However, the biological value of
incomplete proteins can be improved by combining two proteins that are complementary so
that those essential amino acids lacking or deficient in one protein are provided by the other
when they are combined. In this way, the two complementary proteins together provide all
the essential amino acids in ratios ideal for human protein utilization (Kreutler and Czajka-
Narins, 1987; Lappe, 1971; Matthews, 1999). For example, the combination of corn (limited
in lysine) with beans (limited in methionine) results in a high-quality protein food
combination. Thus, the requirement for adequate essential amino acids can be met in a
vegetarian diet by mixing foods of complementary amino acid composition (Berdanier,
2000; Committee on Diet and Health, 1989; Lappe, 1971).
TABLE 1
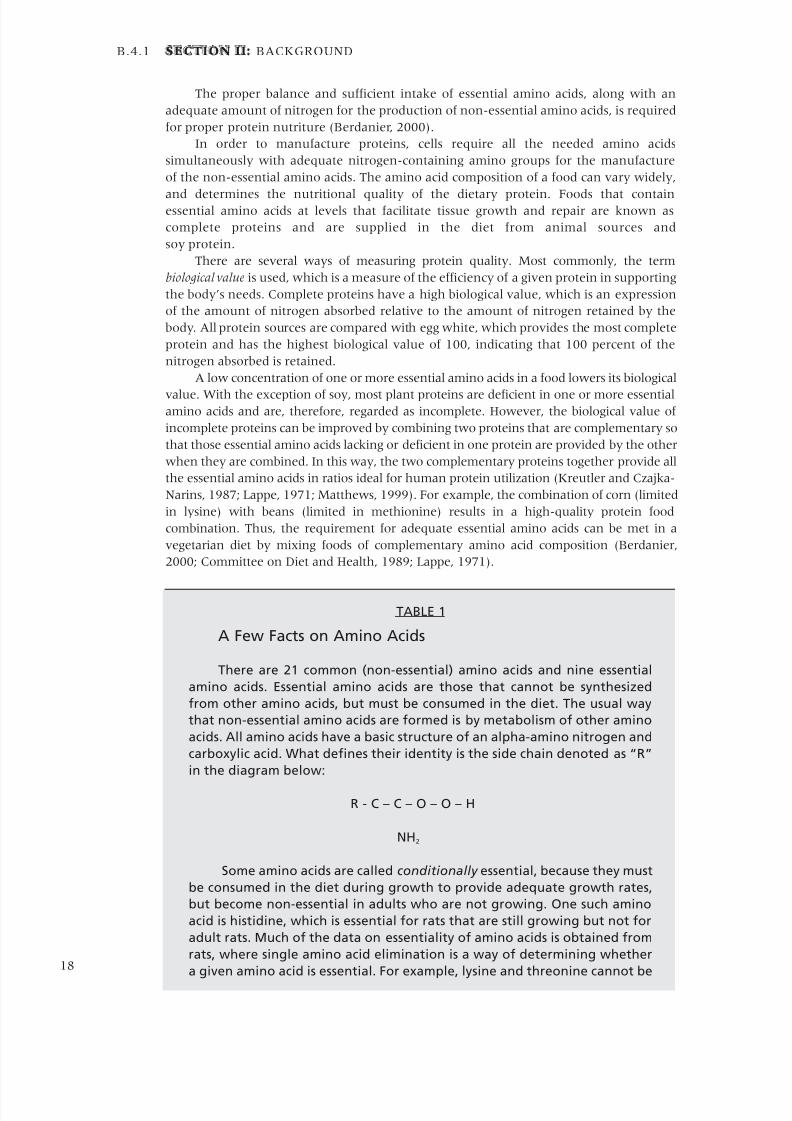
A Few Facts on Amino Acids
There are 21 common (non-essential) amino acids and nine essential
amino acids. Essential amino acids are those that cannot be synthesized
from other amino acids, but must be consumed in the diet. The usual way
that non-essential amino acids are formed is by metabolism of other amino
acids. All amino acids have a basic structure of an alpha-amino nitrogen and
carboxylic acid. What defines their identity is the side chain denoted as “R”
in the diagram below:
R - C – C – O – O – H
NH2
Some amino acids are called conditionally essential, because they must
be consumed in the diet during growth to provide adequate growth rates,
but become non-essential in adults who are not growing. One such amino
acid is histidine, which is essential for rats that are still growing but not for
adult rats. Much of the data on essentiality of amino acids is obtained from
rats, where single amino acid elimination is a way of determining whether
a given amino acid is essential. For example, lysine and threonine cannot be
SECTION II: BACKGROUND
18
B.4.1

5/7/2018 Manual Herbalife Para Medicos- English - slidepdf.com
http://slidepdf.com/reader/full/manual-herbalife-para-medicos-english 18/72
made from other amino acids by transamination and must be included in
the diet.
Essential Amino Acids Non-essential Amino Acids
Histidine Alanine
Isoleucine Arginine
Leucine Asparagine
Lysine Aspartic Acid
Methionine Cysteine
Phenylalanine Glutamic Acid
Threonine Glutamine
Tryptophan Glycine
Valine Proline
Serine
Taurine
Tyrosine
B.4.2PROTEIN REQUIREMENTS
The U.S. food supply can provide an average of 102 grams of protein per person per day
(Nationwide Food Consumption Survey, 1984). Actual daily protein consumption
ranges from 88 grams to 92 grams for men and from 63 grams to 66 grams for women
(McDowell et al., 1994). Animal products provide 75 percent of the essential amino
acids in the food supply, followed by dairy products, cereal products, eggs, legumes,
fruits and vegetables (McDowell et al., 1994). The recommended daily allowance
(RDA) for protein of high biological value for adults, based on body weight, is
0.8 grams/kilograms (National Research Council, 1989) or 0.36 grams/lb. However, the
RDA is set to meet the needs of a defined population group as a whole, rather than
indicating individual requirements. In a recent report concerning Dietary Reference
Intakes (DRI) the Acceptable Macronutrient Distribution Range (AMDR) was set at
10 percent to 35 percent of total calories from protein. The AMDR is defined as the
acceptable range of intakes for protein associated with reduced risk of chronic disease
while providing intakes of essential nutrients (Barr et al., 2003). This range was largely
set so that the intake of other macronutrients in the diet would be in an acceptable range.
There are many conditions in which extra protein is needed, including periods of
growth, pregnancy, lactation, intensive strength and endurance training, and other
forms of physical activity, and possibly in the elderly (Campbell et al., 1994).Additionally, there is recent research into the role of protein in the regulation of long-
term energy balance, maintenance of body weight and satiety (see “B.4.4: Protein’s Role
in Satiety” on page 20).
B.4.3OPTIMUM PROTEIN INTAKE
Given the variation in the needs for protein throughout the life cycle, there is an
individual optimum intake that exists based on lean body mass and activity levels.
PHYSICIAN’S REFERENCE MANUAL B.4.2 - B.4.
1
TABLE 1 (Continued)

5/7/2018 Manual Herbalife Para Medicos- English - slidepdf.com
http://slidepdf.com/reader/full/manual-herbalife-para-medicos-english 19/72
SECTION II: BACKGROUND
However, optimal intakes are difficult to determine based on the existing science base in
nutrition. In 1977, Garza et al. studied a small number of healthy volunteers and found that
0.8 (grams per kilograms per day) resulted in positive nitrogen balance. Subsequent studies
in endurance athletes found that more than 1 g/kg/day was required for positive nitrogen
balance (Tarnopolsky, 2004) and studies of weight lifters indicated that more than
2 g/kg/day was needed to achieve positive nitrogen balance (Tarnopolsky et al., 1992).
Therefore, while the DRI (which is the same as the RDA) is set at 56 grams per day for menconsistent with the 1977 study, the allowable range of macronutrient intake is broad
(10 to 35 percent of total calories), enabling some individual adjustment for optimal intakes
both to control hunger and to provide support to lean tissues.
B.4.4PROTEIN’S ROLE IN SATIETY
In comparison with carbohydrate or fat, protein provides a stronger signal to the brain to
satisfy hunger. While the mechanism of action is unknown, it has been suggested that either
single amino acids or small peptides enter the brain to elicit their effects, and several amino
acids, including tryptophan, phenylalanine and tyrosine, have been theorized to affect the
hunger control mechanisms once they cross the blood-brain barrier. Small differences in the
rates at which proteins release their amino acids into the bloodstream may also affect satiety.
In subjects consuming high-protein meals, compared with high-carbohydrate meals fed ad
libitum, a voluntary reduction in energy consumption has been observed.
Researchers in the Netherlands (Westerterp-Plantenga et al., 1999) have studied the
effects of protein on hunger perceptions by studying two groups of subjects in a whole-body
energy chamber under controlled conditions for over 24 hours. Subjects were fed isocaloric
diets that were either high-protein/high-carbohydrate (protein/carbohydrate/fat, percentage
of calories 30/60/10) or high-fat (protein/carbohydrate/fat, percentage of calories 10/30/60).
Significantly more satiety was reported by subjects on the high-protein/high-carbohydrate
diet. At the same time, hunger, appetite, desire to eat and estimated quantity of food eatenwere significantly lower in this group, with less hunger both during and after the high-protein
meals. The level of protein in the diet may also impact maintenance of body weight after
weight loss. After following a very low-energy diet for four weeks, subjects who consumed a
20 percent higher intake of protein than did control subjects (15 percent versus 18 percent of
energy) showed a 50 percent lower body-weight regain, only consisting of fat-free mass, with
increased satiety and decreased energy efficiency during a three-month maintenance period
(Westerterp-Plantenga et al., 2004).
Similar studies have reported improved weight loss and fat loss in subjects consuming a
high-protein diet versus a control diet (25 percent versus 12 percent energy from protein)
ad libitum, due to a reduction in daily calorie intake of approximately 16 percent (Skov et al.,
1999) and improved utilization of body fat with maintenance of lean body mass in subjects
consuming 32 percent of energy from protein compared with control subjects who consumed
15 percent of calories as protein (Layman et al., 2003). A similar study comparing diets with
15 percent versus 30 percent of calories from protein found that while weight loss in the two
groups was similar over the six-week trial, diet satisfaction was significantly greater in those
consuming the higher-protein diet (Johnston et al., 2004).
A meta-analysis of studies (Eisenstein et al., 2002) concluded that, on average, high-
protein diets were associated with a 9 percent decrease in total calorie intake. While the role
of protein (in comparison to fat and carbohydrate) in affecting overall calorie intake and in
body-weight regulation needs further investigation, the evidence is strong that protein affects
hunger-signaling mechanisms in the brain, induces thermogenesis and contributes to the
building and maintenance of lean body mass.20
B.4.3 - B.4.4

5/7/2018 Manual Herbalife Para Medicos- English - slidepdf.com
http://slidepdf.com/reader/full/manual-herbalife-para-medicos-english 20/72
B.5FATS IN CELLULAR NUTRITION
Fats are a subset of the lipid family, which includes triglycerides (fats and oils),
phospholipids and sterols. Fats play an extremely important role in energy balance by
enabling efficient storage of calories in adipose tissue. It is possible for the mythical
70-kilogram man to carry 130,000 calories in 13.5 kilograms of fat tissue, compared to only
54,000 calories stored as protein in an equivalent weight of lean tissue. This efficient
storage is accomplished both largely by excluding water from adipose tissues and by storing
energy in the chemical bonds of very long chain fatty acids. The typical fatty acids found
in digested and stored fat range between 16 and 22 carbons in length.
Triglycerides, the chief form of fat in the diet and the major storage form of fat in the
body, are composed of a molecule of glycerol with three fatty acids attached. The principal
dietary sources of fat are meats, dairy products, poultry, fish, nuts, and vegetable oils and
fats used in processed foods. Vegetables and fruits contain only small amounts of fat, so that
vegetable oils are only sources of fat due to processing of vegetables. The most commonly
used oils and fats for salad oil, cooking oils, shortenings and margarines in the United States
include soybean, corn, cottonseed, palm, peanut, olive, canola (low-erucic-acid rapeseed
oil), safflower, sunflower, coconut, palm kernel, tallow and lard. These oils contain varying
compositions of fatty acids which have particular physiological properties. The fats stored in
tissues reflect, to a certain extent, the fats in the diet. Humans synthesize saturated fats (e.g.,
palmitic acid) from carbohydrates, but the polyunsaturated essential fats (linoleic and
linolenic acids) must be taken in from the diet. The balance of these fats and the metabolic
products of these fats reflect short-term and long-term dietary intake. There is a statistically
significant but poor correlation between adipose tissue fatty acid profiles and dietary fatty
acid intake as measured on a food frequency questionnaire (London et al., 1991). Red blood
cell membranes change their composition in about three weeks. However, it is clearly
possible to change the amount of fatty acids in tissues (Bagga et al., 1997) and total
quantitative fatty acids can be altered by dietary intervention. The quality of fats in the dietis defined as that ratio of fatty acids that can be measured in plasma and tissues.
B.5.1FATTY ACID STRUCTURE
AND CLASSIFICATIONFatty acids are organic compounds composed of a carbon chain with hydrogens
attached at one end and an acid group at the other. Most naturally occurring fatty acids
have an even number of carbons in their chain, up to 24 carbons in length, with
18-carbon chains the most abundant fatty acids in the food supply.
Saturated fatty acids are completely saturated with hydrogens. Those fatty acids
lacking two hydrogen atoms and containing one double bond are monounsaturated
fatty acids, and polyunsaturated fatty acids contain two or more double bonds in the
carbon chain. The degree of saturation influences the texture of fats so that, in general,
polyunsaturated vegetable oils are liquid at room temperature and the more saturated
fats, most of which are animal fats, are solid. Some vegetable oils such as palm and
coconut oils are highly saturated, and liquid oils can be hydrogenated in the presence
of a nickel catalyst to produce a firmer fat.
The nomenclature of fatty acids is based on location of the double bonds: an
omega-3 fatty acid has its first double bond three carbons from the methyl end of the
carbon chain. Similarly, an omega-6 fatty acid has its double bond six carbons from the
PHYSICIAN’S REFERENCE MANUAL B.5 - B.5.1
2

5/7/2018 Manual Herbalife Para Medicos- English - slidepdf.com
http://slidepdf.com/reader/full/manual-herbalife-para-medicos-english 21/72
SECTION II: BACKGROUND
methyl end. Fatty acids are also denoted by the length of the carbon chain and the
number of double bonds they contain, such that linoleic acid is an 18:2 fatty acid which
contains 18 carbons and two double bonds. The human body requires fatty acids and
can manufacture all but two essential fatty acids: linoleic acid and linolenic acid (18:3)
(see Figure 1 below).
Omega-3 fatty acids possess anti-inflammatory, antiarrhythmic and antithrombotic
properties and have been shown to reduce the risk for sudden death caused by cardiacarrhythmias and decrease mortality from all causes in patients with coronary heart
disease. Conversely, the omega-6 fatty acids, obtained in the diet primarily from
vegetable oils such as corn, safflower, sunflower and cottonseed, are proinflammatory
and prothrombotic. Fish and fish oils are the richest sources of the omega-3 fatty acids
eicosapentaenoic acid (EPA) and docosshexaenoic acid (DHA) and are also present in
algae. Green leafy vegetables, nuts, seeds and soybeans contain the omega-3 fatty acid
alpha-linolenic acid (AHA). The increased consumption in the United States of
omega-6 fats from vegetable oils and grain-fed animals has led to a drastic increase in
the ratio of omega-6 to omega-3 fatty acids in the diet from an estimated ratio of 1:1 in
early human diets to a ratio exceeding 10:1 today (Simopoulos, 2001).
B.5.2FATTY ACIDS AS CELLULAR SIGNALS
Increasing evidence from animal and in vitro studies indicates that omega-3 fatty acids,
especially the long-chain polyunsaturated fatty acids EPA and DHA, present in fatty fish
and fish oils inhibit carcinogenesis (Karmali et al., 1984; Lindner, 1991; Rose et al., 1991;
Tsai et al., 1998; Boudreau et al., 2001; Narayanan et al., 2001). Several molecular
mechanisms have been proposed for the influences on the process, including suppression
of arachidonic acid-derived eicosanoid biosynthesis (Rose, 1999; Okuyama, 1996) and
influences on transcription factor activity, gene expression and signal transduction
pathways (Bartsch et al., 1999).
The peroxisome proliferator-activated nuclear receptors (PPARa, d, g ) are activated
by polyunsaturated fatty acids, eicosanoids, and various synthetic ligands (Willson et al.,
22
B.5.1 - B.5.2
Figure 1

5/7/2018 Manual Herbalife Para Medicos- English - slidepdf.com
http://slidepdf.com/reader/full/manual-herbalife-para-medicos-english 22/72
2000). Consistent with their distinct expression patterns, gene-knockout experiments
have revealed that each PPAR subtype performs a specific function in fatty acid
homeostasis.
Over a decade ago, PPARa was found to respond to hypolipidemic drugs, such as
fibrates. Subsequently, it was discovered that fatty acids serve as their natural ligands.
Together with the analyses of PPARa null mice, these studies established PPARa as a global
regulator of fatty acid catabolism. PPARa target genes function together to coordinate thecomplex metabolic changes necessary to conserve energy during fasting and feeding. In
the fatty acid metabolic cascade, PPARa activation up-regulates the transcription of liver
fatty acid-binding protein, which buffers intracellular fatty acids and delivers PPARa
ligands to the nucleus (Wolfrum et al., 2001). In addition, expression of two members of
the adrenoleukodystrophy subfamily of ABC transporters, ABCD2 and ABCD3, is
similarly up-regulated to promote transport of fatty acids into peroxisomes (Fourcade et
al., 2001) where catabolic enzymes promote beta-oxidation. The hepatocyte CYP4A
enzymes complete the metabolic cascade by catalyzing gamma-oxidation, the final
catabolic step in the clearance of PPARa ligands (Lee et al., 1995).
PPARg was identified initially as a key regulator of adipogenesis, but it also plays an
important role in cellular differentiation, insulin sensitization, atherosclerosis and cancer
(Rosen and Spiegelman, 2001). Ligands for PPARg include fatty acids and other
arachidonic acid metabolites, antidiabetic drugs (e.g., thiazolidinediones) and
triterpenoids. In contrast to PPARa, PPARg promotes fat storage by increasing adipocyte
differentiation and transcription of a number of important lipogenic proteins. Ligand
homeostasis is regulated by governing expression of the adipocyte fatty acid-binding
protein (A-FABP/aP2) and CYP4B1(Way et al., 2001). In macrophages, PPARg induces
the lipid transporter ABCA1 through an indirect mechanism involving the LXR pathway,
which in turn promotes cellular efflux of phospholipids and cholesterol into high-density
lipoproteins (Chawla et al., 2001; Chinetti et al., 2001).
B.6 CARBOHYDRATES IN CELLULAR
NUTRITIONAs with proteins and fats, one can consider the quality of carbohydrates based on the
source of the carbohydrates (fruits, vegetables, or whole grains versus refined grains
and simple sugars) and their digestibility (soluble versus insoluble fiber). A quantitative
approach to the analysis of dietary carbohydrate has been developed based on glycemic
index and glycemic load, as will be discussed.
B.6.1 SUGARS AND STARCHESSimple carbohydrates are present in foods as mono- or di-saccharides, and are naturally
present in such foods as fruit and milk. Glucose, fructose and galactose are the most
common monosaccharides in the human diet and combine to form the disaccharides
sucrose (glucose + fructose), lactose (glucose + galactose) and maltose (glucose +
glucose). Oligosaccharides are short chains of 3-10 sugar molecules, and the most
common ones, raffinose and stachyose, are found in beans, peas and lentils.
Polysaccharides are starches which contain more than 10 sugar molecules, found in
wheat, rice, corn, oats, legumes and tubers. Starches form long chains that are either
PHYSICIAN’S REFERENCE MANUAL B.5.2 - B.6.
2

5/7/2018 Manual Herbalife Para Medicos- English - slidepdf.com
http://slidepdf.com/reader/full/manual-herbalife-para-medicos-english 23/72
SECTION II: BACKGROUND
straight (amylose) or branched (amylopectin). Amylose and amylopectin occur in a
ratio of about 1:4 in plant foods.
While there are several dietary factors that contribute to obesity, a dietary pattern
that is rich in sugars and starches is considered a risk factor for obesity, whereas a high
intake of nonstarch polysaccharides in the form of dietary fiber is considered protective
(Swinburn et al., 2004). The typical Western diet is high in refined starches and sugars
which are digested and absorbed rapidly, resulting in a high glycemic load and increaseddemand for insulin secretion. This, in turn, promotes postprandial carbohydrate
oxidation at the expense of fat oxidation. Both acute (Ludwig et al., 1999; Febbraio et
al., 2000) and short-term studies (Agus et al., 2000; Howe et al., 1996) indicate that a
dietary pattern that produces a high-glycemic response affects appetite and promotes
body-fat storage.
However, diets based on high-fiber foods that produce a low glycemic response can
enhance weight control because they promote satiety, minimize postprandial insulin
secretion, and maintain insulin sensitivity (Brand-Miller et al., 2002). This is supported
by several intervention studies in humans in which energy-restricted diets based on low
glycemic index foods produced greater weight loss than did equivalent diets based on
high glycemic index foods. Long-term studies in animal models have also shown that
diets based on high glycemic index starches promote weight gain, visceral adiposity and
higher concentrations of lipogenic enzymes than do isoenergetic diets with a low
glycemic index, which are macronutrient-controlled.
B.6.2GLYCEMIC INDEX AND
GLYCEMIC LOADConventional approaches to weight loss have focused on decreasing dietary fat, due to
its high-calorie density. However, the relationship between dietary fat and obesity has been brought into question for several reasons. Low-fat diets have been shown to
produce only modest weight loss, and prospective epidemiological studies have not
been able to consistently correlate dietary fat intake with weight. Despite a decrease in
fat consumption as a percentage of total calories and widespread availability of low-fat
and fat-free foods, obesity prevalence in the United States has risen dramatically since
the 1970s (Putnam and Allshouse, 1999). At the same time, carbohydrate consumption
has increased, and most of this increase has been in the form of refined starches and
concentrated sweets with a high glycemic index (GI) and/or glycemic load (GL).
In 1981, Jenkins et al. introduced the glycemic index as a system for classifying
carbohydrate-containing foods based upon their effect on post-prandial glycemia
(Jenkins et al., 1981). The glycemic response to the ingestion of 50 grams of available
carbohydrate from the test food is compared to the response from the ingestion of
50 grams of the reference food (glucose or white bread), and the glycemic index is
expressed as the area under the glucose response curve for the test food divided by the
area under the curve for the standard, multiplied by 100. However, the amount of
carbohydrate in 50 grams of a given food will vary depending upon the food, and this
observation led to the introduction of the concept of glycemic load. This is an
expression of the glycemic index of the food multiplied by the carbohydrate content of
the food, and takes into account the differences in carbohydrate content among foods
(Liu, 1998). Foods with a high index but relatively low total carbohydrate content, such
as carrots, have a low glycemic load. In general, fruits, non-starchy vegetables, nuts and
legumes have a low GI (see Table 2 on the following pages). One problem with the GI24
B.6.1 - B.6.2

5/7/2018 Manual Herbalife Para Medicos- English - slidepdf.com
http://slidepdf.com/reader/full/manual-herbalife-para-medicos-english 24/72
is that it only detects carbohydrate quality, not quantity. A GI value tells you only how
rapidly a particular carbohydrate turns into sugar; it doesn’t tell you how much of that
carbohydrate is in a serving of a particular food. Both should be known to understand
a food’s effect on blood sugar. The most famous example of this is the carrot. The form
of sugar in the carrot has a high glycemic index, but the total carbohydrated content of
the carrot is low, so it doesn’t add a lot of calories.
A low glycemic load (GL) is less than 16, and this has been found to be the mostimportant variable in studies of populations and their risk of chronic disease. You are
not going to be able to eat all low GL foods, but it is important to know both the GL
and the calories that the food provides.
The problem with GL is that fatty foods which carry lots of calories have a lower
glycemic index. Fatty foods can still add calories to the diet even though they have a
low glycemic index.
TABLE 2
GLYCEMIC INDEX, GLYCEMIC LOAD AND CALORIES
The GI, GL, and total calories of foods are listed here. The GI is of foods
based on the glucose index—where glucose is set to equal 100. The other is
the glycemic load, which is the glycemic index divided by 100 multiplied by
its available carbohydrate content (i.e., carbohydrates minus fiber) in grams.
Each of these foods is equivalent to one serving size. Except as noted, each
of the GI values shown below is based on the 120 studies in the professional
literature referenced in The American Journal of Clinical Nutrition,
July 2002.
LOW GI (<55) and LOW GL (<16) FOODS
Lowest Calorie (110 calories per serving or less)
GI GL CALORIESAPPLE 40 6 75BANANA 52 12 90CHERRIES 22 3 85GRAPEFRUIT 25 5 75KIWI 53 6 45MANGO 51 14 110ORANGE 48 5 65PEACH 42 7 70PLUM 39 5 70STRAWBERRIES 40 1 50TOMATO JUICE 38 4 40Most Other Vegetables <20 <5 40NONFAT MILK 32 4 90
Moderate Calorie (110 to 135 calories per serving or less)
GI GL CALORIES
APPLE JUICE 40 12 135
GRAPEFRUIT JUICE 48 9 115
PEAR 33 10 125
PEAS 48 3 135
PHYSICIAN’S REFERENCE MANUAL B.6.2
2

5/7/2018 Manual Herbalife Para Medicos- English - slidepdf.com
http://slidepdf.com/reader/full/manual-herbalife-para-medicos-english 25/72
SECTION II: BACKGROUND
TABLE 2 (Continued)
GI GL CALORIES
PINEAPPLE JUICE 46 15 130
WHOLE-GRAIN BREAD 51 14 120
SOY MILK 44 8 130
Higher Calorie (160 to 300 calories per serving)
GI GL CALORIES
BARLEY 25 11 190
BLACK BEANS 20 8 235
GARBANZO BEANS 28 13 285
GRAPES 46 13 160
KIDNEY BEANS 23 10 210
LENTILS 29 7 230
SOYBEANS 18 1 300
YAM 37 13 160
HIGH GI (>55) BUT LOW GL (<16) FOODS
All Low Calorie (110 calories per serving or less)
GI GL CALORIES
APRICOT 57 6 70
ORANGE JUICE 57 15 110
PAPAYA 60 9 55
PINEAPPLE 59 7 75
PUMPKIN 75 3 85
SHREDDED WHEAT 75 15 110
TOASTED OATS 74 15 110
WATERMELON 72 7 50
Low GI and Low Gl - But High Fat and High Calorie
GI GL CALORIES
CASHEWS 22 4 395
PREMIUM ICE CREAM 38 10 360
LOW-FAT ICE CREAM 37-50 13 220
PEANUTS 14 1 330
POPCORN (FULL-FAT) 72 16 110
POTATO CHIPS 54 15 345
WHOLE MILK 27 3 150
VANILLA PUDDING 44 16 250
FRUIT YOGURT 31 9 200+
SOY YOGURT 50 13 200+
26
B.6.2

5/7/2018 Manual Herbalife Para Medicos- English - slidepdf.com
http://slidepdf.com/reader/full/manual-herbalife-para-medicos-english 26/72
TABLE 2 (Continued)
HIGH GI >55
HIGH GL >16
Includes Typical Trigger Foods, Many Higher Calorie
GI GL CALORIES
BAKED POTATO 85 34 220
BROWN RICE 50 16 215
COLA 63 33 200
CORN 60 20 130
CORN CHIPS 63 21 350
CORN FLAKES 92 24 100
CRANBERRY JUICE 68 24 145
CREAM OF WHEAT 74 22 130
CROISSANT 67 17 275
FRENCH FRIES 75 25 515
MAC ‘N’ CHEESE 64 46 285OATMEAL 75 17 140
PIZZA 60 20 300
PRETZELS 83 33 115
RAISIN BRAN 61 29 185
RAISINS 66 42 250
SODA CRACKERS 74 18 155
WAFFLES 76 18 150
WHITE BREAD 73 20 160
WHITE RICE 64 23 210
The intake of high GI/GL meals induces a sequence of hormonal changes,
including an increased ratio of insulin to glucagon, that limit the availability of
metabolic fuels in the post-prandial period and promote nutrient storage (Ludwig,
2002) and would be expected to stimulate hunger and promote food intake. Short-term
feeding studies have demonstrated less satiety and greater voluntary food intake after
consumption of high GI meals as compared to low GI meals (Ludwig et al., 1999), for
example, the demonstration of prolonged satiety after consumption of a low GI bean
puree vs. a high GI potato puree (Leathwood and Pollett, 1998).
Weight loss on a low-calorie, reduced-fat diet may be enhanced if the diet also has
a low GI (Slabber et al., 1994), and even when energy intake is not restricted, low GI
and/or low GL diets have been shown to produce greater weight loss than conventional
low-fat diets (Ebbeling et al., 2003). Additionally, subjects consuming a low GI dietad libitum have been reported to experience a spontaneous 25 percent reduction in
energy intake, with significant reductions in body weight and waist and hip
circumference when compared with control subjects (Dumesnil et al., 2001).
Other data suggest that low GI/GL diets may confer protection against certain
forms of cancer, cardiovascular disease and the metabolic syndrome and type 2
diabetes. In the Women’s Health Study, a high GL dietary pattern was associated with
an increased risk for colon cancer (Higginbotham et al., 2004), and data from the Iowa
Women’s study indicated that a higher GL pattern may be a risk factor for endometrial
cancer incidence in nondiabetic women (Folsom et al., 2003). In a study of 244 healthy
women, a strong and statistically significant positive association was found between
PHYSICIAN’S REFERENCE MANUAL B.6.2
2
5/7/2018 Manual Herbalife Para Medicos- English - slidepdf.com
http://slidepdf.com/reader/full/manual-herbalife-para-medicos-english 27/72
SECTION II: BACKGROUND
dietary GL and plasma C-reactive protein, a plasma marker for chronic inflammation
associated with an increased risk for heart disease (Liu et al., 2002). In large prospective
epidemiologic studies, both the GI and the GL of the overall diet have been associated
with a greater risk of type 2 diabetes in both men and women (Salmeron et al., 1997a;
Salmeron et al., 1997b).
B.7FUNCTIONAL FOODS
Functional foods contain bioactive substances and have effects on health and
physiological function beyond simply providing calories. While many of the foods
reviewed above fit this definition (e.g., n-3 fatty acids), the foods reviewed in this
section have received attention as foods and food ingredients for health.
They are contained in Herbalife® products. For example, soy protein is a major
ingredient in the ShapeWorks® Formula 1 Protein Drink Mix; Performance Protein
Powder also consists of soy protein, as well as whey protein.
B.7.1SOY PROTEIN
Soy protein is the highest-quality protein found in the plant kingdom, and it is
consumed by two-thirds of the world’s population.
Soy protein naturally contains isoflavones (primarily genistein and daidzein), which
are called phytoestrogens. They are usually found in foods linked to sugars called glycosides,
and these phytoestrogens act like very weak estrogens or anti-estrogens similar to
raloxifene. When primates have a surgical menopause induced and are given estradiol
alone or estradiol in combination with soy isoflavones, the isoflavones antagonize the
actions of estradiol in the breast and the uterus but demonstrate estrogen-like beneficial
activities in the bone, on serum lipids and in the brain. These observations are explained
by the existence of two estrogen receptors called alpha and beta. Soy isoflavones bind with
very low affinity (1/50,000 to 1/100,000 the affinity of estradiol) to the alpha-estradiol
receptor, but bind equally well to the beta-estradiol receptor (Clarkson et al., 2001).
Soy protein isoflavones have been shown to influence not only sex hormone
metabolism and biological activity but also intracellular enzymes, protein synthesis,
growth-factor action, malignant cell proliferation, differentiation and angiogenesis,
providing strong evidence that these substances may have a protective role in cancer
(Kim et al., 2002).
B.7.2PHYTOCHEMICAL-RICH FRUITS,VEGETABLES AND GRAINS
Because fruits and vegetables are high in water and fiber, incorporating them into the
diet can reduce energy density, promote satiety and decrease energy intake, while at
the same time provide phytonutrients. Few interventions have specifically addressed
fruit and vegetable consumption and weight loss, but evidence suggests that the
recommendation to increase these foods while decreasing total energy intake is an
effective strategy for weight management. Obesity, while often considered synonymous28
B.6.2 - B.7.2

5/7/2018 Manual Herbalife Para Medicos- English - slidepdf.com
http://slidepdf.com/reader/full/manual-herbalife-para-medicos-english 28/72
with overnutrition, is more accurately depicted as overnutrition of calories but
undernutrition of many essential vitamins, minerals and phytonutrients.
This increased incidence of obesity has been associated with an increased
incidence of heart disease, breast cancer, prostate cancer and colon cancer in
comparison with populations eating a dietary pattern consisting of less meat and more
fruits, vegetables, cereals and whole grains. The intake of 400 to 600 grams/day of fruits
and vegetables is associated with a reduced incidence of many common forms of cancer,heart disease and many chronic diseases of aging (Temple, 2000; Willett, 1994;
Willett, 1995).
The common forms of cancer, including breast, colon and prostate cancer, are the
result of genetic-environmental interactions. Most cancers have genetic changes at the
somatic cell level, which lead to unregulated growth through activation of oncogenes
or inactivation of tumor suppressor genes. Reactive oxygen radicals are thought to
damage biologic structures and molecules, including lipids, protein and DNA, and there
is evidence that antioxidants can prevent this damage.
Fruits and vegetables provide thousands of phytochemicals to the human diet and
many of these are absorbed into the body. While these are commonly antioxidants,
based on their ability to trap singlet oxygen, they have been demonstrated scientifically
to have many functions beyond antioxidation. These phytochemicals can interact withthe host to confer a preventive benefit by regulating enzymes important in
metabolizing xenobiotics and carcinogens; modulating nuclear receptors and cellular
signaling of proliferation and apoptosis; and acting indirectly through antioxidant
actions that reduce proliferation and protect DNA from damage (Blot et al., 1993).
Phytochemicals found in fruits and vegetables demonstrate synergistic and
additive interactions through their effects on gene expression, antioxidation and
cytokine action. Fruits and vegetables are 10- to 20-fold less calorie dense than grains;
PHYSICIAN’S REFERENCE MANUAL B.7.2
2Adapted from What Color Is Your Diet?, Harper-Collins/Regan Books 2001
Figure 2

5/7/2018 Manual Herbalife Para Medicos- English - slidepdf.com
http://slidepdf.com/reader/full/manual-herbalife-para-medicos-english 29/72
provide increased amounts of dietary fiber compared to refined grains; and provide a
balance of omega-3 and omega-6 fatty acids and a rich supply of micronutrients.
Several studies have sought to characterize dietary patterns and relate these
patterns to body weight and other nutritional parameters. A prospective study of
737 non-overweight women in the Framingham Offspring/Spouse cohort explored the
relationship between dietary patterns and the development of overweight over a
12-year period. Participants were grouped into one of five dietary patterns at baseline,which included a heart-healthy pattern (low-fat, nutritionally varied); a light-eating
pattern (lower calories, but proportionately more fat and fewer micronutrients); a wine
and moderate-eating pattern; a high-fat pattern; and an empty-calorie pattern (rich in
sweets and fat, and low in fruits and vegetables). Women in the heart-healthy cluster
consumed more servings of vegetables and fruits than women in each of the other four
clusters. Over the 12-year period, 214 cases of overweight developed in this cohort.
Compared with women in the heart-healthy group, women in the empty-calorie group
were at a significantly higher risk for developing overweight (RR1.4, 95 percent CI)
(Quatromoni et al., 2002).
In another analysis of dietary patterns among 179 older rural adults, those in the
high-nutrient-dense cluster (higher intake of dark-green/yellow vegetables,
citrus/melons/berries, and other fruits and vegetables) had lower energy intakes andlower waist circumferences than those in the low-nutrient-dense cluster (higher intake
of breads, sweets, desserts, processed meats, eggs, fats and oil). Those with a low-
nutrient-dense pattern were twice as likely to be obese (Ledikewe et al., 2004). Similar
observations were reported utilizing data from the Canadian Community Health Survey
from the years 2000 to 2001. The frequency of eating fruits and vegetables was
positively related to being physically active and not being overweight (Perez, 2002).
In a controlled clinical trial, families with obese parents and non-obese children
were randomized into a comprehensive behavioral weight-management program,
which featured encouragement either to increase fruit and vegetable consumption or
to decrease intake of high-fat, high-sugar foods. Over a one-year period, parents in the
increased fruit and vegetable group showed significantly greater decreases in
percentage of overweight than in the group attempting to reduce fat and sugar (Epstein
et al., 2001).
Current NCI dietary recommendations emphasize increasing the daily
consumption of fruits and vegetables from diverse sources such as citrus fruits,
cruciferous vegetables, and green and yellow vegetables (Steinmetz and Potter, 1991).
SECTION II: BACKGROUND
30
B.7.2

5/7/2018 Manual Herbalife Para Medicos- English - slidepdf.com
http://slidepdf.com/reader/full/manual-herbalife-para-medicos-english 30/72
THE SEVEN COLORS OF HEALTH AND GARDEN 7®
In addition to well-known vitamins and minerals present in fruits and
vegetables, scientists are now focusing on other bioactive substances found
in fruits and vegetables called phytonutrients (also referred to as
phytochemicals). An important property of these phytonutrients is that theyappear to work together synergistically in some studies (Erdman, 2004)
suggesting that by including a variety of different colors of fruits and
vegetables in the diet daily (including those which provide such compounds
as carotenoids, bioflavonoids and glucosinolates) may contribute to
the health benefits associated with consuming five to nine servings of fruits
and vegetables a day. The benefits of consuming diverse classes of
phytonutrients are reviewed in the popular book What Color is Your Diet?
by Dr. David Heber (Harper-Collins/Regan Books, 2001). Garden7® is based
on the philosophy of Dr. Heber’s book. In it, he recommends the
consumption of at least one serving per day from each of the color groups
discussed below (also see Figure 2 on page 29).
An interesting property of these antioxidant compounds is their
localization in specific tissues. They are transported to major organs
(e.g., lycopene to the prostate, lutein to the macular area of the retina). It
is this localization in specific tissues that makes the phytonutrients in
Garden 7® different from general antioxidants such as Vitamin E. It is in this
regard that these phytonutrients provide a special benefit to tissues in
several vital body organs, such as the heart, brain, eyes, colon,
prostate/breast, liver and skin. Furthermore, it should be noted that these
phytonutrients do not occur as isolated compounds but as mixtures with
other vitamins such as Vitamin C and Vitamin E, and where possible, Garden
7® tablets and capsules are not only derived from extracts of the
corresponding fruit (e.g., tomato) or vegetable (e.g., broccoli), but arestandardized to the key phytonutrient provided (e.g., lycopene or
glucosinolates). Therefore, Garden7® provides standardized extract capsules
and tablets of different key phytonutrients as a supplement to the diet.
Thus Garden7® contains selected beneficial phytonutrients; these specific
phytonutrients are present in quantities equivalent to those found in
approximately one-half cup of broccoli, one-half cup of spinach, one cup of
red grapes, three ounces of cranberries, one orange, one carrot, one tomato
and a clove of garlic.
The supportive and protective effects of these phytonutrients localized
in tissues where they have antioxidant and other protective effects are
based on the current knowledge base in the nutritional literature for each
of the colors. They are as follows:
Red: Lycopene and related phytonutrients from tomatoes are localized
in the prostate tissues and help support healthy prostate by protecting the
cells of the prostate. Some evidence suggests that similar protection is
provided to breast cells.
Green: Glucosinolates from broccoli support healthy liver function and
the capacity of liver cells to produce enzymes which can clear certain
poisons and drugs from the body. Good evidence is available for
glucosinolates affecting detox enzymes in gut, liver, prostate, colon and
breast (benefit of indole-carbinols). There is some evidence for
PHYSICIAN’S REFERENCE MANUAL B.7.2
3
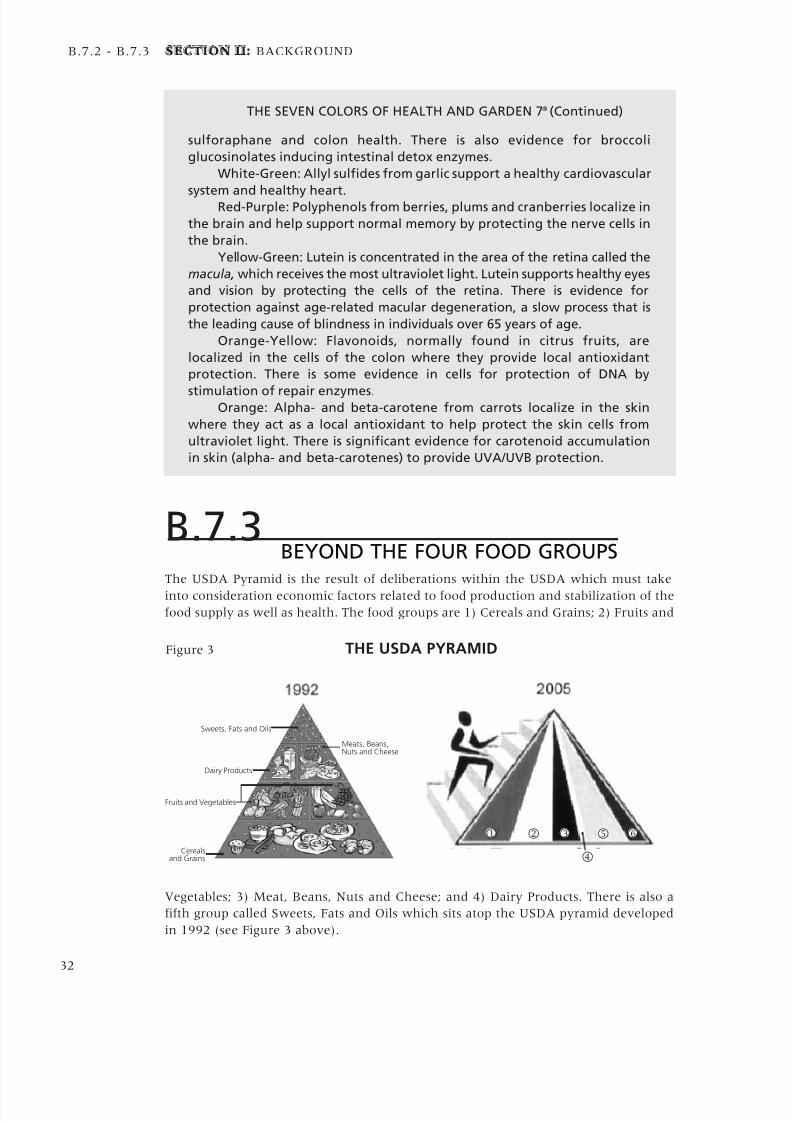
5/7/2018 Manual Herbalife Para Medicos- English - slidepdf.com
http://slidepdf.com/reader/full/manual-herbalife-para-medicos-english 31/72
sulforaphane and colon health. There is also evidence for broccoli
glucosinolates inducing intestinal detox enzymes.
White-Green: Allyl sulfides from garlic support a healthy cardiovascular
system and healthy heart.Red-Purple: Polyphenols from berries, plums and cranberries localize in
the brain and help support normal memory by protecting the nerve cells in
the brain.
Yellow-Green: Lutein is concentrated in the area of the retina called the
macula, which receives the most ultraviolet light. Lutein supports healthy eyes
and vision by protecting the cells of the retina. There is evidence for
protection against age-related macular degeneration, a slow process that is
the leading cause of blindness in individuals over 65 years of age.
Orange-Yellow: Flavonoids, normally found in citrus fruits, are
localized in the cells of the colon where they provide local antioxidant
protection. There is some evidence in cells for protection of DNA by
stimulation of repair enzymes.Orange: Alpha- and beta-carotene from carrots localize in the skin
where they act as a local antioxidant to help protect the skin cells from
ultraviolet light. There is significant evidence for carotenoid accumulation
in skin (alpha- and beta-carotenes) to provide UVA/UVB protection.
B.7.3BEYOND THE FOUR FOOD GROUPS
The USDA Pyramid is the result of deliberations within the USDA which must take
into consideration economic factors related to food production and stabilization of the
food supply as well as health. The food groups are 1) Cereals and Grains; 2) Fruits and
Vegetables; 3) Meat, Beans, Nuts and Cheese; and 4) Dairy Products. There is also a
fifth group called Sweets, Fats and Oils which sits atop the USDA pyramid developed
in 1992 (see Figure 3 above).
SECTION II: BACKGROUND
32
B.7.2 - B.7.3
THE SEVEN COLORS OF HEALTH AND GARDEN 7® (Continued)
Figure 3 THE USDA PYRAMID
Sweets, Fats and Oils
Dairy Products
Fruits and Vegetables
Cerealsand Grains
Meats, Beans,Nuts and Cheese
4
1 3 62 5

5/7/2018 Manual Herbalife Para Medicos- English - slidepdf.com
http://slidepdf.com/reader/full/manual-herbalife-para-medicos-english 32/72
In the current USDA Pyramid developed in 2005, the largest band to the left 1, which is
orange in color, is still Cereals and Grains (again, see Figure 3). It remains the major
recommended food group, but now the advice is to eat at least three ounces per day of
whole grain bread, cereals, rice, crackers, or pasta. The next group 2, which is the green
band, is Vegetables. Vegetables are divided into dark-green colored, orange colored, dry
beans and peas, and others. The next band 3, which is red in color, is the Fruit Group.
Depending on the number of calories you burn each day, between nine and 13 servings offruits and vegetables are recommended. However, since these are divided into two groups,
the orange band for Grains remains the predominant food group recommended. In this
sense, there was no change from the old pyramid, despite a strong push from many
scientists to put the Fruits and Vegetables together as one group to form the base of the diet.
The next group 4 is a thin yellow band for Oils, even though the recommendations
indicate most Americans get enough. They get too much of the wrong oils and fats. The
next band 5 is the blue band for Milk. One change here is that milk itself is advised at
three servings per day on average. This group does not include cheeses, cream cheese or
other products made from milk. It also recommends low-fat or nonfat milk be used.
Meats, beans, nuts, seeds, peas and eggs are members of the last group to the right 6,
which is purple in color. Lean meats are advised.
As you can see, the width of each band varies, suggesting you eat more of the good
foods within each category. Also, the figure running up the side of the pyramid
indicates for the first time the importance of exercise. The pyramid is fully described
and individualized by age, gender and calorie requirements at the Web site
www.mypyramid.gov. However, this is hardly personalized and the number of calories
recommended will promote obesity and overweight.
The new pyramid leaves in place traditional therapeutic diets which provide
suggested servings of foods in the food groups defined by the USDA, since it is
impractical to calculate specific food values for every diet plan that is individually
administered. For example, exchange diets are based on the idea that all human diets
can be simplified into protein, carbohydrate or fat exchanges. So a serving of iceberg
lettuce and a serving of spinach are equivalent, as would be a serving of grain-fed primerib and a serving of ocean-caught tuna. Also, the pyramid makes fruit juices equivalent
to whole fruits, although it takes over two oranges to make a small glass of orange juice,
which does not have the fiber of a whole orange. However, there is a large Florida
orange juice industry depending on sales of the juice that provides 160 calories per
serving as simple carbohydrate.
Ultimately, this simplification leads to the misconception that food is simply an
energy source for the body and that there are certain minimum requirements for
avoiding deficiency and promoting health.
To some extent, according to these notions, a calorie is a calorie. The body can
interconvert from one source to another, and this is a key part of our adaptation to
starvation. However, there is no genetic pressure for eating a healthful diet that avoids
the chronic diseases of aging, since these arise after the age of reproduction has passed.Therefore, the preventive properties of the diet are dissociated from its provision of
nutritional energy or calories alone. The California Cuisine Pyramid developed at UCLA
in 1997 by Dr. David Heber and his colleagues puts fruits and vegetables at the base and
then whole grains. This was the first pyramid to do so and was followed by the Mayo
Clinic Pyramid in 2001, which did the same thing. However, this idea was never
accepted by the USDA. It should be noted that fruits and vegetables in 2000 received
only 4.5 percent of the nearly $80 billion in total subsidies largely given by the USDA
to grain producers.
As our society is solving the problem of malnutrition throughout the world, we
are left with chronic diseases of aging related to too many calories relative to physical
PHYSICIAN’S REFERENCE MANUAL B.7.3
3

5/7/2018 Manual Herbalife Para Medicos- English - slidepdf.com
http://slidepdf.com/reader/full/manual-herbalife-para-medicos-english 33/72
SECTION II: BACKGROUND
activity. These diseases are also related to poor-quality diets consisting of too few
servings of fruits, vegetables and whole grains and too many servings of high-fat, high-
sugar processed foods. The latter lack naturally occurring vitamins, minerals and the
thousands of secondary plant substances (phytonutrients, or phytochemicals).
The Herbalife-recommended Pyramid is based on seven or more colorful fruits and
vegetables per day (see Figure 4 on this page). These whole fruits and vegetables provide
less than 100 calories per serving compared to an average of over 200 calories perserving of grains and cereals. Protein on the next level is provided by high-protein, low-
fat shakes which can be made with fresh or frozen fruits to help meet the fruit and
vegetable requirements. In addition, lean meats and fish round out this level. Getting
your protein from beans and rice, or beans and corn, can result in too many calories. Soy
protein found in Herbalife shakes can provide the protein at about half the calories.
While grains are not mandatory (since there is carbohydrate included in Herbalife
shakes), it is possible to have one to three servings per day of whole-grain bread. A
serving is reduced on our pyramid to one-half cup of rice, pasta or potato so that you are
getting 125 calories per serving, which is more comparable to the 100 calories or less
found in fruits and vegetables. The top of the Herbalife-recommended Pyramid has herbs
and spices rather than sweets, fats and oils. The vertical organization of this pyramid is
clearer and less confusing than the vertical bands of the current USDA Pyramid. Back in1992, the food industry fought the original pyramid and recommended a bowl with
bands because it did not like the idea of a hierarchy of foods. The current USDA Pyramid
with vertical bands gave the food industry what it wanted–more confusion for the
consumer. Herbalife teaches consumers how to build a healthy diet, and recognizes that
supplements and exercise are also needed daily for good health.
Why worry about the composition of the diet? The premise is simple: Diet is a
major etiologic factor in chronic disease. Dietary chemicals change the expression of
one’s genes and even the genome itself. Genetic variation may explain the reason two
people can eat exactly the same diet and respond very differently. Nutritional genomics
emphasize the interactions at a cellular and molecular level studied through systems
biology. Herbalife® products provide not only a balance of macronutrients, but also
vitamins and minerals critical to health, as will be reviewed in the next section.
34
B.7.3
Figure 4 HERBALIFE-RECOMMENDED PYRAMID
HerbsandSpices
Grains
Protein
ColorfulFruits and
Vegetables

5/7/2018 Manual Herbalife Para Medicos- English - slidepdf.com
http://slidepdf.com/reader/full/manual-herbalife-para-medicos-english 34/72
Agus MSD, Swain JF, Larson CL,Eckert EA, Ludwig DS. (2000). Dietarycomposition and physiologicadaptations to energy restriction. AmJ Clin Nutr 271, 901–907.
Bagga D, Capone S, Wang H-J, Heber
D, Lill M, Chap L, and Glaspy JA.(1997). Dietary Modulation of Omega-3/omega-6 polyunsaturated fatty acidratios in patients with breast cancer. J Natl Cancer Inst 89, 1123-1131.
Barr SI, Murphy SP, Agurs-Collins TD,Poos MI. (2003). Planning Diets forIndividuals Using the DietaryReference Intakes. Nutr Rev 61, 352-360.
Bartsch H, Nair J, Owen RW. (1999).Dietary polyunsaturated fatty acidsand cancers of the breast andcolorectum: emerging evidence fortheir role as risk modifiers.Carcinogenesis 20, 2209–2218.
Berdanier C. (2000). Proteins. In:“Advanced Nutrition: Macronutrients2nd edition” pp. 130–196. CRC Press,Boca Raton.
Blot WJ, Li J-Y, Taylor PR, Guo W,Dawsey S, Wang G-Q, Yang CS, ZhengS-F, Gail M, Li G-Y, Yu Y, Liu B-Q,Tangrea J, Sun Y-H, Liu F, Fraumeni JF,Zhang Y-H, Li B. (1993). Nutritionintervention trials in Linxiang, China:supplementation with specificvitamin/mineral combinations, cancerincidence, and disease-specificmortality in the general population. J Nat Cancer Inst 85,1483-1492.
Boudreau MD, Sohn KH, Rhee SH, LeeSW, Hunt JD, Hwang DH. (2001).
Suppression of tumor cell growth bothin nude mice and in culture by n–3polyunsaturated fatty acids: mediationthrough cyclooxygenase-independentpathways. Cancer Res 61,1386–1391.
Brand-Miller JC, Holt SH, Pawlak DB,McMillan J. (2002). Glycemic indexand obesity. Am J Clin Nutr 76,281S-285S.
Calle EE, Thun MJ. (2004). Obesityand Cancer. Oncogene 23, 6365-6378.
Campbell WW, Crim MC, Dallal GE,Young VR, Evans WJ. (1994).Increased protein requirements inelderly people: new data andretrospective reassessments. Am J Clin
Nutr 60,
501–509.
Chawla A, Boisvert WA, Lee CH,Laffitte BA, Barak Y, Joseph SB, LiaoD, Nagy L, Edwards PA, Curtiss LK,Evans RM, Tontonoz P. (2001). A PPARgamma-LXR-ABCA1 pathway inmacrophages is involved in cholesterolefflux and atherogenesis. Mol Cell 7,161-171.
Chinetti G, Lestavel S, Bocher V,Remaley AT, Neve B, Torra IP, TeissierE, Minnich A, Jaye M, Duverger N,Brewer HB, Fruchart JC, Clavey V,Staels B. (2001). PPAR-alpha andPPAR-gamma activators inducecholesterol removal from human
macrophage foam cells throughstimulation of the ABCA1 pathway.Nat Med 7:53-58.
Clarkson TB, Anthony MS, MorganTM. Inhibition of postmenopausalatherosclerosis progression: acomparison of the effects of conjugatedequine estrogens and soyphytoestrogens. J Clin Endocrinol Metab.2001;86:41-7.
Committee on Diet and Health. (1989).Diet and health: protein. In “Diet andHealth: Implications for ReducingChronic Disease Risk” pp. 259-271.National Research Council, Food andNutrition Board, Washington DC.
Dumesnil JG, Turgeon J, Tremblay A,Poirier P, Gilbert M, Gagnon L, St-Pierre S, Garneau C, Lemieux I, PascotA, Bergeron J, Despres JP. (2001).Effect of a low-glycaemic index—low-fat—high protein diet on theatherogenic metabolic risk profile ofabdominally obese men. Br J Nutr 86,557-568.
Ebbeling CB, Leidig MM, Sinclair KB,Hangen JP, Ludwig DS. (2003). Areduced-glycemic load diet in thetreatment of adolescent obesity. ArchPediatr Adolesc Med 157, 773-779.
Eisenstein J, Roberts SB, Dallal G,Saltzman E. (2002). High protein weightloss diets: are they safe and do they
work? A review of experimental andepidemiologic data.Nutr Rev 60,189-200.
Epstein LH, Gordy CC, Raynor HA,Beddome M, Kilanowski CK, Paluch R.(2001). Increasing fruit and vegetableintake and decreasing fat and sugarintake in families at risk for childhoodobesity. Obes Res 9,171-178.
Febbraio MA, Keenan J, Angus DJ,Campbell SE, Garnham AP. (2000).Pre-exercise carbohydrate ingestion,glucose kinetics, and muscle glycogenuse: effect of the glycemic index.J Appl Physiol 89,1845–1851.
Ferguson LR, Philpott M,Karunasinghe N. (2004). Dietary
cancer and prevention usingantimutagens. Toxicology 20,147-159.
Folsom AR, Demissie Z, Harnack L.(2003). Glycemic index, glycemic loadand incidence of endometrial cancer:The Iowa women’s health study. Nutr Cancer 46,119-124.
Fourcade S, Savary S, Albet S, GautheD, Gondcaille C, Pineau T, Bellenger J,Bentejac M, Holzinger A, Berger J,Bugaut M. (2001). Fibrate inductionof the adrenoleukodystrophy-relatedgene (ABCD2): promoter analysis androle of the peroxisome proliferator-activated receptor PPARalpha. Eur J Biochem. 268,3490-3500.
Fuchs CS, Giovannucci EL, Colditz GA,Hunter DJ, Stampfer MJ, Rosner B,Speizer FE, Willett WC. (1999).Dietary fiber and the risk of colorectalcancer and adenoma in women. N Engl J Med 340, 169–176.
Fuller M. (2000). Proteins and aminoacid requirements. In “Biochemicaland Physiological Aspects of HumanNutrition” (M. Stipanuk, Ed), pp.287-304. WB Saunders, Philadelphia.
Fung T, Hu FB, Fuchs C, GiovannucciE, Hunter DJ, Stampfer MJ, ColditzGA, Willett WC. (2003). Major dietarypatterns and the risk of colorectalcancer in women. Arch Int Med
163,309-314.
Garza C, Scrimshaw NS, Young VR.(1977). Human protein requirements :a long-term metabolic nitrogen balance study in young men toevaluate the 1973 FAO/WHO safe levelof egg protein intake. J Nutr 107, 335-
352.
Goldin BR, Adlercreutz H, Gorbach SL,Warram JH, Dwyer JT, Swenson L,Woods MN. (1982). Estrogenexcretion patterns and plasma levels invegetarian and omnivorous women. N Engl J Med 307, 1542-1547.
Graham S, Zielezny M, Marshall J,Priore R, Freudenheim J, Brasure J,Haughey B, Nasca P, Zdeb M. (1992).Diet in the epidemiology ofpostmenopausal breast cancer in theNew York State cohort. Am J Epidemiol
136, 1327-1337.
Heber D, Bowerman S. (2001). WhatColor is Your Diet? Harper Collins,
New York.
Hill MJ. (1998). Cereals, cereal fibreand colorectal cancer risk: a review ofthe epidemiological literature. Eur J Cancer Prev 7:S5–S10.
Higginbotham S, Zhang ZF, Lee IM,Cook NR, Giovannucci E, Buring JE,Liu S. (2004). Dietary glycemic loadand risk of colorectal cancer in theWomen’s Health Study. J Natl Canc Inst 96 ,229-233.
Howe GR, Hirohata T, Hislop TG,Iscovich JM, Yuan JM, Katsouyanni K,Lubin F, Marubini E, Modan B, RohanT, et al. (1990). Dietary factors and riskof breast cancer: combined analysis of
12 case-control studies. J Natl Cancer Inst 82, 561-569.
Howe JC, Rumpler WV, Behall KM.(1996). Dietary starch composition andlevel of energy intake alter nutrientoxidation in ‘carbohydrate-sensitive’men. J Nutr 126, 2120–2129.
Jacobs DR, Marquart L, Slavin J, andKushi LH. (1998). Whole-grain intakeand cancer: an expanded review andmeta-analysis. Nutr Cancer 30, 85–96.
PHYSICIAN’S REFERENCE MANUAL
3
REFERENCES

5/7/2018 Manual Herbalife Para Medicos- English - slidepdf.com
http://slidepdf.com/reader/full/manual-herbalife-para-medicos-english 35/72
SECTION II: BACKGROUND
Jansen MC, Bueno-de-Mesquita HB,Buzina R, Fidanza F, Menotti A,Blackburn H, Nissinen AM, Kok FJ,Kromhout D. Seven Countries StudyResearch Group. (1999). Dietary fiberand plant foods in relation to colorectalcancer mortality: the Seven CountriesStudy. Int J Cancer 81, 174–179.
Jenkins DJ, Wolever TM, Taylor RH,
Barker H, Fielden H, Baldwin JM,Bowling AC, Newman HC, Jenkins AL,Goff DV. (1981). Glycemic index offoods: a physiological basis forcarbohydrate exchange. Am J Cl in Nutr 34,362-366.
Johnston CS, Tjonn SL, Swan PD.(2004). High-protein, low-fat diets areeffective for weight loss and favorablyalter biomarkers in healthy adults. J Nutr 134,586-91.
Kalman R, Adler JH, Lazarovici G, Bar-On H, Ziv E. (1993). The efficiency ofsand rat metabolism is responsible fordevelopment of obesity and diabetes. J Basic Clin Physiol Pharmacol 4, 57-68.
Karmali RA, Marsh J, Fuchs C. (1984).Effect of omega-3 fatty acids on growthof a rat mammary tumor. J Natl Cancer Inst 73,457–461.
Kim MH, Gutierrez AM, Goldfarb RH.(2002). Different mechanisms of soyisoflavones in cell cycle regulation andinhibition of invasion. Anticancer Res.22,3811-3817.
Kreutler P, Czajka-Narins D. (1987).Protein. In: “Nutrition in Perspective”pp. 121-162. Prentice Hall, UpperSaddle River.
Kris-Etherton PM, Lefevre M, BeecherGR, Gross MD, Keen CL, Etherton TD.(2004). Bioactive compounds in
nutrition and health-researchmethodologies for establishing biological funct ion: the antioxidantand anti-inflammatory effects offlavonoids on atherosclerosis. Ann Rev Nutr 24,511-538.
Lappe FM. (1971). Diet for a SmallPlanet. Ballantine Books, New York.
Layman DK, Boileau RA, Erickson DJ,Painter JE, Shiue H, Sather C, ChristouDD. (2003). Reduced ratio of dietarycarbohydrate to protein improves bodycomposition and blood lipid profilesduring weight loss in adult women. J Nutr 133, 411-417.
Leathwood P, Pollett P. (1988). Effects
of slow release carbohydrates in theform of bean flakes on the evolution ofhunger and satiety in man. Appetite 10,1-11.
Ledikewe JH, Smiciklas-Wright H,Mitchell DC, Miller CK, Jensen GL.(2004). Dietary patterns of rural olderadults are associated with weight andnutritional status. J Am Geriatr Soc 52,589-595.
Lee SS, Pineau T, Drago J, Lee EJ, OwensJW, Kroetz DL, Fernandez-Salguero PM,Westphal H and Gonzalez FJ. (1995).Targeted disruption of the alpha isoformof the peroxisome proliferator- activatedreceptor gene in mice results inabolishment of the pleiotropic effects ofperoxisome proliferators. Mol Cell Biol 15,3012-3022.Lindner MA. (1991). A fish oil diet
inhibits colon cancer in mice. Nutr Cancer 15, 1–11.
Liu S. (1998). Dietary glycemic load,carbohydrate and whole grain intakesin relation to risk of coronary heartdisease. Harvard University, Boston.1998.
Liu S, Manson JE, Buring JE, StampferMJ, Willett WC, Ridker PM. (2002).Relation between a diet with a highglycemic load and plasmaconcentrations of high-sensitivity C-reactive protein in middle-agedwomen. Am J Cl in Nutr 75, 492-498.
London SJ, Sacks FM, Caesar J,Stampfer MJ, Siguel E, Willett WC.
(1991). Fatty acid composition ofsubcutaneous adipose tissue and dietin postmenopausal US women. Am J Clin Nutr 54, 340-345.
Ludwig DS. (2002). The glycemicindex: physiological mechanismsrelating to obesity, diabetes, andcardiovascular disease. JAMA 287 ,2414-2423.
Ludwig DS, Majzoub JA, Al-Zahrani A,Dallal GE, Blanco I, Roberts SB.(1999). High glycemic index foods,overeating, and obesity. Pediatrics 103
:E26.
Martínez ME, Marshall JR, Alberts DS,(1999). Dietary fiber, carbohydrates ,
and cancer. In “Nutritional Oncology”,(D. Heber, G.L. Blackburn and V. L.W.Go, Eds), pp. 185–194. Academic Press,San Diego.
Matthews D. (1999). Proteins andamino acids. In “Modern Nutrition inHealth and Disease, 9th ed.” (Shils M,Olson J, Shike M, et al., eds.) pp. 11-48.Williams & Wilkins, Baltimore.
Mattisson I, Wirfalt E, Johansson U,Gullberg B, Olsson H, Berglund G.(2004). Intakes of plant foods, fibreand fat and risk of breast cancer–aprospective study in the Malmo Dietand Cancer cohort. Br J Cancer 90,122-127.
McCullough ML, Giovannucci EL.(2004). Diet and cancer prevention.Oncogene 23, 6349-64.
McCullough ML, Robertson AS, ChaoA, Jacobs EJ, Stampfer MJ, Jacobs DR,Diver WR, Calle EE, Thun MJ. (2003).A prospective study of whole grains,fruits, vegetables and colon cancer risk.Cancer Causes Control 14, 959-970.
McDowell M, Briefel R, Alaimo K, etal. (1994). Energy and macronutrientintakes of persons ages 2 months andover in the United States: ThirdNational Health and NutritionExamination Survey, Phase 1,1988–91. US Government PrintingOffice, Vital and Health Statistics,Washington, DC.
Messina MJ, Persky V, Setchell KD,Barnes S. (1994). Soy intake andcancer risk: a review of the in vitroand in vivo data. Nutr Cancer 21, 113-131Milner, J. (2002). Strategies for cancerprevention: the role of diet. Br J Nutr 87, S265-272.
Narayanan BA, Narayanan NK, ReddyBS. (2001). Docosahexaenoic acidregulated genes and transcriptionfactors inducing apoptosis in humancolon cancer cells. Int J Oncol 19,1255–1262.
National Research Council, Food andNutrition Board. (1989).Recommended Dietary Allowances.
10th ed. National Academy Press,Washington, DC.
Nationwide Food ConsumptionSurvey: Nutrient Intakes: Individualsin 48 States. Hyattsville, Md: US Deptof Agriculture, Consumer NutritionDivision, HNIS; 1977–1978. Report No.1-2.
Okuyama H, Kobayashi T, Watanbe S.(1996). Dietary fatty acids–the n-6/n-3 balance and chronic elderly diseases.Excess linoleic acid and relative n-3deficiency syndrome seen in Japan.Prog Lipid Res 35, 409-457.
Perez CE. (2002). Fruit and vegetableconsumption. Health Rep 13, 23-31.
Peterson G, Barnes S. (1996).Genistein inhibits both estrogen andgrowth factor-stimulated proliferationof human breast cancer cells. Cell Growth Differ 7, 1345-1351.
Putnam JJ, Allshouse JA. (1999).Food consumption, prices, andexpenditures, 1970–97. USDA,Washington DC.
Quatromoni PA, Copenhafer DL,D’Agostino RB, Millen BE. (2002).Dietary patterns predict thedevelopment of overweight in women:The Framingham Nutrition Studies. J
Amer Diet Assoc 102, 1240-1246.
Rohan TE, Howe GR, Friedenreich CM,Jain M, Miller AB. (1993). Dietaryfiber, vitamins A, C, and E, and risk of breast cancer: a cohort study. Cancer Causes Control 4, 29-37.
Rose DP, Connolly JM, Meschter CL.(1991). Effect of dietary fat on human brea st cancer growth and lungmetastasis in nude mice. J Natl Cancer Inst 83, 1491–1495.
Rose DP, Connolly JM. (1999).Omega-3 fatty acids as cancerchemopreventive agents. Pharmacol Ther 83, 217-244.
36

5/7/2018 Manual Herbalife Para Medicos- English - slidepdf.com
http://slidepdf.com/reader/full/manual-herbalife-para-medicos-english 36/72
Rosen ED, Spiegelman BM. (2001).PPARgamma : a nuclear regulator ofmetabolism, differentiation, and cellgrowth. J Biol Chem 276, 37731-37734.
Salmeron J, Ascherio A, Rimm EB,Colditz GA, Spiegelman D, Jenkins DJ,Stampfer MJ, Wing AL, Willett WC.(1997a). Dietary fiber, glycemic load,and risk of NIDDM in men. Diabetes
Care 20, 545–550
Salmeron J, Manson JE, Stampfer MJ,Colditz GA, Wing AL, Willett WC.(1997b) Dietary fiber, glycemic load,and risk of non-insulin-dependentdiabetes mellitus in women. JAMA277, 472–477.
Schatzkin A, Lanza . Polyp PreventionTrial Study Group. (2002). Polyps andvegetables (and fat, fibre): the polypprevention trial. IARC Sci Publ 156,463-466.
Simopoulos AP. (2001). N-3 fatty acidsand human health: Defining strategiesfor public policy. Lipids 36 :S83-89.
Skov AR, Toubro S, Ronn B, Holm L,Astrup A. (1999). Randomized trial onprotein vs carbohydrate in ad libitumfat reduced diet for the treatment ofobesity. Int J Obes Related Metab Disord
23, 528-536.
Slabber M, Barnard HC, Kuyl JM,Dannhauser A, Schall R. (1994).Effects of a low-insulin-response,energy-restricted diet on weight lossand plasma insulin concentrations inhyperinsulinemic obese females. Am J Clin Nutr 60, 48-53.
Steinmetz KA, Potter JD. (1991).Vegetables, fruits, and cancer. I.Epidemiology. Cancer Causes and Control
2:325-337.
Steinmetz KA, Potter JD. (1996).Vegetables, fruits and cancerprevention: a review. J Am Diet Assn.10, 1027-1039.
Swinburn BA, Caterson I, Seidell JC,James WP. (2004). Diet, nutrition andthe prevention of excess weight gain andobesity. Public Health Nutr 7, 123-146.
Tarnopolsky MA, Atkinson SA,MacDougall JD, Chesley A, Phillips S,Schwarcz HP. (1992). Evaluation ofprotein requirements for trainedstrength athletes. J Appl Physiol. 73,1986-1995.
Tarnopolsky M. (2004). Protein
requirements for endurance athletes.Nutrition. 20, 662-668.
Temple NJ. (2000). Antioxidants anddisease: more questions than answers.Nutr Res 20, 449-559.
Tohill BC, Seymour J, Serdula M,Kettel-Khan L, Rolls BJ. (2004).What epidemiologic studies tell usabout the relationship between fruitand vegetable consumption and bodyweight. Nutr Rev. 62, 365-374.
Tsai WS, Nagawa H, Kaizaki S, TsuruoT, Muto T. (1998). Inhibitory effects ofn–3 polyunsaturated fatty acids onsigmoid colon cancer transformants. J
Gastroenterol 33, 206–212.Verhoeven DT, Assen N, GoldbohmRA, Dorant E, van ‘t Veer P, SturmansF, Hermus RJ, van den Brandt PA.(1997). Vitamins C and E, retinol, beta-carotene and dietary fiber inrelation to breast cancer risk: aprospective cohort study. Br J Cancer 75, 149-155.
Way JM, Harrington WW, Brown KK,Gottschalk WK, Sundseth SS,Mansfield TA, Ramachandran RK,Willson TM, Kliewer SA. (2001).Comprehensive messenger ribonucleicacid profiling reveals that peroxisomeproliferator-activated receptor gammaactivation has coordinate effects ongene expression in multiple insulin-sensitive tissues. Endocrinology 142,1269-1277.
Westerterp-Plantega MS, Rolland V,Wilson SAJ, Westerterp KR. (1999).Satiety related to 24 h diet-inducedthermogenesis during highprotein/carbohydrate vs. high fat dietsmeasured in a respiration chamber.Eur J Clin Nutr 53, 495-502.
Westerterp-Plantenga MS, Lejeune MP,Nihs I, van Ooijen M, Kovacs EM.(2004). High protein intake sustainsweight maintenance after body weightloss in humans.Int J Obes Relat MetabDisord 28, 57-64.
Willett WC. (1994). Diet and health:what should we eat? Science 254, 532-537.
Willett WC. (1995). Diet, nutrition andavoidable cancer. Environ HealthPerspect 103, 165-171.
Willett WC, Hunter DJ, Stampfer MJ,Colditz G, Manson JE, Spiegelman D,Rosner B, Hennekens CH, Speizer FE.
(1992). Dietary fat and fiber in relationto risk of breast cancer: an 8-yearfollow-up. J Am Med Assoc 268, 2037-2044.
Willson TM, Brown PJ, Sternbach DD,Henke BR. (2000). The PPARs: FromOrphan Receptors to Drug Discovery. J
Med Chem 43, 527-550.
Wolfrum C, Borrmann, CM, BorchersT, Spener F. (2001). Fatty acids andhypolipidemic drugs regulate receptorsalpha - and gamma-mediated geneexpression via liver fatty acid bindingprotein: a signaling path to thenucleus. Proc. Natl. Acad. Sci. U.S.A. 98,2323.
World Cancer Research Fund. (1997).Food, Nutrition and the Prevention ofCancer: A Global Perspective.American Institute for CancerResearch, Washington, DC.
Yamamoto S, Sobue T, Kobayashi M,Sasaki S, Tsugane S. S(2003). Soy,isoflavones, and breast cancer risk inJapan. Japan Public Health Center-Based Prospective Study on CancerCardiovascular Diseases Group. CancerInformation and EpidemiologyDivision, National Cancer CenterResearch Institute, Tokyo, Japan, J Natl Cancer Inst 95, 906-913.
Zhang X, Shu XO, Gao YT, Yang G, LiQ, Li H, Jin F, Zheng W. (2003). Soyfood consumption is associated with alower risk of coronary heart disease inChinese women. J Nutr 133 ,2874-2878.≈
PHYSICIAN’S REFERENCE MANUAL
3

5/7/2018 Manual Herbalife Para Medicos- English - slidepdf.com
http://slidepdf.com/reader/full/manual-herbalife-para-medicos-english 37/72
SECTION II: BACKGROUND
C.VITAMINS AND MINERALS
C.1 INTRODUCTIONThere is still controversy about vitamins in the newspapers and medical journals in this
country, which reflects the poor state of nutrition education in our medical schools.
Studies in which vitamins are compared to drugs are publicized as showing that
vitamins have no benefit. Additionally, many physicians and other healthcare
providers are not familiar with the significant body of scientific studies supporting the
use of vitamins and minerals.
The majority of Americans do not meet through their diets the recommended
daily allowance of many of the vitamins and minerals that are critical to promoting
health and preventing disease. Vitamin supplementation has been shown to prevent
neural tube defects and improve immune function, and other studies suggest that
generous intakes of vitamins and minerals may reduce the risk of coronary heart
disease, cancer and osteoporosis. Optimal intakes of vitamins and minerals from a
combination of food and supplements are important goals in efforts at heath promotion
and disease prevention.
There are three scientific arguments supporting the use of vitamins and mineral
supplements. First, use of these supplements can help bring consumption of vitamins
and minerals up to recommended levels. Second, there may be benefits of vitamins and
minerals in maintaining optimal health and preventing disease at levels above the
recommended intakes. Finally, adequate micronutrient intake can be beneficial in
reducing the risk of birth defects and may help reduce the risk of some chronic diseases.
These concepts are grounded in evidence provided by a large number of studies,
including laboratory studies, population studies and a small number of clinical trials.Additional research looking at dosing levels, targeted populations and long-term effects
is now underway.
C.2PREGNANCY AND BIRTH DEFECTS
One out of every 30 babies born in the United States has a serious birth defect. Each
year, some 3,000 pregnancies are affected by what is called a neural tube defect (NTD),
such as spina bifida (in which an opening in the spinal cord does not close) or
anencephaly (in which a baby is born without a brain).
Since 1980, more than a dozen studies have looked at the role of folic acid in
reducing the incidence of neural tube defects. Perhaps the most important, the 1991
United Kingdom Medical Research Council (UKMRC) randomized clinical trial, found
that folic acid use could reduce the relative risk of NTD by more than 70 percent (MRC
Vitamin Study Research Group). The United States Public Health Service (USPHS) drew
on this data to issue recommendations on folic acid the following year. It said that
women capable of becoming pregnant should take 400 micrograms (or millionths of a
gram) of folic acid daily, which is the amount contained in a daily multivitamin The
Food and Drug Administration (FDA) followed this advisory with orders requiring all
products made with “enriched” grain to contain additional folic acid, and approved the
38
C - C.2

5/7/2018 Manual Herbalife Para Medicos- English - slidepdf.com
http://slidepdf.com/reader/full/manual-herbalife-para-medicos-english 38/72
use of health claims for products that contain significant amounts of the vitamin. The
Centers for Disease Control and Prevention (CDC) suggest that the consumption of
supplemental folic acid could significantly reduce that number even beyond what has
been achieved to date with the fortification of “enriched” grain products—to the extent
that about 80 percent of these birth defects could be prevented.
Educational programs soon emerged, targeting women of childbearing years,
healthcare professionals, women’s groups and policy makers. Surveillance studiesconducted in China, Canada and the United States have shown that fortification programs
have dramatically lowered the prevalence of NTD. More and more women of childbearing
age have become familiar with the need for folic acid; the percentage of women between
ages 18 and 45 who heard about folic acid grew by more than 50 percent between 1995
and 2000. However, only 10 percent knew the correct dose and only one-third actually
consumed the vitamin daily. Thus, although at least part of the folic acid message is
reaching targeted women, not all are benefiting from that information.
C.3IMMUNE FUNCTION
Diet and nutritional status are two of the key factors affecting the body’s immune
response. Recent studies show that multivitamin use, in concert with a good diet, is a
cost-effective tool to enhance immunity, reduce the incidence of infection, and improve
overall quality of life. Immune status is relatively easy to test, because unlike in
cardiovascular disease or cancer, established and accepted measures of immune
function are available. In randomized clinical trials conducted by Dr. Ranjit Chandra in
Newfoundland, Canada, micronutrients have been shown to enhance the response of
lymphocytes and natural killer cells; increase production of interleukin-2; and reduce
the duration of infection and the time spent on antibiotics. These studies demonstrate
that inadequate micronutrient intakes are associated with poorer immune responses
and an increased incidence of infection, and that consumption of a multivitamin canhelp eliminate this deficit.
C.4CARDIOVASCULAR DISEASE
Elevated levels of homocysteine are a major risk factor for coronary disease and
ischemic stroke. Indeed, people with the highest homocysteine levels have a nearly
two-fold increase in the risk of coronary heart disease (CHD), compared to those with
normal levels. This risk is comparable to that associated with smoking or high
cholesterol. Folate is essential to homocysteine metabolism, and a number of studies
have established the link between folate intake and CHD. Contributions to loweringhomocysteine levels are also made, though to a lesser degree, by Vitamins B6 and
B12. Low-serum folate levels were associated with an increased risk of fatal CHD in
studies from Canada (Morrison et al., 1996) and Europe (Robinson et al., 1998),
while in the United States, higher intake of folate and Vitamin B6 reduced that risk
(Rimm et al., 1998). Homocysteine-lowering therapy with folate and B complex was
also found to decrease the incidence of death, nonfatal heart attacks and other
adverse events following coronary angioplasty (Schnyder et al., 2002). This finding
was confirmed in a large, case-control study from Sweden, which showed that use of
a multivitamin supplement reduced the risk of a myocardial infarction by 21 percent
PHYSICIAN’S REFERENCE MANUAL C.3 - C.4
3

5/7/2018 Manual Herbalife Para Medicos- English - slidepdf.com
http://slidepdf.com/reader/full/manual-herbalife-para-medicos-english 39/72
SECTION II: BACKGROUND
in men and 34 percent in women, suggesting that consumption of folate and B
complex may aid in the primary prevention of heart attacks (Holmquist et al., 2003).
Additional studies are now in progress to further clarify the relationship between
these vitamins and coronary disease.
Vitamins C and E are essential, well-established antioxidants, and researchers
have investigated whether these micronutrients have a role to play in heart disease
prevention. To date, some studies have found a mild effect for higher-dose Vitamin Cusers (Osganian et al., 2003), while others have failed to establish a relationship
(Kushi et al., 1996). Similarly, the Nurses’ Health Study found that women taking
modest amounts of Vitamin E had a 44 percent reduction in the incidence of heart
disease (Stampfe et al., 1993) and that higher doses (400 to 800 IU) reduced the rate
of second heart attacks in heart patients (Stephens et al., 1996). However, other well-
controlled trials found no effect (Rapola et al., 1997; Yusuf et al., 2000).
Since these studies were done in individuals who already had heart disease, it is
difficult to account for the many different factors which may have caused their heart
disease and made them different from one another. Therefore, when these people
were assigned by chance to get the placebo or vitamin supplements, the results may
have been more related to the individual profiles of those assigned to the two arms
of the study rather than to whether the vitamins were having an effect. Researchersassumed that such differences are overcome by large numbers, but this may not be
true in the case of a complex disease such as heart disease, with so many different
factors involved. While it would be of great interest to conduct a prevention study in
otherwise healthy individuals, such a study would require huge numbers and be
prohibitively expensive.
C.5CANCER
Folic acid deficiency may contribute to the development of cancer by interfering with
normal gene processes. Thus, there has been much recent interest in the effects of
folate supplementation on cancer prevention. Both the Nurses Health Study and the
Health Professionals Follow-up Study found that long-term (15 years in the former,
10 in the latter) folate consumption significantly reduced the risk of colorectal cancer.
Studies done by Dr. Ed Giovannucci and his team at the Harvard School of Public
Health found that in women who use alcohol and have low blood folate levels,
supplementation helped lower the elevated risk of breast cancer associated with
drinking (Zhang et al., 1999). Ongoing trials continue to explore the effects of folate
supplementation, especially in users of alcohol, where the interaction appears to be
very strong.
Vitamin E has been investigated in connection with a number of major cancers,
including breast, lung, colon and prostate. Only in the latter does it appear to have asignificant effect across several studies. In the ATBC trial, researchers found that 400
mg of Vitamin E reduced the incidence of, as well as mortality from, prostate cancer
in male smokers (Albanes et al., 1995). This association has since been confirmed,
both in non-smokers and smokers. On the strength of this evidence, the National
Cancer Institute (NCI) is conducting a primary prevention trial (called the “SELECT
trial”) of selenium and vitamin E versus a placebo for prostate cancer prevention in
25,000 normal men.
An editorial in The New York Times suggested that no cancer patients should take
Vitamin C or Vitamin E, but it was based on a misinterpretation of two basic findings.
The first is that Vitamin C is concentrated by cancer cells, which the author of the
40
C.5

5/7/2018 Manual Herbalife Para Medicos- English - slidepdf.com
http://slidepdf.com/reader/full/manual-herbalife-para-medicos-english 40/72
editorial assumed meant that the cancer cell used this Vitamin C to stimulate tumor
cell growth. Dr. David Golde of the Sloan-Kettering Cancer Center in New York
discovered that Vitamin C is taken up by the glucose transport proteins in tumor cells.
Before the tumor cell can take up Vitamin C through the glucose transport system, it
must be oxidized to a form called dehydroascorbate. This form of Vitamin C is taken up
and then trapped in the cell when it is converted back to Vitamin C inside the cell by
reducing enzymes. But the concentrations required to do this do not occur in humanswho take Vitamin C by mouth; to reach these concentrations, Vitamin C would have
to be given by vein. This would never happen in someone taking vitamin
supplements. The experiments that resulted in the caution on Vitamin E were
performed in animals that were made Vitamin E deficient and compared to normal
Vitamin E status animals. Because it is not possible to make humans deficient in
Vitamin E, this study also has no relevance to supplements of Vitamin E in humans
with cancer.
The consumption of various carotenoids, such as lycopene, lutein and beta carotene,
may reduce the risk of lung cancer by one-third, but pure beta-carotene at high doses of
30 mg may elevate it, particularly in smokers. Calcium supplementation, too, may protect
against osteoporosis and the development and recurrence of colon polyps, which are a
precancerous change in the colon (Baron et al., 1999; Bonithon-Kopp et al., 2000), butsome data suggest that in extremely high doses (greater than 1,500 mg per day total),
calcium may increase the risk of prostate cancer (Chan et al., 2000; Giovannucci et al.,
1998). Data in the latter study suggested that taking Vitamin D with calcium may reduce
any negative effects while maintaining the colon cancer protection. Also, no man should
get less than the recommended dietary allowance, which is 1,000 mg per day of calcium.
Cancer is a collection of heterogeneous conditions with complex causes and histories, and
there is much more research that needs to be done on the use of vitamins and minerals
for cancer prevention.
C.6 OBESITY AND DIABETESWhile most of the population fails to consume adequate levels of micronutrients,
the problem is particularly severe for the obese. There is evidence that overweight
men and women with high cholesterol levels who are on diets do not achieve the
RDA of most essential vitamins and minerals, due to lower micronutrient intake, lack
of adherence and over-restriction of foods (Gryzbek et al., 2002). This nutritional
deficiency clearly compromises their health status. Research conducted on people
with type 2 diabetes has shown that those taking a multivitamin supplement had a
lower incidence of infections and infection-related absenteeism than did those
receiving placebo (Barringer et al., 2003). While a relatively small study, the
magnitude of the differences in infection-incidence noted over one year in diabeticpatients were remarkable. Those who took a placebo had a 93 percent incidence over
one year of infectious episodes while those taking a multivitamin had an incidence of
only 17%. These findings deserve further research in larger populations, as the
implications are significant. In a study of people at risk for diabetes, investigators
reported that males who took beta-carotene supplements improved their glucose
metabolism, as did women who consumed Vitamin E (Ylonen et al., 2003). While
dieting has important implications for nutritional intake in all populations, it may
play an even more essential role in those who are overweight and those with either
metabolic syndrome or adult-onset diabetes mellitus.
PHYSICIAN’S REFERENCE MANUAL C.6
4

5/7/2018 Manual Herbalife Para Medicos- English - slidepdf.com
http://slidepdf.com/reader/full/manual-herbalife-para-medicos-english 41/72
SECTION II: BACKGROUND
C.7SAFETY OF VITAMINS
The consumption of Vitamin A above 25,000 IU per day (daily value = 5,000 IU) canclearly cause skeletal birth defects–and this amount is only five times the RDA.
Pregnant women should not consume more than 2,500 IU of Vitamin A per day to
avoid any possibility of problems. A few recent studies suggest that long-term
consumption in excess of 5,000 IU/day Vitamin A may be associated with decreased
bone mineral density and an increased risk of osteoporosis (Promislow et al., 2000). On
the other hand, insufficient intake also may accelerate the loss of bone mineral density.
Thus, there is a narrow window of optimal Vitamin A intake in adults. It is recommend
that a multivitamin that contains about 2,500 IU of preformed Vitamin A, or 5,000 IU
of Vitamin A, be used, of which at least 50 percent comes from beta-carotene.
As noted previously, high calcium intakes (above 1,500 mg/day) have been
associated with an increased risk of prostate cancer (Giovannucci et al., 1998). Also, an
antioxidant supplement combining Vitamins C and E, selenium and beta-carotene wasfound to reduce the protective effects of a lipid-lowering agent and niacin in 160
patients with heart disease and low HDL cholesterol levels (Brown et al., 2001),
although a larger trial of 20,000 patients, using a supplement of Vitamin C, Vitamin E
and beta-carotene, reported that the antioxidant combination did not inhibit the
protective effects of the lipid-lowering drug (Heart Protection Study Collab. Group).
It is important to realize that the safety of vitamins and minerals is often decided
by government committees reviewing reports of adverse effects to determine an
arbitrary “tolerable upper limit.” In some countries in the world, any vitamins in
amounts above the recommended dietary allowance are considered medicines. There
are ongoing discussions on the safety of vitamins and strong opinions based on limited
data, often from inconclusive meta-analyses, which combine different studies.
Herbalife® products contain safe levels of vitamins and minerals, and the product line
undergoes constant review. Reformulation is done if the science or regulatory
interpretation of science changes in local markets throughout the world. This explains
the difference in the various formulations of similar products in different countries.
42
C.7

5/7/2018 Manual Herbalife Para Medicos- English - slidepdf.com
http://slidepdf.com/reader/full/manual-herbalife-para-medicos-english 42/72
Albanes D, Heinonen OP, HuttunenJK, Taylor PR, Virtamo J, Edwards BK,Haapakoski J, Rautalahti M, HartmanAM, Palmgren J, et al. “Effects ofalpha-tocopherol and beta-carotenesupplements on cancer incidence inthe Alpha-Tocopherol Beta-Carotene
Cancer Prevention Study.” Am J ClinNutr. 1995;62(6 Suppl):1427S-1430S.
Baron JA, Beach M, Mandel JS et al.“Calcium supplements for theprevention of colorectal adenomas.” N Engl J Med. 1999;340:101-107.
Barringer TA, Kirk JK, Santaniello AC,Foley KL, Michielutte R. “Effect of amultivitamin and mineral supplementon infection and quality of life. Arandomized, double-blind, placebo-controlled trial.” Ann Intern Med.
2003;138(5):365-71.
Bonithon-Kopp C, Kronborg O,Giacosa A, Rath U, Faivre J. “Calciumand fibre supplementation in
prevention of colorectal adenomarecurrence: a randomised interventiontrial.” European Cancer PreventionOrganisation Study Group. Lancet.
2000;356(9238):1300-6.
Brown BG, Zhao XQ, Chait A, FisherLD, Cheung MC, Morse JS, Dowdy AA,Marino EK, Bolson EL, Alaupovic P,Frohlich J, Albers JJ. “Simvastatin andniacin, antioxidant vitamins, or thecombination for the prevention ofcoronary disease.” N Engl J Med. 2001Nov 29;345(22):1583-92.
Chan JM, Pietinen P, Virtanen M,Malila N, Tangrea J, Albanes D,Virtamo J. ”Diet and prostate cancerrisk in a cohort of smokers, with a
specific focus on calcium andphosphorus (Finland).” Cancer CausesControl. 2000 Oct;11(9):859-67.
Chandra RK. “Effect of vitamin andtrace-element supplementation onimmune responses and infection inelderly subjects.” Lancet. 1992;340:1124-1127.
Giovannucci E, Stampfer MJ, ColditzGA, Hunter DJ, Fuchs C et al.“Multivitamin use, folate, and coloncancer in women in the Nurses’ HealthStudy.” Ann. Intern Med. 1998;129(7):517-524.
Giovannucci E, Rimm EB, Wolk A,Ascherio A, Stampfer MJ, Colditz GA,
Willett WC. “Calcium and fructoseintake in relation to risk of prostatecancer.” Cancer Res. 1998;58(3):442-7.
Graham IM, Daly LE, Refsum HM,Robinson K, Brattstrom LE, et al.“Plama homocysteine as a risk factorfor vascular disease.” The EuropeanConcerted Action Project. JAMA. 1997;277(22):1775-1781.
Gryzbek A, Klosiewicz-Latoszek L,Targosz U. “Changes in the intake ofvitamins and minerals by men andwomen with hyperlipidemia andoverweight during dietetic treatment.”Eur J Clin Nutr. 2002;56:1162-1168.
Heart Protection Study CollaborativeGroup. “MRC/BHF Heart ProtectionS t u d y o f a n t i o x i d a n t v i t a m i nsupplementation in 20,536 high-riskindividuals: a randomised placebo-controlled trial.” Lancet. 2002;360(9326):23-33.
Holmquist C, Larsson S, Wolk A, deFaireU. “Multivitamin supplements areinversely associated with risk ofmyocardial infarction in men andwomen.”–Stockholm Heart EpidemiologyProgram (SHEEP). J Nutr. 2003;133:2650-2654.
Kushi LH, Folsom AR, Prineas RJ, MinkPJ, Wu Y et al. “Dietary antioxidantvitamins and death from coronary heart
disease in postmenopausal women.” N Engl J Med. 1996;334(18_):1156-1162.
Michaud DS, Feskanich D, Rimm EB,Colditz GA, Speizer FE, Willett WC,Giovannucci E. “Intake of specificcarotenoids and risk of lung cancer in 2prospective US cohorts.” Am J ClinNutr. 2000;72(4):990-7.
Morrison HI, Schaubel D, DesmeulesM, Wigle DT. “Serum folate and risk offatal coronary heart disease.” JAMA.
1996;275(24):1893-1896.
MRC Vitamin Study Research Group.“Prevention of neural tube defects:results of the Medical Research
Council Vitamin Study.” Lancet. 1991;338(8760):131-7
Osganian SK, Stampfer MJ, Rimm E,Spiegelman D, Hu FB, Manson JE,Willett WC. “Vitamin C and risk ofcoronary heart disease in women.” J
Am Coll Cardiol. 2003;42(2):246-52.
Persad VL, Van den Hof MC, Dube JM,Zimmer P. “Incidence of open neuraltube defects in Nova Scotia after folicacid fortification.”CMAJ. 2002;167(3):241-5.
Promislow JH, Goodman-Gruen D,Slymen DJ, Barrett-Connor E. “Retinolintake and bone mineral density in theelderly: the Rancho Bernardo Study.”J
Bone Miner Res. 2002;17(8):1349-58.
Rapola JM, Virtamo J, Ripatti S,Huttunen JK, Albanes D, Taylor PR,Heinonen OP. “Randomised trial ofalpha-tocopherol and beta-carotenesupplements on incidence of majorcoronary events in men with previousmyocardial infarction.” Lancet. 1997;349(9067):1715-20.
Rimm EB, Willett WC, Hu FB,Sampson L, Colditz GA et al. “Folateand vitamin B6 from diet andsupplements in relation to risk ofcoronary heart disease amongwomen.” JAMA. 1998;279(5):359-364.
Robinson K, Arheart K, Refsum H,Brattstrom L, Boers G et al. “Lowcirculating folate and vitamin B6concentrations: risk factors for stroke,peripheral vascular disease, andcoronary artery disease.” EuropeanCOMAC Group. Circulation. 1998;97(5):437-443.
Schnyder G, Roffi M, Flammer Y, PinR, Hess O. “Effect of homocystein-lowering therapy with folic acid,vitamin B12 and vitamin B6 on clinicaloutcome after percutaneous coronaryintervention.” The Swiss Heart Study:A Randomized Controlled Trial. JAMA.
2002;288:973-979.
Stampfer M, Hennekens C, Manson J,
Colditz G, Rosner B et al. “Vitamin Econsumption and the risk of coronaryartery disease in women.” N. Eng J
Med. 1993; 328(20):1444-1449.
Stephens NG, Parsons A, Schofield PM,Kelly F, Cheeseman K et al.“Randomised controlled trial ofvitamin E in patients with coronarydisease: Cambridge Heart AntioxidantStudy (CHAOS).” Lancet. 1996;347(9004):781-786.
“Summary of notifiable diseases—United States, 2000.” MMWR Morb
Mortal Wkly Rep. 2002 Jun 14;49(53):i-xxii, 1-100
Ylonen K, Alfthan G, Groop L,
Saloranta C, Aro A, Virtanen SM.“Dietary intakes and plasmaconcentrations of carotenoids andtocopherols in relation to glucosemetabolism in subjects at high risk oftype 2 diabetes: the Botnia DietaryStudy.” Am J Clin Nutr. 2003;77(6):1434-41.
Yusuf S, Dagenais G, Pogue J, Bosch J,Sleight P. “Vitamin E supplementationand cardiovascular events in high-riskpatients.” The Heart Outcomes PreventionEvaluation Study Investigators. N Engl J
Med. 2000;342(3):154-60.
Zhang S, Hunter DJ, Hankinson SE,Giovannucci EL, Rosner BA, ColditzGA, Speizer FE, Willett WC. “A
prospective study of folate intake andthe risk of breast cancer.” JAMA. 1999;281(17):1632-7.
PHYSICIAN’S REFERENCE MANUAL
4
REFERENCES

5/7/2018 Manual Herbalife Para Medicos- English - slidepdf.com
http://slidepdf.com/reader/full/manual-herbalife-para-medicos-english 43/72
SECTION II: BACKGROUND
D.WEIGHT MANAGEMENT AND
MEAL REPLACEMENT
D.1DEFINITION OF OBESITY
Obesity is the most common nutritional disorder in the United States. In the world at-
large, the number of overnourished people is now equivalent to the number of
undernourished individuals–both at 2.1 billion.
Obesity is defined as Excess Body Fat minus Not Excess Body Weight (see section
E: “Body Composition” on pages 55 through 59). However, on average, body weight is
a useful surrogate, and body-mass index is used to follow the obesity epidemic and its
association with diseases since, as a practical matter, it is difficult to measure bodycomposition on tens of thousands of individuals.
D.2CAUSES OF OBESITY
The most common causes of obesity are overeating and underactivity. There is evidence
for differences in metabolism, making some individuals more efficient in hanging onto
calories, but the most common reasons for differences in the tendency to gain or lose
weight relate to age, height, sex and weight. Therefore, obesity results from common
genetic predisposition, but is expressed only when there is excess energy available
for storage.
Energy In = Energy Out + Energy Stored
However, energy out is largely related to body composition in terms of lean tissue
rather than fat tissue. So a man who is 74 inches tall might burn 2,200 calories per day,
while his wife at 62 inches tall burns only 1,200 calories per day due to differences in the
amount of lean-body mass they each have. Is it any wonder that the woman in this case
will lose weight more slowly than her husband if both are on the same diet of 1,000
calories per day?Despite these individual differences in energy needs and expenditure, it is clear that
the modern diet contains too many calories per bite to enable the normal weight-
regulatory mechanisms in the body to operate properly. This is illustrated by a rat
experiment. If pellets with more oil are fed to a rat, the rat will eat fewer pellets and
maintain a normal weight. If fat is removed from the pellets, the rat will eat more pellets
and still maintain its weight. On the other hand, if the rat is fed what is known as a
“cafeteria diet” (made up of peanut butter, salami and chocolate chip cookies), the rat will
lose all control of its homeostatic mechanisms and become as large as genetically obese
rodents. Mankind, by analogy, adapted to low-nutrient density diets and is no longer able
to maintain normal body fat on the high-fat, high-sugar diets of modern times.44
D - D.2
5/7/2018 Manual Herbalife Para Medicos- English - slidepdf.com
http://slidepdf.com/reader/full/manual-herbalife-para-medicos-english 44/72
D.3BODY-FAT REGULATION AND
FUNCTION AS AN
ENDOCRINE ORGANBody fat is a vital organ, just like the heart, liver, kidney or skin. It has nerves, blood
vessels and fat cells, and this organ secretes hormones and small proteins that affect
energy balance, fat storage and metabolism. The function of body-fat organs depends
on where they are located in the body. Each of the body-fat organs in the lower body
as female fat and in the upper body in both men and women, has special functions with
regard to the uptake and release of fatty acids and in terms of the hormones they
secrete and to which they respond. There is emerging evidence that leptin comes from
both lower- and upper-body fat, whereas adiponectin comes from abdominal fat.
D.3.1 FEMALE FATThe fat on women’s hips and thighs provide the energy mothers need to provide milk
to their newborn babies. This fat responds to female hormones, and in every menstrual
cycle right after ovulation there is a one-thousand-fold increase in the blood levels of
the female hormone, progesterone. So when women believe they are gaining small
amounts of weight in addition to being bloated–they are correct. The body is preparing
for pregnancy by developing the fat organ in the hips and thighs, and it grows much
more if a woman becomes pregnant due to the large amounts of estrogen and
progesterone produced by the placenta. A considerable number of calories must be
stored, since breast-milk production normally requires about 500 calories per day.
The main factor accounting for female obesity is weight gain after pregnancy.Women typically gain between 30 and 40 pounds during pregnancy. If they do not
breast-feed or diet in the six months after delivery, the weight gained during pregnancy
is not lost. The next pregnancy starts at a higher weight, and more weight is gained
with the second pregnancy–and so forth. Understanding how this fat accumulates can
help women lose this fat after delivering their children and can lead to prevention of
obesity.
Just as women are born with different-shaped bodies, women are born with
different-sized hip and thigh fat organs. There is nothing wrong with that body of fat,
except that our modern society has labeled it as bad. This was never the case prior to
the past four decades, women with lower body fat were considered attractive, and
biology reflected what was desirable. There is a disconnect between women’s genetics
and what is considered attractive by many people. However, there has been a backlash.
For instance, full-figured women have begun speaking out about the attractiveness of
larger women, and full-figured models have been appearing more and more in
billboards and in fashion magazines. A key message is that there needs to be more
tolerance of different body shapes in our society.
Finally, this fat tends to be more resistant to diet and exercise, and there are many
women who starve themselves trying to lose this fat. Some even lose too much fat in
their faces and chests to look healthy. It is important to be aware of their appropriate
target weight and shape if they have more fat in the hips and thighs than in the
upper body.
PHYSICIAN’S REFERENCE MANUAL D.3 - D.3.1
4

5/7/2018 Manual Herbalife Para Medicos- English - slidepdf.com
http://slidepdf.com/reader/full/manual-herbalife-para-medicos-english 45/72
SECTION II: BACKGROUND
D.3.2ABDOMINAL FAT
The fat in the middle of the body surrounds the intestines and has special properties
both in terms of the substances released into the bloodstream by this fat and in the
hormones to which this fat responds. Both men and women can accumulateabdominal fat. There are some women who have only upper-body fat, and never
accumulate much lower-body fat. Then there are also women who accumulate both
upper- and lower-body fat.
Those women with upper-body fat have higher male hormone levels than do
women with lower-body fat. They are three times more likely to get breast cancer and
about nine times more likely to get diabetes than women with lower-body fat.
This fat is designed to store a limited amount of fat for the purpose of surviving
short periods of starvation. It secretes a number of substances called cytokines to fight
infection. When malnourished, humans are more susceptible to infections. Therefore,
it makes sense that abdominal fat should work to protect against such infections.
This fat also responds to the stress hormone cortisol. This stress hormone comes
from the adrenal gland. In a disease called “Cushing’s syndrome,” there isoverproduction of cortisol by the adrenal glands with a resulting increase in this fat
organ in the middle of the body. There is an enzyme called 11-betahydroxysteroid
dehydrogenase which can convert cortisone to cortisol. In mice genetically altered to
produce more of this enzyme, they accumulate fat only in the abdomen and not in
other fat pads.
Abdominal fat is easier to lose with dieting than lower-body fat. It is often the
first fat to be lost in those with both upper- and lower-body fat.
D.3.3 BRAIN CENTERS AND BODY FATThe fat cells make leptin, a hormone named for the Greek word for “thinning.” It was
first discovered in a mutant line of obese mice who made a defective version of this
normal hormone. These mice develop about 60 percent of their body weight as fat tissue.
When normal mice had their circulation merged with these obese mice, they corrected
the abnormality and the mice lost weight. Leptin is sensed in a part of the brain called the
Arcuate nucleus of the hypothalamus, where it is one of many different signals to the
brain. Leptin deficiency is extremely rare, but there is a village in Turkey where a family
has this deficiency. Dr. Julio Licinio at UCLA, recently treated this family with leptin, and
they lost large amounts of weight, going from massively obese to a normal size. Leptin
has other effects. It both reduces food intake and increases physical activity. It also inhibits
new blood-vessel formation, another way it may inhibit new fat-tissue growth in
genetically obese mice.
Insulin is the feeding hormone and goes up after eating. It pushes fats into fat cells
for storage and amino acids into muscle. It also stores some sugars as starch in the liver
and muscle. Insulin comes from cells in the pancreas and goes up together with leptin in
response to nutrients such as glucose and amino acids. Insulin is transported into the
brain. For the last 30 years, Dr. Daniel Porte at the University of California, San Diego,
has championed the theory that obesity is due to a lack of insulin action in the brain.
Using primates, he has demonstrated that high levels of insulin in the blood are associated
with reduced insulin action in the brain.
Leptin levels change in the opposite direction to another peptide–neuropeptide Y,46
D.3.2 - D.3.3
5/7/2018 Manual Herbalife Para Medicos- English - slidepdf.com
http://slidepdf.com/reader/full/manual-herbalife-para-medicos-english 46/72
or NPY. When leptin goes down, NPY increases in the brain. NPY has the opposite effect
to leptin, and it increases food intake.
New insights into the complex regulation of food intake, metabolism and energy
homeostasis have refined the understanding of the pathophysiology of malnutrition.
Studies in rodents have demonstrated that the adaptation to starvation is far better
developed than the adaptation to overnutrition both in the short term and long term.
Long-term signals associated with body-fat stores are provided by leptin andinsulin. The concentration of leptin in the blood is highly correlated with total fat mass.
Excess body fat results in increased leptin production from fat cells, while decreases in
body fat that occur with dieting cause leptin and insulin concentrations to decrease,
triggering responses that aim to conserve body fat. These circulating hormones also
modulate short-term signals that determine meal initiation and termination. Signals
that provide short-term information about hunger and satiety include gut hormones
such as cholecystokinin, ghrelin, and peptide YY3-36. Vagal afferent nerves within the
gastrointestinal tract also provide short-term signals in response to distension,
macronutrients, pH, tonicity and hormones. The neural and hormonal signals are then
integrated within specific regions of the hypothalamus and brainstem.
Anorexigenic (appetite-suppressing) signals are generated by a-melanocyte-
stimulating hormone, a peptide derived from proopiomelanocortin which derives its
name from its actions in skin pigmentation through interaction with the melanocortin 1
receptor. This hormone reduces food intake and increases energy expenditure through
the melanocortin 4 receptor in the hypothalamus. Deletion of the melanocortin 4
receptor gene in animals results in obesity, hyperphagia and reduced energy
expenditure. Deletion of the related melanocortin 3 receptor gene results in obesity due
to reduced energy expenditure without hyperphagia.
Antagonism of anorexigenic melanocortin signals is caused by orexigenic
(appetite-stimulating) peptides such as agouti-related protein and neuropeptide Y.
Agouti-related protein antagonizes the interaction between a-melanocyte-stimulating
hormone and the melanocortin 4 receptor. Neuropeptide Y, found in the arcuate
nucleus of the hypothalamus, is a member of the pancreatic polypeptide family andincreases during food restriction, acting to increase food intake. Neuropeptide Y
decreases expression of the gene encoding proopiomelanocortin. Neuropeptide Y also
decreases the synthesis of thyrotropin-releasing hormone and increases the synthesis of
melanin-concentrating hormone, another orexigenic peptide.
Ghrelin is a 28-amino-acid, acetylated peptide secreted by oxyntic cells in the
stomach fundus. Ghrelin is named for its ability to stimulate growth hormone
secretagogue receptors to increase the release of growth hormone from the pituitary.
Circulating levels of ghrelin increase before meals and decrease after eating. Ghrelin
increases food intake through the stimulation of ghrelin receptors on hypothalamic
neuropeptide Y-expressing neurons and agouti-related protein-expressing neurons.
Peptide YY3-36 (PYY) is secreted after meals in proportion to the calories ingested
by endocrine L cells lining the distal small bowel and colon. The initial release of PYYafter eating occurs through neural mechanisms before ingested nutrients arrive in the
distal small intestine and colon. Subsequently, PYY is released in response to direct
intestinal stimulation by nutrients, especially lipids and carbohydrates. PYY decreases
food intake in both lean and obese individuals through inhibition of gut motility. This
function is referred to as the “ileal brake” and results from the actions of vagal afferent
neurons that ascend from the intestinal tract to the hindbrain and interact with
humoral receptors in the hypothalamus. PYY inhibits NPY-expressing neurons and
AgRP-expressing neurons through inhibitory neuropeptide Y2 receptors. This results in
disinhibition of neighboring proopiomelanocortin-expressing neurons, resulting in
decreased food intake.
PHYSICIAN’S REFERENCE MANUAL D.3.3
4

5/7/2018 Manual Herbalife Para Medicos- English - slidepdf.com
http://slidepdf.com/reader/full/manual-herbalife-para-medicos-english 47/72
SECTION II: BACKGROUND
Following gastric bypass surgery for obesity, hunger diminishes, circulating
concentrations of ghrelin decrease and circulating concentrations of PYY increase. This
suppression of hunger may contribute to long-term weight maintenance of reduced
body weight in these patients.
Since ghrelin signals hunger and PYY signals satiety, some investigators have
conducted studies in transgenic mice to examine whether these hormones can be
manipulated to affect body composition. Experimental knockouts of the ghrelin gene,AgRP, and NPY gene and a double knockout of the AgRP and NPY genes are not
associated with any obvious effects on food intake or energy metabolism. On the other
hand, inactivating mutations of the genes encoding leptin or the leptin receptor and the
melanocortin 4 receptor result in obese phenotypes. Consistent with the hypothesis
that humans and mice are better adapted to starvation than overnutrition, it is evident
that the orexigenic peptides are so critical to survival that the absence of one peptide is
compensated for by the actions of others. However, the orexins also communicate
widely throughout the brain, with such regions as those involved in satiety (brainstem)
and sleep/wakefulness. Indeed, the orexin knock-out mouse exhibits typical features of
narcolepsy in addition to hypophagia. An important role of the orexins might be to
integrate a variety of behaviors related to feeding or fasting, including emotional
changes, reward responses and sleep/alertness.
Insulin-like growth factor I (IGFI)/somatomedin C stimulates amino acid uptake
and protein synthesis while inhibiting lipolysis. IGF peptides in serum are associated
with IGF binding proteins (IGFBPs), a family of six polypeptides thought to modulate
storage, transport and action of the IGFs. As noted above, IGFI secretion parallels GH
secretion with age. During starvation, this linkage is broken. In the presence of elevated
GH levels, IGFI levels remain low, and the concentration of IGFI inhibitors in the
circulation is increased.
As if this were not enough, the fat tissue makes other hormones, including
omentin, vasofatin and resistin, that have effects on the breakdown of nutrients by the
body. Some of the hormones made in abdominal fat are not secreted into the
bloodstream and are presumed to regulate the functions of cells within the abdominalfat.
The take-home lesson from all of this is that maintaining body weight in the face
of starvation is a very important and basic function maintained by overlapping groups
of hormones produced in various parts of the body, but the fat organs have a lot to
do with transmitting to the brain the state of nourishment. The fat in the body is
regulated. It is clearly possible to change it through diet and lifestyle, but the many
attempts to “fool Mother Nature” by changing one part of the system have
not succeeded.
D.3.4 GENES AND OBESITYObesity is the result of an interaction of genes and environment. Nonetheless, the total
number of individuals with rare genetic defects account for only 5 percent of all cases
of obesity. Some of these disorders are fascinating and involve multiple problems in
mental functioning, reproduction, vision and facial appearance.
The majority of the obese population is simply well-adapted to starvation.
Research on the genes involved in familial obesity have so far shown up some
70 associations with parts of the human genome. However, it is unlikely that this search
will uncover any single unique target that accounts for a significant percentage of48
D.3.3 - D.3.4

5/7/2018 Manual Herbalife Para Medicos- English - slidepdf.com
http://slidepdf.com/reader/full/manual-herbalife-para-medicos-english 48/72
obesity cases. Rather, most experts suggest any one defect may contribute about
2 percent to the tendency to gain weight. Somehow the cumulative effects of multiple
genes are what tip the balance towards gaining weight.
On the other hand, it is the sedentary lifestyle of the current age which combines
with the high-fat, high-sugar, and high-starch diet to unmask the genes for obesity. It
is generally believed that the very obese (those over 100 pounds overweight or with a
BMI >40) have the greatest genetic programming for obesity. In the last 10 years, whenobesity has doubled, the number of people with severe obesity has increased four-fold
according to a recent Rand study.
However, beyond obesity in general shape is also genetic. Identical twins reared
apart not only have similar body weights but photographs of their fat distribution show
almost identical pockets of fat. So, the body’s shape is genetically determined, but it can
be altered significantly with diet and lifestyle changes.
D.4MEAL REPLACEMENT
D.4.1HISTORY OF MEAL REPLACEMENTS
The late Dr. Ernst Drenick, a UCLA obesity specialist, was featured in a Life magazine
article in the 1960s about starvation as a treatment for severe obesity. The only problem
was that an individual would lose muscle at a proportion of one pound for every four
pounds of weight lost with this method.
Protein-modified fasting (also known as “very low calorie dieting”) was developed
clinically by Dr. Victor Vertes at the Cleveland Clinic in the late 1970s. By this method,which was validated by the scientific studies of Dr. George Blackburn and Dr. Vernon
Young at the Massachusetts Institute of Technology (MIT), an individual could take in
enough protein to restore what was being lost. It worked to some extent and was safe
as long as the individual consumed high-quality proteins and had their blood tested
every week. The amount of calories in this diet was extremely low–in the range of 375
to 400 calories per day.
Satisfying physical hunger to some extent with a liquid meal was the basis of the
Opti-Fast diet, which was provided through hospitals beginning in the late 1970s. In
1977, the late Dr. Morton H. Maxwell brought this method of dieting to Los Angeles at
the Risk Factor Obesity Clinic, which is still in operation today at UCLA. This clinic
collects data on all the patients enrolled and includes a multidisciplinary team of
psychologists, exercise physiologists, nurses and dieticians who meet weekly. The
emotional support provided by this center has led to miraculous results, with patients
losing large amounts of weight safely, and effectively maintaining their weight loss
for years.
In the late 1970s, the very low-calorie Cambridge diet was sold to people door-to-door
without medical monitoring and caused about 80 deaths around the country, mostly in
women with less than 40 pounds to lose. These women lost muscle protein from their
hearts because they had small protein reserves. The massively obese patients did better
because they could draw down their huge protein reserves. Since the heart is both a
muscle and an electrical generator that regulates its own beating, the muscle loss in
these women resulted in fatal heart attacks as their hearts stopped beating. Due to this
PHYSICIAN’S REFERENCE MANUAL D.3.4 - D.4.
4

5/7/2018 Manual Herbalife Para Medicos- English - slidepdf.com
http://slidepdf.com/reader/full/manual-herbalife-para-medicos-english 49/72
SECTION II: BACKGROUND
bad publicity, doctors avoided having much to do with diets such as this, leaving it to
specialists like Dr. Maxwell, who developed centers like the one at UCLA, to carry on
quietly saving thousands of lives over the years.
In the 1970s and 1980s, research probed into how these diets worked from a
nutritional viewpoint, and this research led ultimately to the development of high-
carbohydrate/low-fat/low-protein meal replacement shakes that were sold over the
counter. These shakes were different from VLCD shakes in that they did not requiremedical supervision when incorporated into diets at greater than 1,000 calories per day.
At about this time, Mark Hughes founded Herbalife in 1980 and began what
would grow into the largest distribution method for meal replacements, in the world
over the next 27 years, as the effectiveness of meal replacements were immediately
evident to him. It would take the next 20 years after Herbalife’s founding for the
scientific evidence that meal replacements work to be published in peer-reviewed
journals and be accepted by the scientific community.
D.4.2NUTRIENT COMPOSITION OFHERBALIFE FORMULA 1 AND
HIGH-PROTEIN/LOW-CARB DRINK MIXNot all meal replacements are alike. Some taste better than others. The first meal
replacements used a lot of sugar and very little protein to optimize taste. Since high-
protein diets came into fashion, some have more protein and less sugar, but much
more fat. When a meal replacement is packaged in a can, there is a limit to how much
protein can be engineered into the liquid without having it settle out. One of the
strategies for getting more protein is to add more fat. However, if the meal
replacement has more than 5 grams of fat, under FDA rules, its manufacturer can no
longer make any health claims. Some of the high-protein drinks contain 10 grams offat, which is 90 calories of fat in a 270-calorie high-protein drink.
Herbalife’s ShapeWorks® Formula 1 contains high-quality soy protein, low
amounts of fat and a moderate amount of carbohydrate, together with vitamins,
minerals and a proprietary herbal blend.
Note: To be classified as a meal replacement a shake must provide at least 170
calories. Therefore, a high-protein/low-carb drink mix is classified as a nutritional
protein snack in the ShapeWorks® program. In order to be easily duplicated by patients
helping other patients, VLCD at levels below 1,000 calories per day is not part of the
ShapeWorks® or Doctors in Herbalife program. This minimizes the amount of medical
testing needed to safely administer this plan.
D.4.3CLINICAL RESEARCH ON MEALREPLACEMENTS: AN ACCOUNT BYDR. DAVID HEBER
Throughout the 1980s, meal replacements were being sold over-the-counter, and
advertising raised the awareness of the public about the existence of meal replacements.
At about this time, I started my research with meal replacements. I had seen the results in
my clinic, but in the late 1980s I started to document the effects on blood pressure,50
D.4.1 - D.4.3

5/7/2018 Manual Herbalife Para Medicos- English - slidepdf.com
http://slidepdf.com/reader/full/manual-herbalife-para-medicos-english 50/72
cholesterol and blood sugar in diabetics and non-diabetics overweight and obese patients.
In 1994, I supervised a study of more than 300 patients at six medical centers in
the United States. They were paid $25 a week and given a can of the powdered meal
replacement each week. They mixed the powder with milk and drank a shake twice a
day for weight loss, together with a reasonable dinner, providing about 1,200 calories
per day. The results were amazing. Men lost 24 pounds in 12 weeks on average. Women
lost 12 pounds in 12 weeks, but by 24 weeks both men and women had lost an averageof 17 pounds. In 1994, I published these results in a paper entitled “Clinical Evaluation
of a Minimal Intervention Meal Replacement Regimen for Weight Reduction” in The
Journal of the American College of Nutrition.
In the late 1990s a series of studies were done which demonstrated the impact of
meal replacements on blood pressure, cholesterol, triglycerides, blood sugar and sleep
disorders. Our own unit at UCLA conducted key studies showing that meal
replacements were safe and effective when used for type 2 diabetes with obesity (what
I call “diabesity”). In these studies, weight loss with meal replacements led to reduction
or elimination of expensive medications used to treat high-blood sugar in these diabetes
patients after a relatively modest weight loss of about 5 percent of body weight. This
amount of weight loss in a study called the “Diabetes Prevention Program” prevented
58 percent of new cases of diabetes over five years in people who had high-blood sugars(but had not yet developed diabetes) and was better at prevention of diabetes than a
drug approach.
However, the most striking study was done by Dr. Herwig Ditschuneit at the
University of Ulm in Germany. In most American studies, we lose between 20 percent
and 40 percent of participants in research studies by the end of one year. This is not
because we lose track of them; studies have shown that volunteers in weight-loss
research studies are always looking for the “magic bullet” and tend to abandon these
studies in mid-stream. Given the strict overseeing of Human Subjects Protection
Committees at UCLA and elsewhere, it is no longer possible to provide strong monetary
incentives linked in any way to continued participation in research. This is now
considered unethical as it is viewed as forcing the patient to participate in the research.
We do have to pay for parking and provide them with monetary compensation for their
participation not linked in any way to attending sessions in the research study. So we
can hand out some goodies, such as pedometers and provide theater tickets and
lotteries for gifts, and that’s about it.
I bring this up because Dr. Ditschuneit kept 75 percent of his patients on his study
for four years and proved that meal replacements were not just effective for weight loss
but also for weight maintenance. He couldn’t leave the patients on two meal
replacements a day for four years, so the study had an interesting design. For the first
twelve weeks, volunteers were randomly assigned to either try to cut down on eating
their favorite foods to reach a target of 1,200 calories per day or follow a meal
replacement plan at the same number of calories, which involved drinking two meal
replacements a day and eating a healthy dinner. At the end of twelve weeks, the groupthat tried to cut down on their favorite foods lost a pound or two on average, but the
meal replacement group lost 14 pounds. At that point both groups were told to have
one meal replacement a day. By the end of four years, the group that consumed two
meal replacements a day for twelve weeks and then one a day for four years lost
10 percent of their body weight. The group who started the meal replacements after
12 weeks and had one per day for four years lost 5%. There were also significant
changes in some of the risk factors for obesity-associated diseases, such as glucose and
insulin levels, with larger changes in the group that lost 10 percent of body weight
compared to the group that lost 5 percent of body weight (see Figure 5 on page 52). A
statistician at UCLA analyzed the data, and the results were published in The American
Journal of Clinical Nutrition.
PHYSICIAN’S REFERENCE MANUAL D.4.3
5

5/7/2018 Manual Herbalife Para Medicos- English - slidepdf.com
http://slidepdf.com/reader/full/manual-herbalife-para-medicos-english 51/72
SECTION II: BACKGROUND
As a result of all this research, meal replacements are now an accepted method of
weight-loss treatment. The National Institutes of Health is sponsoring a multi-million dollar
trial on the effects of weight loss on heart disease in type 2 diabetes patients over five years.
Based on some of our research at UCLA and that of others, they have chosen to include
meal replacements as a nutritional intervention option in one arm of the study.
D.4.4RECENT RESEARCH ON
SHAPEWORKS® (ABSTRACT)The ShapeWorks® plan is simple and is based on the meal replacement strategy
described below:
THE PLAN TO LOSE WEIGHT
Replace two meals a day with portion-controlled, low-calorie,
nutritionally balanced mealsSnacks between meals (fruit and vegetables) to reduce severe hunger
Physical activity and emotional support
THE PLAN TO MAINTAIN WEIGHT LOSS
Replace one meal a day with portion-controlled, low-calorie meal and
eat two well-balanced meals
Physical activity and emotional support
If weight gain occurs, restart the weight-loss plan until excess
weight is lost
52
D.4.3 - D.4.4
Figure: Weight loss over four years using a meal replacement twice a day for twelve weeks (solid triangles) compared tocutting back on favorite foods (solid squares). Until the end of the study at four years, one meal replacement per day was
used by both groups (body weight in solid circles). Weight in pounds on the vertical scale is plotted against time in months
on the horizontal scale. Figure adapted from reference 2: Flechtner-Mors M, Ditschuneit HH, Johnson TD, Suchard MA,
Adler G. “Metabolic and weight loss effects of long-term dietary intervention in obese patients: four-year results.” Obes
Res. 2000 Aug;8(5):399-402.
Figure 5

5/7/2018 Manual Herbalife Para Medicos- English - slidepdf.com
http://slidepdf.com/reader/full/manual-herbalife-para-medicos-english 52/72
Unlike other meal-replacement plans, ShapeWorks® allows patients to personalize
their protein intake. They can choose to take adequate protein to prevent nutritional
deficiency, which is the U.S. RDA of 56 grams for men and 46 grams for women, or
they can choose to take 1 gram of protein per pound of lean body mass as determined
by body composition (see section E: “Body Composition” on pages 55 through 59).
To test the safety and effectiveness of this approach, 100 obese patients were
recruited for study at the UCLA Center for Human Nutrition. At three months, theamounts of weight lost in each of the two groups was equivalent, but there was more
lean-body mass retained by the high-protein group. Clearly, compliance in this research
setting was not affected by the higher protein and masked the satiety benefits. That is,
psychology trumps physiology in weight management, and the nature of this double-
blind study made it impossible to influence behavior. Since it is known that people
overeat even when they are not hungry, the equivalent weight loss is not surprising.
The retention of increased lean-body mass is significant.
Shown in Figure 6 above is the result of bioelectrical impedance determinations at
three months. While weight losses were equivalent, the higher-protein group lost
significantly more body fat by three months and hence retained more lean-body mass
on average. The amounts of weight lost by both groups were typical of the experience
with meal replacements in clinical trials and clearly is much less significant than what
is seen in individuals with higher levels of compliance. The study design retains all
subjects in both groups regardless of compliance level and this minimizes the average
weight losses seen.
Recent studies done in Seattle and published in The American Journal of Clinical
Nutrition confirm the findings of equivalent weight losses with increased retention of
lean-body mass. The higher-protein, low-fat, lower-carbohydrate approach of
ShapeWorks® is a state-of-the-art, science-based program that provides your patients
the finest in nutrition and weight-management support.
PHYSICIAN’S REFERENCE MANUAL D.4.4
5
Figure 6

5/7/2018 Manual Herbalife Para Medicos- English - slidepdf.com
http://slidepdf.com/reader/full/manual-herbalife-para-medicos-english 53/72
SECTION II: BACKGROUND
REFERENCES
Flechtner-Mors M, Ditschuneit HH, Johnson TD, Suchard MA, Adler G. “Metabolic and weight loss effects of long-termdietary intervention in obese patients: four-year results.” Obes Res. 2000 Aug;8(5):399-402.
Hensrud DD “Dietary treatment and long-term weight loss and maintenance in type 2 diabetes.” Obes Res. 2001 Nov;9 Suppl4:348S-353S.
Yip I, Go VL, DeShields S, Saltsman P, Bellman M, Thames G, Murray S, Wang HJ, Elashoff R, Heber D. “Liquid mealreplacements and glycemic control in obese type 2 diabetes patients.” Obes Res. 2001 Nov;9 Suppl 4:341S-347S.
Bowerman S, Bellman M, Saltsman P, Garvey D, Pimstone K, Skootsky S, Wang HJ, Elashoff R, Heber D. “Implementationof a primary care physician network obesity management program.” Obes Res. 2001 Nov;9 Suppl 4:321S-325S.
Ashley JM, St Jeor ST, Perumean-Chaney S, Schrage J, Bovee V. “Meal replacements in weight intervention.” Obes Res. 2001Nov;9 Suppl 4:312S-320S
Heymsfield SB, van Mierlo CA, van der Knaap HC, Heo M, Frier HI. “Weight management using a meal replacement strategy:meta and pooling analysis from six studies.” Int J Obes Relat Metab Disord. 2003 May;27(5):537-49.
Weigle DS, Breen PA, Matthys CC, Callahan HS, Meeuws KE, Burden VR, Purnell JQ. A high-protein diet induces sustainedreductions in appetite, ad libitum caloric intake, and body weight despite compensatory changes in diurnal plasma leptin andghrelin concentrationsAm J Clin Nutr. 2005 Jul;82(1):41-8.
54
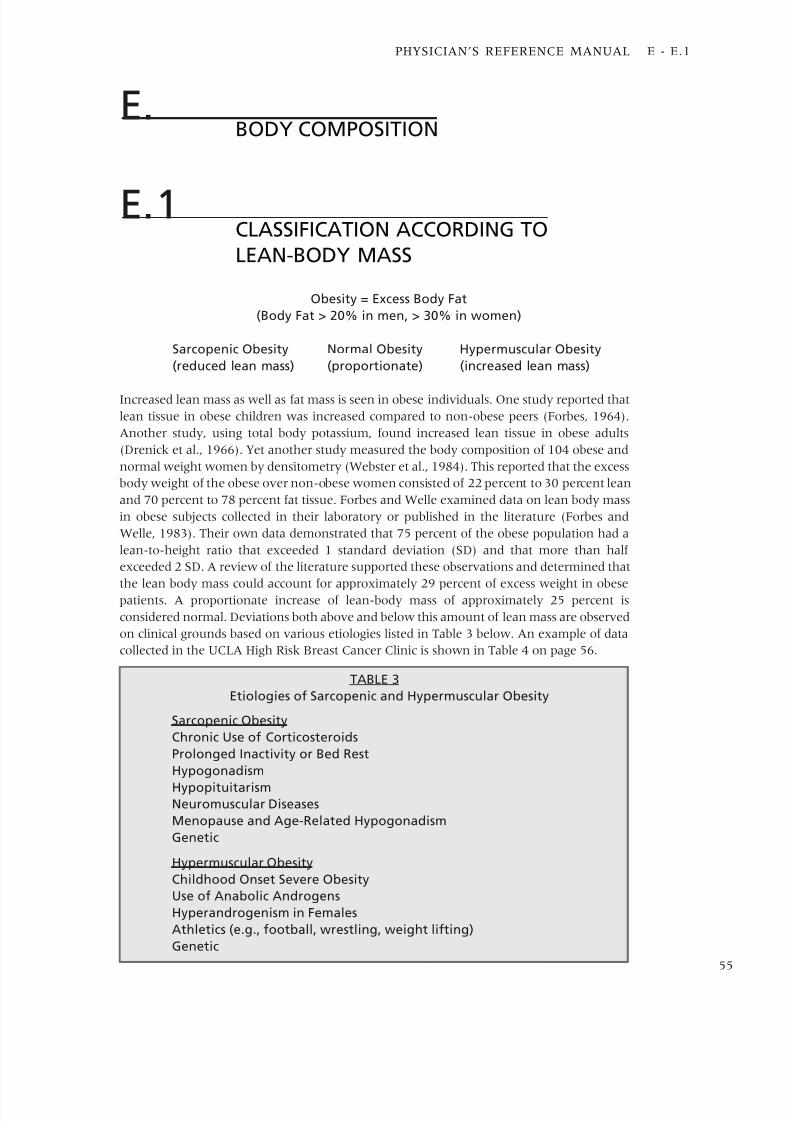
5/7/2018 Manual Herbalife Para Medicos- English - slidepdf.com
http://slidepdf.com/reader/full/manual-herbalife-para-medicos-english 54/72
E.BODY COMPOSITION
E.1 CLASSIFICATION ACCORDING TO
LEAN-BODY MASS
Obesity = Excess Body Fat
(Body Fat > 20% in men, > 30% in women)
Sarcopenic Obesity Normal Obesity Hypermuscular Obesity
(reduced lean mass) (proportionate) (increased lean mass)
Increased lean mass as well as fat mass is seen in obese individuals. One study reported that
lean tissue in obese children was increased compared to non-obese peers (Forbes, 1964).
Another study, using total body potassium, found increased lean tissue in obese adults
(Drenick et al., 1966). Yet another study measured the body composition of 104 obese and
normal weight women by densitometry (Webster et al., 1984). This reported that the excess
body weight of the obese over non-obese women consisted of 22 percent to 30 percent lean
and 70 percent to 78 percent fat tissue. Forbes and Welle examined data on lean body mass
in obese subjects collected in their laboratory or published in the literature (Forbes and
Welle, 1983). Their own data demonstrated that 75 percent of the obese population had a
lean-to-height ratio that exceeded 1 standard deviation (SD) and that more than half
exceeded 2 SD. A review of the literature supported these observations and determined that
the lean body mass could account for approximately 29 percent of excess weight in obesepatients. A proportionate increase of lean-body mass of approximately 25 percent is
considered normal. Deviations both above and below this amount of lean mass are observed
on clinical grounds based on various etiologies listed in Table 3 below. An example of data
collected in the UCLA High Risk Breast Cancer Clinic is shown in Table 4 on page 56.
PHYSICIAN’S REFERENCE MANUAL E - E.1
5
TABLE 3
Etiologies of Sarcopenic and Hypermuscular Obesity
Sarcopenic Obesity
Chronic Use of Corticosteroids
Prolonged Inactivity or Bed Rest
Hypogonadism
HypopituitarismNeuromuscular Diseases
Menopause and Age-Related Hypogonadism
Genetic
Hypermuscular Obesity
Childhood Onset Severe Obesity
Use of Anabolic Androgens
Hyperandrogenism in Females
Athletics (e.g., football, wrestling, weight lifting)
Genetic

5/7/2018 Manual Herbalife Para Medicos- English - slidepdf.com
http://slidepdf.com/reader/full/manual-herbalife-para-medicos-english 55/72
SECTION II: BACKGROUND
E.2RMR AND PREDICTED WEIGHT LOSS
FROM LEAN-BODY MASSLean-body mass is clinically important for two reasons. First, lean-body mass predicts
energy expenditure and, thereby, the predicted rate of weight loss on a given calorically-
restricted diet (Lohman et al., 1987). Secondly, lean-body mass can be used to diagnose
increased or decreased lean-body mass. In the first instance, the increased lean-body mass
can be used to calculate a more appropriate target weight than would be predicted from
ideal body-weight tables. In those subjects with reduced lean-body mass, a program of
aerobic and heavy resistance training can be initiated to provide for an increase in lean-
body mass and energy expenditure. In both markedly obese individuals and individuals
with decreased lean-body mass, there is a linear relationship (Sterling-Pasmore Equation)
of lean-body mass to energy expenditure (ca. 13.8 Kcal/day/lb lean-body mass). This
represents approximately 90 percent of total energy expenditure in a sedentary obese
individual, and provides a good clinical estimate of maintenance calories.
E.3BASIC SCIENCE BEHIND
BIOIMPEDENCEThe principle behind bioelectrical impedance analysis is that the fat tissues of the body
do not conduct electrical impulses as well as lean tissues, such as muscle, which are 70
percent water. While there are many ways to measure bioimpedance, the most widelyaccepted method involves the placement of four skin paste electrodes similar to those
used to obtain electrocardiograms. These are placed at set points on one arm and one
leg. By separating the electrodes a known distance based on the height of the individual
which is provided to the computer in the analyzer, it is possible for the bioimpedance
analyzer to quantitatively measure the electrical characteristics of the body. This can
then be used to calculate lean-body mass and fat mass as described in the following:
This type of circuit has a frequency-dependent impedance based on the resistance
and capacitance (reactance) of the circuit elements, which are fat and lean tissue in this
case. As the frequency is increased the circuit acts more like a simple resistor, and
56
E.1 - E.3
TABLE 4
Body Mass and Percent Body Fat in Women
at Increased Risk of Breast Cancer
(From Heber et. al., The American Journal of Clinical Nutrition, 1996)
n=28 Age Wt. Ht. BMI Body Fat(yr) (lbs) (in) (wt/ht2) ( % )
Mean
+ SD 36.8+6.4 137.8+1.9 65.3+2.7 22.9+3.1 34.6+4.8
(nl < 27) (nl 22-28%)

5/7/2018 Manual Herbalife Para Medicos- English - slidepdf.com
http://slidepdf.com/reader/full/manual-herbalife-para-medicos-english 56/72
electricity travels through the circuit easily. At low frequencies it acts more like a
capacitor until at 0 Hz (cycles/sec) there is no circuit flow and the impedance
approaches infinity. All bioimpedance analyzers use an equation such as the one shown
below. The Biodynamics impedance analyzer, in particular, uses four sets of equations
to be able to predict lean-body mass with different constants for different body types.
LBM = (A X Ht2) + (B X Wt) + (C X Age) + (D X R) + E
Where: LBM = lean-body massHt2 = the height squared in units the machine reads
either centimeters or inchesWt = weight in pounds or kilogramsAge = age in years, since lean-body mass tends to
decrease with ageR = bioimpedance in ohms
The reactance is not used, but by convention the bioimpedance is readat 50 Hz. Some variable frequency machines are available which claim torepresent extracellular and intracellular water by measuring impedance atdifferent frequencies.
Data Provided By a Manufacturer on Correlation With
Underwater Weighing (Bioanalogics, Inc.)
Clinical Results Men WomenPercent Body Fat 4.3-37.1 12.0-45.5R correlation 0.98 0.96SEE (% body fat) 1.50% 1.62%Sample Size 198 226
PHYSICIAN’S REFERENCE MANUAL E.3
5
The impedance meter is a simple electrical circuit with the following
characteristics:

5/7/2018 Manual Herbalife Para Medicos- English - slidepdf.com
http://slidepdf.com/reader/full/manual-herbalife-para-medicos-english 57/72
SECTION II: BACKGROUND
E.4CHALLENGES IN THE CLINICAL USE
OF BIOELECTRICAL IMPEDANCEDuring the first week of caloric restriction, there is a loss of body weight in excess of
the loss of lean and fat tissue due to a diuresis. If patients are measured at their first
visit and then weekly thereafter, it is possible to find that patients are apparently
gaining fat as they lose weight using bioelectrical impedance. Since lean-body mass is
assessed based on both body water and muscle, the loss of water leads to an apparent
decrease in lean-body mass, which in most cases, exceeds the loss of fat in the first week
of dieting leading to an increase in percent body fat (Yang, 1988). The bioelectrical
impedance measurement is most useful at the first visit for assessing type of obesity
(usual, decreased lean mass, increased lean mass, or fat maldistribution), and not useful
for multiple serial determinations. In fact, the machine is not accurate enough to pick
up small changes; therefore, it is advised to delay repeating the measurement until the
patient has reached a weight close to target weight.
A second potential problem is overemphasis on the quantitative accuracy of body-fat estimation. Small changes cannot be measured using this device. It is important to
stress this fact to patients. The changes observed in percent fat often do not impress
patients as much as the ratio of the absolute change in fat mass in pounds compared to
changes in lean mass.
E.5FUTURE RESEARCH ANDOTHER METHODS
There should be standards set for calibrating machines from different manufacturers.There are a number of laboratories that have multiple methods for measuring body
composition, including total body potassium, underwater weighing, TOBEC, DEXA
and deuterium dilution. Each of these has drawbacks and strong points, but none is the
“gold standard.” The only perfect method is carcass analysis, and that can be done only
once. Table 5 on this and the following page shows the methods and the principles
underlying their determination. They correlate with one another but do not give the
exact same measurements of body composition.
TABLE 5
TOTAL BODY POTASSIUM
Detects natural K 39 decay in body from potassium assumed to be in
muscle. Assumes potassium concentration of muscle is constant–not
always true in malnutrition. Body fat attenuates signal so poor
in obesity.
DEXA
Scan X-ray absorptiometry of body on scan table. Assumes density of
muscle and fat different.
58
E.4 - E.5

5/7/2018 Manual Herbalife Para Medicos- English - slidepdf.com
http://slidepdf.com/reader/full/manual-herbalife-para-medicos-english 58/72
TABLE 5 (Continued)
TOBEC
Body passes through magnetic field weakening it proportional to
conductivity of the body. Uses magnetic field for bioimpedance.
(Similar problems to bioimpedance).
UNDERWATER WEIGHING
Weight underwater compared to land is a function of body density.
Air trapped in lungs affects density.
DEUTERIUM DILUTION
Exact volume of deuterium diluted into the body water. Water
volume not exactly equivalent to lean tissues (similar problems to
bioimpedance).
BOD POD
Air displacement in a closed chamber with scale in the seat (similarproblems to underwater weighing).
REFERENCES
Garrow JS, Webster J. Quetelet’s Index (W/H2) as a measure of fatness.Int J Obes 1985;9:147-153.
Forbes GB. Lean body mass and fat in obese children.Pediatrics 1964;34:308-314.
Drenick EJ, Blahd WH, Singer FR, et al. Body potassium content in obese subjects and postassium depletion duringprolonged fasting. Am J Cl in Nutr 1966;18:278-285.
Webster JD, Hesp R, Garrow JS. The composition of excess weight in obese women estimated by body density, total bodywater, and total body potassium. Human Nutrition: Clinical Nutrition 1984;38C:299-306.
Forbes GB, Welle SL. Lean body mass in obesity. Int J Obesity 1983;7:99-107.
Segal KR, Van Loan M, Fitzgerald PI, Hodgson JA, Van Italie, TB. Lean body mass estimation by bioelectrical impedanceanalysis: a four-site clinical validation study. Am J Cl in Nutr 1988;47:7-14.
Durnin JVGA, Womersley J. Body fat assessed from total body density and its estimation from skinfold thicknesses:measurements on 481 men and women aged 16 to 72 years. Br J Nutr 1974;32:77-92.
Lukaski HC, Bolonchuk WW, Hall CB, Sider WA. Validation of a tetrapolar bioelectrical impedance method to assesshuman body composition. J Appl Physiol 1986;60:1327-1332.
Lohman TG, Going SB, Golding L et al. Interlaboratory bioelectrical resistance comparison. Med Sci Sports Exerc
1987;19:539-545.
Yang M-U. Body composition and resting metabolic rate in obesity.In: Obesity and Weight Control (Frankle RT and YangM-U, eds.) Aspen Publishers, Rockville , 1988 pp.71-96.
Gray DS. Changes in bioelectrical impedance during fasting. Am J Cl in Nutr 1988;48:1184-1187.
PHYSICIAN’S REFERENCE MANUAL E.5
5

5/7/2018 Manual Herbalife Para Medicos- English - slidepdf.com
http://slidepdf.com/reader/full/manual-herbalife-para-medicos-english 59/72
SECTION II: BACKGROUND
F.SAFETY OF CAFFEINE AND ITS
EFFECTS IN WEIGHT MANAGEMENTThe information that follows is taken from the International Food Information Council
Publication of January 2003. It clearly states the answers to the most common questions
about caffeine in Herbalife® products.
Caffeine is one of the most comprehensively studied ingredients in the food
supply. There is considerable knowledge of this compound, with centuries of safe
consumption in foods and beverages. However, some questions and misperceptions
about the potential health effects associated with this ingredient still persist. Weight
management studies by Dulloo et al. published in The New England Journal of Medicine
indicate that coffee, in addition to its effects on stimulating mental alertness, can
increase energy expenditure by approximately 2 percent per day, which is about
40 calories in an individual expending 2,000 calories per day. Beyond these
physiological effects, taking caffeine can help dieters through the low-energy periods of
the day, aiding in compliance.
The benefits for weight management were recently described by Westerterp-
Plantenga and co-workers in a research study.
F.1WHAT IS CAFFEINE?
Caffeine is a naturally occurring substance found in the leaves, seeds or fruits of at least
63 plant species worldwide. Caffeine, also known as trimethylxanthine, coffeine, theine,
mateine, guaranine, methyltheobromine and 1,3,7-trimethylxanthine, is a xanthine
alkaloid found naturally in such foods as coffee beans, tea, kola nuts, Yerba maté, guarana
berries and (in small amounts) cacao beans. For the plant, caffeine acts as a natural
pesticide since it paralyzes and kills insects that attempt to feed on the plant.
Caffeine’s main pharmacological properties are: a stimulant action on the central
nervous system with psychotropic effects and stimulation of respiration, a stimulation of
the heart rate and a mild diuretic effect.
The most commonly known sources of caffeine are coffee, tea, some soft drinks and
chocolate. The amount of caffeine in food products varies depending on the serving size,
the type of product and preparation method. With teas and coffees, the plant variety also
affects caffeine content.
60
F - F.1
Chemical Structure of Caffeine

5/7/2018 Manual Herbalife Para Medicos- English - slidepdf.com
http://slidepdf.com/reader/full/manual-herbalife-para-medicos-english 60/72
Coffee is the chief source of caffeine in the United States. An 8 oz cup of drip-brewed
coffee typically has 85 milligrams (mg) of caffeine; an 8 oz serving of brewed tea has 40
mg; soft drinks that contain caffeine have an average of 24 mg per 8 oz serving; and an
ounce of milk chocolate has just 6 mg.
F.2 COFFEE CONSUMPTIONPublished data shows the per capita consumption level of caffeine for the average adult
is approximately 200 mg daily. The average child consumes much less caffeine–only
one-quarter of the caffeine consumed by adults.
For children and young adults, the primary sources of caffeine are tea and soft
drinks, while for adults, caffeine intake is mostly from coffee.
Foods and beverages derived from cocoa beans, kola nuts and tea leaves often
contain some caffeine. Caffeine is also added to some foods and beverages for flavor. It
contributes to the overall flavor profile of those foods in which it is added.
F.3CAFFEINE SAFETY
In 1958, the U.S. Food and Drug Administration (FDA) classified caffeine as “Generally
Recognized As Safe” (GRAS). In 1987, the FDA reaffirmed its position that normal
caffeine intake produced no increased risk to health. In addition, both the American
Medical Association and the American Cancer Society have statements confirming the
safety of moderate caffeine consumption.
What constitutes a normal amount of caffeine depends on the individual. Caffeine
sensitivity depends on many factors, including the frequency and amount of regular
intake, body weight and physical condition.
Numerous studies have shown that moderate amounts of caffeine–about
300 milligrams per day–are safe for most adults. Children consume about 35 to 40 mg
daily.
Depending on the amount of caffeine ingested, it can be a mild stimulant to the
central nervous system. Although caffeine is sometimes characterized as “addictive,”
moderate caffeine consumption is safe and should not be classified with addictive drugs
of abuse. Often, people who say they are “addicted” to caffeine tend to use the term
loosely, not unlike saying they are “addicted” to work or television.
When regular caffeine consumption is stopped abruptly, some individuals may
experience mild symptoms such as headache, fatigue or drowsiness. These effects are
usually only temporary and will end in a day or so.
Moderate amounts of caffeine are safe for most people. Some individuals may besensitive to caffeine and will feel effects at smaller doses than do individuals who are
less sensitive. Pregnancy and aging all may affect an individual’s sensitivity to caffeine.
There is no evidence that the caffeine in beverages is dehydrating. Any diuretic
effect is more than likely compensated for by the total amount of fluid provided by
the beverage.
Research has found no evidence to suggest the use of caffeine at the levels in
foods and beverages is harmful. As with all foods and beverages, parents should use
common sense in giving their children normal servings of caffeinated foods
and beverages.
PHYSICIAN’S REFERENCE MANUAL F.1 - F.3
6
5/7/2018 Manual Herbalife Para Medicos- English - slidepdf.com
http://slidepdf.com/reader/full/manual-herbalife-para-medicos-english 61/72
SECTION II: BACKGROUND
There is no evidence to show that caffeine is associated with hyperactive behavior.
In fact, most well-conducted scientific studies show no effects of caffeine-containing
foods–or any food or beverage, in general–on hyperactivity or attention deficit disorder
in children.
Scientific evidence suggests that children are no more sensitive to the effects of
caffeine than adults.
Most physicians and researchers today agree that it is perfectly safe for pregnantwomen to consume caffeine.
Daily consumption of up to 300 mg per day (approximately two to three 8 oz cups
of brewed coffee) has been shown to have no adverse consequences during pregnancy.
However, it is wise for pregnant women to practice moderation in consumption of all
foods and beverages.
The weight of scientific research indicates that moderate caffeine consumption
does not affect fertility, or cause adverse health effects in the mother or the child.
Caffeine-containing foods and beverages, in moderation, can be enjoyed while
breastfeeding. Studies have shown that although caffeine is passed to the infant
through breast milk, the amount is minute and has no effect on the infant.
Both the American Academy of Pediatrics and researchers of a review published
in The American Journal of Clinical Nutrition confirm that caffeine consumption at usualamounts has no effect on the infant.
F.4FIBOCYCSTIC BREAST DISEASE AND
CAFFEINE CONSUMPTIONFibrocystic breast disease (FBD) is a condition characterized by multiple cysts that can
be felt throughout the breast and usually associated with pain and tenderness.
Approximately 50 percent to 90 percent of women experience symptoms of FBD,
which include cyclic breast pain and tenderness. There is no relationship between FBD,which is extremely common (occurring in up to 70 percent of normal women before
menopause), and breast cancer. The condition improves or disappears in the majority
of women after menopause.
Both the National Cancer Institute and the American Medical Association’s
Council on Scientific Affairs have stated there is no association between caffeine intake
and fibrocystic breast disease. Research has shown that caffeine does not cause or
worsen the symptoms of fibrocystic breast disease. A worldwide investigation of
100,000 deaths due to breast cancer found no relationship between caffeine intake and
the development of this disease.
F.5 OSTEOPOROSIS AND
CAFFEINE CONSUMPTIONOsteoporosis is a disease of the bone characterized by a decrease in bone density and
the development of weak and brittle bones, which are more prone to fracture. While it
is not exclusively a women’s disease, osteoporosis occurs most frequently in women.
Risk factors include inadequate calcium intake, high-protein intake, smoking,
inadequate exercise, small body frame, low-estrogen levels and age. In addition,
Caucasian and Asian women are at higher risk for osteoporosis than women of most
other ethnic groups.62
F.3 - F.5

5/7/2018 Manual Herbalife Para Medicos- English - slidepdf.com
http://slidepdf.com/reader/full/manual-herbalife-para-medicos-english 62/72
A recent study of post-menopausal women demonstrated that caffeine intake is
not associated with any change in bone density.
Several other recent, well-controlled studies have concluded that consuming
moderate amounts of caffeine do not increase a woman’s risk of osteoporosis.
F.6 CAFFEINE ANDBLOOD CHOLESTEROL
There is no evidence linking caffeine to changes in blood cholesterol. Consumption of
coffee as typically prepared in the United States does not effect blood cholesterol levels.
Studies from Scandinavia using boiled, unfiltered coffee have found an adverse effect
on blood cholesterol, but this preparation method is rarely used in the United States.
F.7 CAFFEINE AND BLOOD PRESSURECaffeine does not cause chronic hypertension or any persistent increase in blood
pressure. Some individuals sensitive to caffeine may experience a slight rise in blood
pressure, usually not lasting more than several hours.
Studies show any rise in blood pressure is modest and less than that normally
experienced when climbing stairs. However, individuals with high blood pressure
should consult their physician about caffeine intake.
F.8 CAFFEINE AND HEART DISEASEThere have been over 100 studies that have examined whether a relationship exists
between exposure to caffeine and blood pressure, cardiac arrythmia or coronary heart
disease. Most of this research has led to the conclusion that ingestion of moderate
amounts of caffeine is not associated with any increase in cardiovascular disease risk.
REFERENCES
Westerterp-Plantenga S, Lejeune MPGM, Kovacs EMR. “Body Weight Loss and Weight Maintenance in Relation to HabitualCaffeine Intake and Green Tea Supplementation.”Obes Res. 2005;13:1195-1204.
PHYSICIAN’S REFERENCE MANUAL F.5 - F.8
6

5/7/2018 Manual Herbalife Para Medicos- English - slidepdf.com
http://slidepdf.com/reader/full/manual-herbalife-para-medicos-english 63/72
SECTION II: BACKGROUND
G.METABOLIC SYNDROME AND
THE CO-MORBIDITIES OF OVERWEIGHT
AND OBESITYThe risk of age-adjusted relative risk of diabetes mellitus increases above a Body Mass
Index (BMI) of 27, which is overweight but not obese. Measures of body fat in these
women would likely indicate higher than normal amounts of body fat and increased
abdominal fat which is the primary depot involved in insulin resistance and the
progression of diabetes.
So, here is an example where waiting to see the blood sugar rise before initiating
treatment is closing the barn door after the horse has run away. Identifying patients prior
to the development of diabetes is one way to deal with this problem. For this reason, the
diagnostic category called “Dysmetabolic Syndrome X,” or simply Metabolic Syndrome,
has been developed with the following diagnostic criteria:
THREE OF THE FIVE SPECIFIC CRITERIA BELOW:
• Blood Pressure > 140/90
• Fasting Blood Sugar > 110 mg/dl
• Waist circumference > 35" in women, 40" in men
• Triglycerides (fasting) > 150 mg/dl
• HDL Cholesterol (fasting) < 50 mg/dl in a woman or
< 40 mg/dl in a male
As the BMI increases, the risks of hypertension, coronary heart disease and
cholelithiasis increase gradually. However, the risk of type 2 diabetes mellitus increases
much more rapidly so that relative risks of diabetes with obesity are in the 40 to 100
fold range compared to the 4 to 6 range for other obesity-associated diseases.
64
G
OBESITY - ASSOCIATED TYPE 2 DIABETES
Overweight or Obesity with Genetic Predisposition
Excess Adipokines Impaired ß Cell Function Endothelial Cell Dysfunction
Multistep Process ofAtherogenesis
Insulin Resistance andDeclining Insulin Levels withImpaired Glucose Tolerance
Type 2 Diabetes CVD Complications
Insulin Resistance andHyperinsulinemia with Normal
Glucose Tolerance andDyslipidemia

5/7/2018 Manual Herbalife Para Medicos- English - slidepdf.com
http://slidepdf.com/reader/full/manual-herbalife-para-medicos-english 64/72
G.1DIABESITY
The strong correlation of diabetes and obesity is not merely a coincidence but highlights
the common underlying pathophysiology of obesity causing the progression of a
metabolic syndrome which results in type 2 diabetes. Type 2 diabetes is the cause ofabout 50 percent of all renal failure in the United States and in the next 10 years it is
estimated that 70 percent to 80 percent of all heart disease will occur in patients with
“diabesity,” or type 2 diabetes with obesity. Since diabetes mellitus is defined as an
elevation in blood-sugar levels (>126 mg/dl fasting or >200 mg/dl 2 hours post-
prandial), researchers have identified the metabolic syndrome as a disorder which has
different criteria than type 2 diabetes but is believed to be the precursor disease which
lasts for eight to 10 years prior to the onset of diabetes mellitus.
The development of type 2 diabetes mellitus in association with obesity is a global
epidemic that is estimated to result in the vast majority of new cases of heart disease in
the coming decades, with an estimated 300 million diabetic patients worldwide by the
year 2025.
Dietary modification and enhanced physical activity are the most effective methodsto prevent or delay the onset of type 2 diabetes mellitus (T2DM) as illustrated by the
Da Qing Impaired Glucose Tolerance Study, the Finnish Diabetes Prevention Study, and
the Diabetes Prevention Program. Progression to T2DM in both of the latter studies was
reduced by 58 percent with a modest lifestyle and diet intervention.
The progression of glucose intolerance to T2DM involves a period of insulin
resistance and progressive beta-cell failure as demonstrated in the landmark studies of
Drenick and Johnson at UCLA in 1970. However, the tendency for the pancreatic b-cell
to fail in the presence of chronic insulin resistance may be genetically determined.
Progressive beta-cell failure is related to the high-secretory demands placed on the beta
cell by insulin resistance.
G.2HEART DISEASE AND
HYPERTENSIONObesity is related to the pathogenesis of heart disease through multiple pathways including
hypertension, increased clottability of the blood, and dyslipidemia which is an abnormality
of lipid metabolism in which there is overproduction of triglycerides with a depression of
“good” HDL cholesterol and normal or increased “bad” LDL cholesterol.
The hypertension that is seen in obesity is related to the hyperinsulinemia and
increased secretion of catecholamines. These patients have elevated renin and angiotensinlevels and the drugs of choice for hypertension in these patients are called angiotensin
converting enzyme (ACE) inhibitors. Weight loss will also reduce blood pressure, but the new
guidelines for these patients suggest that lifestyle and diet be used to lower blood pressure
to less than 135/85 along with medications. Only 5 percent of all hypertension is due to
salt sensitivity, but this disorder does occur. Salty foods will increase blood pressure in
patients where obesity is the primary problem. However, low-salt diets have relatively little
effect on blood pressure in these patients. A diet rich in calcium and fruits and vegetables,
which supply potassium, will lower blood pressure significantly, compared to a usual diet
as shown in the Dietary Approaches to Stop Hypertension (DASH) study, funded by the
National Institutes of Health (NIH). Restricting salt had a small but significant additional
effect beyond the DASH diet alone.
PHYSICIAN’S REFERENCE MANUAL G.1 - G.2
6

5/7/2018 Manual Herbalife Para Medicos- English - slidepdf.com
http://slidepdf.com/reader/full/manual-herbalife-para-medicos-english 65/72
SECTION II: BACKGROUND
G.3FATTY LIVER DISEASE AND
CIRRHOSIS
The increased incidence of obesity has been paralleled by an increase in metabolicsyndrome in the same cohort of patients. The net consequence of insulin resistance in
a large majority of these obese individuals is hepatic steatosis, which, over time in a
proportion of these patients, progresses to steatohepatitis and cirrhosis.
G.3.1DIAGNOSING FATTY LIVER DISEASE
Despite the increased awareness among physicians regarding its presence, the diagnostic
process has been hampered by the lack of sensitive and specific population-based
screening tests. Liver biopsy remains the gold standard for diagnosis as well as for gradingand staging of the disease process, but its precise role in the process of diagnosis continues
to be debated. Moreover, because laboratory testing is routine, an abnormal serum
transaminase or alkaline phosphatase in patients without clinical symptoms is not
uncommon. Although liver function tests are critical in recognizing the presence of liver
disease and its specific diagnosis, the interpretation of the tests may be confusing and
difficult (Knight, 2005). Furthermore, not all persons with one or more test abnormalities
actually have liver disease.
Abnormal liver enzymes may also be present in the absence of symptoms and signs
of liver disease. A good clinical history and physical examination are mandatory. If a
systematic approach is adopted, based on additional non-invasive serological tests and
imaging procedures covering the most frequent liver diseases, the cause is often apparent.
The clinician should be aware of nonhepatic diseases that can cause abnormal liver
enzymes, such as thyroid disorders and occult celiac disease. In those patients in which
no explanation can be found at the time of the initial evaluation for these abnormal liver
enzymes, there is a high probability of non-alcoholic fatty liver disease. The risks and
benefits of a liver biopsy in this setting should be carefully considered, as it only seldom
alters management (Verslype, 2004).
G.3.2OTHER CAUSES OF FATTY LIVER
AND LIVER FAILUREFatty liver disease has traditionally been classified as alcoholic and nonalcoholic. While
the gross and histologic appearance of the liver are similar in these conditions, the
pathophysiologic processes and clinical features of the two conditions are not identical.
The histologic spectrum of nonalcoholic fatty liver disease (NAFLD) includes both hepatic
steatosis and steatohepatitis. The causes of fatty liver include: 1) Metabolic syndrome,
which is the most common cause; 2) Alcohol-induced liver disease (very common);
3) Rare Metabolic Diseases including abetalipoproteinemia, Weber-Christian Syndrome
and lipodystrophy; 4) Drugs, including amiodarone, tamoxifen, antiretroviral therapies;
5) Hypothyroidism; and 6) Unknown cause (idiopathic).66
G.3 - G.3.2

5/7/2018 Manual Herbalife Para Medicos- English - slidepdf.com
http://slidepdf.com/reader/full/manual-herbalife-para-medicos-english 66/72
The global emergence of obesity as an epidemic has made fatty liver disease a public
health problem in the Western world and in emerging economies where obesity is
becoming more prevalent. At the same time, the number of cases of idiopathic liver
disease have increased. While there are documented cases of toxic liver disease due to a
limited number of herbal products as well as what appear to be allergic reactions, the
practice of ascribing idiopathic cases to herbal hepatoxicity is not warranted in the
absence of particular criteria including the identification of the hepatotoxic ingredient,and proof of its hepatotoxicity. Given the prevalence of use of herbal medicines and the
increasingly common occurrence of liver disease worldwide, there have been a number
of misclassifications of liver disease as being due to herbal toxicity.
G.4CANCER
Cancer is due to accumulation of DNA mutations that confer a growth advantage and
invasive properties on clones of cells. A variety of external factors, including nutrients in
the environment interacting with genetic susceptibility, influence the accumulation of
mutations in cells. Nutrition is important at every stage of carcinogenesis from initiation
to promotion to progression and metastasis.
The primary risk factor for cancer is aging. All data demonstrating nutritional
influence utilize age-adjusted cancer incidence. Through primary prevention as well as
nutritional effects on patients with early treated cancer, the hope is to reduce the duration
of morbidity as well as lengthen survival. This has not yet been demonstrated in clinical
trials, but is the ultimate goal of research in nutrition and cancer.
International correlation data in the late 1960s demonstrated a relationship of age-
adjusted breast cancer incidence to dietary fat intake. This correlation marked a dietary
pattern rather than a specific effect of dietary fat. Later studies pinpointed a correlation
with meat-protein rather than vegetable-protein intake. Migration data also demonstrate
that individuals moving from a high-risk to a low-risk country, or vice versa, take on therisk of the country to which they migrate within one generation.
International correlation data also show a relationship of adult height to the age-
adjusted rate of breast cancer. Adult height is a marker of pre-pubertal nutrition. With an
increase in childhood obesity incidence in a country, there is a concomitant increase in
adult height. The incidences of obesity and obesity-related cancers have increased in
Japan in the last 20 years as has adult height. There is evidence that childhood obesity
confers a lifelong increased risk of common forms of cancer.
There is significant evidence that major forms of cancer are affected by diet and
lifestyle. Obesity is a risk factor for common forms of cancer including breast, prostate,
colon, uterine, kidney, gallbladder and pancreatic. Ad lib intake of excess calories in
animal models has also been associated with enhanced tumorigenesis for breast, colon
and skin cancer. Since laboratory animals tend to develop obesity with age, the preventiveeffects of calorie reduction in animals are likely to be analogous to the prevention and
treatment of obesity in humans by either reduction in caloric intake or an increase in
physical activity.
PHYSICIAN’S REFERENCE MANUAL G.4
6

5/7/2018 Manual Herbalife Para Medicos- English - slidepdf.com
http://slidepdf.com/reader/full/manual-herbalife-para-medicos-english 67/72
G.5CHANGES WITH AGING IN BODY
FAT AND CHRONIC DISEASE RISKAll of the chronic diseases discussed above increase in incidence with aging. With age
there is a reduction in lean-body mass in both men and women. The decrease is
associated with reduced calorie requirements and increased risk of developing common
forms of cancer. The reduced muscle mass may be associated with increased insulin and
reproductive hormone levels in some aging individuals. Lean-body mass decreases with
aging in males as they tend to become less active. There may also be age-related
decreases in hormones mediating muscle growth and maintenance. These changes in
body composition affect the levels of sex hormones, insulin and growth factors which
may affect chronic diseases, including diabetes, cardiovascular disease and common
forms of cancer. Efforts at diet and lifestyle change with aging to prevent chronic
diseases, including cancer, need to include interventions to maintain or increase lean
body mass.
REFERENCES
Knight JA. “Liver function tests: Their role in the diagnosis of hepatobiliary diseases.”J Infus Nurs. 2005 Mar-Apr;28(2):108-17.
Verslype C. “Evaluation of abnormal liver-enzyme results in asymptomatic patients.” Act Clin Belg. 2004 Sep-Oct;59(5):285-9.
SECTION I: BACKGROUND
68
G.5

5/7/2018 Manual Herbalife Para Medicos- English - slidepdf.com
http://slidepdf.com/reader/full/manual-herbalife-para-medicos-english 68/72
PHYSICIAN’S REFERENCE MANUAL
Notes

5/7/2018 Manual Herbalife Para Medicos- English - slidepdf.com
http://slidepdf.com/reader/full/manual-herbalife-para-medicos-english 69/72
PHYSICIAN’S REFERENCE MANUAL
Notes

5/7/2018 Manual Herbalife Para Medicos- English - slidepdf.com
http://slidepdf.com/reader/full/manual-herbalife-para-medicos-english 70/72
PHYSICIAN’S REFERENCE MANUAL
Notes

5/7/2018 Manual Herbalife Para Medicos- English - slidepdf.com
http://slidepdf.com/reader/full/manual-herbalife-para-medicos-english 71/72
PHYSICIAN’S REFERENCE MANUAL
Notes

5/7/2018 Manual Herbalife Para Medicos- English - slidepdf.com
http://slidepdf.com/reader/full/manual-herbalife-para-medicos-english 72/72