manual on gps usage in forest management units
TRANSCRIPT

Manual on GPSusage in Forest Management Units December 2015
This publication has been produced with the assistance of the European Union. The content, f indings, interpretations, and conclusions of this publicat ion are the sole responsibil ity of the FLEG II (ENPI East) Programme Team (www.enpi-f leg.org) and can in no way be taken to ref lect the views of the European Union. The views expressed do not necessarily ref lect those of the

1. A Brief Quantum GIS User Manual
To begin your work, start QuantumGIS using a desktop shortcut or the Start menu.
The program has five main areas:
1. The main menu
2. A toolbar
3. A legend
4. A map area
5. A status bar
In order to open the project, you need to select the File → Open project item from the main
menu, select the path to the project and start it.
For navigation, use the toolbar tools. You can use them to move around the map, zoom the
objects in and out, etc.
The main essential tools:
Allows moving around the map.
Scaling the map up/down.

"Full extent" expands the map up to all layers added to the project.
Expanding up to object/objects selected in the layer.
Expanding the map up to the selected layer.
The following tools are used to measure distances, areas:
After selecting the necessary tool, click the initial measurement point in the map field. Then the
dialog box "Measurement" will appear, in which "On the ellipsoid " item needs to be ticked.
When moving the cursor, the readings will change. To put an intermediate point, use the left
mouse button. Pressing the right button completes drawing of a broken line or a polygon.
To search for the necessary object (a forestry unit, a settlements, a river, etc.), you can use an
attribute table. To do this, select the layer of interest in the legend with the left mouse button and
press the button or right-click on the layer name and select the item Open attribute table
from the context menu.

A table will open in a new window.
The attribute table allows to view the information about the layer objects, sort the objects in the
fields (columns) in ascending/descending order, and carry out their search. To sort the objects,
click on the field name. To carry out the search, you need to set the value (search inquiry), select
the field in the dropdown list, where the record needs to be found and press the "Search" button.
After selecting the object(objects) by one of the spatial selection tools,
or selecting the line/lines in the attribute table and pressing the button , the program will
automatically expand the map up to the selected objects.
To view the information about the object, select the needed layer in the legend,
select the tool from the toolbar , and click the object on the map. The attributes of the
selected object will be displayed in the appeared dialog box.
To adjust the display of the layer, open the layer properties. To do this, double-click the left
mouse button on the layer name in the legend or right-click on the layer name in the legend and
select the layer properties from the dropdown menu.
You can adjust the rendering type, filling type and color, contour type and color, as well as
transparency in the style tab.

To add a shape-file, use the button or the main menu "layer → add a vector layer".
To add a raster, use the button or the main menu "layer → add a raster layer".
In order to enter additional information in the layer attributes (for example, information on the
leaseholder or notes on the forest compartment), first if all, it is necessary to activate the layer
editing mode. To do this, press the button in the main window or in the attribute table or
right-click on the layer name in the legend and select the ≪editing mode≫ item.
By clicking on the needed cell you can add/correct the record.
To create an additional field (column), press the "add field" button

Enter the field parameters in the appeared dialog box. The name, type (a whole number, a
fractional number, text), number of characters.
It is recommended to use Latin characters and digits in the field names.
After making all the changes, you can complete editing of the layer having preliminary saved the
editing results.
To create a new shape-file, select Layer → Create → Create a new shape-file
or click the icon
"New vector layer" dialog box will appear. You should select a layer type (point, line, polygon)
and the desired coordinate system

Also, if necessary, you can specify the desired attributes (columns). As before, you need to select
the name, type, and size/accuracy of the input data. Next, press OK and set the shape-file saving
place and name. After creation the layer will be automatically added to the map.
To add objects to the created layer, enable the Edit mode
and use one of the tools:
to add a point,
to add a line,
to add a new
polygon.

A left click adds an intermediate point in the line/polygon, a right click completes a compound
object (line/polygon). After pressing the right button or adding a point, a dialog box proposing to
add attributes to a new object appears.
Additional tools allow
to move the selected objects
to delete the selected objects
to edit the vertices (units) of the lines/polygons
It is recommended to regularly save the introduced changes during the editing process or before
its completion.

2. WORK WITH SATELLITE IMAGES
2.2.Downloading of Landsat SI
Landsat represents the world's longest continuously acquired collection of space-based
moderate-resolution land remote sensing data. Four decades of imagery provides a unique
resource for those who work in agriculture, geology, forestry, regional planning, education,
mapping, and global change research. Landsat images are also invaluable for emergency
response and disaster relief.
As a joint initiative between the U.S. Geological Survey (USGS) and NASA, the Landsat
Project and the data it collects support government, commercial, industrial, civilian, military, and
educational communities throughout the United States and worldwide.
On May 30, 2013, data from the Landsat 8 satellite (launched as the Landsat Data
Continuity Mission - LDCM- on February 11, 2013) became available. As with previous
partnerships, this mission continues the acquisition of high-quality data that meet both NASA
and USGS scientific and operational requirements for observing land use and land change.
The USGS Earth Explorer (http://earthexplorer.usgs.gov/) is a similar tool to search
catalogs of satellite and aerial imagery. The USGS Earth Explorer gives some capabilities such
as:
Downloading data over chronological timelines.
Wide range of specifying search criteria.
A long list of satellite and aerial imagery to choose.
Before downloading satellite images one should go through registration procedure using
following link https://ers.cr.usgs.gov/register/. Or click “Register” button in the main menu of
EarthExplorer.
Figure 2.1. Register button on Earthexplorer main screen.
Click “Register” button

The EarthExplorer user interface provides the overall capability for users to interact with
the EarthExplorer components and services. The EarthExplorer user interface (Figure 1) is
composed of the following key elements:
1. Main menu
2. Location map
3. Search and filter component
Figure 2.2. Earthexplorer user interface
The EarthExplorer Data Search component is located on the left side of the EarthExplorer
body element. The Data Search components are divided among 4 tabs and allow users to enter
search criteria, select datasets to query, enter additional criteria, and review results in a tabular
window.
1
3
2

Figure 2.3. Data search component.
EarthExplorer allows users to search, download, and order data held in USGS archives through a
number of query options. The EarthExplorer search process/component is divided into four main
areas (Figure 24):
Search Criteria Tab – Provides the interface for entering various search options.
Data Sets Tab – Provides the interface for selecting the datasets to be searched.
Additional Criteria Tab – Provides an interface for entering additional search
criteria specific to the selected datasets.
Results Tab – Provides the interface for displaying a textual and graphical view of
the query results.
Search Criteria Tab.
The Search Criteria tab provides a location to enter search criteria for an area of interest. Users
have the option to either type the location criteria via the textual information component or with
the Google Map interface. The search criteria options include:
Google Map Interface – Enter the area of interest through the Google Map interface
Address/Place – Type an address or place name
Area Selected – Enter coordinates to define an area of interest. The area selected is
updated as changes are made
Predefined Area – Select from a list of predefined areas for a query
Upload shapefile or KML file – Update a ESRI shapefile or KML file as the query
area
Dates Selected – Enter a date or date range
Number of records to return – Modify the number of scenes returned from a search.
Tabs of search
component

Enter Area of Interest Search using Google Map Interface.
The USGS Earth Explorer location map uses Google Maps interface. It is possible to zoom
in and out with the mouse wheel as if you are in Google Maps. Google street view is also
enabled, where you can drop a marker and get a real view of the location.
Using the Google Map interface, enter the geospatial area of interest using the mouse or
other pointing device. Options for entering location criteria include:
a) Define a single point search (Figure 4) – Click an area on the map once using the
mouse to define a single point search. The latitude and longitude of the point
selection displays under the «Coordinates» section. The coordinates can be toggled
between Degree/Minute/Second and Decimal degrees.
Figure 4. Single point search using map.
b) Define a line search (Figure 5) – To perform a line search, select two points on the
map to define a line segment. The latitude and longitude of the two points selected
display under the «Coordinates» section.

Figure 2.5. Line search using map.
c) Define a polygon – Click multiple times to define an area (Figure 6). As each point
of the polygon is selected, the latitude and longitude of the defined polygon
displays under the «Coordinates» section (Figure 7). To modify the rectangle, click
one of the numbered points on the map and drag the point to a new location.
Figure 2.6. Polygon search using map.
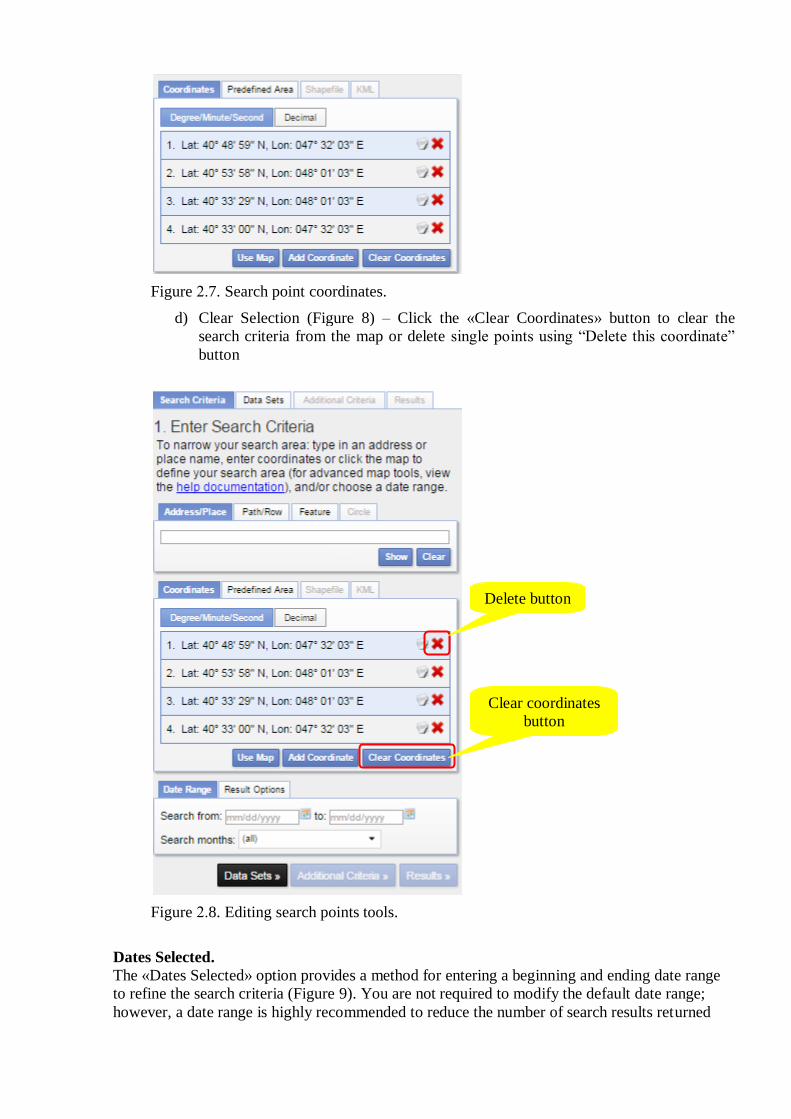
Figure 2.7. Search point coordinates.
d) Clear Selection (Figure 8) – Click the «Clear Coordinates» button to clear the
search criteria from the map or delete single points using “Delete this coordinate”
button
Figure 2.8. Editing search points tools.
Dates Selected.
The «Dates Selected» option provides a method for entering a beginning and ending date range
to refine the search criteria (Figure 9). You are not required to modify the default date range;
however, a date range is highly recommended to reduce the number of search results returned
Delete button
Clear coordinates
button

from a search. «Search Months» allows you to specify which months to search within the date
range specified.
For example, Figure 9 shows a search range of 06/10/2015 to 21/11/2015.
Figure 2.9. Setting date range.
The «Data Sets» tab selects which dataset(s) to search. The «Data Set» menu (Figure 10)
categorizes datasets into similar data collections.

Figure 2.10. Data Set Selection Expandable View
EarthExplorer uses a dynamic tree menu with expandable/collapsible links for each major
data category. Click the plus sign ( ) next to the category name to expand the list of datasets
for that collection. Click the minus sign ( ) next to the category name to collapse the list. Click
on a box to choose data set.
Figure 2.11. Choosing Landsat 8 data set.

After selecting a dataset, click the «Additional Criteria» tab to enter additional criteria, or
click the «Results» tab to execute the search and view the results for the criteria entered.
Figure 2.12. “Additional criteria” tab.
Enter Additional Criteria.
The «Additional Criteria» tab is an optional input area that allows the entry of additional
search criteria specific to the dataset selected to narrow the results of a search. The type and
number of search criteria will vary by dataset. Each criteria page is different and is based on the
unique dataset attributes defined for that dataset. In the following example (for Landsat 8), the
specific search criteria include:
Landsat Scene Identifier
WRS Path and Row
Sensor ID
Data Type Level 1 and 0RP
Cloud Cover
Data Category
Day Night Indicator
Nadir/Off nadir condition
Processing Software Version
Figure 2.13. Additional criteria form.

Enter the additional criteria as desired to narrow the search (Figure 14). For forest
management issues it is recommended to use cloud cover not more than 30%
Figure 2.14. Setting additional criteria.
Click the “Reset” button to clear the page of the current dataset listed. Once you enter the
additional criteria (if any), click the “Results” tab near the top of the screen or the button near the
bottom of the screen to execute a search.
Figure 2.15. Setting additional criteria.
View Search Results.
The “Results” tab executes a search using the search criteria and displays the results for the
search criteria. The left side of the page displays the results panel with the thumbnail and textual
“Results” button
“Results” tab
“Reset button
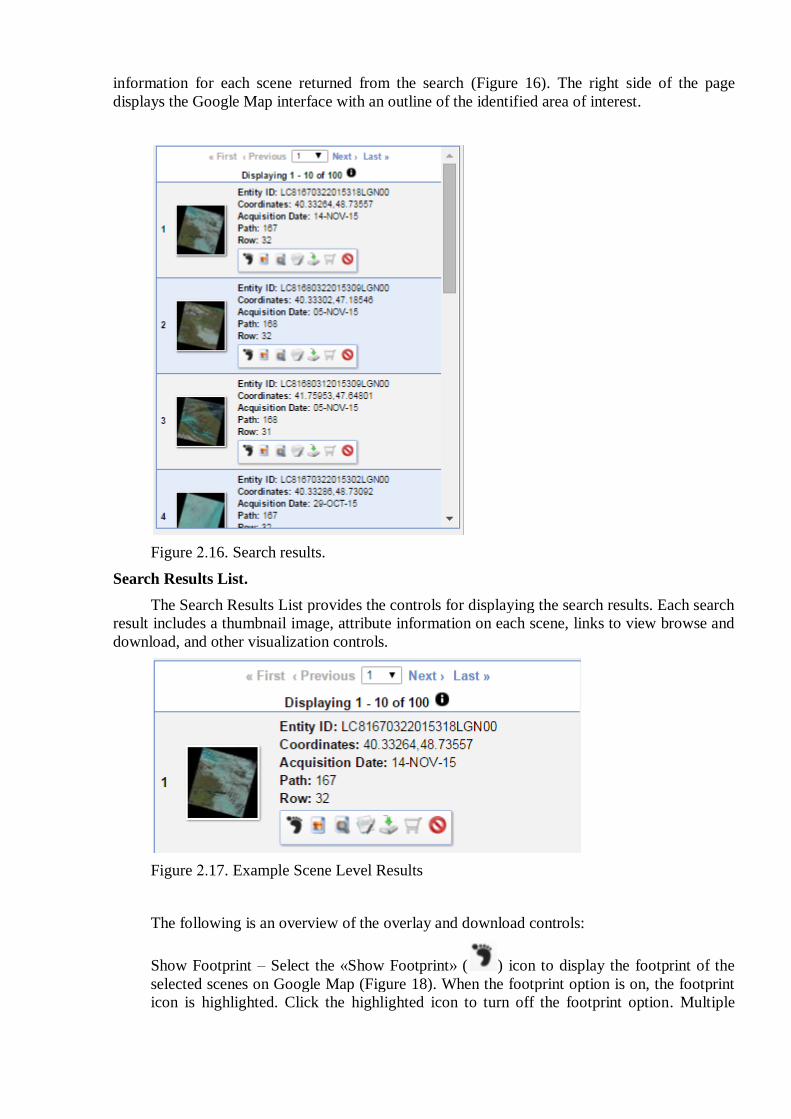
information for each scene returned from the search (Figure 16). The right side of the page
displays the Google Map interface with an outline of the identified area of interest.
Figure 2.16. Search results.
Search Results List.
The Search Results List provides the controls for displaying the search results. Each search
result includes a thumbnail image, attribute information on each scene, links to view browse and
download, and other visualization controls.
Figure 2.17. Example Scene Level Results
The following is an overview of the overlay and download controls:
Show Footprint – Select the «Show Footprint» ( ) icon to display the footprint of the
selected scenes on Google Map (Figure 18). When the footprint option is on, the footprint
icon is highlighted. Click the highlighted icon to turn off the footprint option. Multiple

footprints can be selected and displayed on the map. Each footprint displays in a different
color.
Figure 2.18. Footprint overlay.
Show Browse Overlay – Click the «Show Browse Overlay» ( ) icon to display a
preview image (browse) of the scene on the map (Figure 19). When the browse option is
on, the browse icon is highlighted. Click the highlighted icon to turn off the browse option.
Multiple browse can be selected and displayed on the map.
Figure 2.19. Browse overlay.
Download Options – Click the «Download Options» icon ( ) to allow registered users to
download the selected data (Figure 20).

Figure 2.20. Download options for registered users.
Selecting the «Download Options» icon before registering or logging in displays the
following prompt:
Figure 2.21. Download options for unregistered users.
Click the «Login» to log in to EarthExplorer. You’ll be redirected to the Sign in form.
Figure 2.22. Sign in form.
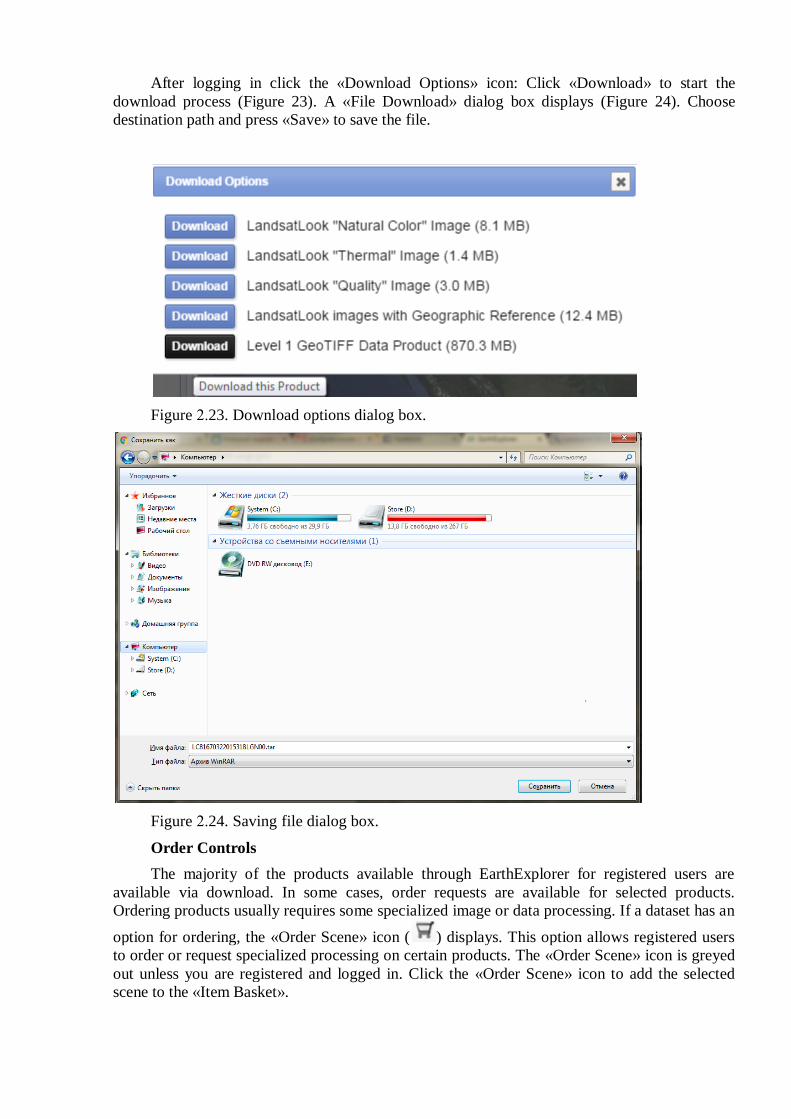
After logging in click the «Download Options» icon: Click «Download» to start the
download process (Figure 23). A «File Download» dialog box displays (Figure 24). Choose
destination path and press «Save» to save the file.
Figure 2.23. Download options dialog box.
Figure 2.24. Saving file dialog box.
Order Controls
The majority of the products available through EarthExplorer for registered users are
available via download. In some cases, order requests are available for selected products.
Ordering products usually requires some specialized image or data processing. If a dataset has an
option for ordering, the «Order Scene» icon ( ) displays. This option allows registered users
to order or request specialized processing on certain products. The «Order Scene» icon is greyed
out unless you are registered and logged in. Click the «Order Scene» icon to add the selected
scene to the «Item Basket».
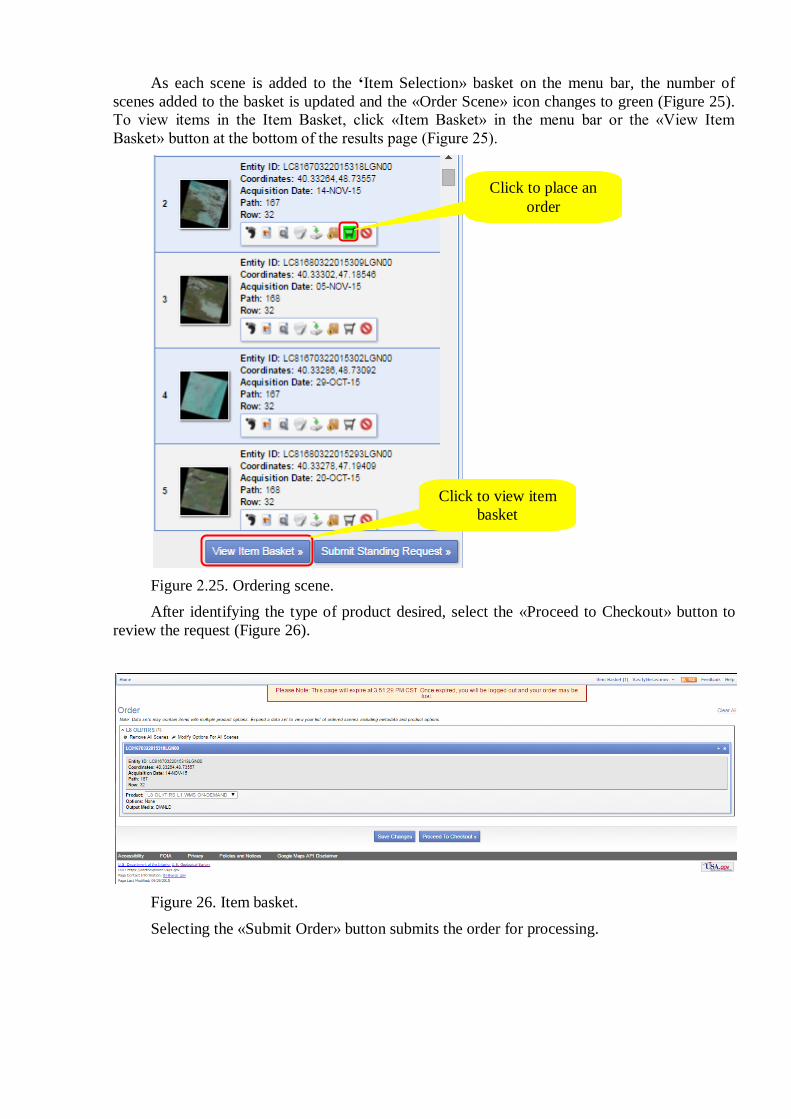
As each scene is added to the ‘Item Selection» basket on the menu bar, the number of
scenes added to the basket is updated and the «Order Scene» icon changes to green (Figure 25).
To view items in the Item Basket, click «Item Basket» in the menu bar or the «View Item
Basket» button at the bottom of the results page (Figure 25).
Figure 2.25. Ordering scene.
After identifying the type of product desired, select the «Proceed to Checkout» button to
review the request (Figure 26).
Figure 26. Item basket.
Selecting the «Submit Order» button submits the order for processing.
Click to view item
basket
Click to place an
order

Figure 2.27. Submitting order.
The Checkout Summary page displays and you can print or save this summary for
your records (Figure 2.28).
Figure 2.28. Summary page.
You will also receive a confirmation email (Figure 29)
Figure 2.29. E-mails from USGS/EROS service.
Another e-mail with link for download will be received after processing time (Figure 30).
Usually it takes less than 24 hours.
Figure 2.30. Email with download link.

2.3. Work with the Landsat space image
After loading, the image represents a data archive with the tar.gz. extension It should be
unpacked (this can be done using any archive utility). After unpacking, you will have one more
archive, this time with the tar. extension. It should also be unpacked in the current folder.
Eventually, you will get a set of spectral channels of the loaded scene in the form of the raster
data with the TIFF extension. For operation, you need to create a multispectral image consisting
of separate channels. It will be described below how to open and adjust the Landsat space image
display using the free GIS QuаntumGIS.
Step 1. Start QGIS using a desktop shortcut or the Start menu. After starting, the program
window will open. It can be conditionally divided into five major areas. These are:
1) The main menu
2) A toolbar
3) A legend
4) A map area
5) A map information area
Step 2. First of all, to be able to work you need to connect the GDALTool extension in QGIS
Plugin Manager. To do this, click Plugins - Manage plugins in the Menu area.
2
4 3
1
5

Find the required plugin in the appeared list, select it, and click OK.
Step 3. Now choose Merge in the Raster catalog
Choose the GdаlTооls plugin
and click OK
Click Plugins - Manage
plugins

Fill in all the required fields in the appeared window. In the Initial data field, specify the
channels that you want to merge. In the Target file field, specify the name of the future raster and
the saving path, choose Layer stack and Add the result to the map, click Ok, and wait for the
process completion. It is important that neither the name of the image nor its saving path contain
the Cyrillic alphabet.
Click Raster -
Miscellaneous - Merge
Choose Layer stack and
Add the result to the map,
click Ok
Click Select and specify the
name of the future raster and
the saving path
Click Select and specify the
channels, which you want to
merge

If all the above-mentioned steps have been performed correctly, after the completion of the
channels merge process, a multi-channel image will be added in the map area. Save the project
(in our case, VV_MLT.qgs).
Step 4. Next, start to adjust the display of the resulting raster. To do this, right-click on the layer
and choose Properties.
You can start to work on the image "improvement" in the Style tab of the appeared window.
A multi-channel image is
added (layer
LC81750162014163LGN00_
B9_Cоm)
Right-click on layer 432
and choose Properties.

By default, the raster is loaded with a combination of channels 123. You can change the
combination in the relevant fields. We also recommend to choose Use the standard deviation and
to specify its value. Every individual image has its own value. In the Contrast enhancement tab,
specify Stretch to min/max. Then click Apply.
The Style tab allows
"improvement" of a space
image

In the same place, in the Transparency tab, set 0 value in the "No data" value field (as the black
areas around the raster have a value of 0).
This field allows changing the
channel combination
Activate Use the standard deviation (every
image has its own value)
In the Contrast enhancement tab, select
Stretch to min/max and click Apply.

Then click OK. This action can help to remove these areas.
In the transparency tab, set 0 in
the "No data" value field and
click OK
A processed multi-channel
image. "Natural colors"
combination

2.4 RASTER DATA BINDING
The next step is binding of the management many-leaved. Take the space image Landsat 8 OLI
(combination of channels 7-6-4) as a basis. You can achieve the optimum display of the image to
fulfill specific tasks at hand by trying different channel combinations, changing the contrast
settings parameters and other user values. More details on the interpretation of the Landsat data
channels combinations are available on the Gis-Lаb community site ( http://gis-
lаb.infо/qа/lаndsаt-bаndсоmb.html) or on the official website of the U.S. Geological Survey at
http://www.usgs.gоv/.
Step 1. In order to call up the data binding window, select a relevant field in the Raster catalog.
Step 2. Open the raster, which you want to bind, in the appeared window. To do this, choose
Open the raster in the File catalog.
Call up the data binding
window. To do this, click
Raster - Raster binding
Choose Open the raster in the
File catalog

After this, a dialog box where you need to specify the correct coordinate system (in our case,
WGS 84 / UTM zone 38N) will appear. Click OK.
Step 3. Then, start the binding using the Add a point tool ( Edit - Add a point).
Start the binding using the
Add a point tool
Specify the correct coordinate
system and click OK

Choose the most typical subcompartment on the compartment many-leaved (its boundaries
should be clearly visible in the image) and click it.
Then, choose From the map in the appeared window and click the relevant place on the space
image.
One of the most typical
subcompartments. Click on its border.
Choose From the map and
click the relevant place on the
space image.

Click OK.
After that, in the same order choose the typical place on the compartment many-leaved, match it
with the image and click OK. The more accurate you put the binding points and the more points
you have, the more accurate will be the binding of the current raster.
Step 4. After you install the required number of points in the File catalog, choose the Start
binding item.
After your clicking, the Information window will pop up, click OK.
In the Transformation parameters dialog box, specify the information about the future layer in
the Target raster field and define the correct coordinate system of the layer. Leave the rest of the
fields at their default values.
Click OK.
After you install the required number
of points in the File catalog, choose
the Start binding item.
Click OK.

Click OK, and you will see that the layer has appeared in the legend area and the desired bound
raster is displayed in the map area.
Now you can close the Raster binding window.
Specify the information about the
future layer in the Target raster
field and define the correct
coordinate system of the layer.
Click OK.
The layer has appeared in the legend
area and the desired bound raster is
displayed in the map area.

Step 5. You can check how well the management many-leaved was reflected on the space image.
To do this, using a slider set the value of 70% in the Transparency tab (right-click on the layer -
Properties) and click OK.
If you are satisfied with the binding quality, you can start digitizing .
Using a slider set the value of 70% in the
Transparency tab and click OK
If you are satisfied with the binding
quality, you can start digitizing on
the dedicated grid

3 INTRODUCTION TO GPS
3.1 An Overview of Global Positioning System
The first global positioning systems GPS (Global Positioning System) have been
developed solely for military purposes.
The GPS system consists of 3 major segments: space, ground, and user. A space segment
consists of 28 autonomous satellites evenly distributed in orbits with an altitude of 20350 km (for
a full-function system operation 24 satellites are enough). Each satellite emits a 2-frequency
special navigation signal, which identifies 2 types of code. One of them is available only for a
few users, with the USA military and federal service among them. In addition to these 2 signals,
the satellite emits the third one, informing the user about the additional parameters (the status of
the satellite, its operability, etc.). The parameters of the orbits of the satellites are periodically
controlled by a network of ground tracking stations (in total, 5 stations located in the tropical
latitudes). With their help (at least 1-2 times a day) ballistic characteristics are calculated,
deviations between the satellites and the calculated trajectories are recorded, the time of the
satellites onboard clock is determined, monitoring of the navigation equipment integrity is
conducted, etc.). The third segment of the GPS system is GPS receivers, which are also
manufactures as stand-alone devices (portable or stationary), and as boards for connection to
PCs, on-board computers, and other devices.
3.2 General principles of coordinates determination using GPS
The basis for determining the coordinates by a GPS receiver is calculating the distance
between the receiver and several satellites, the location of which is considered to be known
(these data are kept in the almanac received from the satellite). A method of determining the
position of an object by measuring its remoteness from the points with specified coordinates is
called trilateration.
If you know the distance A to one satellite, the receiver coordinates cannot be defined (it
can be in any point on the sphere of the radius A, circumscribed around the satellite). Let's
assume we known the distance В from the receiver to the second satellite. In this case,
coordinates determination is also not possible - the object is somewhere on the circumference (it
is shown in the blue color), which is an intersection of two spheres. The distance from С to the
third satellite reduces uncertainty in coordinates to two points (marked by two blue points). This
is already enough for a clear determining of coordinates - the fact is that only one of two possible
receiver points lies on the Earth's surface (or in a short distance from it), and the second, false, is
Theoretically, it is sufficient to know the distances from the receiver to three satellites for three-dimensional navigation.

either deeply in the earth, or very high above its surface. Thus, theoretically, what is required for
a three-dimensional navigation is to know the distance from the receiver to three satellites.
3.3 Factors reducing coordinates determination accuracy. Differential correction mode
The above reasoning is correct for the case when the distances from an observation point
to satellites are known with absolute precision. Of course, in practice there is always some
inaccuracy of measurements.
So called differential correction mode (DGPS Differential GPS) allows to reduce the
error in the coordinates measurement (down to several centimeters). The differential mode
allows determining the coordinates with an accuracy up to 5 m in the dynamic navigation
environment and up to 2 m in the stationary conditions. The differential mode is implemented
using a control GPS receiver, called a base station. It is located in the point with definite
coordinates in the same area as the GPS receiver, and allows simultaneous tracking of GPS
satellites. The base station consists of the following components: a GPS sensor with an antenna,
a processor, a data receiver and transmitter with an antenna. Usually, the station uses a multi-
channel GPS receiver, each channel of which monitors one visible satellite. The need for
continuous tracking of each satellite is determined by the fact that the base station shall capture
navigation messages before the consumers' receivers. By comparing the known coordinates
(obtained as a result of precision geodetic survey) with the measured coordinates, the control
GPS receiver generates corrections, which are transferred to consumers via the radio channel
according to a pre-specified format. The consumer, in its turn, requires a GPS receiver with an
antenna, equipped with a processor and an additional radio receiver with an antenna, which
allows receiving differential corrections from the base station. The correction, received from the
base station, are automatically entered into the results of the user devices' own measurements.
For each satellite, the signals of which are coming to the GPS receiver, the correction obtained
from the base station is added to the pseudo-range measurement result. The correction can be
carried out both in a real-time mode, and in an off-line data processing mode (for example, on
computer).
Normally, a professional GPS receiver of a company specializing in navigation or
geodesy is used as a base station. The results obtained using a differential method heavily
depend on the distance between the object and the base station. An application of this method is
most effective when systematic errors caused by external (with regard to the receiver) causes are
prevailing (which is typical for a GPS system). A time scale departure error is fully compensated
in a differential mode. The errors determined by a signals delay in the atmosphere depend on the
identity of the conditions of the signals transmission to the base station and the object, and,
therefore, the distance between them. These errors are fully compensated only in case of a close
location of the base station and the object. An ephemeris error is also best compensated in case
of a small distance between the consumer and the base station. For all these reasons, it is
recommended to place the base station within 500 km from the object. The main customers of
the differential correction are geodesic and topographic surveys. DGPS makes no interest for
private users due to a high price and large in size equipment.
3.4 Coordinate systems, projections, and datums
Coordinate systems, also known as cartographic projections, are arbitrary designations of
spatial data. Their purpose is to provide a common basis for the connection of individual points
and areas on the Earth's surface. The most important consequence for the coordinate systems is
to know that a projection exists and correctly connects the coordinate system with the data.
There are two types of coordinate systems - geographic and projected.
A geographic coordinate system uses a three-dimensional spherical surface to determine
the position on the Earth's surface. It includes angular units of measure, a prime meridian and a
datum (based on a spheroid). In the geographic coordinate system a point is referenced by its

longitude and latitude parameters. Latitude and longitude are angles, with the apex located in the
Earth's center and one of the sides - passing through a point on the Earth's surface. Generally,
angles are measured in degrees (or grads).
A projected coordinate system is defined on a flat, two-dimensional surface. Unlike a
geographic coordinate system, a projected coordinate system has a constant length, angles, and
areas in two dimensions. It is always based on a geographic coordinate system, which is
projected on a sphere or a spheroid. In the projective coordinate system, a position is defined by
X,Y coordinates on the coordinate grid, with the initial point in the grid center. Each point is
determined by two parameters that reference it to the central point. One parameter determines its
horizontal position, and the other - vertical.
When the first cartographic projections were developed, it was wrongly believed that the
Earth was flat. Later, this assumption was revised, and the Earth was accepted as a perfect
sphere. In the 18th century, people began to realize that the Earth was not completely round. This
was the beginning of the cartographic spheroid concept.
For more accurate reflection of the position on the Earth's surface, cartographers have
studied the shape of the Earth (geodesy) and created a spheroid concept. A datum links a
spheroid to individual parts of the Earth's surface. Modern datums are designed in such a way
that they are well suited for the entire Earth's surface.
The most well-known and widely used datums are the following:
1. NAD 1927 (North American Datum 1927) using the Clarke 1866 spheroid
2. NAD 1983 using the Geodetic Reference System (GRS) 1980 spheroid
3. World Geodetic System (WGS) 1984 using the WGS 1984 spheroid
4. Pulkovo-1942 (CS-42, Coordinate system 1942) Local datum using the
Krasowsky ellipsoid.
Modern spheroids are developed based on satellite measurements, and are more accurate
than those created in the 19th and the beginning of the 20th centuries.
It should be understood that the terms "geographic coordinate system" and "datum" are
interchangeable.
3.5 Conversion of coordinate values between formats
Geographic coordinates define the position of a point on the Earth's surface or in the
geographicalenvelope . Latitude and longitude values are recorded in angular measures -
degrees "°", minutes "'", seconds """(rarely in radians).
To denote northern latitudes, "N" is recorded before or after the latitude value (in case of
russification it can be "с.ш." after the latitude value). To denote southern latitudes, "S" is
recorded before or after the latitude value (in case of russification it can be "ю.ш." after the
latitude value). To denote eastern longitudes, "E" is recorded before or after the longitude value
(in case of russification it can be "в.д." after the longitude value). To denote western longitudes,
"W" is recorded before or after the longitude value (in case of russification it can be "з.д." after
the longitude value).
Geographic coordinates of one and the same point can be expressed in various formats.
These are:
1. Degrees and fractions of degrees. Latitude and longitude are recorded in degrees
and fractions of degrees, separated by a decimal point (decimal comma). A degree
mark "°" shall be put after the fractional part. It is recommended to complement
the whole part with zeros from the left, in such a way that the whole part of the
latitude would consist of 2 digits, and longitude - 3 digits. Example: N60.000000°
E030.000000°. It should be read as "60 degrees of northern latitude, 30 degrees of

eastern longitude". When used in mathematical calculations, it is often convenient
to present latitude and longitude values as real signed numbers, where southern
latitude and western longitude will be negative, and northern latitude and eastern
longitude - positive.
2. Degrees, minutes, and fractions of minutes. Latitude and longitude are recorded in
degrees, minutes, and fractions of minutes. The degree mark "°" shall be put after
the degrees value, the minute mark "'"- after the fractional part of minutes. It is
recommended to complement the degree values with zeros from the left, in such a
way that the degrees value of the latitude would consist of 2 digits, and longitude
- 3 digits. It is recommended to complement the values of the whole part of
minutes with zeros from the left, in such a way that they would consist of 2 digits.
Example: N60°05.000' E030°07.000'. It should be read as "60 degrees 5 minutes
of northern latitude, 30 degrees 7 minutes of eastern longitude".
3. Degrees, minutes, seconds, fractions of seconds. Latitude and longitude are
recorded in degrees, minutes, seconds, and fractions of seconds. The mark "°"
shall be put after the degrees value, the mark "'" shall be put after the minute
value, the second mark """ shall be put after the fractional part of seconds. It is
recommended to complement the degree values with zeros from the left, in such a
way that the degrees value of the latitude would consist of 2 digits, and longitude
- 3 digits. It is recommended to complement the values of the minutes and whole
part of seconds with zeros from the left, in such a way that they would consist of 2
digits. Example: N60°05'02.0" E030°07'03.0". It should be read as "60 degrees 5
minutes 2 seconds of northern latitude, 30 degrees 7 minutes 3 seconds of eastern
longitude".
4. Radians. Latitude and longitude values in radians are mainly used in the internal
representation in computer systems of GPS receivers. Latitude and longitude
values are presented as real signed numbers, where southern latitude and western
longitude will be negative, and northern latitude and eastern longitude - positive.
In order to avoid problems with coordinates converting, it is easier to set up the GPS so
that it displays the coordinate values in the format DD.DDDDD. However, this may be
inconvenient for those who orients in the field by gridded topographic maps, with the
coordinates specified in another numeric format.
Conversion is based on the fact that one degree contains 60 minutes, and one minute
consists of 60 seconds.
To convert from degrees to degrees and minutes:
1. The whole part of degrees stays as it is
2. The fractional part of degrees (it is always less than 1) is multiplied by 60, and we
get the minutes value.
Example: 60.5°. The whole part is 60, the fractional part is 0.5. 0.5*60=30. We get the
following: 60.5° = 60°30'.
To convert from degrees and minutes to degrees:
1. The whole part of degrees stays as it is
2. The minutes value is divided by 60, and we get a fractional value of degrees
Example: 60°30'. The whole part is 60, the minutes value is 30. 30/60=0.5. We get the
following: 60°30'=60.5°
To convert from degrees and minutes to degrees, minutes and seconds;
1. The degrees value stays as it is;
2. The whole part of minutes stays as it is;

3. The fractional part of minutes (it is always less than 1) is multiplied by 60, and we
get the seconds value.
Example: 60°30.25'. The degrees value is 60, the whole part of minutes is 30, the
fractional part of minutes is 0.25. 0.25*60=15. We get the following: 60°30.25 = 60°30'15".
To convert from degrees, minutes and seconds to degrees and minutes:
1. The degrees value stays as it is;
2. The minutes value stays as it is;
3. The seconds value is divided by 60, and we get a fractional part of minutes.
Example: 60°30'15" is 60°30, the fractional part of minutes is equal to 15/60 =0.25, i.e.
60°30'15"=60°30.25'
To convert from degrees to degrees, minutes and seconds, first, convert the degrees to
degrees and minutes, and then degrees and minutes to degrees, minutes and seconds and vice
versa.
4 USE OF GPS FOR FOREST MANAGEMENT PURPOSES
4.1 General information on the device
A rugged handheld navigator GPSMAP 64 is equipped with a quad helix antenna. It
simultaneously uses signals from 24 GPS and GLONASS satellites, which significantly speeds
up determination of your location in practically all weather conditions.
1. Internal GPS/GLONASS antenna
2. Keys:
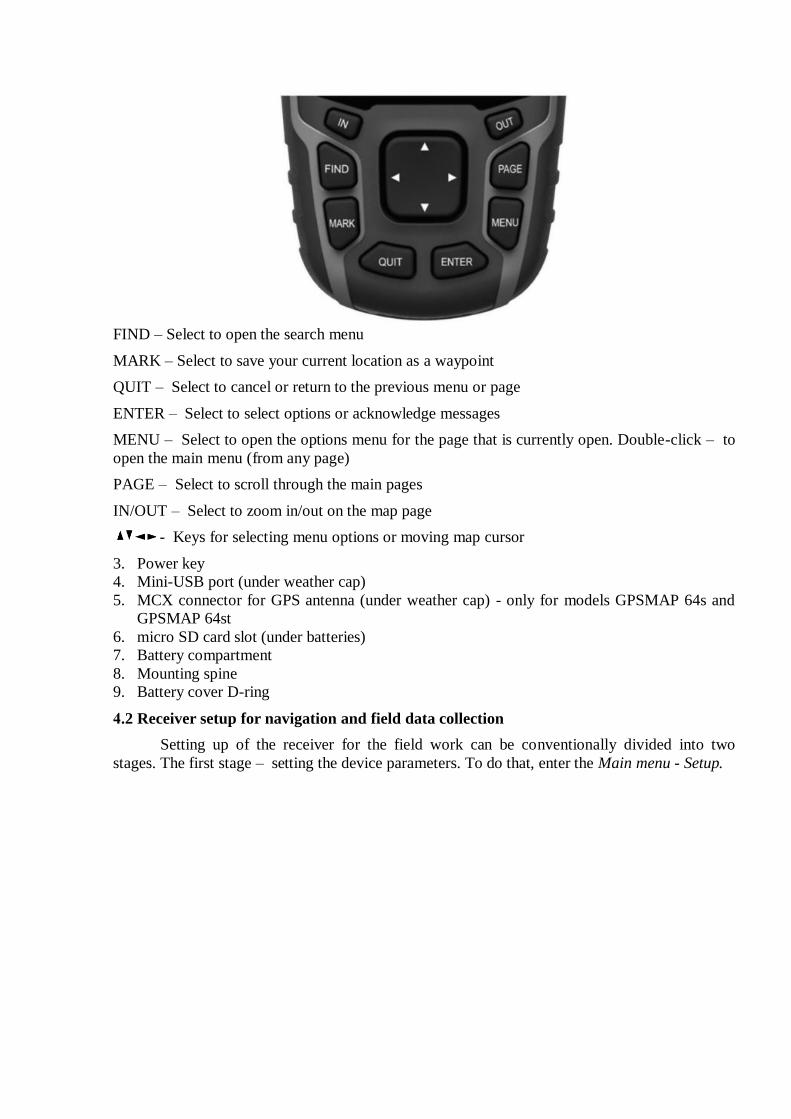
FIND – Select to open the search menu
MARK – Select to save your current location as a waypoint
QUIT – Select to cancel or return to the previous menu or page
ENTER – Select to select options or acknowledge messages
MENU – Select to open the options menu for the page that is currently open. Double-click – to
open the main menu (from any page)
PAGE – Select to scroll through the main pages
IN/OUT – Select to zoom in/out on the map page
- Keys for selecting menu options or moving map cursor
3. Power key
4. Mini-USB port (under weather cap)
5. MCX connector for GPS antenna (under weather cap) - only for models GPSMAP 64s and
GPSMAP 64st
6. micro SD card slot (under batteries)
7. Battery compartment
8. Mounting spine
9. Battery cover D-ring
4.2 Receiver setup for navigation and field data collection
Setting up of the receiver for the field work can be conventionally divided into two
stages. The first stage – setting the device parameters. To do that, enter the Main menu - Setup.

1. System. Here, in the Satellite system field select GPS + GLONASS, in the
WAAS/EGNOS field activate the use of the wide area argumentation system data,
select an easy-to-understand text language on your device, as well as the type of
AA battery you are using in the appropriate field.
2. Further, Coordinates format. Indicate the desired format in the field of the same
name. For the field work it is handy when the coordinates are expressed in
degrees, minutes, seconds and fractions of seconds (hdd°mm'ss.s"). The Map
datum and Map spheroid fields value should be set as WGS84.
3. An appropriate setting of measurement units also adds comfort at work. The
device allows you to customize units of measure for distance and speed,
elevation, depth, as well as temperature, pressure, and vertical speed. These
settings can be done in the menu Setup – Units.
4. After this, you can make setting of the screen, tones, time, and other parameters
according to your taste. This can be done in the relevant fields, the contents of
which is clear from the title.
The second stage - setting up the main pages parameters. Viewing the main pages and
switching between them is performed using a PAGE key.
Double-click the MENU
key and call up a list of menu commands. Select Setup.

Viewing the main pages and switching between them is performed using a PAGE key.
1. Map. Press MENU – Map Setup on the map page. Here you need to set some
important parameters in the appropriate fields. In the Orientation field – specify
North up, in the filed Data fields – a number of control fields convenient for your
work, which will be reflected in the map area (e.g., 1 large, where geographical
coordinates will be reflected). In the Map information field - select the desired
map, currently loaded on the device. Next, press QUIT. For display of
geographical coordinates in the appeared field on the map page select MENU -
Change data fields. Press ENTER and select Location (selected) from the
proposed list.
1. For the correct operation of the device, it is necessary to calibrate compass and
altimeter prior to the start of the operation. To perform calibration of the
electronic compass, you must be outdoors, away from objects that influence
magnetic fields, such as cars, buildings, or overhead power lines. On the compass
page, press MENU – Calibrate compass - Start. Then follow the simple on-
screen instructions. It is recommended to calibrate the compass again after
moving long distances, experiencing temperature changes, and changing the
batteries.
2. You can manually calibrate the barometric altimeter only if you know for certain
the exact elevation or the exact barometric pressure. Further, select MENU –
Calibrate altimeter on the Elevation profile page and follow the on-screen
instructions.
3. Trip computer This function displays the current, average and maximum speed,
as well as mileage and other useful data. You can customize the trip computer
layout, dashboard, and data fields. Select MENU on the trip computer page. In
the Change dashboard field – set the theme of the dashboard as Recreational
and set up the data display at your desire, by pressing MENU - Change data
fields. For example, make the setting the way to see the information on elevation,
average, maximum, and current speed, as well as the information on the travel
time, direction, and odometer readings shown in the fields.
4.3 Using the receiver for navigation and field data collection
As soon as your GPS navigator has acquired satellites signals (it may take 30 to 60
seconds), it will show your location on the map. You can save your current location as a
waypoint, i.e. record the data about the point and store it in the device memory. Press MARK, if

Setting waypoint performed using a
MARK key.
necessary, select a field with the data and make user changes to the waypoint information. Select
Done.
Using the keys on the joypad you can move the cursor around the map and view the
map sections of interest. You can also mark any object of your interest as a waypoint, to be more
precise – create a projection of a waypoint. To do this, place the cursor at the desired location on
the map and press ENTER, then MENU – Save as a waypoint. To edit a waypoint, select
Waypoint manager in the main menu. Select the desired waypoint from the proposed list and
make necessary changes (e.g. point name). After that, using the PAGE key, go back to the map
page. The points can also be deleted in the Waypoint manager. Select the point, select MENU –
Delete
Press Enter
Press E
nter
Press “Menu”

Click FIND – Waypoints. If you choose some waypoint from the proposed list and press
Start - the point will become a target one.
Navigation settings can be changed, for example, to direct navigation, without reference to roads.
To do this, press FIND, then Change activity – Straight on.
You can also stop navigation by clicking FIND – Stop navigation.
Press
Enter
Press
Enter
Press
Enter

Your path can also be saved in the device memory in the form of a track. The track log
will contain information about points along the recorded path, including time, location, and
elevation of each point. To activate this function, select Setup - Tracks.
Indicate Record, do not show (if you don't want to see the track rendering in the map
area), or Record, show (if you need the opposite) in the Track log field. In the remaining fields
settings can also be done. Such as color, recording method, interval, and auto archiving setting.
After the track record is activated, elevation profile record starts along with it. To view it, select
Elevation profile from the menu Track manager – Current track.
You can also save the entire track or its part, delete or clear it by selecting an appropriate
action. Upon the completion of the works, before turning off the device, it is recommended to
turn off the track record. Otherwise, when you turn the device on at a new location, it will render
a straight line in the form of a track from the last place of use to the new one.
4.4 Practical examples of field data collection
For example we need to find and map a spring with healing mineral water. We know that
there is a trail going uphill from village to the spring. First of all turn on GPS receiver and turn
on track log. Follow the trail up to the spring. When spring is reached press Mark button, name
this waypoint (for example “spring 1”) and press “Enter” to save waypoint. To use this data on
computer or share it with another GPS user we have to transfer GPS data from receiver to hard-
drive of computer (see Ch. 3).
Another task is to walk through some territory inspecting illegal logging. Turn on the
device and turn on track log Record and show. If you want to come back to the same point you
started from it would be useful to Mark this point. While we go we always can see a polyline
showing covered territory. When interesting point is met, press Mark and name the point
consistently. When cutting plot is found you can walk along the sides to get borders tracked.
This will not only show location but it will also allow getting shape of cut territory and it will
help to calculate area using GIS tools.
Press
Enter
Showing track options

All information is stored in the Garmin - GPX folder. Information about the current track is located in the Current folder, saved tracks - in the Archive folder.
5 GPS AND GIS
5.1 Methods for further data processing
All information about the landmarks (waypoints), routes, and tracks is stored in the
device memory in the GPX format. This is a text format for storage and exchange of GPS data. It
is a free format, which can be used without any license fee. Information on the longitude,
latitude, and altitude above the sea level (if altitude information is available) is stored for every
point. For the track points, the point passing time is also stored. The GPX format also enables
storing arbitrary user information on each point, only longitude and latitude are mandatory.
If you need simply to upload materials, connect your device to the computer as an
external data medium. All information on the waypoints, routes, and completed tracks is stored
in the Garmin - GPX folder. Information about the current track is located in the Current folder,
saved tracks - in the Archive folder.
However, simply to upload the data from the device memory during the work is
insufficient, it is often necessary to make them editable. To perform this task, we will use a free
GIS - QuаntumGis.
We start the program using a desktop shortcut or the Start menu.
Select Modules – GPS from the list of commands in the main menu. Go to the GPS Tools
line and click the left mouse button.

Select Modules - GPS. Go to the GPS Tools line and click the left
mouse button.
Click the Brouse button in the GPX files
tab.
GPS Tools window will open. Click the Brouse button in the GPX files tab.
In the Select GPX-file folder, specify the path to the desired data and click Open.

Select the desired object type in the Object type field, press OK.
Now the selected data is displayed in the GPS Tools window. Select the desired object
type, for example Waypoints, in the Object type field.
Next, press OK.
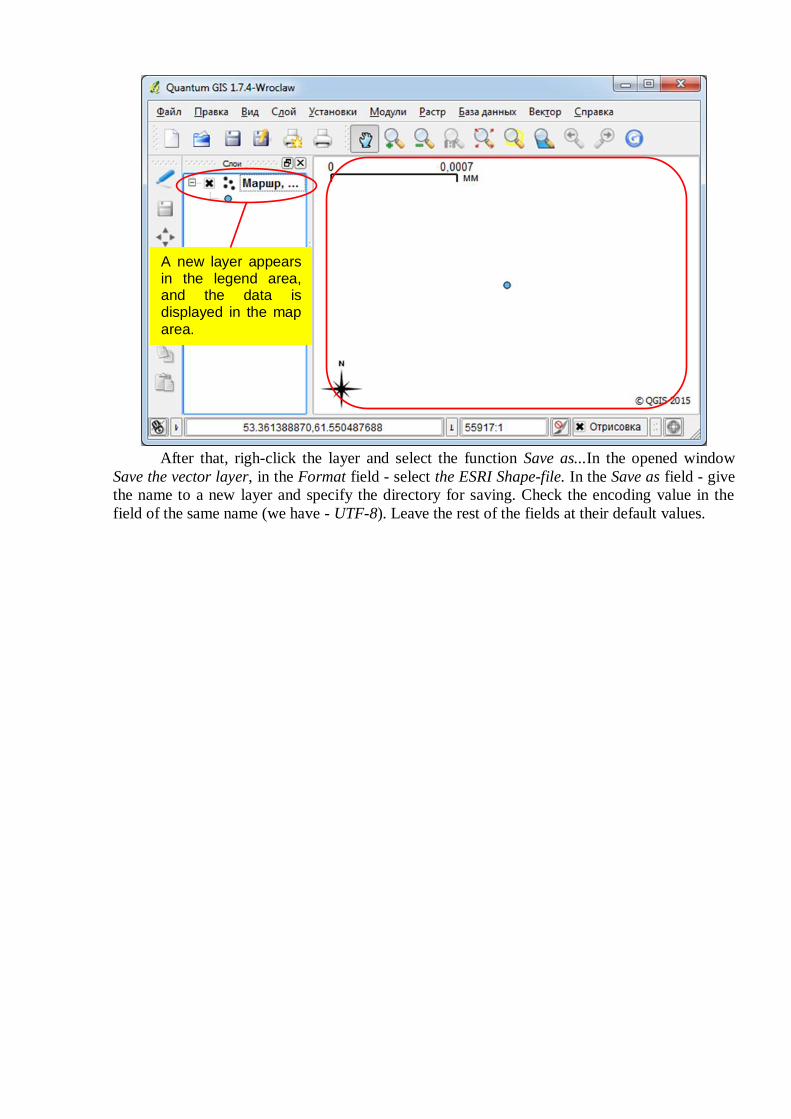
A new layer appears in the legend area, and the data is displayed in the map area.
Specify the path to the desired data and click Open
A new layer appears in the legend area, and the data is displayed in the map
area.
After that, righ-click the layer and select the function Save as...In the opened window
Save the vector layer, in the Format field - select the ESRI Shape-file. In the Save as field - give
the name to a new layer and specify the directory for saving. Check the encoding value in the
field of the same name (we have - UTF-8). Leave the rest of the fields at their default values.

In the Format field, select the ESRI Shape-file, then specify the
directory for saving and the name,
check the encoding.
Press OK
Press OK.
After the export completes, you can add this layer as an ordinary shape-file to the legend
area and work with it.
In the case where you need only to graphically display some data, for example, in the
Google Earth application, you can export your GPX file to the KML format. To do this, in the
window Save the vector layer as ..., specify it in the Format field.
5.2 Vector data loading into the GPS receiver
The software package, designed for the vector materials preparation and loading into the
GPS, includes the following software:
1. QuаntumGIS, developed by QGIS Development Team
2. GPSMаpEdit, developed by Konstantin Galichsky

2
3
4
1
3. cGPSmapper, developed by Cgpsmapper
4. SendMаp20, developed by Stanislaw Kozicki
QGIS software is used at the first stage of the vector data preparation to establish the
initial projection of the vector materials and transform them to the coordinate system necessary
for loading into the GPS (WGS 84 geographic coordinate system).
GPSMаpEdit.exe software is used to further process the vector materials and transform
them into the format suitable for loading to the GPS. The GPSMаpEdit application additionally
uses freely distributed сGPSmаpper modules in its operation.
SendMаp20 software is used to load several maps in the IMG format, prepared in the
earlier stages.
The above-listed software provides the user of the GPS receiver with all functionality for
the vector materials preparation and their loading into the device.
The sequence of operations for vector materials preparation and loading into the receiver
is carried out in the following order:
- vector data loading into the QGIS application;
- assigning the projection of the appropriate digital area (if such is missing) to them,
transforming the materials into a geographic projection and their saving in the formats of the
corresponding application;
- a sequential loading of the materials to the GPSMаpEdit application with setting special
parameters for generation of the cartographic materials suitable for loading to the GPS device;
- vector materials transformation from the GPSMаpEdit application formats into the
format with the IMG extension;
- loading of the map in the GPS device using the SendMаp program.
5.2.1 Work in GPSMаpEdit
Start the GPSMapEdit application using a desktop shortcut or the Start menu. After
starting, the program window will open. It can be conditionally divided into four major areas.
These are:
1. The main menu
2. A toolbar
3. A map area
4. A map information area

Select File – Import – ESRI Shape-file (*.shp) from the
list of commands in the main menu.
Define the path to
the shape-file
Select File – Import from the list of commands in the main menu. Go to the Shape-file
ESRI (*.shp) line and click the left mouse button.
Define the path to the file in the Folder field of the Import window.
Then the dialog box for the polygonal objects layer import will open.

In the View field, the
polygon option will be automatically selected, in the Set of types field - set
Garmin
Select the type of objects coloring according to your desire. Click Next.
When importing the data from the shape-file, in the View field, the polygon option will be
selected automatically, in the Set of types field - set Garmin In the display window of objects
coloring types, select the line at your option, for example, the line with the code 0x0001 - Urban
area ( >200 thousand residents). Click Next.
In the second dialog box, the table field according to which the polygons will be named
on the screen of the GPS receiver is determined. To do this, activate the check box in the field
Select the field with lettering. Place the mouse cursor in the Name field and click it once with the
left mouse button. The column will be highlighted. In the Encoding field, set Unicode (UTF-8),
if you worked with the shape-file in Quantum GIS.

Activate the check box, select the Name field, and in the Encoding field - set Unicode (UTF-
8).
Click Next.
Click Next.
Leave the third window without changes, click Next.
Click Next.
Click Done.
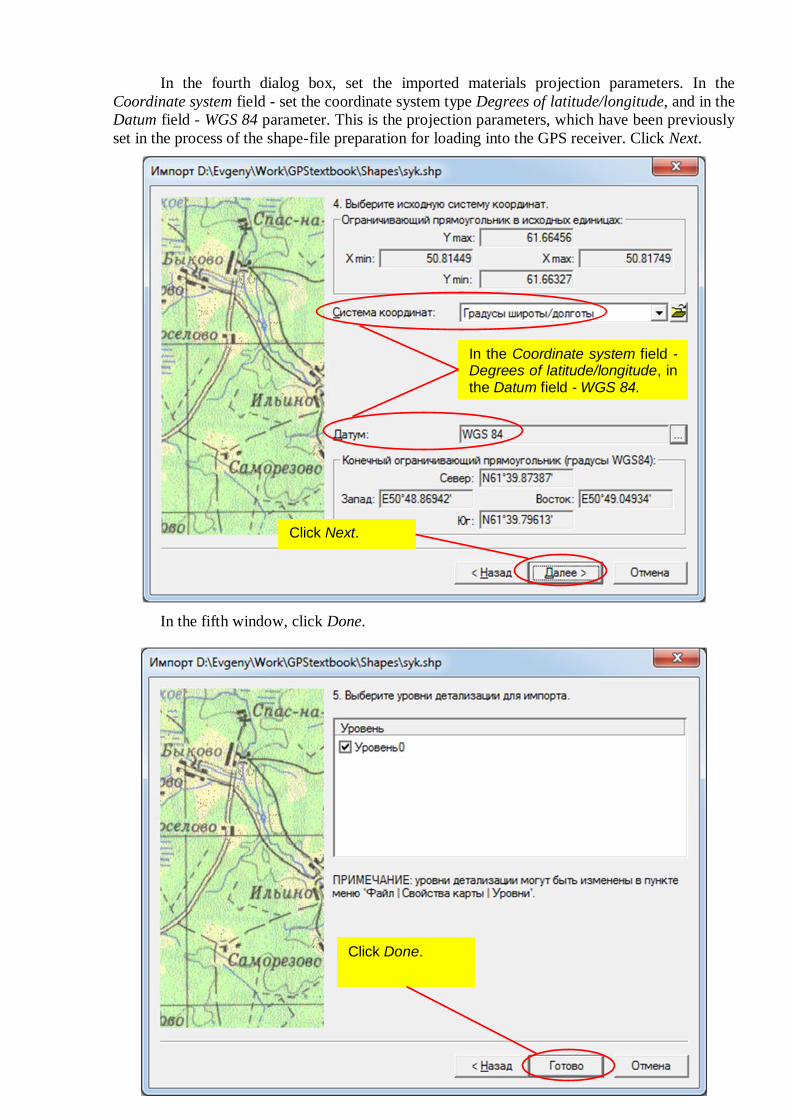
In the fourth dialog box, set the imported materials projection parameters. In the
Coordinate system field - set the coordinate system type Degrees of latitude/longitude, and in the
Datum field - WGS 84 parameter. This is the projection parameters, which have been previously
set in the process of the shape-file preparation for loading into the GPS receiver. Click Next.
In the fifth window, click Done.
In the Coordinate system field - Degrees of latitude/longitude, in the Datum field - WGS 84.
Click Next.

Vector materials are loaded into the GPSMаpEdit application.
At any stage of the map creation it can be saved in one of the internal application formats.
To perform the saving operation, select the command Save the map as from the list of the File
menu commands. Define the file saving path in the Folder field of the map saving window. In
the File type field, set the Polish format (*.mp, *.txt)» as a saving format type, and enter the file
name in the File name field.
Define the saving path, set the Polish format (*.mp, *.txt)» in the File type field, and enter the file
name in the File name field.
Vector materials are loaded into the
GPSMаpEdit application.
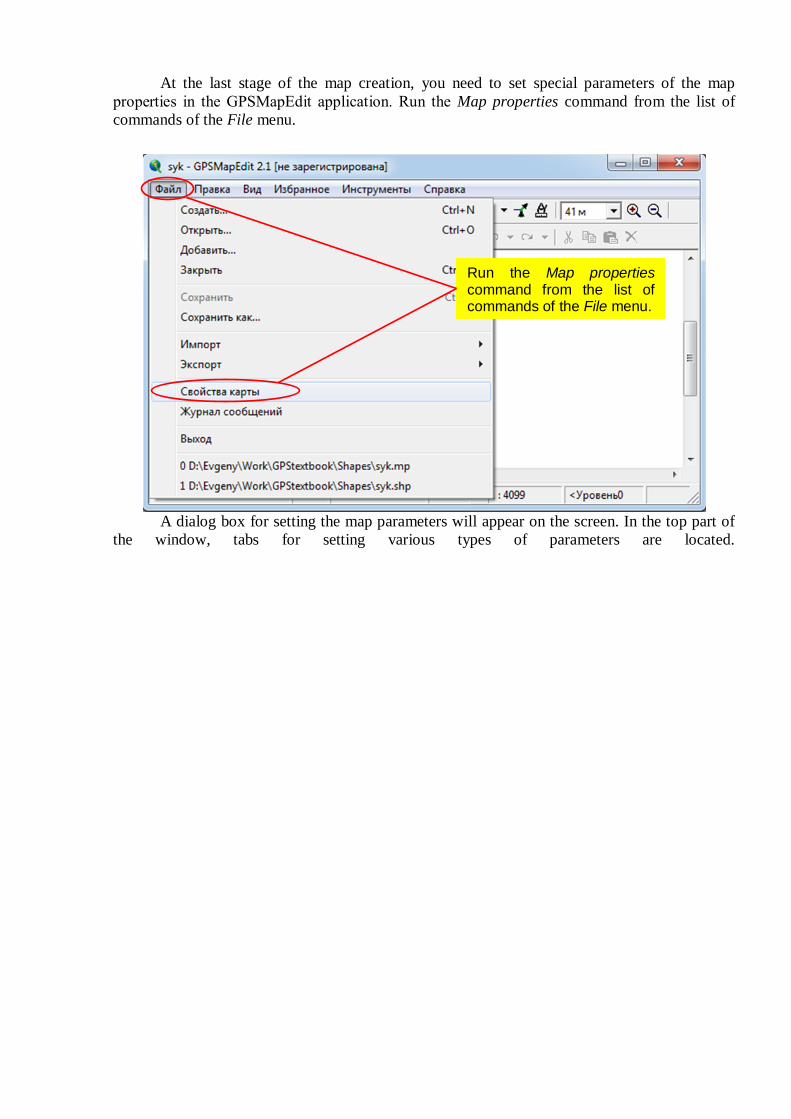
Run the Map properties command from the list of commands of the File menu.
At the last stage of the map creation, you need to set special parameters of the map
properties in the GPSMаpEdit application. Run the Map properties command from the list of
commands of the File menu.
A dialog box for setting the map parameters will appear on the screen. In the top part of
the window, tabs for setting various types of parameters are located.

Now, more details on each individual tab.
Setting the parameters in the Title tab:
1. Set the Garmin parameter in the Set of types field.
2. Set a unique digital code of the map in the ID field. Simultaneous loading of two
and more maps with the same number into the GPS is impossible. The map
number consists of 8 decimal digits from 0 to 9 or 8 hexadecimal digits from 0 to
F; in the latter case, the "I" symbol is put before the number.
3. The map name contains the information about the map. You can give the name
according to the name of the district or cartographic layer. The map name can
consist of any Latin characters or digits.
4. In the Copyright information field, information on the map's manufacturer, or its
owner is provided.
5. Enter the height measurement unit parameter in the Height units field. Select
measurement units in meters - Meters.
6. Enter the map lettering display parameters in the Encoding and Encoding scheme
fields. Each field offers a long list of parameters. Their different combinations
Tabs for setting different
types of parameters.

allow achieving a proper display of map lettering on the screen of the GPS device.
In the Encoding field, select the parameter value as 65001 (UTF-8), and in the
Encoding scheme field, set the parameter value as European (one byte).
Levels tab determines the level of detail of the map display in the device when changing
the display scale. Display of the current level of detail is an important parameter. A created
vector map can have several levels. Creation of levels of detail is necessary to optimize the
amount of information displayed on the map and speed up the device operation depending on the
current scale. The display always shows only one level of detail. As you scale the map up and
down and set the levels themselves, they replace each other. The GPSMаpEdit application offers
the user 2 levels of detail on the map by default. In total, up to 9 levels can be defined. A certain
cartographic data layer should be assigned to each level.
Pressing the Insert before button allows a map maker to add levels of detail on the map
and pressing the Edit button allows changing the parameters values of each level of detail. The
last level in the given list shows us starting with which scale the map details will not be
displayed on the screen of the device. However, for creation of the majority of the model maps
there is no need to change the number of levels proposed by default.
Set the Garmin parameter and define a digital code of the map
Specify the name of the map and enter the information about its owner.
Set WGS 84, Meters, 65001 (UTF-8), European (one byte)
in the appropriate fields
Press OK

Pressing Insert before allows adding levels of detail and pressing Edit allows changing the
parameters values of each level
of detail.
Press OK
cGPSMapper. The parameters set in this tab will be transferred to the сGPSMаpper
compiler in the process of the map creation in the IMG format.
Maps in the IMG format consist of rectangular "units". The units can overlap or adjoin
one another - it depends on the generating program. The TRE size field determines the
size of a map splitting unit. If you set too small value of the parameter, the map will
quickly emerge on the screen of the GPS device, but at the same time the map volume
will increase significantly. If you set a large value of the parameter, the situation will be
opposite. The optimum value of this parameter is the value equal to 511. The optimum
value of the RGN limit parameter, the maximum number of objects in the unit, is 127.
1. Leave the values of the TRE size and RGN limit fields as proposed by default.
2. In the TRE margin field, the map edge margin is set. Defining the map edges
parameter is required for the proper display of the map objects located in the edge
area of the rectangle, describing the objects of this map. Enter the field value
equal to 0.050.
3. The Transparent map field determines the transparency of the map when you
overlay it to other map while loading the maps with adjacent or overlapping

Clear all the check boxes
and click OK
Leave the TRE size and RGN limit fields at their default values and in the TRE margin field -
enter the field value equal to 0.050
borders. To correctly overlay objects of one map to objects of other map, set the
parameter value of this field as S - Transparent map with transparent background.
4. In the Pre-processing field, the type of the map processing during the process
of its transformation into the IMG format is defined. Set
Generalization+intersection, which is optimal.
5. In the tab section These features are available only in the PAY versions of
сgpsmаpper.exe clear all the check boxes.
Other tabs of the map properties window do not require setting.
Click the "OK" button and save the map on the disk by running the Save the map
command from the File menu.
5.2.2 Work with the сGPSMаpper compiler
Be sure to save the map before performing the operation.
At the last stage of work in the GPSMаpEdit program, you need to export the map to the
IMG format suitable for loading into the GPS receiver. Run the Export command and then the
Garmin IMG/ сgpsmаpper.exe command from the File menu list of commands.
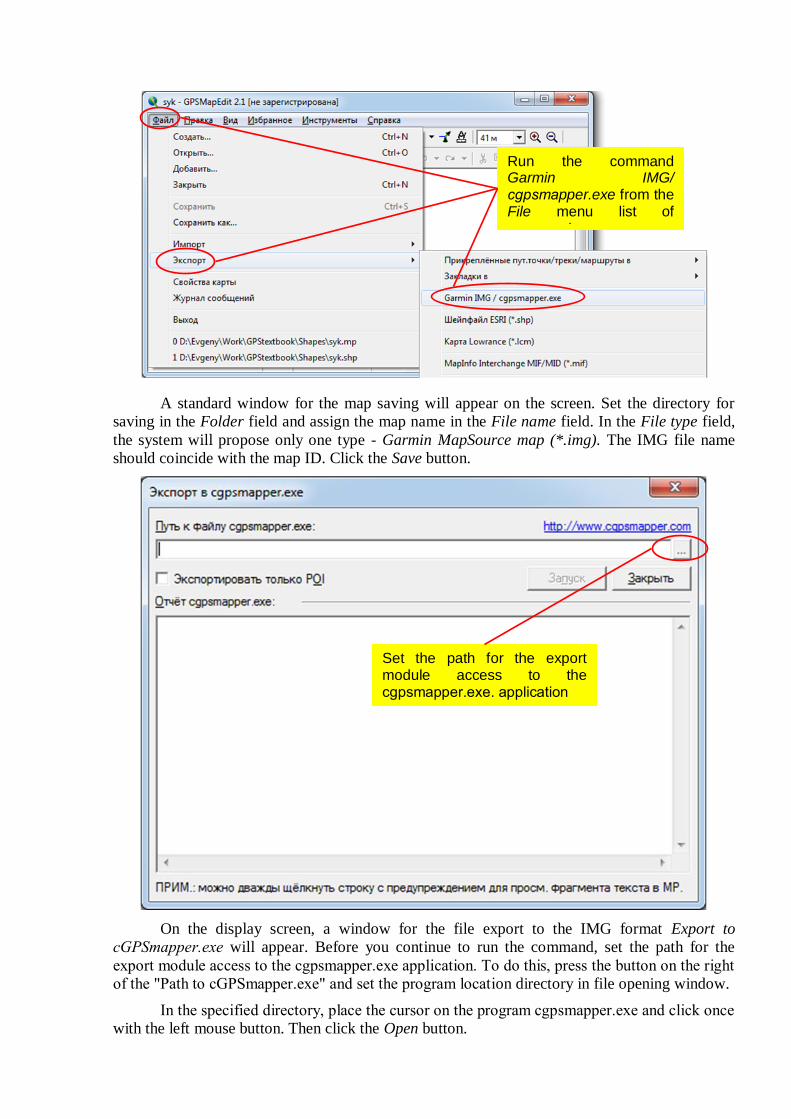
Run the command Garmin IMG/ сgpsmаpper.exe from the File menu list of
commands
A standard window for the map saving will appear on the screen. Set the directory for
saving in the Folder field and assign the map name in the File name field. In the File type field,
the system will propose only one type - Garmin MapSource map (*.img). The IMG file name
should coincide with the map ID. Click the Save button.
On the display screen, a window for the file export to the IMG format Export to
сGPSmаpper.exe will appear. Before you continue to run the command, set the path for the
export module access to the сgpsmаpper.exe application. To do this, press the button on the right
of the "Path to сGPSmаpper.exe" and set the program location directory in file opening window.
In the specified directory, place the cursor on the program сgpsmаpper.exe and click once
with the left mouse button. Then click the Open button.
Set the path for the export module access to the сgpsmаpper.exe. application

In the specified directory, select the сgpsmаpper.exe program, click the Open
button.
In the field Path to the file сgpsmаpper.exe, an access path to the program will be
displayed.
In the file export window Export to сGPSmаpper.exe, click the Start button.
In the field Path to the file сgpsmаpper.exe, an access path to the program will be
displayed, click the Start button.

In the сGPSmаpper.exe Report a full report on the operation's implementation progress will be
displayed, click Close.
After the export operation completion an information window containing the operation
execution results will be displayed.
Click the OK button.
In the information field Export to сGPSMаpper.exe of the сGPSMаpper.exe Report
window, a full report on the operation's implementation progress will be displayed. Click the
Close button. Close the GPSMаpEdit application.
3.2.3 Processed data loading into the GPS receiver
So, after the map export you can proceed directly to its loading into the GPS receiver.
This can be done in several ways. We will dwell upon the two simplest of them.
The first one is to manually assign the name gmаpsupp to our map image and copy it to
the internal memory of the device, to the GARMIN folder.

The second method allows you to download several different maps at the same time.
1. Start the sendMаp20 application.
2. Left-click on the Add maps field, select the data in the IMG format that needs to
be loaded.
Click on the Add maps field, select the data that needs to be loaded. Next, establish connection with the
device by clicking Connect.
After the model of your device appears under the Connect field, click
Upload maps to GPS.
Manually assign the name gmаpsupp to the map image and copy it to the internal memory of the device, to the
GARMIN folder.

3. Next, connect your GPS receiver to the computer and establish connection with
the device by clicking Connect.
4. After the model of your device appears under the Connect field, click Upload
maps to GPS. The set of your maps is loaded to the device memory.
Be careful when carrying out this operation, all the maps formerly located in the device
will be overwritten. Don't forget to make back-up copies.

About FLEG II (ENPI East) Program The Forest Law Enforcement and Governance (FLEG) II European Neighbourhood and Partnership Instrument (ENPI) East Countries Program supports participating countries’ forest governance. At the regional level, the Program aims to implement the 2005 St. Petersburg FLEG Ministerial Declaration and support countries to commit to a time-bound action plan; at the national level the Program will review or revise forest sector policies and legal and administrative structures; and improve knowledge of and support for sustainable forest management and good forest governance in the participating countries, and at the sub-national (local) level the Program will test and demonstrate best practices for sustainable forest management and the feasibility of improved forest governance practices at the field-level on a pilot basis. Participating countries include Armenia, Azerbaijan, Belarus, Georgia, Moldova, Russia, and Ukraine. The Program is funded by the European Union. http://www.enpi-fleg.org
Project Partner
EUROPEAN COMMISSION The European Union is the world’s largest donor of official development assistance. EuropeAid Development and Cooperation, a Directorate General of the EuropeanCommission, is responsible for designing European development policy and delivering aid throughout the world. EuropeAid delivers aid through a set of financial instruments with afocus on ensuring the quality of EU aid and its effectiveness. An active and proactive playerin the development field, EuropeAid promotes good governance, human and economic development and tackle universal issues, such as fighting hunger and preserving naturalresources. http://ec.europa.eu/index_en.htm
WORLD BANKThe World Bank Group is one of the world’s largest sources of knowledge and funding for its 188 member-countries. The organizations that make up the World Bank Group areowned by the governments of member nations, which have the ultimate decision-making power within the organizations on all matters, including policy, financial or membership issues. The World Bank Group comprises five closely associated institutions: theInternational Bank for Reconstruction and Development (IBRD) and the InternationalDevelopment Association (IDA), which together form the World Bank; the International Finance Corporation (IFC); the Multilateral Investment Guarantee Agency (MIGA); and theInternational Centre for Settlement of Investment Disputes (ICSID). Each institution playsa distinct role in the World Bank Group’s mission to end extreme poverty by decreasing the percentage of people living on less than $1.25 a day to no more than 3 percent, andpromote shared prosperity by fostering the income growth of the bottom 40 percent forevery country. For additional information please visit: http://www.worldbank.org, http://www.ifc.org, http://www.miga.org
IUCNIUCN, International Union for Conservation of Nature, helps the world find pragmaticsolutions to our most pressing environment and development challenges. IUCN’s work focuses on valuing and conserving nature, ensuring effective and equitable governance ofits use, and deploying nature-based solutions to global challenges in climate, food and development. IUCN supports scientific research, manages field projects all over the world,and brings governments, NGOs, the UN and companies together to develop policy, lawsand best practice. IUCN is the world’s oldest and largest global environmental organisation, with more than 1,200 government and NGO members and almost 11,000volunteer experts in some 160 countries. IUCN’s work is supported by over 1,000 staff in 45 offices and hundreds of partners in public, NGO and private sectors around the world.www.iucn.org
WWFWWF is one of the world’s largest and most respected independent conservation organizations, with almost 5 million supporters and a global network active in over 100countries. WWF’s mission is to stop the degradation of the planet’s natural environment and to build a future in which humans live in harmony with nature, by conserving the world’s biological diversity, ensuring that the use of renewable natural resources is sustainable,and promoting the reduction of pollution and wasteful consumption. www.panda.org