manual parker
TRANSCRIPT
7/27/2019 Manual Parker
http://slidepdf.com/reader/full/manual-parker 1/37
Global Filtration Technology
The Handbook of Hydraulic Filtration

7/27/2019 Manual Parker
http://slidepdf.com/reader/full/manual-parker 2/37
C ontamination C auses
Most Hydraulic Failures
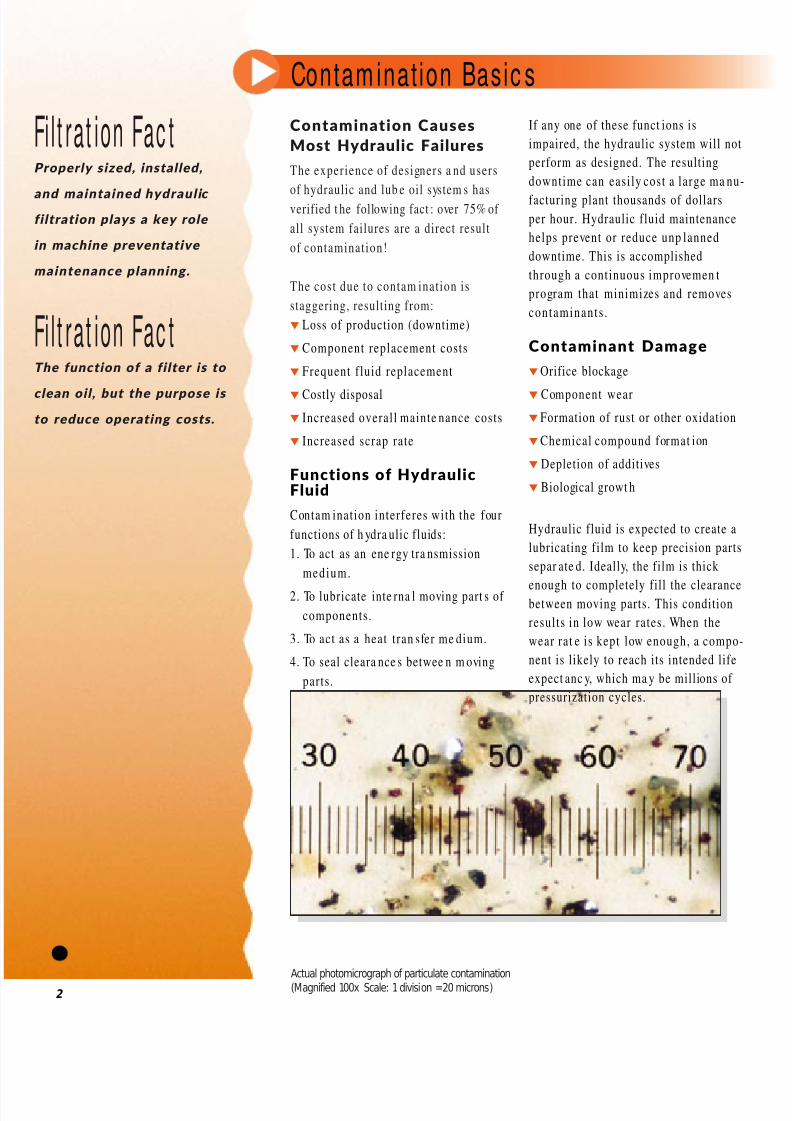
The experience of designers a nd users
of hydraulic and lub e oil system s hasverified t he following fact : over 75% of
all system failures are a direct result
of contamination!
The cost due to contam ination is
staggering, resulting from:
Loss of production (downtime)
Component replacement costs
Frequent f luid replacement
Costly disposal
Increased overall mainte nance costs
Increased scrap rate
Functions of HydraulicFluid
Contam ination interferes with the four
functions of h ydra ulic fluids:
1. To act as an ene rgy tra nsmission
medium.
2. To lubricate inte rna l moving part s of
components .
3. To act as a heat tran sfer me dium.
4. To seal cleara nce s betwee n m oving
parts .
If any one of these funct ions is
impaired, the hydraulic system will not
perform as designed. The resulting
downtime can easily cost a large ma nu-
facturing plant thousands of dollars
per hour. Hydraulic fluid maintenance
helps prevent or reduce unp lanned
downtime. This is accomplished
through a continuous improvemen t
program that minimizes and removes
contaminants .
C ontaminant Damage
Orifice blockage
Component wear
Formation of rust or other oxidation
Chemical compound format ion
Depletion of additives
Biological growt h
Hydraulic fluid is expected to create a
lubricating film to keep precision parts
separ ate d. Ideally, the film is thick
enough to completely fill the clearancebetween moving parts. This condition
results in low wear rates . When the
wear rat e is kept low enough, a compo-
nent is likely to reach its intended life
expect anc y, which ma y be millions of
pressurization cycles.
Contam inat ion Basic s
2
Fi l t rat ion Fac tProperly sized, installed,
and m aintained hydraulic
filtration plays a key role
in mac hine preventative
maintenance planning.
Fi l t rat ion Fac tThe func tion of a filter is to
clean oil, but the purpose is
to reduce operating costs.
Actual photomicrograph of particulate contamination(Magnified 100x Scale: 1 division =20 microns)

7/27/2019 Manual Parker
http://slidepdf.com/reader/full/manual-parker 3/37
The actual thickness of a lubricating
film depends on fluid viscosity, applied
load, and the relative speed of the two
surfaces. In m any components , mech-
anical loads are t o such an extreme
that they squeeze the lubricant into a
very thin film, less than 1 micromet er
thick. If loads become h igh en ough, the
film will be pun cture d by the sur face
roughness of the two moving parts.
The result contributes to harmful
friction.
Cont aminat ion Basic s
3
Micrometer Scale
Particle s izes are generally measure d
on the m icrometer scale. One m icrom-
eter (or “micron”) is one-millionth of
one m ete r, or 39 millionths of an inch .
The limit of huma n visibility is app rox-
imately 40 micrometers. Keep in mind
that most dam age-causing particles in
hydraulic or lubrication systems are
smaller than 40 micrometers .
Therefore, they are microscopic and
cannot be seen by the un aided eye.
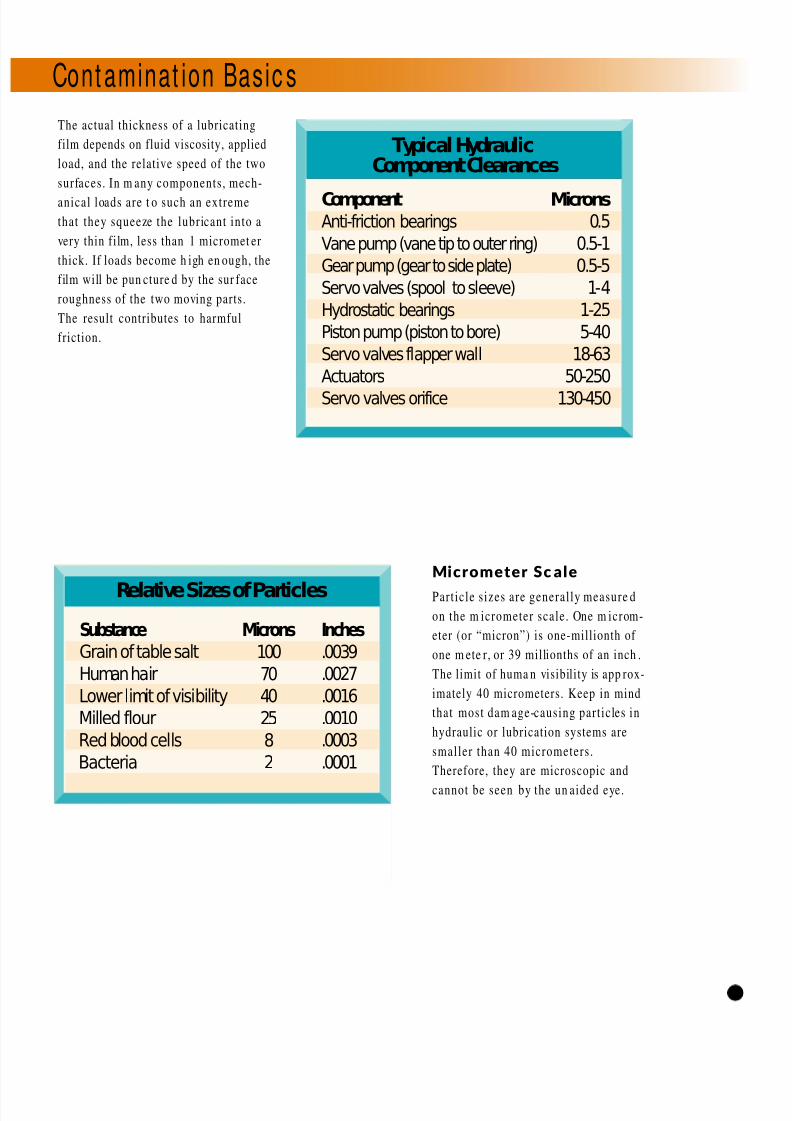
Typical HydraulicComponent Clearances
Microns 0.5
0.5-1
0.5-51-4
1-25
5-4018-63
50-250
130-450
ComponentAnti-friction bearings
Vane pump (vane tip to outer ring)
Gear pump (gear to side plate)
Servo valves (spool to sleeve)
Hydrostatic bearings
Piston pump (piston to bore)
Servo valves flapper wall
Actuators
Servo valves orifice
Relative Sizes of Particles
Inches.0039.0027
.0016
.0010
.0003
.0001
SubstanceGrain of table salt
Human hair
Lower limit of visibilityMilled flour
Red blood cells
Bacteria
Microns100
7040
25
82
7/27/2019 Manual Parker
http://slidepdf.com/reader/full/manual-parker 4/37
The Handbook of Hydraulic
Filtration is intended to
familiarize the user with all
aspects of hydraulic and
lubrication filtration from
the basics to advanced
technology.
It is dedicated as a reference
source with the intent of
clearly and com pletely
presenting the subject m atter
to the user, regardless of the
individual level of expertise.
The selection and proper use
of filtration devices is an
important tool in the battle to
increase production w hile
reducing manufacturing costs.
This Handbook will help the
user make informed decisions
about hydraulic filtration.
7/27/2019 Manual Parker
http://slidepdf.com/reader/full/manual-parker 5/37
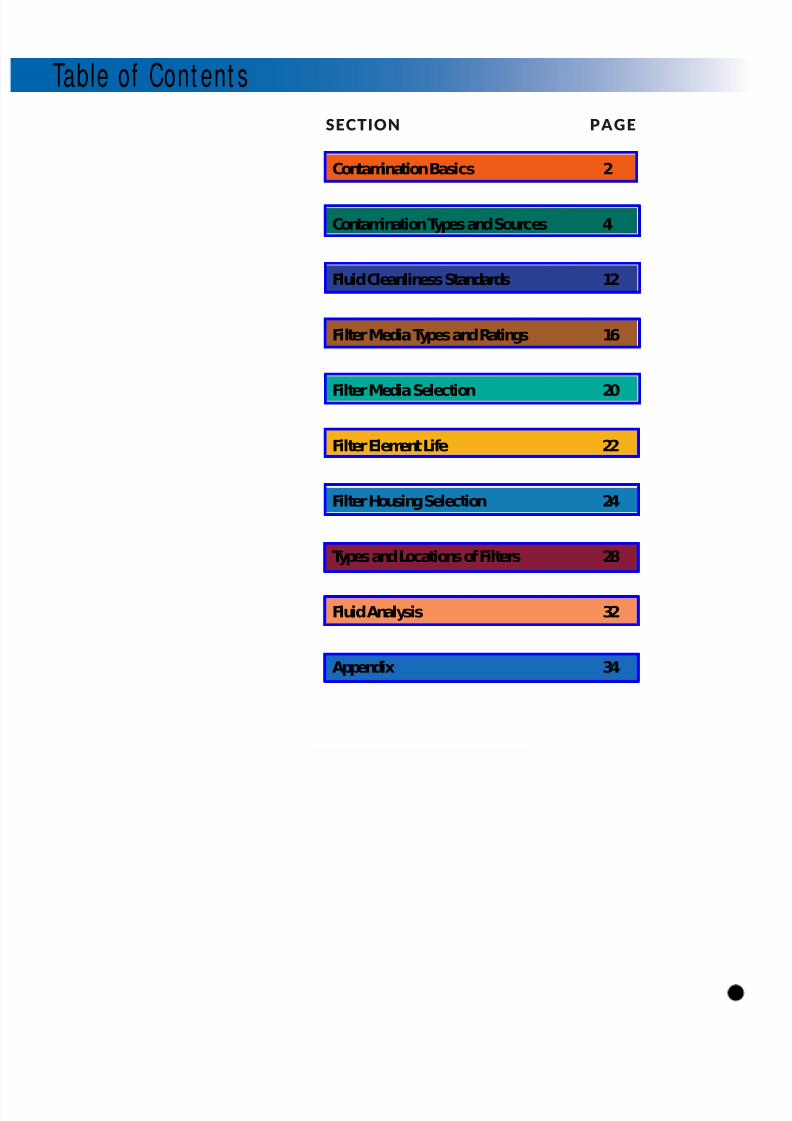
Contamination Basics 2
Contamination Types and Sources 4
Fluid Cleanliness Standards 12
Filter Media Types and Ratings 16
Filter Media Selection 20
Filter Element Life 22
Filter Housing Selection 24
Types and Locations of Filters 28
Fluid Analysis 32
Appendix 34
Table of Cont ent s
1
PAGESECTION
7/27/2019 Manual Parker
http://slidepdf.com/reader/full/manual-parker 6/37
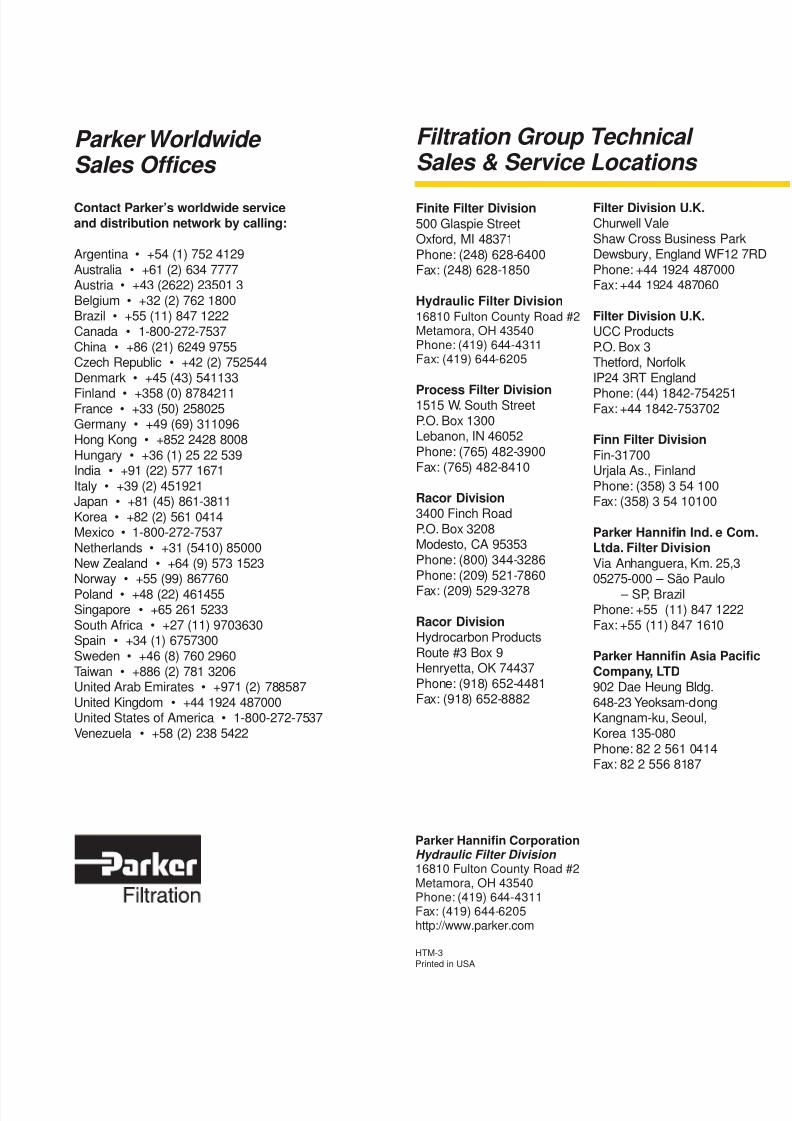
Parker Hannifin CorporationHydraulic Filter Division 16810 Fulton County Road #2Metamora, OH 43540Phone: (419) 644-4311Fax: (419) 644-6205http://www.parker.com
HTM-3
Printed in USA
Contact Parker’s worldwide serviceand distribution network by calling:
Argentina • +54 (1) 752 4129Australia • +61 (2) 634 7777Austria • +43 (2622) 23501 3Belgium • +32 (2) 762 1800Brazil • +55 (11) 847 1222Canada • 1-800-272-7537China • +86 (21) 6249 9755Czech Republic • +42 (2) 752544Denmark • +45 (43) 541133
Finland • +358 (0) 8784211France • +33 (50) 258025Germany • +49 (69) 311096Hong Kong • +852 2428 8008Hungary • +36 (1) 25 22 539India • +91 (22) 577 1671Italy • +39 (2) 451921Japan • +81 (45) 861-3811Korea • +82 (2) 561 0414Mexico • 1-800-272-7537Netherlands • +31 (5410) 85000New Zealand • +64 (9) 573 1523Norway • +55 (99) 867760
Poland • +48 (22) 461455Singapore • +65 261 5233South Africa • +27 (11) 9703630Spain • +34 (1) 6757300Sweden • +46 (8) 760 2960Taiwan • +886 (2) 781 3206United Arab Emirates • +971 (2) 788587United Kingdom • +44 1924 487000United States of America • 1-800-272-7537Venezuela • +58 (2) 238 5422
Parker WorldwideSales Offices
Filtration Group TechnicalSales & Service Locations
Finite Filter Division
500 Glaspie StreetOxford, MI 48371Phone: (248) 628-6400Fax: (248) 628-1850
Hydraulic Filter Division16810 Fulton County Road #2Metamora, OH 43540Phone: (419) 644-4311Fax: (419) 644-6205
Process Filter Division1515 W. South StreetP.O. Box 1300Lebanon, IN 46052Phone: (765) 482-3900Fax: (765) 482-8410
Racor Division
3400 Finch RoadP.O. Box 3208Modesto, CA 95353Phone: (800) 344-3286Phone: (209) 521-7860
Fax: (209) 529-3278
Racor Division
Hydrocarbon ProductsRoute #3 Box 9Henryetta, OK 74437Phone: (918) 652-4481Fax: (918) 652-8882
Filter Division U.K.
Churwell ValeShaw Cross Business ParkDewsbury, England WF12 Phone: +44 1924 487000Fax: +44 1924 487060
Filter Division U.K.
UCC ProductsP.O. Box 3Thetford, NorfolkIP24 3RT England
Phone: (44) 1842-754251Fax: +44 1842-753702
Finn Filter Division
Fin-31700Urjala As., FinlandPhone: (358) 3 54 100Fax: (358) 3 54 10100
Parker Hannifin Ind. e CoLtda. Filter Division
Via Anhanguera, Km. 25,305275-000 – São Paulo
– SP, BrazilPhone: +55 (11) 847 1222Fax: +55 (11) 847 1610
Parker Hannifin Asia Pac
Company, LTD
902 Dae Heung Bldg.648-23 Yeoksam-dongKangnam-ku, Seoul,Korea 135-080Phone: 82 2 561 0414Fax: 82 2 556 8187
7/27/2019 Manual Parker
http://slidepdf.com/reader/full/manual-parker 7/37
C ontamination C auses
Most Hydraulic Failures
The experience of designers a nd users
of hydraulic and lub e oil system s hasverified t he following fact : over 75% of
all system failures are a direct result
of contamination!
The cost due to contam ination is
staggering, resulting from:
Loss of production (downtime)
Component replacement costs
Frequent f luid replacement
Costly disposal
Increased overall mainte nance costs
Increased scrap rate
Functions of HydraulicFluid
Contam ination interferes with the four
functions of h ydra ulic fluids:
1. To act as an ene rgy tra nsmission
medium.
2. To lubricate inte rna l moving part s of
components .
3. To act as a heat tran sfer me dium.
4. To seal cleara nce s betwee n m oving
parts .
If any one of these funct ions is
impaired, the hydraulic system will not
perform as designed. The resulting
downtime can easily cost a large ma nu-
facturing plant thousands of dollars
per hour. Hydraulic fluid maintenance
helps prevent or reduce unp lanned
downtime. This is accomplished
through a continuous improvemen t
program that minimizes and removes
contaminants .
C ontaminant Damage
Orifice blockage
Component wear
Formation of rust or other oxidation
Chemical compound format ion
Depletion of additives
Biological growt h
Hydraulic fluid is expected to create a
lubricating film to keep precision parts
separ ate d. Ideally, the film is thick
enough to completely fill the clearancebetween moving parts. This condition
results in low wear rates . When the
wear rat e is kept low enough, a compo-
nent is likely to reach its intended life
expect anc y, which ma y be millions of
pressurization cycles.
Contam inat ion Basic s
2
Fi l t rat ion Fac tProperly sized, installed,
and m aintained hydraulic
filtration plays a key role
in mac hine preventative
maintenance planning.
Fi l t rat ion Fac tThe func tion of a filter is to
clean oil, but the purpose is
to reduce operating costs.
Actual photomicrograph of particulate contamination(Magnified 100x Scale: 1 division =20 microns)
7/27/2019 Manual Parker
http://slidepdf.com/reader/full/manual-parker 8/37
The actual thickness of a lubricating
film depends on fluid viscosity, applied
load, and the relative speed of the two
surfaces. In m any components , mech-
anical loads are t o such an extreme
that they squeeze the lubricant into a
very thin film, less than 1 micromet er
thick. If loads become h igh en ough, the
film will be pun cture d by the sur face
roughness of the two moving parts.
The result contributes to harmful
friction.
Cont aminat ion Basic s
3
Micrometer Scale
Particle s izes are generally measure d
on the m icrometer scale. One m icrom-
eter (or “micron”) is one-millionth of
one m ete r, or 39 millionths of an inch .
The limit of huma n visibility is app rox-
imately 40 micrometers. Keep in mind
that most dam age-causing particles in
hydraulic or lubrication systems are
smaller than 40 micrometers .
Therefore, they are microscopic and
cannot be seen by the un aided eye.
Typical HydraulicComponent Clearances
Microns 0.5
0.5-1
0.5-51-4
1-25
5-4018-63
50-250
130-450
ComponentAnti-friction bearings
Vane pump (vane tip to outer ring)
Gear pump (gear to side plate)
Servo valves (spool to sleeve)
Hydrostatic bearings
Piston pump (piston to bore)
Servo valves flapper wall
Actuators
Servo valves orifice
Relative Sizes of Particles
Inches.0039.0027
.0016
.0010
.0003
.0001
SubstanceGrain of table salt
Human hair
Lower limit of visibilityMilled flour
Red blood cells
Bacteria
Microns100
7040
25
82
7/27/2019 Manual Parker
http://slidepdf.com/reader/full/manual-parker 9/37
Particulate Contamination
Types
Part iculate cont amination is generally
classified as “silt” or “chips.” Silt can
be defined as th e accum ulation of
particles less than 5m over time . Thistype of contamination also causes
system component failure over time.
Chips on the other h and, are part icles
5m+ and can cause immediate
catastrophic failure. Both silt and
chips can be further classified as:
Contam inat ion Ty pes and Sour c es
4
Fi l t rat ion Fac tNew fluid is not necessarily
clean fluid. Typically, new
fluid right out of the drum is
not fit fo r use in hydraulic or
lubrication system s.
Fi l t rat ion Fac tAdditives in hydraulic fluid
are generally less than
1 micron and are unaffected
by standard filtration
methods.
Hard Particles
Silica
Carbon
Metal
Soft Particles
Rubber
Fibers
Micro organism
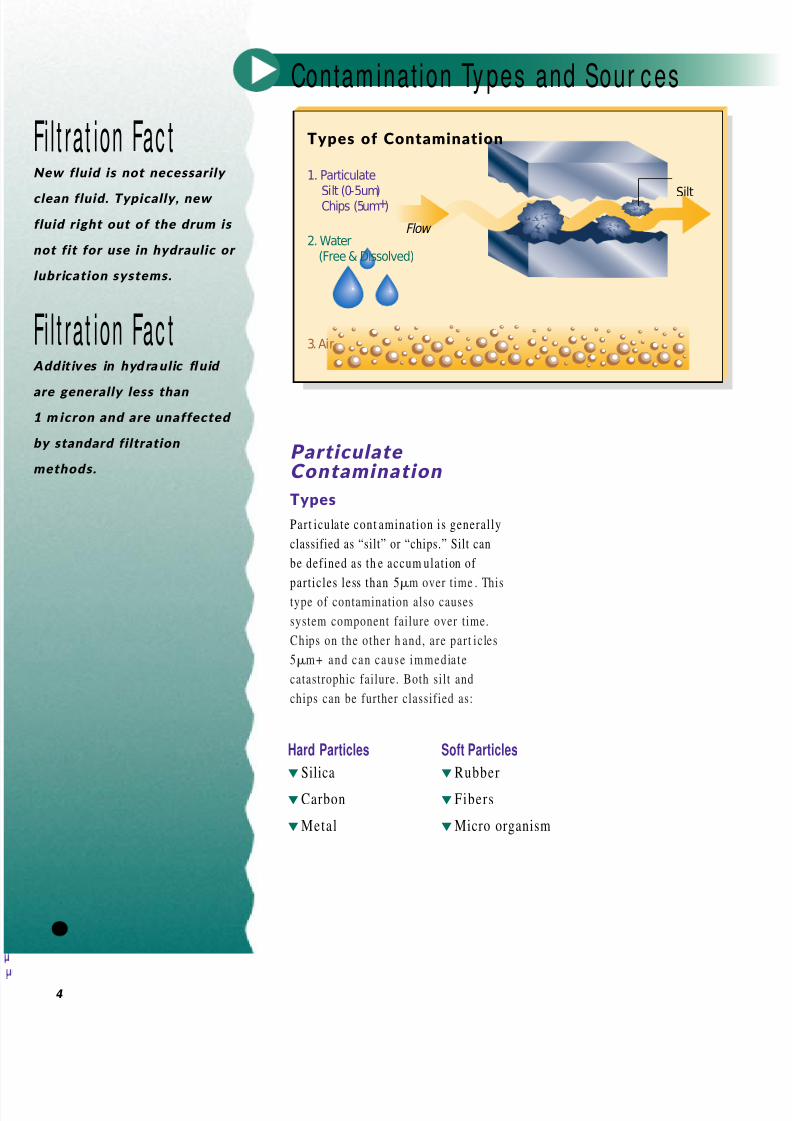
Flow
1. Particulate
Silt (0-5um) Chips (5um+)
Types of Contamination
2. Water (Free & Dissolved)
3. Air
Silt
7/27/2019 Manual Parker
http://slidepdf.com/reader/full/manual-parker 10/37
Damage
Sources
Built-in during manufacturing and
assembly processes.
Added with ne w fluid.
If not properly flushed, contaminants
from manufacturing and assembly wilbe left in the system.
These contam inants include dust,
welding slag, rubber p art icles from
hoses and seals, sand from castings,
and m etal debris from machine d com
ponen ts. Also, when fluid is initially
added t o the system, contaminat ion is
introduced.
During system operation, contamina-
tion enters through breather caps,
worn seals, and other system openings
System operation also gener ates inte r
nal contamination. This occurs as
component wear debris and chemical
byproducts react with componen t sur-
faces to generate m ore contamination
Cont aminat ion Types and Sour ces
5
Ingested from outside the system
during operation.
Intern ally generated during
operation (see chart below).
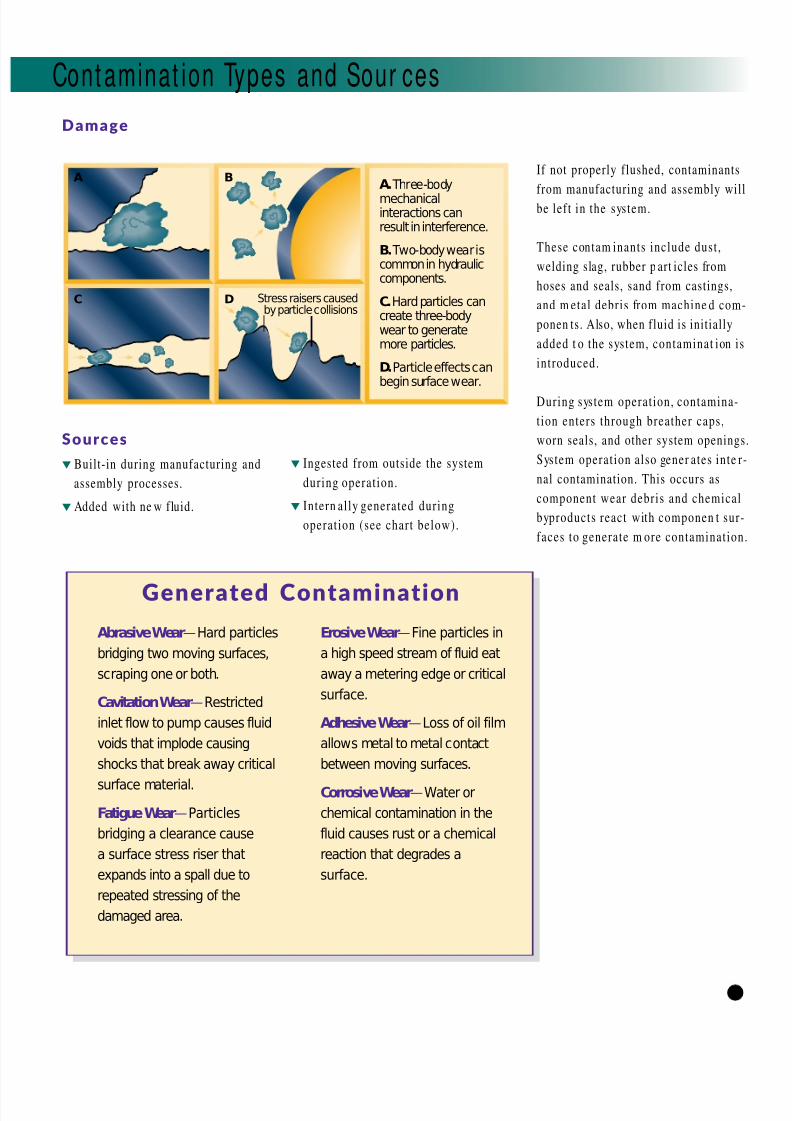
Stress raisers causedby particle collisions
A B
C D
A. Three-body
mechanicalinteractions canresult in interference.
B. Two-body wear iscommon in hydrauliccomponents.
C.Hard particles cancreate three-bodywear to generatemore particles.
D.Particle effects canbegin surface wear.
Abrasive Wear—Hard particles
bridging two moving surfaces,
scraping one or both.
Cavitation Wear—Restricted
inlet flow to pump causes fluid
voids that implode causing
shocks that break away critical
surface material.
Fatigue Wear—Particles
bridging a clearance cause
a surface stress riser that
expands into a spall due to
repeated stressing of the
damaged area.
Erosive Wear—Fine particles in
a high speed stream of fluid eat
away a metering edge or critical
surface.
Adhesive Wear—Loss of oil film
allows metal to metal contact
between moving surfaces.
Corrosive Wear—Water or
chemical contamination in the
fluid causes rust or a chemical
reaction that degrades a
surface.
Generated Contamination
7/27/2019 Manual Parker
http://slidepdf.com/reader/full/manual-parker 11/37
Contam inat ion Ty pes and Sour c es
6
Fi l t rat ion Fac tSystem C ontamination Warning Signals
• Solenoid burn-out.
• Valve spool decentering,
leakage, “chattering”.
• Pum p failure, loss of
flow, frequent
replacement.
• C ylinder leakage, scoring.
• Increased servo hysteresis.
Fi l t rat ion Fac tMost system ingression
enters a system through the
old-style reservoir breather
caps and the cylinder rod
glands .
Prevention
Use spin-on or dessicant style filter s for reser voir air brea the rs.
Flush all system s before initial start -up.
Specify rod wipers and replace worn actuator seals.
Cap off hoses and m anifolds during hand ling and mainte nance .
Filter all new fluid before it enters the reservoir.
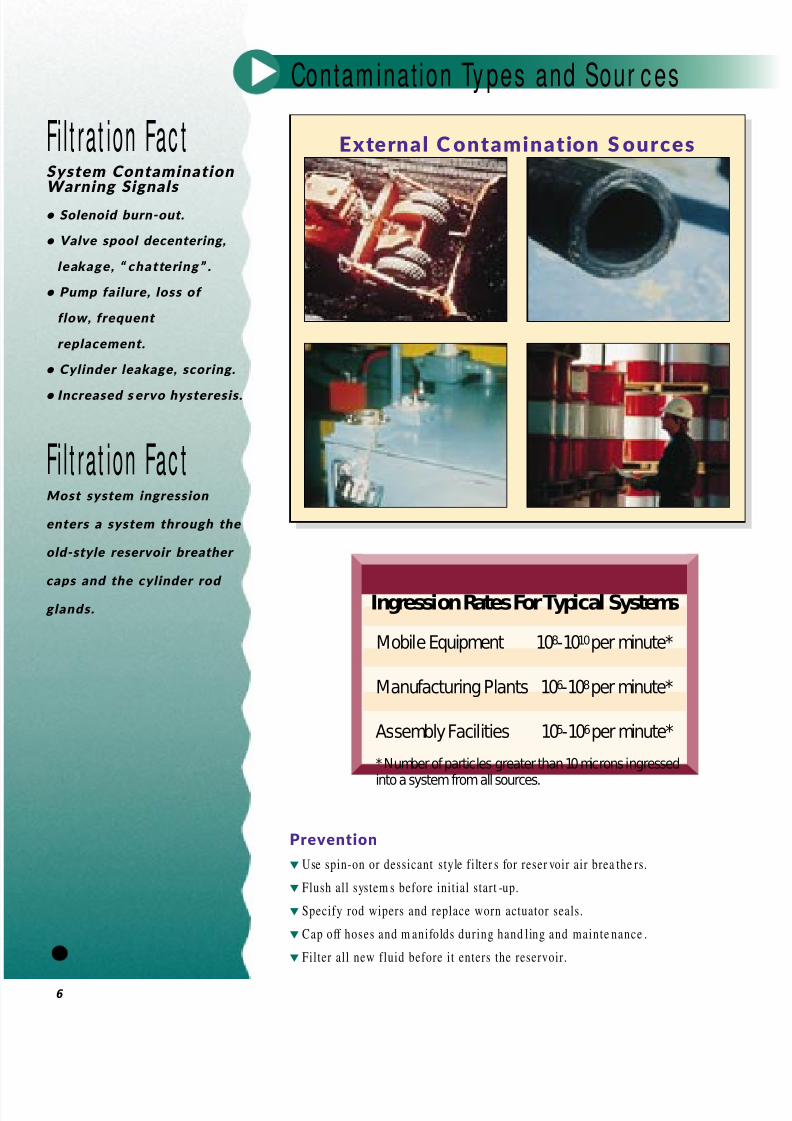
External Contamination Sources
Mobile Equipment 108-1010per minute*
Manufacturing Plants 106-108per minute*
Assembly Facilities 105-106per minute*
* Number of particles greater than 10 microns ingressed
into a system from all sources.
Ingression Rates For Typical Systems
7/27/2019 Manual Parker
http://slidepdf.com/reader/full/manual-parker 12/37
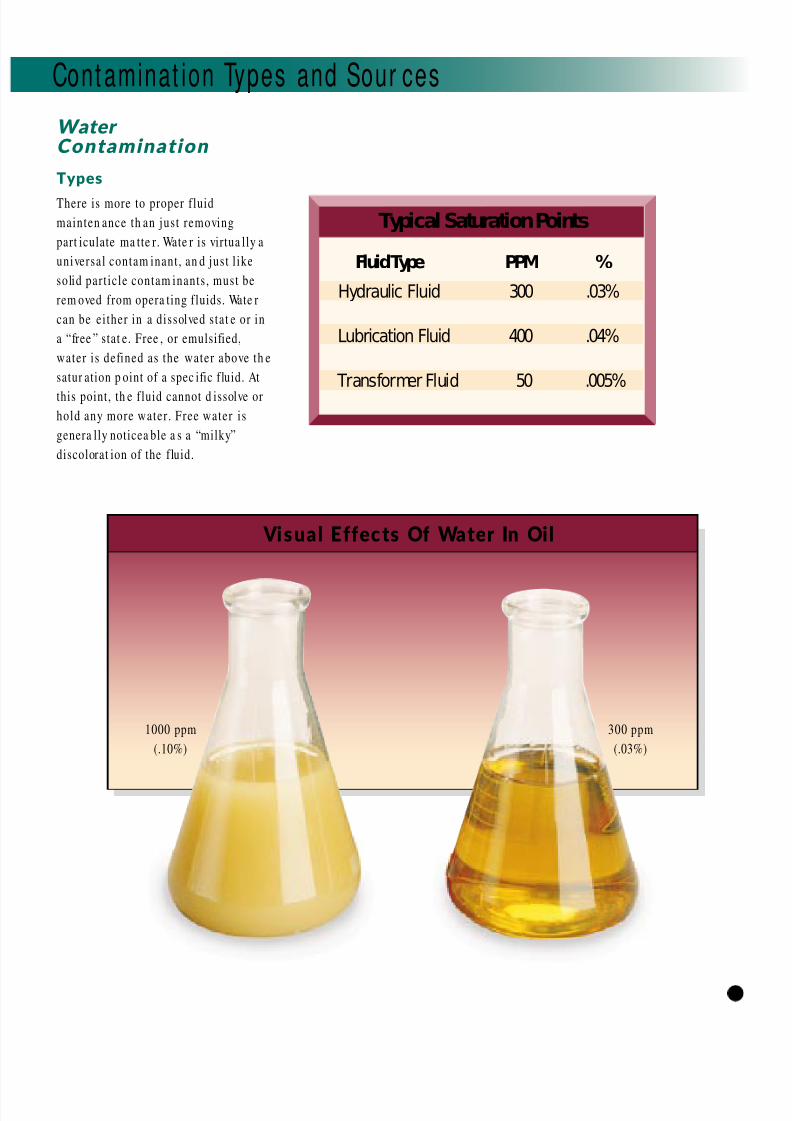
Water Contamination
Types
There is more to proper fluid
mainten ance th an just removing
part iculate ma tte r. Wate r is virtua lly a
universal contam inant, an d just l ike
solid particle contam inants , must be
rem oved from opera ting fluids. Wate r
can be either in a dissolved s tat e or in
a “free ” stat e. Free , or emulsified,
water is defined as the water above th e
satur ation p oint of a spec ific fluid. At
this point, th e fluid cannot d issolve or
hold any more water . Free water is
genera lly noticea ble a s a “milky”
discolorat ion of the fluid.
Cont aminat ion Types and Sour ces
7
50 PPM 2000 PPM
Typical Saturation Points
Hydraulic Fluid
Lubrication Fluid
Transformer Fluid
300
400
50
.03%
.04%
.005%
Fluid Type PPM %
1000 ppm
(.10%)
300 ppm
(.03%)
Visual Effects Of Water In Oil
7/27/2019 Manual Parker
http://slidepdf.com/reader/full/manual-parker 13/37
Damage
Corrosion of meta l surfaces
Accelerated abrasive wear
Bearing fatigue
Fluid additive breakdown
Viscosity varian ce
Increase in electr ical conduct ivity
Anti-wear a dditives bre ak down in the
presen ce of water and form a cids. The
combination of water, heat an d dissimilar
meta ls encourages galvanic action. Pitted
and corroded m etal surfaces and finishes
result. Further complications occur as
temperature drops and th e f luid has less
ability to hold wate r. As th e freezing point
is reached, ice crystals form, adversely
affecting t otal system function. Operating
functions may also become slowed or
erratic.
Electrical conductivity becomes a pro-
blem when water contamination weakens
the insulating properties of a fluid, thus
decreasing its dielectric kV stren gth.
Contam inat ion Ty pes and Sour c es
8
Fi l t rat ion Fac tA simple ‘crackle test’ will
tell you if there is free
w ater in your fluid. Apply a
flame under the container.
If bubbles rise and ‘crackle’
from the point of applied
heat, free water is present
in the fluid.
Fi l t rat ion Fac tHydraulic fluids have the
ability to ‘hold’ more water
as tem perature increases.
A cloudy fluid may bec ome
clearer as a system
heats up.
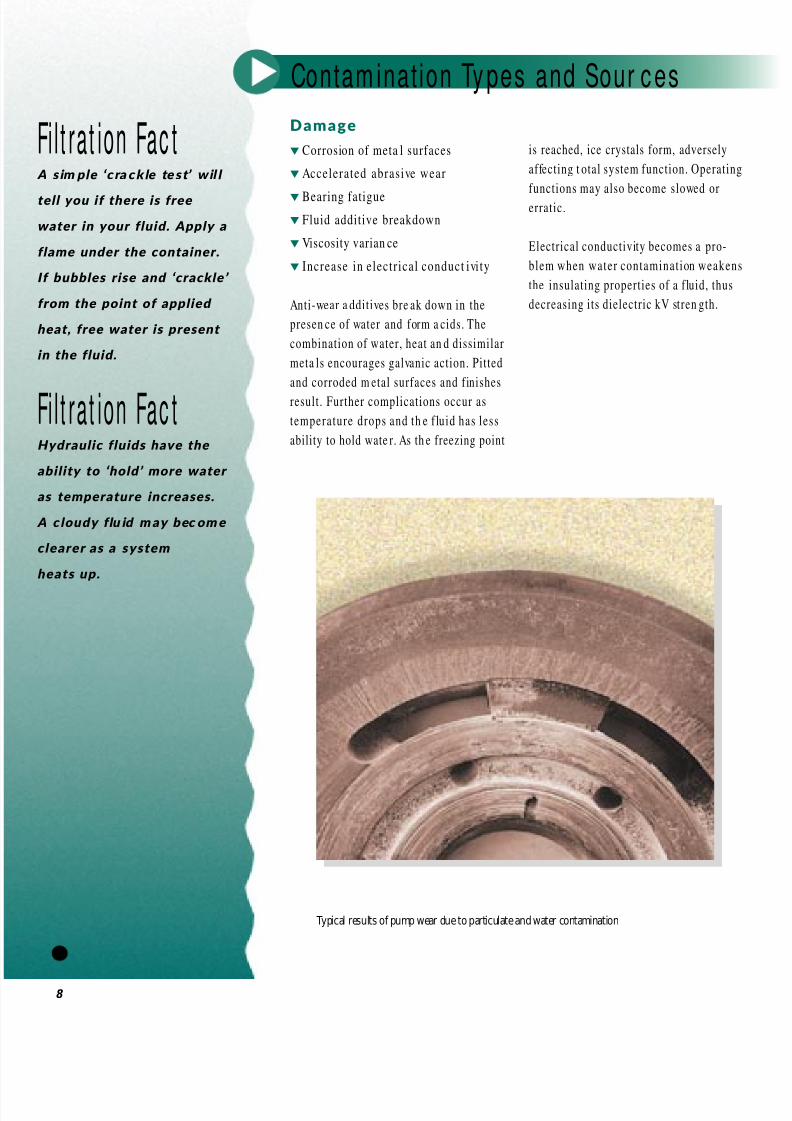
Typical results of pump wear due to particulate and water contamination
7/27/2019 Manual Parker
http://slidepdf.com/reader/full/manual-parker 14/37
Sources
Worn act uat or seals
Reservoir open ing leakage
Condensation
Heat exchanger leakage
Fluids are constantly exposed to water
and wate r vapor while being handled
and s tored. For instance, outdoor s tor-
age of tanks an d drum s is common.
Wate r m ay settle on t op of fluid con-
tainers and be drawn into the contain-
er during tem peratur e cha nges. Water
may also be introduced when opening
or filling these containers.
Water can e nter a system t hrough wo
cylinder or actuator seals or through
reser voir openings. Conden sation is
also a prime water source. As the flui
cool in a r eser voir or tank, wate r vapo
will condense on the inside surfaces,
causing rust or other corrosion
problems.
Cont aminat ion Types and Sour ces
9
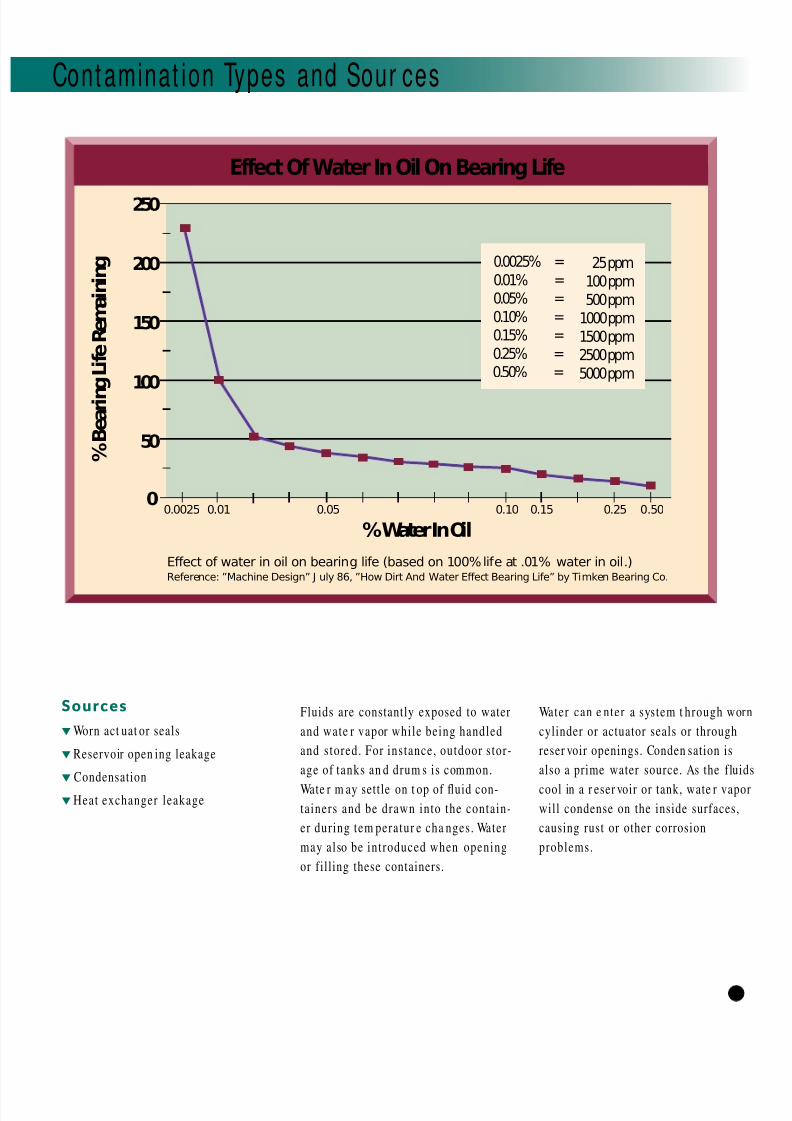
250
200
150
100
50
0
% Water In Oil0.0025
Effect of water in oil on bearing life (based on 100% life at .01% water in oil.)Reference: ”Machine Design” J uly 86, ”How Dirt And Water Effect Bearing Life” by Timken Bearing Co.
0.01 0.05 0.10 0.15 0.25 0.50
% B e a r i n g L i f e R e m a i n i n g
Effect Of Water In Oil On Bearing Life
0.0025%
0.01%
0.05%
0.10%
0.15%
0.25%
0.50%
=
=
=
=
=
=
=
25 ppm
100 ppm
500 ppm
1000 ppm
1500 ppm
2500 ppm
5000 ppm
7/27/2019 Manual Parker
http://slidepdf.com/reader/full/manual-parker 15/37
Prevention
Excessive wat er c an usually be
removed from a system. The same pre-
venta tive m easures t aken to minimizeparticulate contaminat ion ingression
in a system ca n be a pplied to water
conta mina tion. However, once exces-
sive water is detected, it can usually
be e liminate d by one of the following
methods:
Absorption
This is accomplished by filter elements
that are designed specifically to take
out free wate r. They usually consist of a
laminant-type ma terial that transforms
free water into a gel that is trapped
within th e elemen t. These eleme nts f it
into s tandard fi lter h ousings and are
gener ally used whe n sma ll volumes of
water are involved.
Centrifugation
Separates water from oil by a spinning
motion. This met hod is also only
effect ive with free wat er, but for larger
volumes.
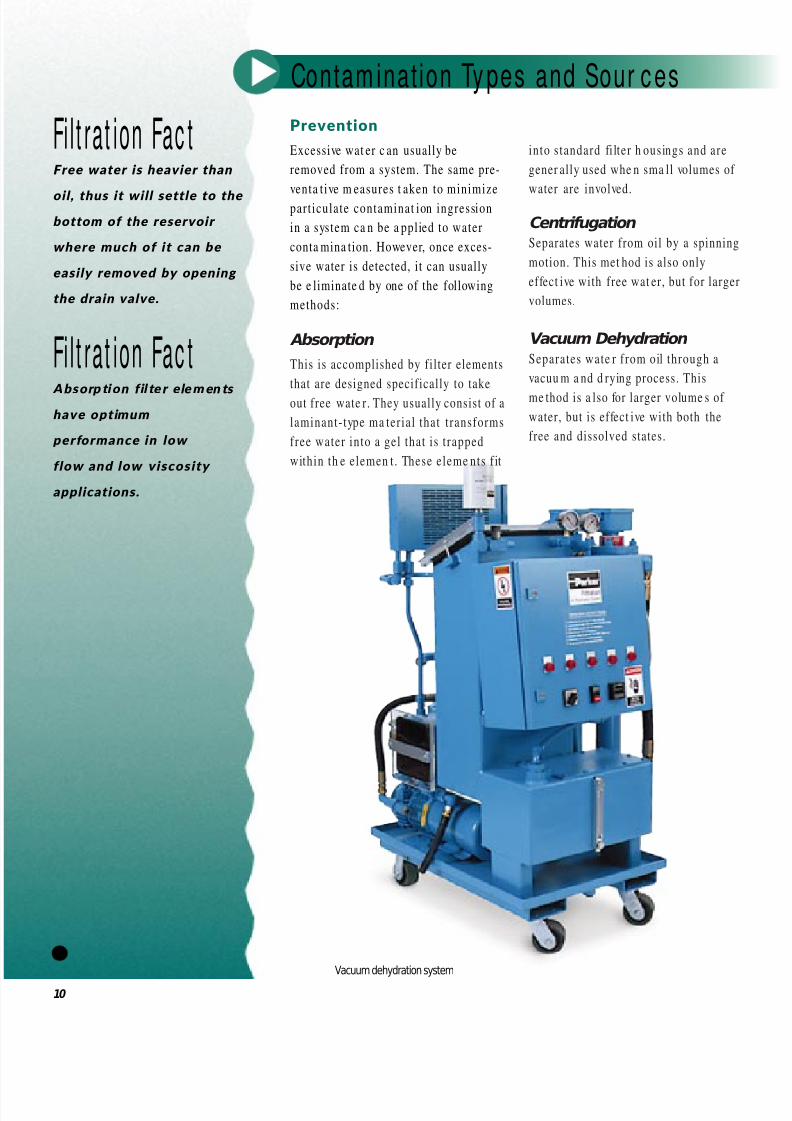
Vacuum Dehydration
Separates wate r from oil through a
vacuu m a nd d rying process. This
me thod is a lso for larger volume s of
water, but is effect ive with both the
free and dissolved states.
Contam inat ion Ty pes and Sour c es
10
Fi l t rat ion Fac tFree water is heavier than
oil, thus it will settle to the
bottom of the reservoir
w here much of it can be
easily remo ved by o pening
the drain valve.
Fi l t rat ion Fac tAbsorption f ilter elements
have optimum
performance in low
flow and low viscosity
applications.
Vacuum dehydration system
7/27/2019 Manual Parker
http://slidepdf.com/reader/full/manual-parker 16/37
Air Contamination
Types
Air in a liquid system ca n e xist in
either a dissolved or en trained ( undis-
solved, or free) stat e. Dissolved a ir ma y
not p ose a pr oblem, providing it stays
in solution. When a liquid conta ins
undissolved air, problems can occu r as
it passes through system components .
There can be pressure changes that
compress the air an d produce a large
amount of heat in small air bubbles .
This heat can destroy additives, and
the base fluid itself.
If the amount of dissolved air becomes
high en ough, it will have a ne gative
effect on the amount of work
performed by the system. The work
performed in a hydraulic system relies
on th e fluid being relat ively incom-
pressible, but air redu ces the bulk
modulus of the fluid. This is due t o the
fact that air is up to 20,000 times more
compressible th an a l iquid in which it
is dissolved. When a ir is prese nt , a
pump e nds up doing more work to
compre ss the air, and less useful work
on the system. In this s ituation, the
system is said t o be ‘spon gy’.
Damage
Loss of transmitted power
Reduced pump output
Loss of lubrication
Increased operating temperature
Reservoir fluid foam ing
Chemical reactions
Air in an y form is a p oten tial source of
oxidat ion in liquids. This accelera tes
corrosion of metal parts, particularly
when water is also present. Oxidation
of additives also may occur. Both
processes produce oxides which pro-
mote the format ion of particulates , or
form a sludge in th e liquid. Wear and
interference increases if oxidation
debris is not prevented or removed.
Sources
System leaks
Pump aera t ion
Reservoir fluid tur bulen ce
Prevention
System air bleeds
Flooded suction p ump
Proper reservoir design
Return line diffusers
Cont aminat ion Types and Sour ces
11

7/27/2019 Manual Parker
http://slidepdf.com/reader/full/manual-parker 17/37
In order to detect or correct problems,
a contam ination reference scale is
used. Particle counting is the m ost
common me thod to der ive cleanliness
level st and ards. Very sen sitive optical
instruments are used to count the
num ber of part icles in various size
ranges. These counts are reported as
the nu mber of particles greate r than a
certain size found in a specified
volum e of fluid.
The ISO 4406 (Int ernat ional Standards
Organization) cleanliness level stan-
dard ha s gained wide acceptance in
most industries today. A widely-used
modified version of this sta nda rd re fer-
ences th e numb er of particles greate r
than 2, 5, and 15 micrometer s* in a
known volume, usually 1 milliliter or
100 milliliters. The num ber of 2+ a nd
5+ m icromete r particles is used as a
refere nce point for “silt” part icles. The
15+ size range indicates the qua ntity
of larger part icles presen t which con-
tribute greatly to possible catastrophic
component failure.
Fluid Cleanl iness St andar ds
12
Fi l t rat ion Fac tKnowing the cleanliness
level of a fluid is the basis
for contamination control
measures.
Fi l t rat ion Fac tThe ISO code index
numbers can never
increase as the particle
sizes increase
(Exam ple: 18 /20 /22 ).
*The ISO codes described here are for the 2, 5, 15 micron format. A 5, 15 micron format which currently meets the ISO standard, maystill be used in some publications (Example: an ISO code of 16/13 would reference particles in the 5 +and 15 +micron ranges only).
An ISO classification of 18/16/13 can be defined as:
Particles>2 microns
Particles>5 microns
Particles>15 microns
ISO CODE 18 / 16 / 13
18
16
13
2+
5+
15+
1,300 - 2,500
320 - 640
40 - 80
Range Number Micron Actual Particle Count Range (per ml)
7/27/2019 Manual Parker
http://slidepdf.com/reader/full/manual-parker 18/3713
Fluid Cleanl iness St andar ds
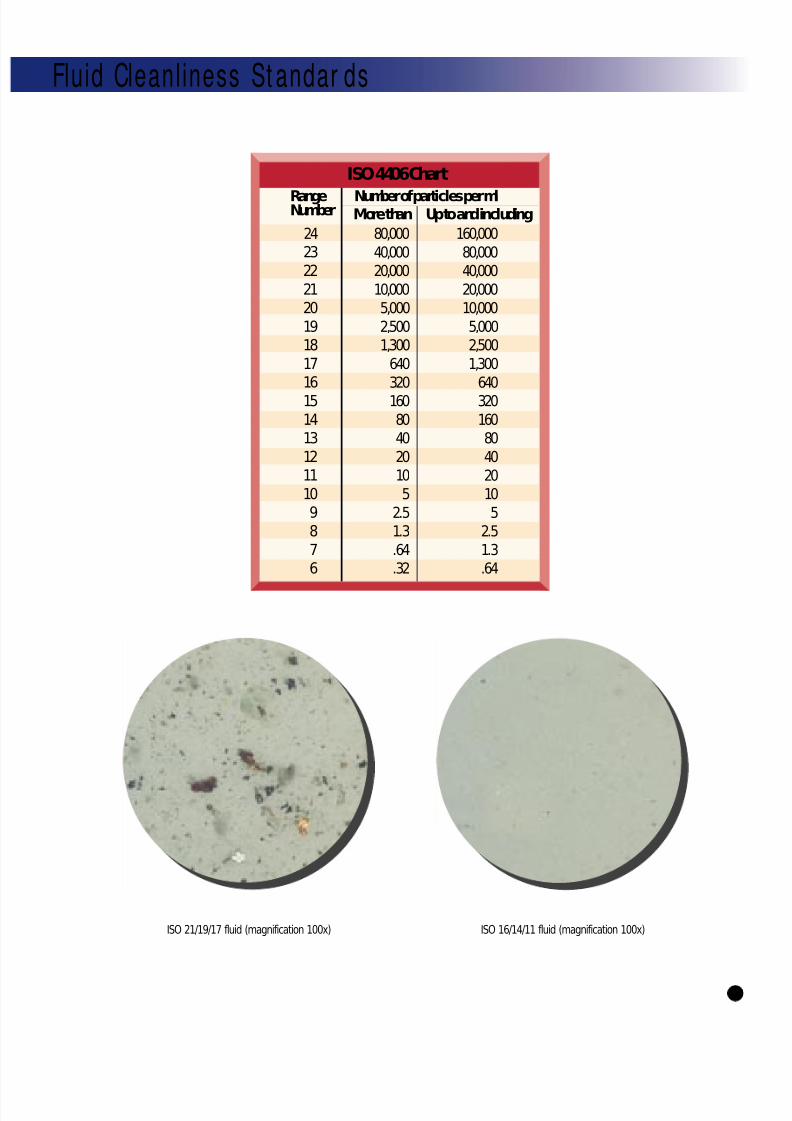
ISO 16/14/11 fluid (magnification 100x)ISO 21/19/17 fluid (magnification 100x)
ISO 4406 Chart
24
23
22
2120
1918
1716
15
1413
1211
109
8
76
RangeNumber More than Up to and including
Number of particles per ml
80,000
40,000
20,000
10,000
5,000
2,500
1,300
640
320
160
80
40
20
10
5
2.5
1.3
.64
.32
160,000
80,000
40,000
20,000
10,000
5,000
2,500
1,300
640
320
160
80
40
20
10
5
2.5
1.3
.64
7/27/2019 Manual Parker
http://slidepdf.com/reader/full/manual-parker 19/37
Component Cleanliness
Level Requirements
Many manufacturers of hydraulic and
load bearing equipmen t specify theoptimum cleanliness level required for
their components . Subjecting compo-
nent s to f luid with h igher cont amina-
tion levels may result in much shorter
component l ife.
In th e ta ble below, a few component s
and their recommended cleanliness
levels are shown. It is always best to
consult with component ma nufacturers
and obtain th eir written f luid cleanli-
ness level recommendations. This
information is needed in order to
select t he p roper level of filtrat ion.
It m ay also prove u seful for an y
subsequent warranty
claims, as it may draw
the line between nor-
mal use and excessive
or abusive operation.
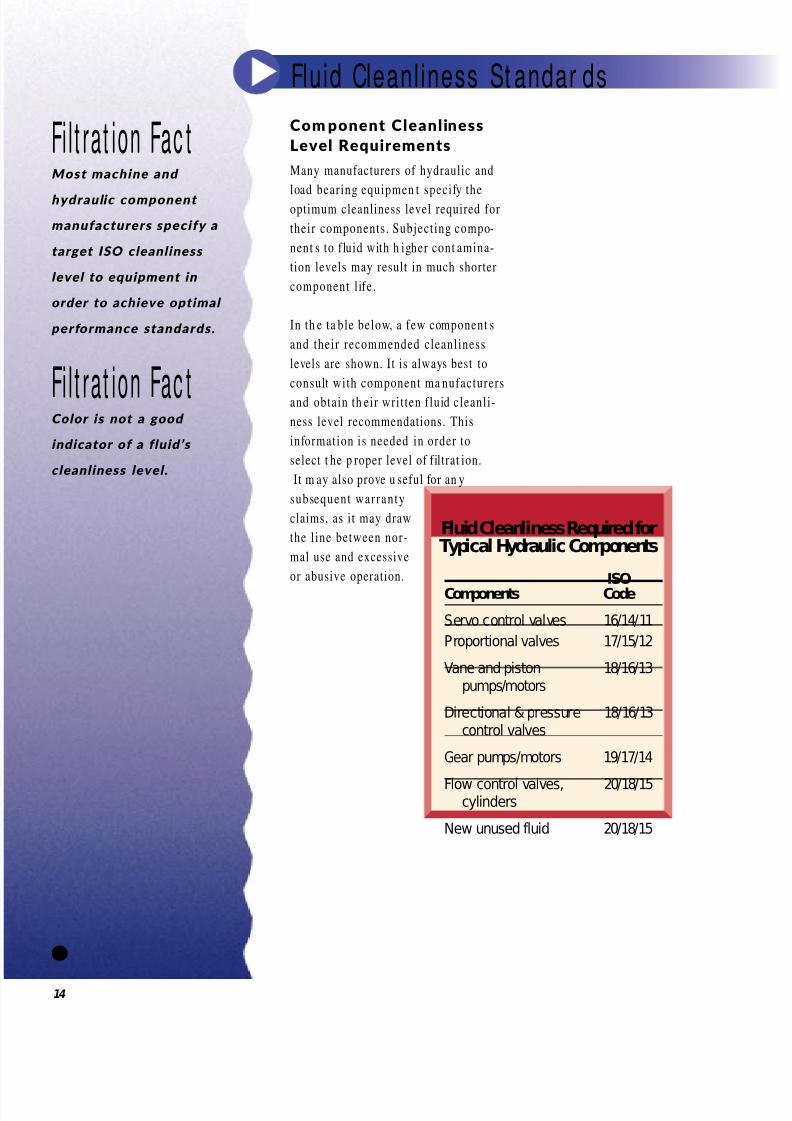
Fluid Cleanliness Required forTypical Hydraulic Components
Fluid Cleanl iness St andar ds
14
ISOComponents Code
Servo control valves 16/14/11
Proportional valves 17/15/12
Vane and piston 18/16/13pumps/motors
Directional & pressure 18/16/13control valves
Gear pumps/motors 19/17/14
Flow control valves, 20/18/15cylinders
New unused fluid 20/18/15
Fi l t rat ion Fac tMost machine and
hydraulic component
manufacturers specify a
target ISO cleanliness
level to equipment in
order to achieve optimal
performance standards.
Fi l t rat ion Fac tColor is not a good
indicator of a fluid’s
cleanliness level.
7/27/2019 Manual Parker
http://slidepdf.com/reader/full/manual-parker 20/37
Fluid Cleanl iness St andar ds
15
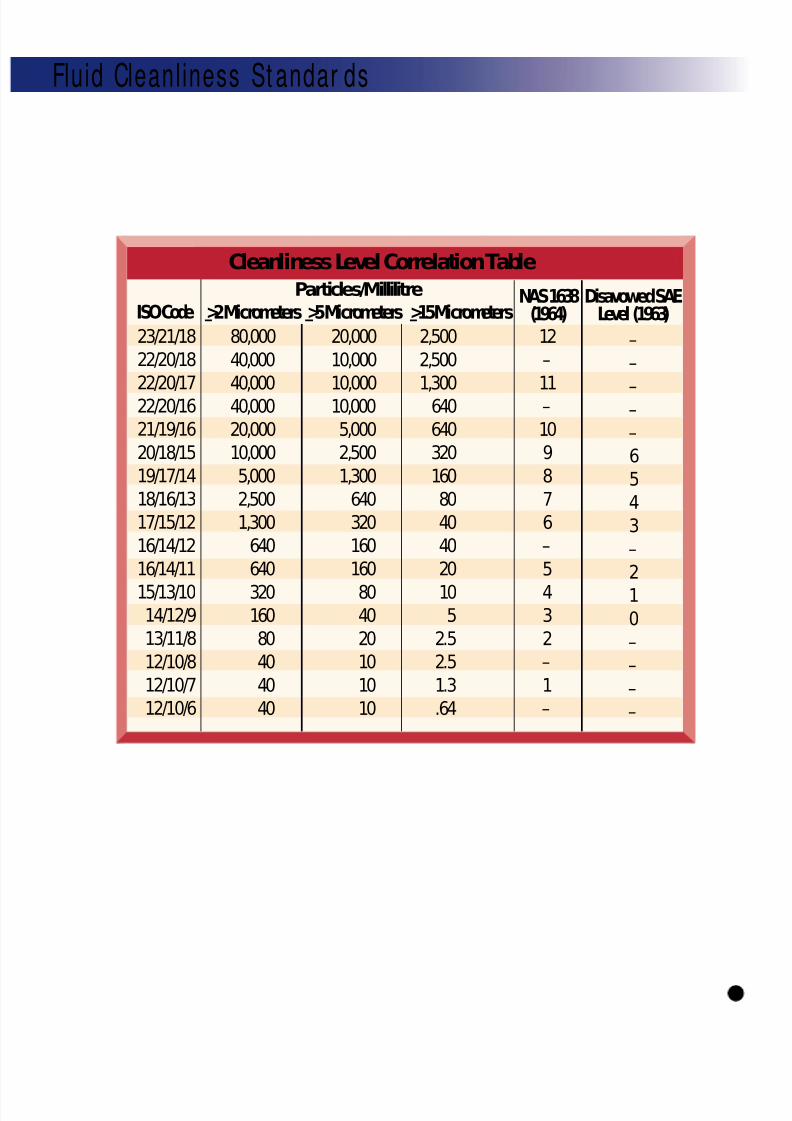
Cleanliness Level Correlation Table
23/21/18
22/20/18
22/20/1722/20/16
21/19/16
20/18/15
19/17/14
18/16/13
17/15/12
16/14/12
16/14/11
15/13/1014/12/9
13/11/8
12/10/8
12/10/7
12/10/6
ISO Code >2 Micrometers
Particles/Millilitre
80,000
40,000
40,00040,000
20,000
10,000
5,000
2,500
1,300
640
640
320160
80
40
40
40
>5 Micrometers
20,000
10,000
10,00010,000
5,000
2,500
1,300
640
320
160
160
8040
20
10
10
10
NAS 1638(1964)
Disavowed SAELevel (1963)>15 Micrometers
2,500
2,500
1,300640
640
320
160
80
40
40
20
105
2.5
2.5
1.3
.64
12
–
11–
10
9
8
7
6
–
5
43
2
–
1
–
–
–
––
–
6
5
4
3
–
2
10
–
–
–
–
7/27/2019 Manual Parker
http://slidepdf.com/reader/full/manual-parker 21/37
The fi lter media i s that part of
the element which removes the
contaminant.
Media usually start s out in sheet form,
and is then pleated to expose more sur-
face are a t o the fluid flow. This redu ces
pressure differential while increasing
dirt h olding capa city. In some case s,
the filter media may have multiple
layers an d mesh backing to achieve
certain performance criteria. After
being pleated a nd cut to th e proper
length, the two ends are fastened
togethe r using a special clip, adhesive,
or other seam ing mechanism. The m ostcommon me dia include wire m esh,
cellulose, fiberglass composites, or
other synthe tic mat erials. Filter media
is genera lly classified as eithe r sur face
or depth.
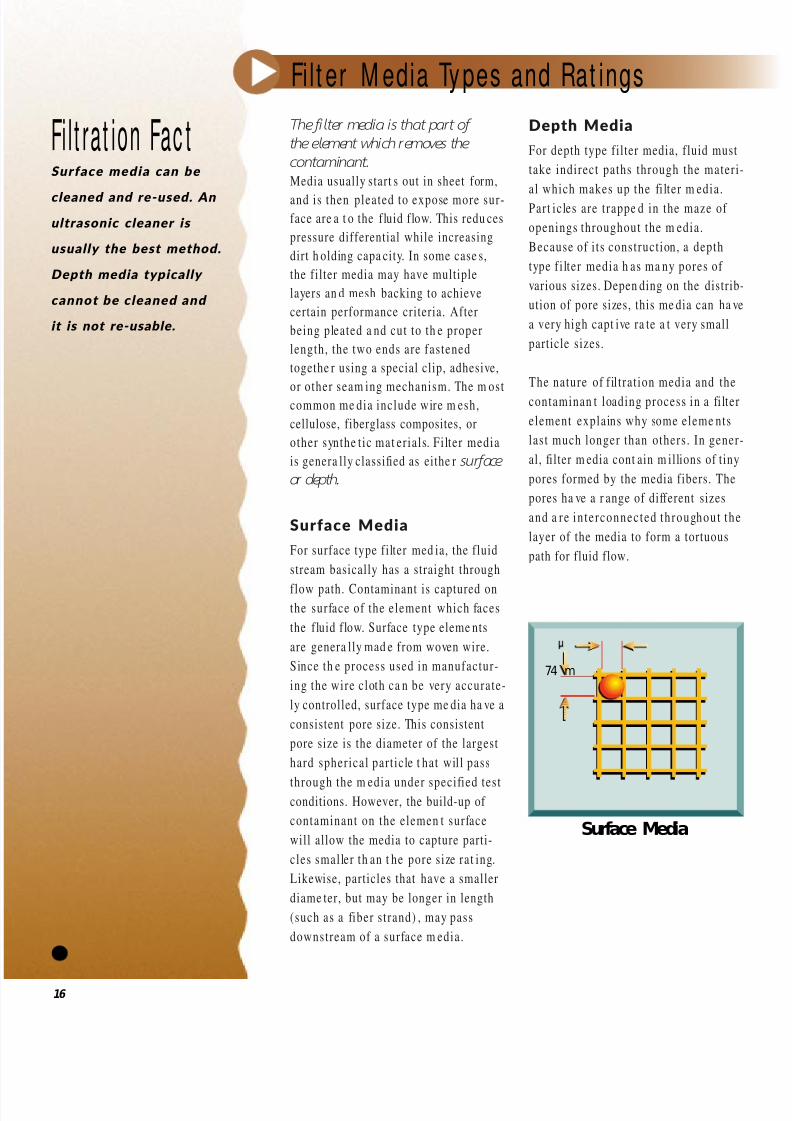
Surface Media
For surface type filter med ia, the fluid
stream basically has a straight through
flow path. Contaminant is captured onthe surface of the element which faces
the fluid flow. Surface type eleme nts
are genera lly mad e from woven wire.
Since th e process used in manufactur-
ing the wire cloth ca n be very accurate-
ly controlled, surface type me dia ha ve a
consistent pore size. This consistent
pore size is the diameter of the largest
hard spherical particle t hat will pass
through the m edia under specified testconditions. However, the build-up of
contaminant on the elemen t surface
will allow the media to capture parti-
cles smaller th an t he pore s ize rat ing.
Likewise, particles that have a smaller
diame ter, but may be longer in length
(such as a fiber s trand) , may pass
downstream of a surface m edia.
Depth Media
For depth type filter media, fluid must
take indirect paths through the materi-
al which makes up the fi lter m edia.Part icles are trappe d in the maze of
openings throughout the m edia.
Because of i ts construction, a depth
type f i lter media h as ma ny pores of
various sizes. Depen ding on the distrib-
ution of pore sizes, this me dia can ha ve
a very high capt ive ra te a t very small
particle sizes.
The nature of f il tration media and the
contaminan t loading process in a fi lter
element explains why some eleme nts
last much longer than others . In gener-
al, filter m edia cont ain m illions of tiny
pores formed by the media fibers. The
pores ha ve a r ange of different sizes
and a re in terconnected throughout the
layer of the media to form a tortuous
path for fluid flow.
Fil t er M edia Ty pes and Rat ings
16
Fi l t rat ion Fac tSurface media can be
cleaned and re-used. An
ultrasonic cleaner is
usually the best m ethod.
Depth m edia typically
cannot be cleaned and
it is not re-usable.
Surface Media
74 m
7/27/2019 Manual Parker
http://slidepdf.com/reader/full/manual-parker 22/37
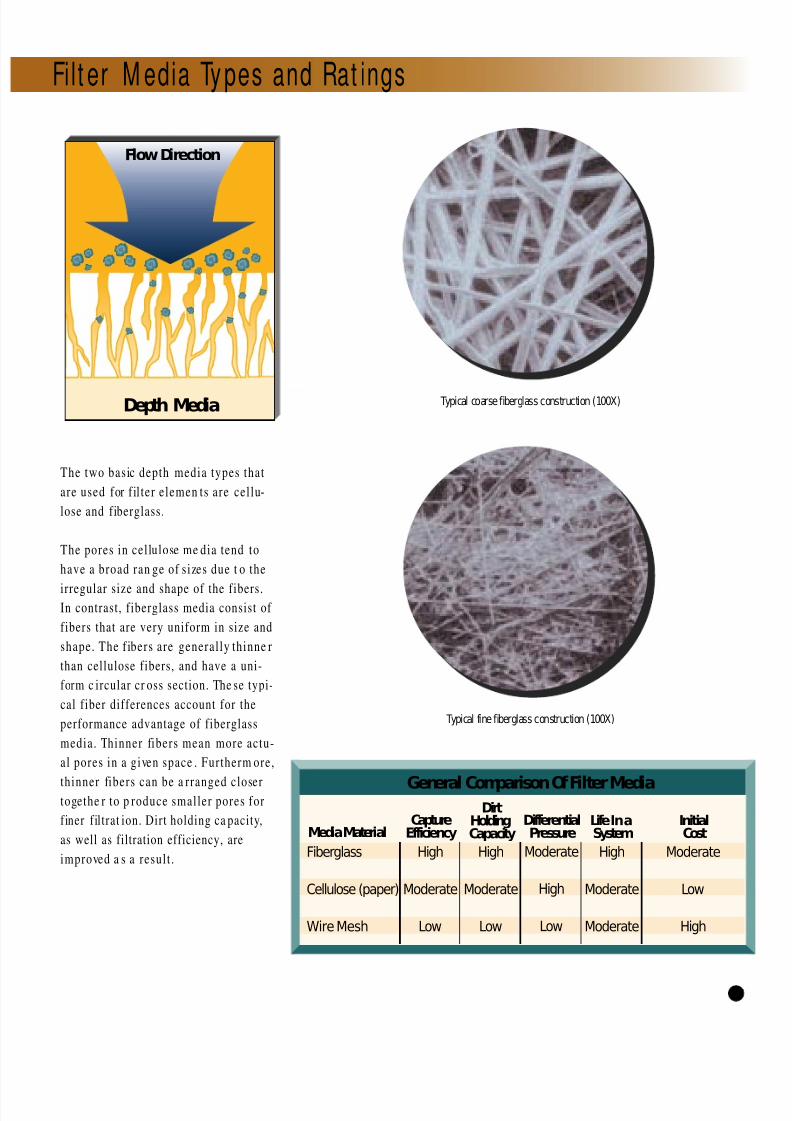
The two basic depth media types that
are used for f il ter elemen ts are cellu-
lose and fiberglass.
The pores in cellulose me dia tend to
have a broad ran ge of s izes due t o the
irregular size and shape of the fibers.In contrast, fiberglass media consist of
fibers that are very uniform in size and
shape. The f ibers are generally thinne r
than cellulose fibers, and have a uni-
form c ircular cr oss section. The se typi-
cal fiber differences account for the
performance advantage of fiberglass
media. Thinner fibers mean more actu-
al pores in a given space . Furtherm ore,
thinner fibers can be a rranged closertogethe r to p roduce smaller pores for
finer filtrat ion. Dirt holding ca pacity,
as well as filtration efficiency, are
improved a s a result .
Fil t er M edia Ty pes and Rat ings
17
Flow Direction
Depth Media
General Comparison Of Filter Media
Media Material
DirtHoldingCapacity
Life In aSystem
InitialCost
Fiberglass
Cellulose (paper)
Wire Mesh
High
Moderate
Low
DifferentialPressure
Moderate
High
Low
High
Moderate
Moderate
Moderate
Low
High
CaptureEfficiency
High
Moderate
Low
Typical coarse fiberglass construction (100X)
Typical fine fiberglass construction (100X)
7/27/2019 Manual Parker
http://slidepdf.com/reader/full/manual-parker 23/37
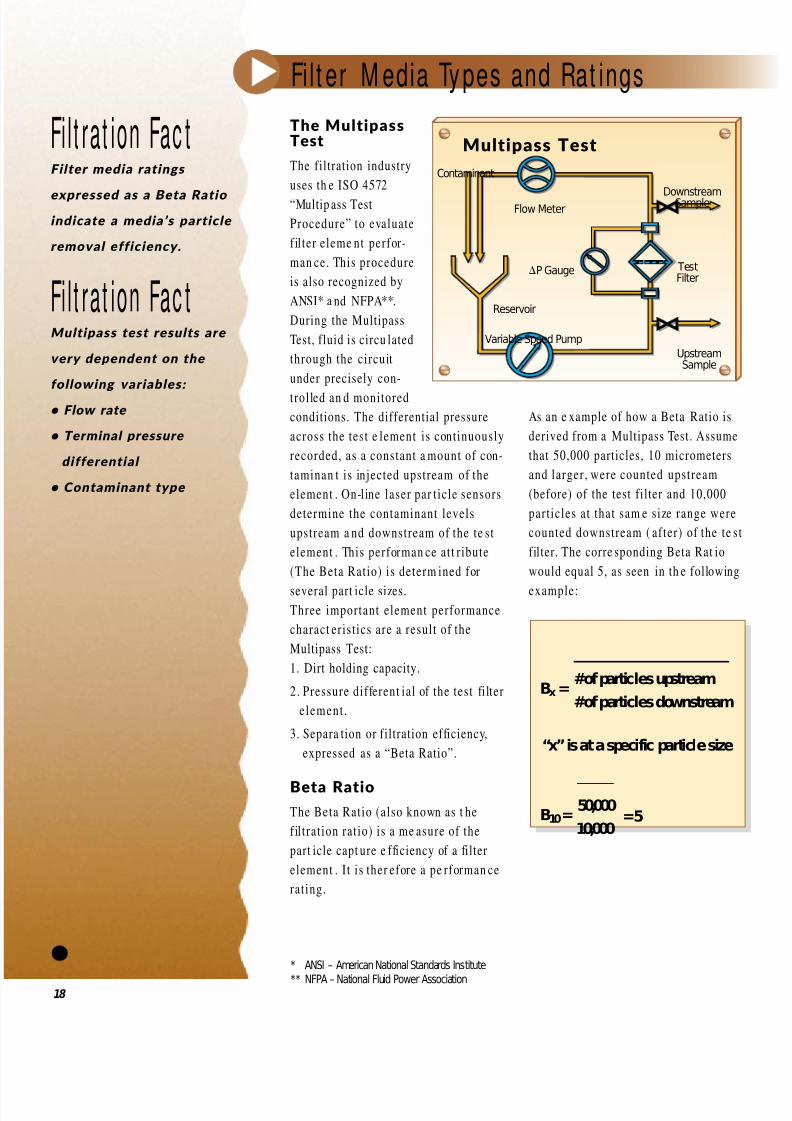
The MultipassTest
The filtration industry
uses th e ISO 4572
“Multip ass Test
Procedure” to evaluate
fil ter eleme nt perfor-
man ce. This procedure
is also recognized by
ANSI* a nd NFPA**.
During the Multipass
Test, fluid is circu lated
through the circuit
under precisely con-
trolled an d monitored
conditions. The differential pressure
across the test e lement is continuously
recorded, as a constant a mount of con-
taminan t is injected upstream of the
element . On-line laser par ticle sensors
determine the contaminant levels
upstream a nd downstream of the te st
element . This performan ce att r ibute
(The Beta Ratio) is determ ined for
several part icle sizes.Three important element performance
charact eris tics are a result of the
Multipass Test:
1. Dirt holding capacity.
2. Pressure different ial of the test fi lter
e lement .
3. Separa tion or filtration efficiency,
expressed as a “Beta Ratio”.
Beta RatioThe Beta Ratio (also known as t he
fil tration ratio) is a me asure of the
part icle capt ure e fficiency of a filter
element . I t is ther efore a pe rforman ce
rating.
As an e xample of how a Beta Ratio is
derived from a Multipass Test. Assume
that 50,000 particles, 10 micrometers
and larger, were counted upstream
(before) of the test filter and 10,000
particles at that sam e size range were
counted downstream ( after) of the te st
filter. The corre sponding Beta Rat io
would equal 5, as seen in th e following
example:
Fil t er M edia Ty pes and Rat ings
18
Flow MeterDownstreamSample
UpstreamSample
TestFilter
P Gauge
Reservoir
Contaminant
Variable Speed Pump
Multipass Test Fi l t rat ion Fac tFilter media ratings
expressed as a Beta Ratio
indicate a media’s particle
removal efficiency.
Fi l t rat ion Fac tMultipass test results are
very dependent on the
following variables:
• Flow rate
• Terminal pressure
differential
• C ontaminant type
#of particles upstream
#of particles downstream
“x” is at a specific particle size
50,000
10,000=5
Bx=
B10=
* ANSI – American National Standards Institute
** NFPA – National Fluid Power Association
7/27/2019 Manual Parker
http://slidepdf.com/reader/full/manual-parker 24/37
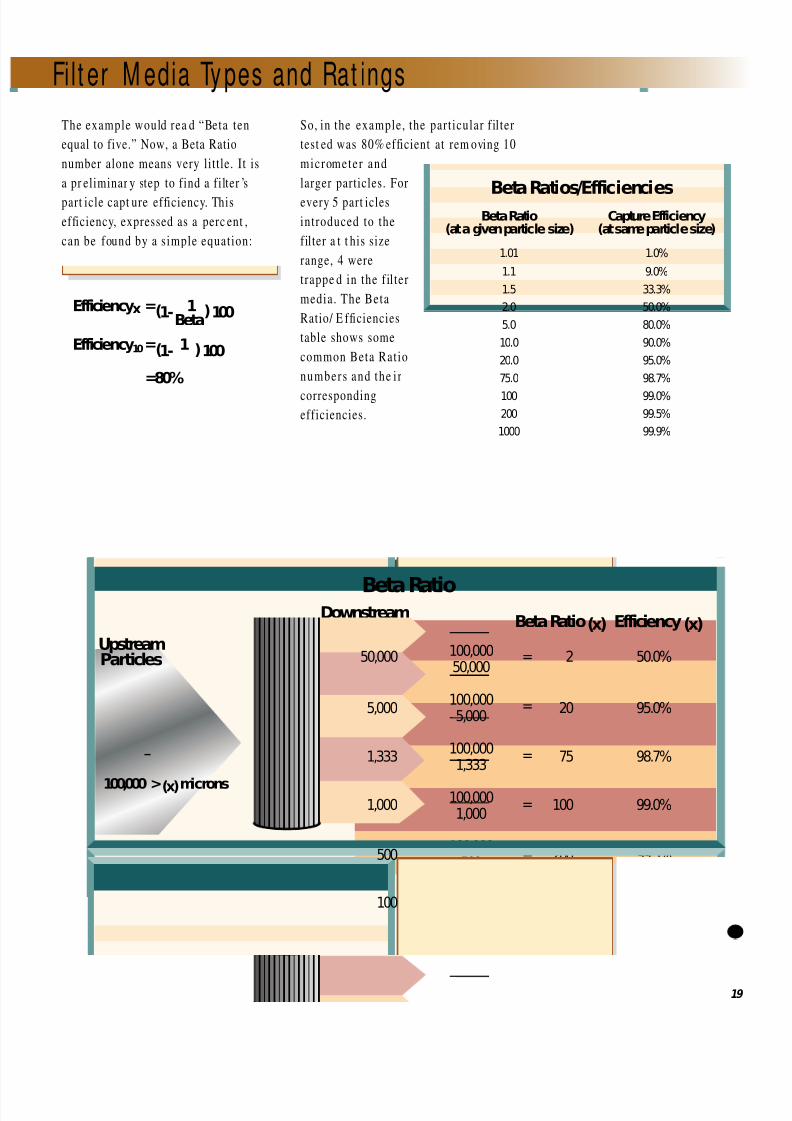
The example would rea d “Beta ten
equal to five.” Now, a Beta Ratio
number alone means very little. It is
a pr eliminar y step to find a filter ’s
part icle capt ure efficiency. This
efficiency, expressed as a perc ent ,
can be found by a s imple equation:
So, in the example, the particular f il ter
test ed was 80% efficient at rem oving 10
micrometer and
larger particles. For
every 5 part icles
introduced to the
filter a t t his size
range, 4 were
trappe d in the f il ter
media. The Beta
Ratio/ E fficiencies
table shows some
common Beta Ratio
numbers and the i r
corresponding
efficiencies.
Fil t er M edia Ty pes and Rat ings
19
Beta RatioDownstream
ParticlesUpstreamParticles
100,000 >(x) microns
Beta Ratio(x) Efficiency(x)
100,00050,000
100,0005,000
100,0001,333
100,0001,000
100,000500
100,000100
=
=
=
=
=
=
2
20
75
100
200
1000
50.0%
95.0%
98.7%
99.0%
99.5%
99.9%
50,000
5,000
1,333
1,000
500
100
Beta Ratios/EfficienciesBeta Ratio Capture Efficiency
(at a given particle size) (at same particle size)
1.01 1.0%
1.1 9.0%
1.5 33.3%
2.0 50.0%
5.0 80.0%
10.0 90.0%
20.0 95.0%
75.0 98.7%
100 99.0%
200 99.5%
1000 99.9%
Efficiencyx =(1- 1 )100Beta
Efficiency10=(1- 1 )100
=80%
7/27/2019 Manual Parker
http://slidepdf.com/reader/full/manual-parker 25/37
A number of interrelated system
factors combine to determ ine proper
media and filter combinations. To accu-
rately determine which combinat ion isideal for your system all the se factors
need to be accounted for. With the
developmen t of filtrat ion sizing soft-
ware such as inPHorm, this information
can be used to compute the optimal
selection.However, in many instances
the information available may be
limited. In these cases “rules of
thum b”, based on empirical data and
proven examples, are applied to try
and get an init ial s tarting point.
The cha rts on t he following pages
are designed for just those instances.
Be aware th at rules of thumb u til ize
“stan dard ” values whe n looking at com-
ponents, ingressions, and other system
para met ers. Your specific system m ay
or may not fit into this “standa rd”
classification.
One of the more important points of
the cha rts is to emphasize element
efficiency. Note tha t as less efficient
element s are ut ilized, more passes are
required to obtain th e same ISO
clean liness level as a m ore efficient
element . Secondly, the charts indicate
the effect of system pressure on the
requ ired ISO code. As system pressur eincreases, the oil film thickness
between component parts decreases .
This reduction in clearance allows
smaller micron particles to ha ve
harm ful effects .The charts at temp t to
provide flexibility by providing several
possible solutions for each compo-
nent /system pressure combinat ion.
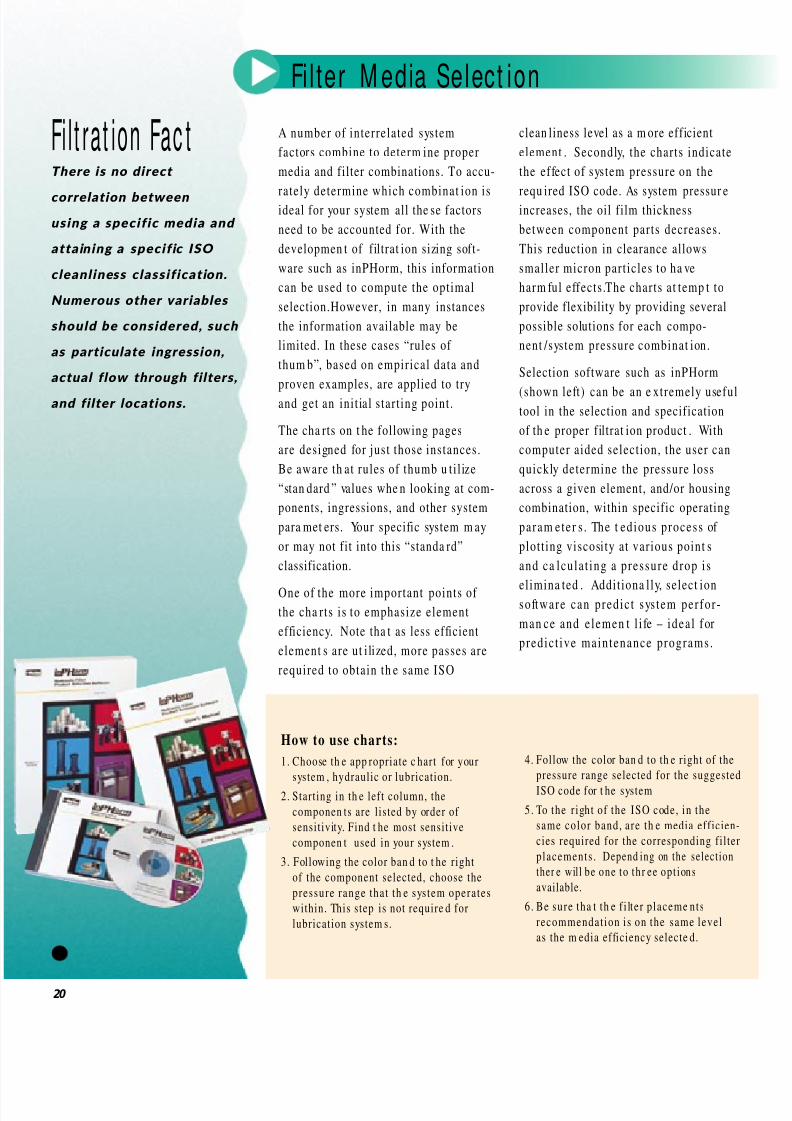
Selection software such as inPHorm
(shown left) can be an e xtremely usefultool in the selection and specification
of th e proper filtrat ion product . With
computer aided selection, the user can
quickly determine the pressure loss
across a given element, and/or housing
combination, within specific operating
param eter s . The t ed ious process of
plotting viscosity at various point s
and ca lcu la t ing a pressure drop is
elimina ted . Additiona lly, select ionsoftware can predic t sys tem per for -
man ce and e lemen t l i fe – ideal for
predic t ive main tenance programs .
Fi l ter M edia Select ion
20
Fi l t rat ion Fac tThere is no direct
correlation between
using a specific media and
attaining a specific ISO
cleanliness classification.
Numerous other variables
should be co nsidered, such
as particulate ingression,
actual flow through filters,
and filter locations.
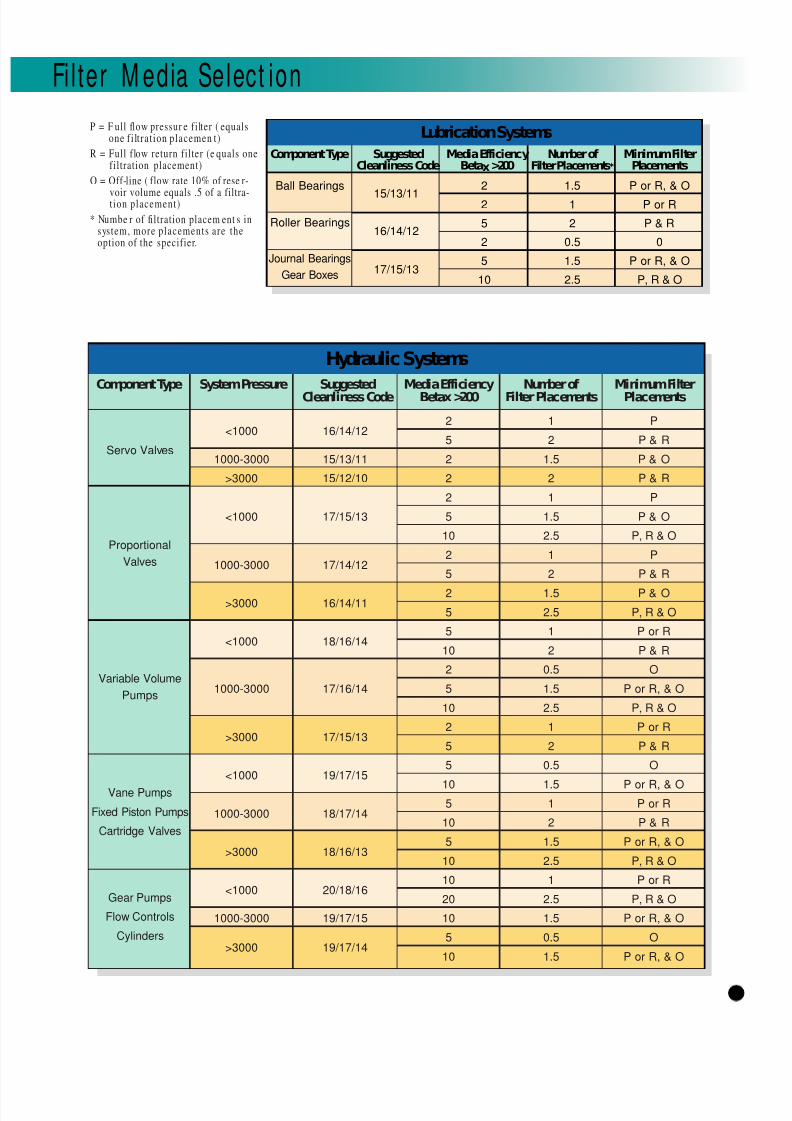
How to use charts:
1. Choose th e app ropriate c hart for your
system , hydraulic or lubrication.
2. Starting in th e left column, the
componen ts are listed by order of
sensitivity. Find t he most sensitive
componen t used in your system .
3. Following the color ban d to t he right
of the component selected, choose the
pressure range that th e system operates
within. This step is not require d for
lubrication system s.
4. Follow the color ban d to th e right of the
pressure range selected for the suggested
ISO code for t he system
5. To the r ight of the ISO code, in the
same color band, are th e media efficien-
cies required for the corresponding filter
p lacements . Depend ing on the selection
ther e will be one to thr ee opt ions
available.
6. Be sure tha t th e f i lter p laceme nts
recommendation is on the same level
as the m edia efficiency selecte d.
7/27/2019 Manual Parker
http://slidepdf.com/reader/full/manual-parker 26/37
Fi l ter M edia Select ion
Component Type SystemPressure Suggested Media Efficiency Number of MinimumFilterCleanliness Code Betax >200 Filter Placements Placements
2
5
2
2
2
5
10
2
5
2
5
5
10
2
5
10
2
5
5
105
10
5
10
10
20
10
5
10
16/14/12
15/13/11
15/12/10
17/15/13
17/14/12
16/14/11
18/16/14
17/16/14
17/15/13
19/17/15
18/17/14
18/16/13
20/18/16
19/17/15
19/17/14
<1000
1000-3000
>3000
<1000
1000-3000
>3000
<1000
1000-3000
>3000
<1000
1000-3000
>3000
<1000
1000-3000
>3000
Servo Valves
Proportional
Valves
Variable Volume
Pumps
Vane Pumps
Fixed Piston Pumps
Cartridge Valves
Gear Pumps
Flow Controls
Cylinders
1
2
1.5
2
1
1.5
2.5
1
2
1.5
2.5
1
2
0.5
1.5
2.5
1
2
0.5
1.51
2
1.5
2.5
1
2.5
1.5
0.5
1.5
P
P & R
P & O
P & R
P
P & O
P, R & O
P
P & R
P & O
P, R & O
P or R
P & R
O
P or R, & O
P, R & O
P or R
P & R
O
P or R, & OP or R
P & R
P or R, & O
P, R & O
P or R
P, R & O
P or R, & O
O
P or R, & O
Hydraulic Systems
Component Type Suggested Media Efficiency Number of MinimumFilterCleanliness Code Betax>200 Filter Placements* Placements
1.5
1
2
0.5
1.5
2.5
2
2
5
2
5
10
15/13/11
16/14/12
17/15/13
Ball Bearings
Roller Bearings
Journal Bearings
Gear Boxes
P or R, & O
P or R
P & R
0
P or R, & O
P, R & O
Lubrication Systems
21
P = F ull flow pressur e filter ( equalsone fi ltrat ion placemen t)
R = Full flow return filter (e quals onefiltration placement)
O = Off-line ( flow rate 10% of rese r-
voir volume equals .5 of a filtra-t ion placement)
* Numbe r of filtration placem ent s insystem, more placements are theoption of the specifier.
7/27/2019 Manual Parker
http://slidepdf.com/reader/full/manual-parker 27/37
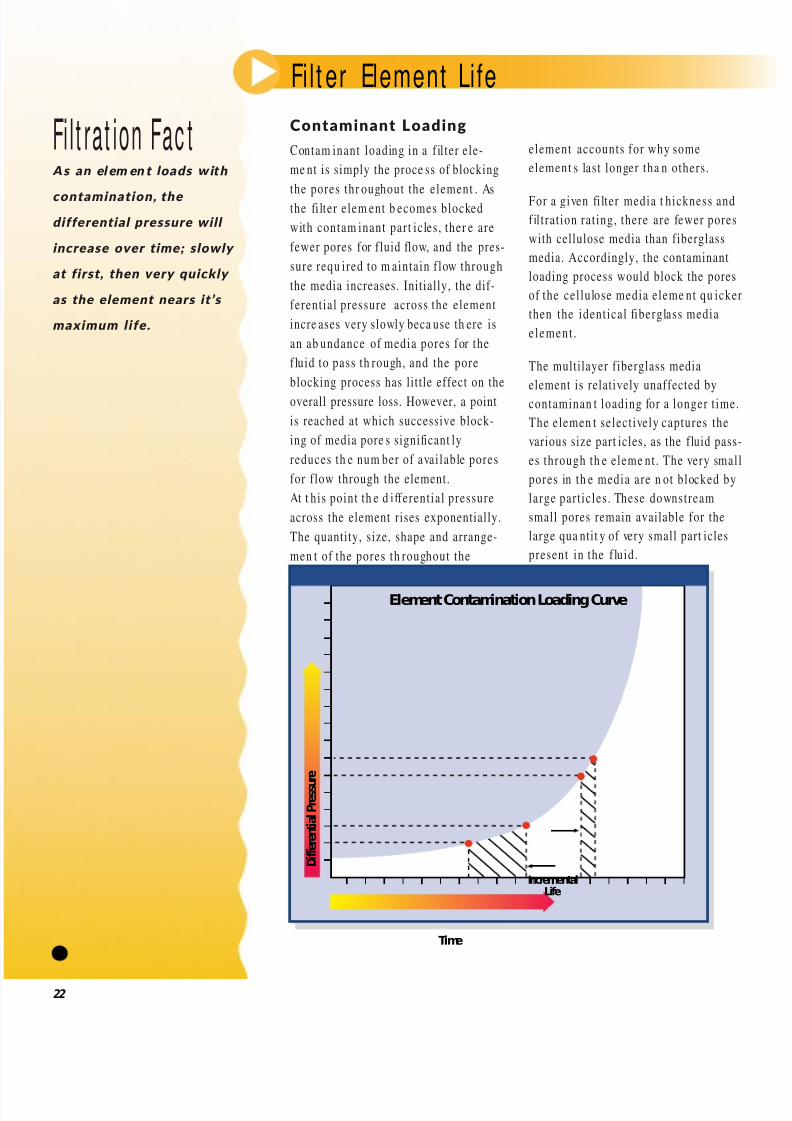
Contaminant Loading
Contam inant loading in a f il ter ele-
me nt is simply the proce ss of blocking
the pores thr oughout the element . Asthe fi lter elem ent b ecomes blocked
with contam inant part icles , ther e are
fewer pores for fluid flow, and the pres-
sure requ ired to m aintain f low through
the media increases. Initially, the dif-
ferential pressure across the element
incre ases very slowly beca use th ere is
an ab undance of media pores for the
fluid to pass th rough, and the pore
blocking process has little effect on the
overall pressure loss. However, a point
is reached at which successive block-
ing of media pore s significant ly
reduces th e num ber of available pores
for flow through the element.
At t his point th e d ifferential pressure
across the element rises exponentially.
The quantity, size, shape and arrange-
men t of the pores th roughout the
element accounts for why some
element s las t longer tha n others .
For a given filter media t hickness and
fil tration rating, there are fewer pores
with cellulose media than fiberglass
media. Accordingly, the contaminant
loading process would block the pores
of the cellulose media eleme nt qu icker
then the identical fiberglass media
element .
The multilayer fiberglass media
element is relatively unaffected by
contaminan t loading for a longer t ime.
The elemen t selectively captures the
various size part icles, as the fluid pass-
es through th e eleme nt. The very small
pores in th e media are n ot blocked by
large particles . These downstream
small pores remain available for the
large qua ntit y of very small part icles
present in the f luid.
Fil t er Element Life
22
D i f f e r e n t i a l P r e s s u
r e
Time
IncrementalLife
Element Contamination Loading Curve
Fi l t rat ion Fac tAs an element loads with
contamination, the
differential pressure will
increase over time; slowly
at first, then very quick ly
as the element nears it’s
maximum life.
7/27/2019 Manual Parker
http://slidepdf.com/reader/full/manual-parker 28/37
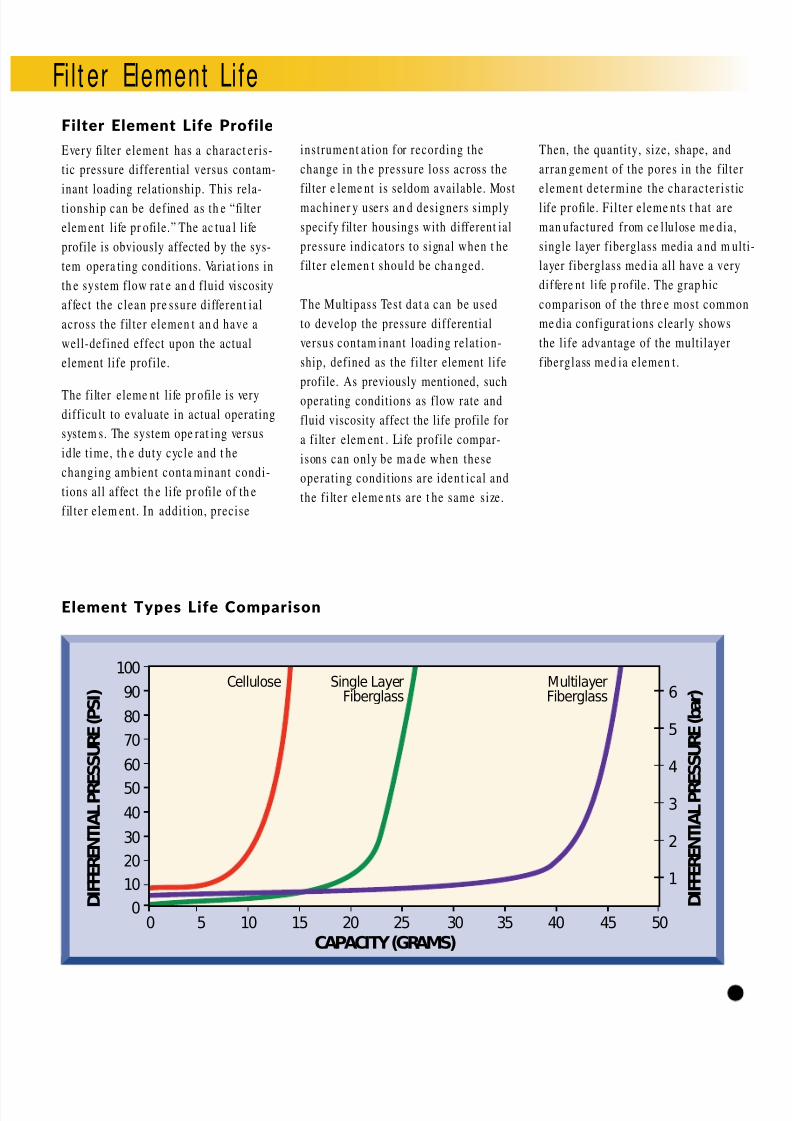
Filter Element Life Profile
Every fi lter element has a charact eris-
tic pressure differential versus contam-
inant loading relationship. This rela-tionship can be defined as th e “filter
elem ent life pr ofile.” The ac tua l life
profile is obviously affected by the sys-
tem opera ting conditions. Variat ions in
th e system flow rat e an d fluid viscosity
affect the clean pre ssure different ial
across the f il ter elemen t an d have a
well-defined effect upon the actual
element life profile.
The filter eleme nt life pr ofile is very
difficult to evaluate in actual operating
system s. The system ope rat ing versus
idle t ime, th e duty cycle and t he
changing ambient conta minant condi-
tions all affect th e life pr ofile of th e
fil ter elem ent. In addition, precise
instrument ation for recording the
change in th e pressure loss across the
filter e leme nt is seldom available. Most
machiner y users an d designers s imply
specify filter housings with different ial
pressure indicators to s ignal when t he
fil ter elemen t should be cha nged.
The Multipass Test dat a can be used
to develop the pressure differential
versus contam inant loading relation-
ship, defined as the filter element life
profile. As previously mentioned, such
operating conditions as flow rate and
fluid viscosity affect the life profile for
a filter elem ent . Life profile compar-
isons can only be ma de when these
operating conditions are ident ical and
the f i lter eleme nts are t he same size.
Then, the quantity, size, shape, and
arran gement of the pores in the f il ter
e lement determine the character is t ic
life profile. Filter eleme nts t hat are
man ufactured from ce llulose me dia,
single layer fiberglass media a nd m ul
layer fiberglass med ia all have a very
differe nt life p rofile. The grap hic
comparison of the thre e most commo
me dia configurat ions clearly shows
the life advantage of the multilayer
fiberglass med ia elemen t.
Fil t er Element Life
Element Types Life C om parison
23
00 5 10 15 20 25 30 35 40 45 50
10
20
30
40
50
60
70
80
90 6
5
4
3
2
1
100
CAPACITY (GRAMS)
Cellulose MultilayerFiberglass
Single LayerFiberglass
D I F F E R E N T I A L P R E S S U R E ( P S I )
D I F F E R E N T I A L P R E S S U R E ( b a r )
7/27/2019 Manual Parker
http://slidepdf.com/reader/full/manual-parker 29/37
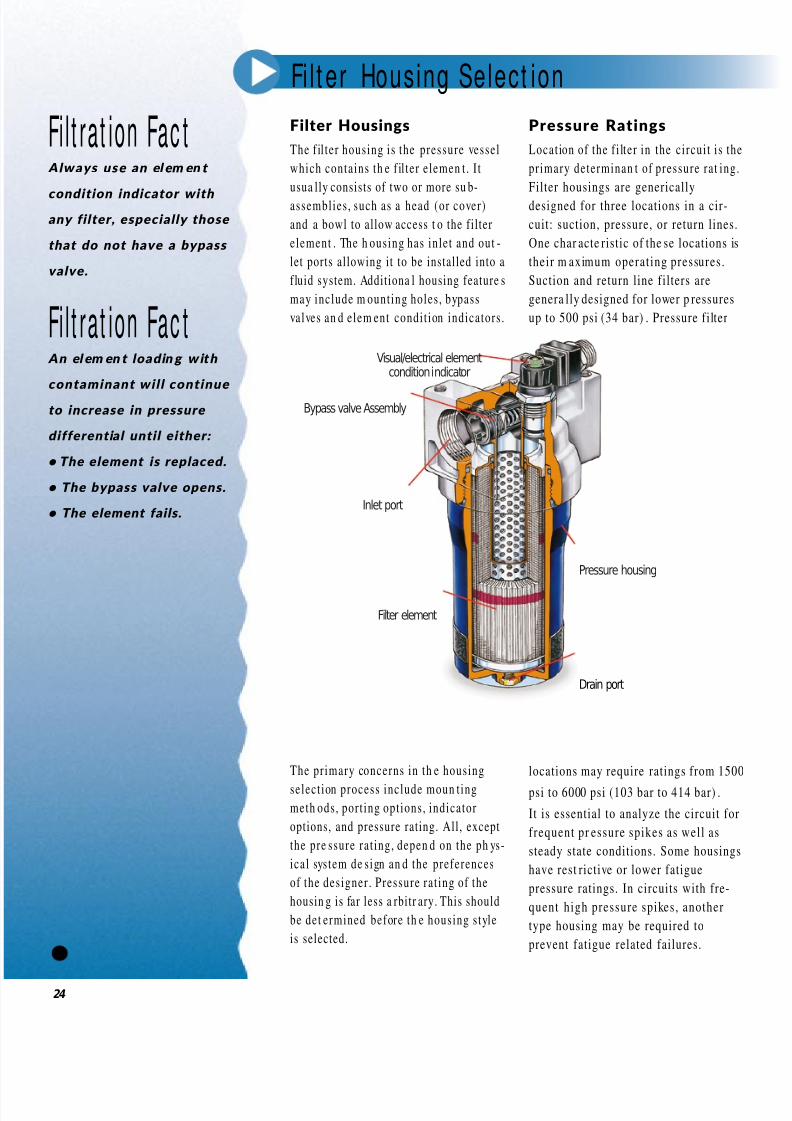
Filter Housings
The f il ter housing is the pressure vessel
which contains th e f il ter elemen t. I t
usua lly consists of two or more su b-
assemblies, such as a head (or cover)
and a bowl to allow access t o the filter
element . The h ousing has inlet and out -
let ports allowing it to be installed into a
fluid system. Additiona l housing feature s
may include m ounting holes, bypass
valves an d elem ent condition indicators.
The primary concerns in th e housing
selection process include moun ting
meth ods, porting options, indicator
options, and pressure rating. All, except
the pre ssure rating, depen d on the ph ys-
ical system de sign an d the preferences
of the designer . Pressure rating of the
housin g is far less a rbitr ary. This should
be det ermined before th e housing style
is selected.
Pressure Ratings
Location of the f i lter in the circuit is the
primary determinan t of pressure rat ing.
Filter housings are generically
designed for three locations in a cir-
cuit: suction, pressure, or return lines.
One char acte ristic of the se locations is
their m aximum operating pressures .
Suction and return line filters are
genera lly designed for lower p ressures
up to 500 psi (34 bar) . Pressure filter
locations may require ratings from 1500
psi to 6000 psi (103 bar to 414 bar) .
It is essential to analyze the circuit for
frequent pr essure spikes as well as
steady state conditions. Some housings
have rest rictive or lower fatigue
pressure ratings. In circuits with fre-
quent high pressure spikes, another
type housing may be required to
prevent fatigue related failures.
Fi l t er Housing Select ion
24
Fi l t rat ion Fac tAlways use an element
condition indicator w ith
any filter, especially those
that do not have a bypass
valve.
Fi l t rat ion Fac tAn element loading with
contaminant will continue
to increase in pressure
differential until either:
• The element is replaced.
• The bypass valve opens.
• The element fails.
Visual/electrical elementcondition indicator
Bypass valve Assembly
Pressure housing
Filter element
Inlet port
Drain port
7/27/2019 Manual Parker
http://slidepdf.com/reader/full/manual-parker 30/37
The Bypass Valve
The bypass valve is used to pr event t he
collapse or burst of the f il ter eleme nt
when it becomes highly loaded withcontaminan t. I t also prevents pump
cavitation in the case of suction line
filtration. As contaminant builds up in
the element , the differential pressure
across the elemen t increases . At a
pressure well below the failure point
of the filter e leme nt , th e bypass valve
opens, allowing flow to go around t he
element .
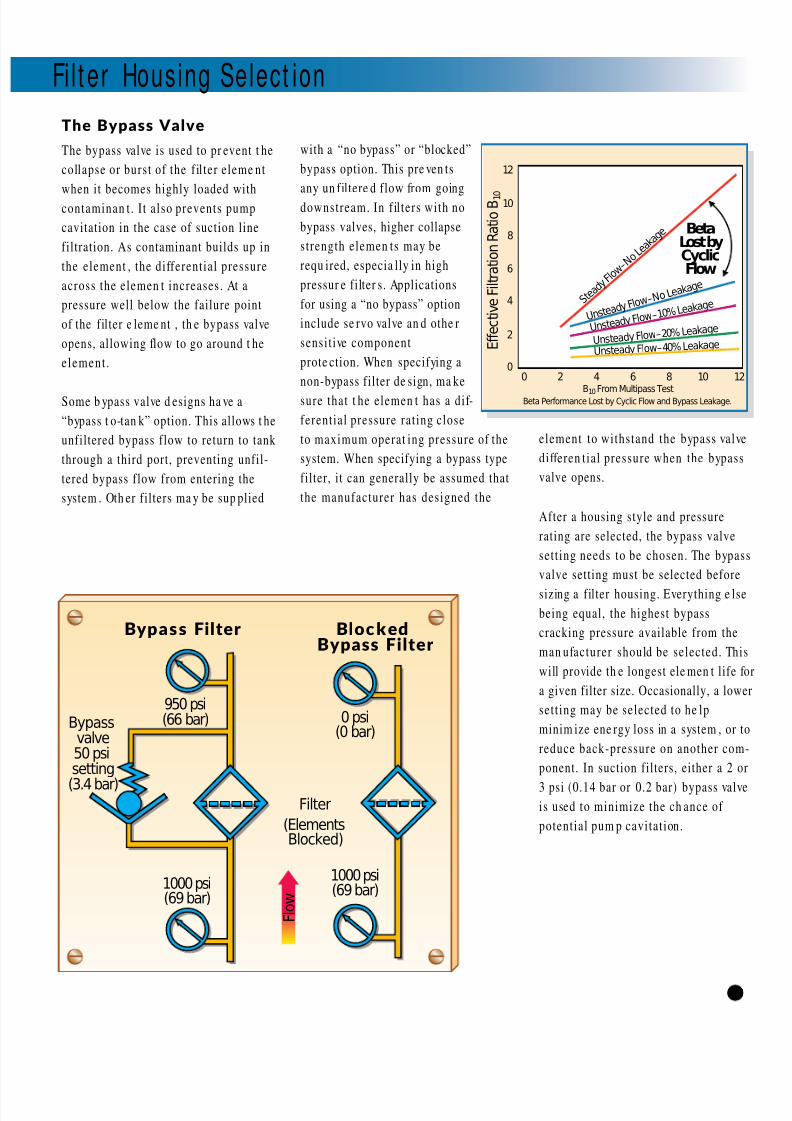
Some b ypass valve d esigns ha ve a
“bypass t o-tan k” option. This allows t he
unfiltered bypass flow to return to tank
through a third port, preventing unfil-
tered bypass flow from entering the
system . Oth er filters ma y be sup plied
with a “no bypass” or “blocked”
bypass option. This pre ven ts
any un filtere d flow from going
downstream. In f il ters with no
bypass valves, higher collapse
strength elemen ts may be
requ ired, especia lly in high
pressur e filter s. Applications
for using a “no bypass” option
include se rvo valve an d othe r
sensitive component
prote ction. When specifying a
non-bypass filter de sign, ma ke
sure that t he elemen t has a dif-
ferential pressure rating close
to maximum operat ing pressure of the
system. When specifying a bypass type
filter, it can generally be assumed that
the manufacturer has designed the
element to withstand the bypass valve
differen tial pressure when the bypass
valve opens.
After a housing style and pressure
rating are selected, the bypass valve
setting needs to be chosen. The bypas
valve setting must be selected before
sizing a filter housing. Everything e ls
being equal, the highest bypass
cracking pressure available from the
man ufacturer should be selected. Thi
will provide th e longest ele men t life f
a given filter size. Occasionally, a low
setting may be selected to he lp
minim ize ene rgy loss in a system , or t
reduce back-pressure on another com
ponent. In suction filters, either a 2 o
3 psi (0.14 bar or 0.2 bar) bypass valvis used to minimize the ch ance of
potential pum p cavitation.
Fi l t er Housing Select ion
25
950 psi(66 bar) 0 psi
(0 bar)
1000 psi(69 bar)1000 psi
(69 bar)
Filter
(ElementsBlocked)
Bypassvalve50 psisetting
(3.4 bar)
Bypass Filter Bloc k edBypass Filter
F l o w
0
2
Beta Performance Lost by Cyclic Flow and Bypass Leakage.
E f f e c t i v e F i l t r a t i o n R a t i o B 1 0
4
6
S t e a d y
F l o w
– N o L
e a k a
g e
U n s t e a d y F
l o w – N o L e a
k a g e
8
10
0 2 4 6 8 10 12
12
U n s t e a d y F l o w
– 1 0 % L e a k a g e
Uns tead y Flo w–20 % Leaka
ge
Uns tead y Flow–40% Leakage
B10 From Multipass Test
BetaLost byCyclicFlow
7/27/2019 Manual Parker
http://slidepdf.com/reader/full/manual-parker 31/37
Element ConditionIndicators
The element condition indicator
signals when the element should be
cleaned or replaced. The indicator usu-
ally has calibration marks which also
indicat es if the filter bypass valve h as
opened. The indicator may be mech an-
ically linked t o th e b ypass valve, or it
may be an entirely indepen dent differ-
ential pr essure sen sing device.
Indicat ors ma y give visual, electrical or
both types of signals. Generally, indica-
tors are set to tr ip anywhere from
5%-25% before th e b ypa ss valve ope ns.
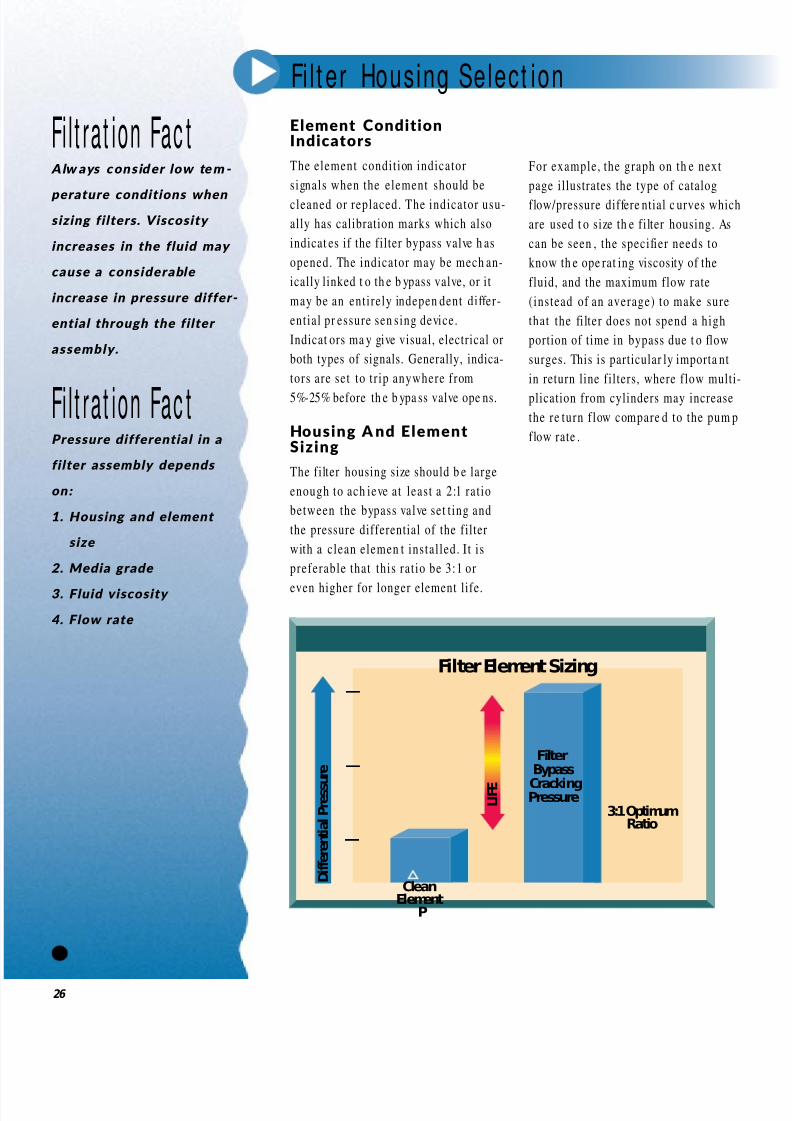
Housing And Element Sizing
The filter housing size should b e large
enough to ach ieve at least a 2:1 ratio
between the bypass valve set t ing and
the pressure differential of the filter
with a clean elemen t installed. I t is
preferable that this ratio be 3:1 or
even higher for longer element life.
For example, the graph on th e next
page illustrates the type of catalog
flow/pressure differe ntial c urves which
are used t o size th e filter housing. As
can be seen , the specifier needs to
know th e ope rat ing viscosity of the
fluid, and the maximum flow rate
(instead of an average) to make sure
that the fi lter does not spend a high
portion of time in bypass due t o flow
surges. This is particular ly importa nt
in return line filters, where flow multi-
plication from cylinders may increase
the re turn f low compare d to the pum p
flow rate .
Fi l t er Housing Select ion
26
Fi l t rat ion Fac tAlw ays consider low tem-
perature conditions when
sizing filters. Viscosity
increases in the fluid may
cause a considerable
increase in pressure differ-
ential through the filter
assembly.
Fi l t rat ion Fac tPressure differential in a
filter assembly depends
on:
1. Housing and element
size
2. Media grade
3. Fluid viscosity
4. Flow rate
Filter Element Sizing
3:1 OptimumRatio
CleanElement
P
D i f f e r e n t i a l P r e s s u r e
L I F E
FilterBypass
CrackingPressure
7/27/2019 Manual Parker
http://slidepdf.com/reader/full/manual-parker 32/37
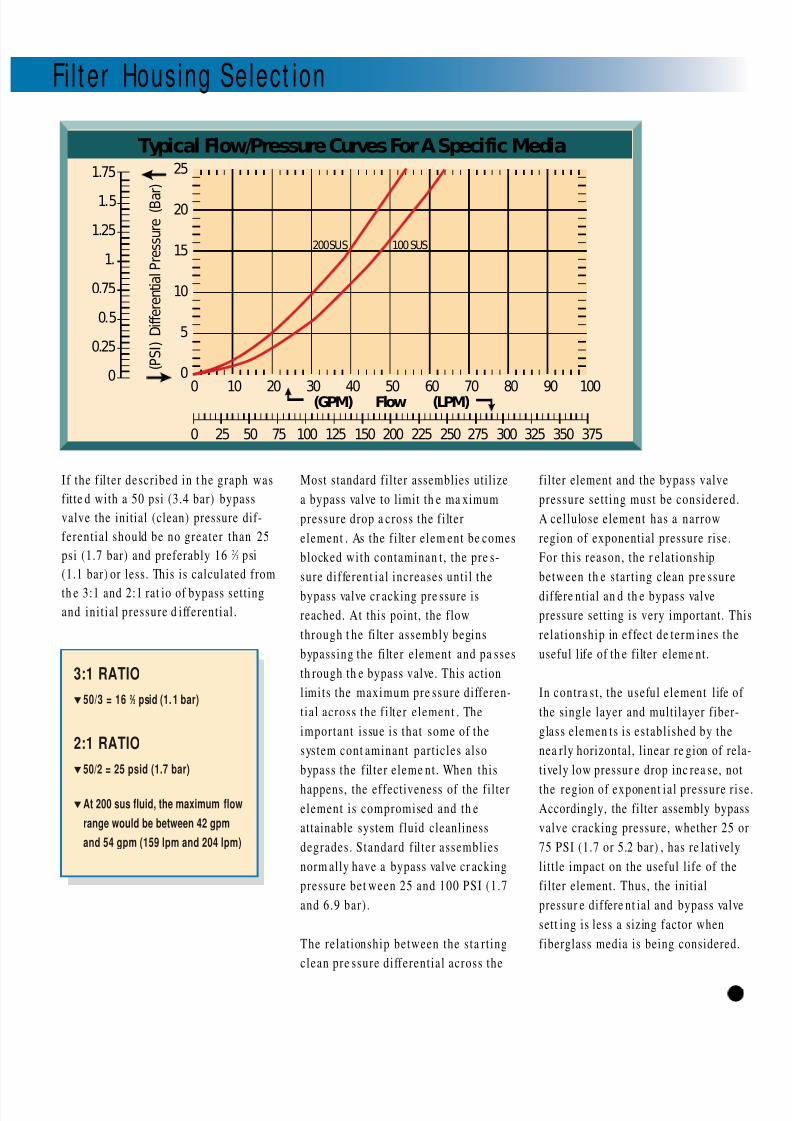
If the f il ter described in t he graph was
fitte d with a 50 psi (3.4 bar) bypass
valve the initial (clean) pressure dif-
ferential should be no greater than 25
psi (1.7 bar) and preferably 16 2 ⁄ 3 psi
(1.1 bar) or less. This is calculated from
th e 3:1 and 2:1 rat io of bypass setting
and initial pressure d ifferential .
Most standard filter assemblies utilize
a bypass valve to limit th e ma ximum
pressure drop a cross the f i lter
element . As the f i lter elem ent be comes
blocked with contaminan t, the pre s-
sure different ial increases until the
bypass valve cr acking pre ssure is
reached. At this point, the flow
through t he fi lter assembly begins
bypassing the fi lter element and pa sses
th rough th e bypass valve. This action
limits the maximum pre ssure differen-
tial across the f i lter element . The
important issue is that some of the
system cont aminant particles also
bypass the f il ter eleme nt. When this
happens, the effectiveness of the filter
element is compromised and th e
attainable system fluid cleanliness
degrades. Standard f il ter assemblies
norm ally have a bypass valve cr acking
pressure bet ween 25 and 100 PSI (1.7
and 6.9 bar) .
The relationship between the s ta rting
clean pre ssure differential across the
filter element and the bypass valve
pressure sett ing must be considered.
A cellulose element has a narrow
region of exponential pressure rise.
For this reason, the r elationship
between th e s tarting clean pre ssure
differe ntial an d th e bypass valve
pressure setting is very important. Th
relationship in effect de term ines the
useful life of th e filter eleme nt.
In contra st , the useful element l ife of
the single layer and multilayer fiber-
glass elemen ts is es tablished by the
nea rly horizontal, linear re gion of rel
tively low pressur e drop inc rea se, not
the region of exponent ial pressure r is
Accordingly, the filter assembly bypas
valve cracking pressure, whether 25 o
75 PSI (1.7 or 5.2 bar) , has re latively
little impact on the useful life of the
filter element. Thus, the initial
pressur e differe nt ial and bypass valve
sett ing is less a sizing factor when
fiberglass media is being considered.
Fi l t er Housing Select ion
27
Typical Flow/Pressure Curves For A Specific Media
0 25 50 75 100 125 150 200 225 250 275 300 325 350 375
0
0.25
0.5
0.75
1.
1.25
1.5
1.75
0
5
10
100 SUS200 SUS15
20
25
100 20 30 40 50 60 70 80 90 100Flow(GPM) (LPM)
( P S I ) D i f f e r e n t i a l P r e s s u r e
( B a
r )
3:1 RATIO
50/3 = 16 2 ⁄ 3 psid (1. 1 bar)
2:1 RATIO
50/2 = 25 psid (1.7 bar)
At 200 sus fluid, the maximum flow
range would be between 42 gpm
and 54 gpm (159 lpm and 204 lpm)
7/27/2019 Manual Parker
http://slidepdf.com/reader/full/manual-parker 33/37
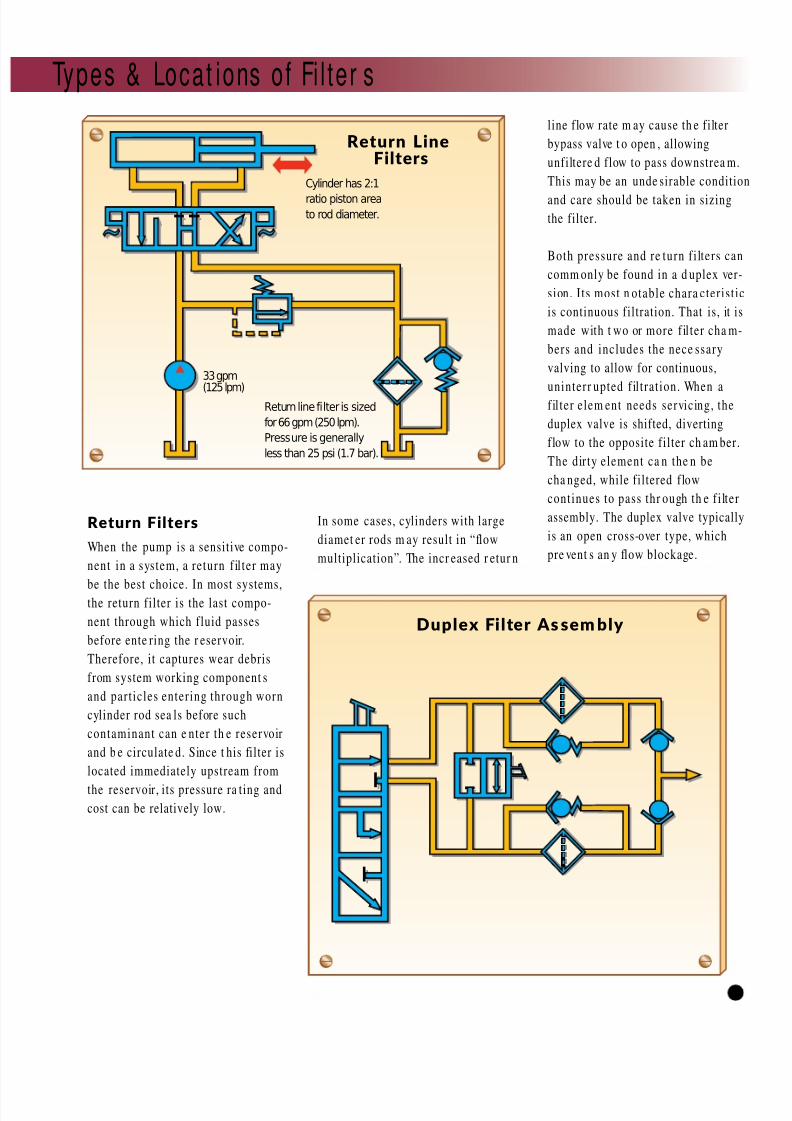
Return Filters
When the pump is a sensitive compo-
nent in a system, a return f il ter may
be the best choice. In most systems,the return filter is the last compo-
nent through which fluid passes
before ente ring the r eservoir.
Therefore, it captures wear debris
from system working component s
and particles entering through worn
cylinder rod sea ls before such
contaminant can e nter th e reservoir
and b e circulate d. Since t his filter is
located immediately upstream from
the reservoir, its pressure ra ting and
cost can be relatively low.
In some cases, cylinders with large
diamet er rods m ay result in “flow
multiplication”. The incr eased r etur n
line flow rate m ay cause th e filter
bypass valve t o open , allowing
unfiltere d flow to pass downstrea m.
This may be an unde sirable conditio
and care should be taken in sizing
the filter.
Both pressure and re turn f i lters can
comm only be found in a d uplex ver-
s ion. I ts most n otable chara cteris tic
is continuous filtration. That is, it is
made with t wo or more f il ter cha m-
bers and includes the nece ssary
valving to allow for continuous,
uninterr upted f il tration. When afil ter elem ent needs servicing, the
duplex valve is shifted, diverting
flow to the opposite filter ch am ber.
The dir ty element ca n the n be
cha nged, while filtered flow
continues to pass thr ough th e f i lter
assembly. The duplex valve typically
is an open cross-over type, which
pre vent s an y flow blockage.
Types & Locat ions of Fi l ter s
29
Cylinder has 2:1
ratio piston areato rod diameter.
Return line filter is sized
for 66 gpm (250 lpm).
Pressure is generally
less than 25 psi (1.7 bar).
33 gpm
(125 lpm)
Return LineFilters
Duplex Filter Asse mb ly
7/27/2019 Manual Parker
http://slidepdf.com/reader/full/manual-parker 34/37
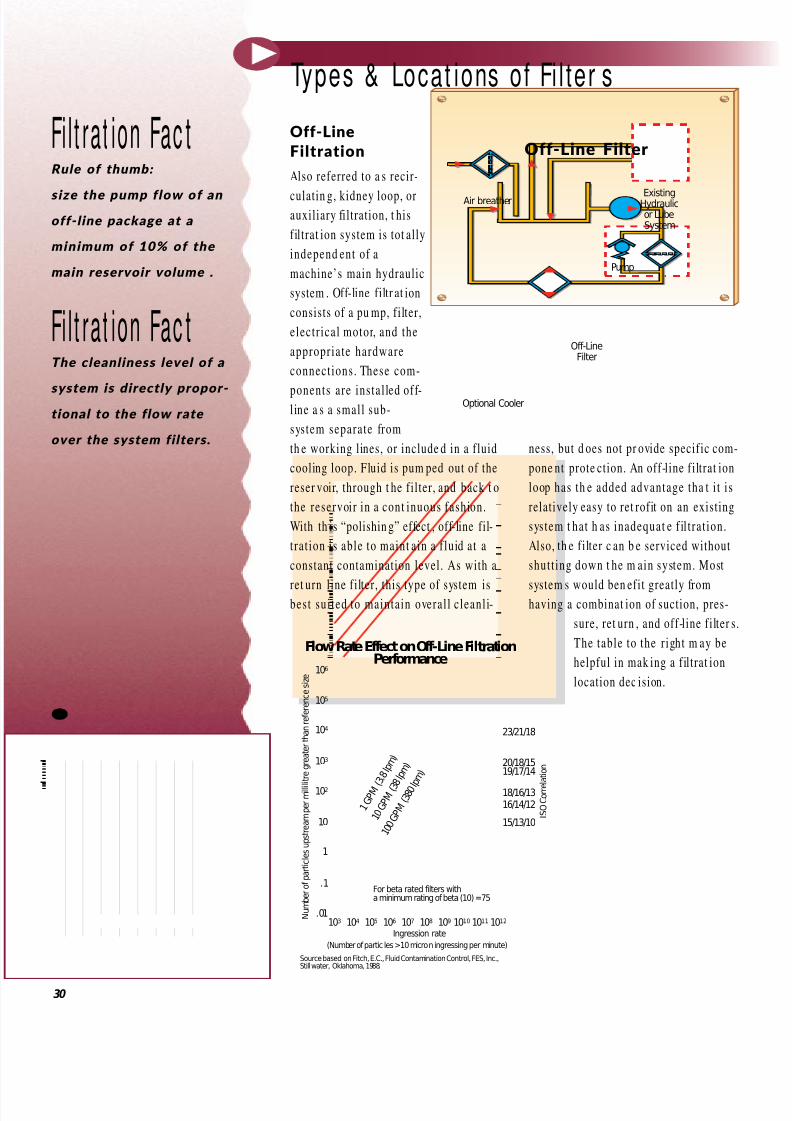
Off-LineFiltration
Also referred to a s recir-
culatin g, kidney loop, orauxiliary filtration, t his
filtrat ion system is tot ally
independ ent of a
machine’s main hydraulic
system . Off-line filtr at ion
consists of a pu mp, filter,
electr ical motor, and the
appropriate hardware
connections. These com-
ponents are installed off-l ine a s a small sub-
system separate from
th e working lines, or include d in a fluid
cooling loop. Fluid is pum ped out of the
reser voir, through t he filter, and back t o
the reservoir in a cont inuous fashion.
With th is “polishin g” effect , off-line fil-
tration is able to maint ain a f luid at a
constant contamination level. As with a
ret urn line filter, this type of system isbest suited to maintain overall c leanli-
ness, but d oes not pr ovide specific com-
pone nt prote ction. An off-line filtrat ion
loop has th e added advantage tha t i t is
relatively easy to ret rofit on an existing
system t hat h as inadequat e f il tration.
Also, th e filter c an b e serviced without
shutting down t he m ain system. Most
system s would ben efit greatly fromhaving a combinat ion of suction, pres-
sure, ret urn , and off-line filter s.
The table to the r ight m ay be
helpful in mak ing a filtrat ion
location dec ision .
Types & Locat ions of Fi l ter s
30
Fi l t rat ion Fac tRule of thumb:
size the pump flow of an
off-line package at a
minimum of 10% of the
main reservoir volume .
Fi l t rat ion Fac tThe cleanliness level of a
system is directly propor- tional to the flow rate
over the system filters.
Pump
Off-LineFilter
Optional Cooler
Air breather ExistingHydraulicor LubeSystem
Off -Line Filter
Flow Rate Effect on Off-Line FiltrationPerformance
.01
.1
23/21/18
20/18/1519/17/14
18/16/1316/14/12
15/13/10
For beta rated filters witha minimum rating of beta (10) =75
(Number of partic les >10 micron ingressing per minute)
Source based on Fitch, E.C., Fluid Contamination Control, FES, Inc.,Stillwater, Oklahoma, 1988.
N u m b e r o f p a r t i c l e s u p s t r e a m p e r m i l l i l i t r e g r e a t e r t h a n r e f e r e n c e s i z e
I S O C o r r e l a t i o n
1
10 1 G P M
( 3 . 8 l p
m )
1 0 G P M
( 3 8
l p m )
1 0 0 G P M
( 3 8 0 l p
m )
102
103
103 104 105 106 107 108 109 1010 1011 1012
104
105
106
Ingression rate
7/27/2019 Manual Parker
http://slidepdf.com/reader/full/manual-parker 35/37
Types & Locat ions of Fi l ter s
31
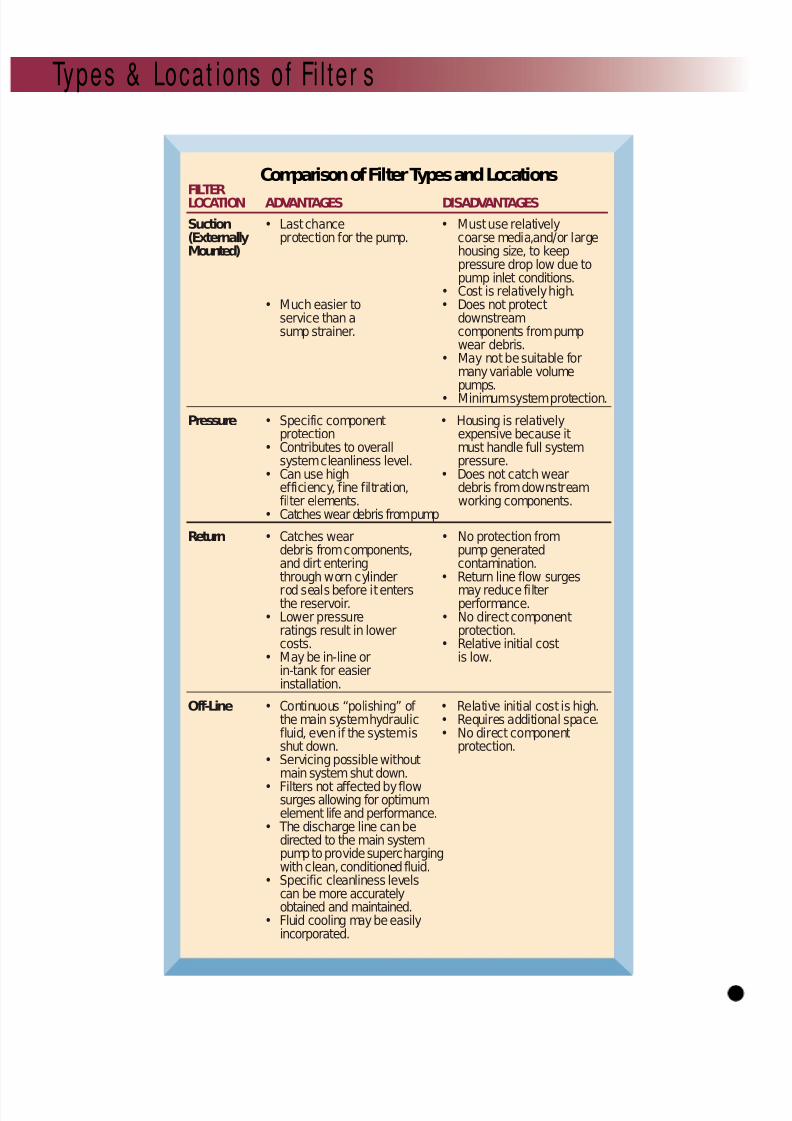
Comparison of Filter Types and Locations
FILTERLOCATION ADVANTAGES DISADVANTAGES
Suction • Last chance • Must use relatively(Externally protection for the pump. coarse media,and/or largeMounted) housing size, to keep
pressure drop low due topump inlet conditions.
• Cost is relatively high.• Much easier to • Does not protect
service than a downstreamsump strainer. components from pump
wear debris.• May not be suitable for
many variable volumepumps.
• Minimum system protection.
Pressure • Specific component • Housing is relativelyprotection expensive because it
• Contributes to overall must handle full systemsystem cleanliness level. pressure.
• Can use high • Does not catch wearefficiency, fine filtration, debris from downstreamfilter elements. working components.
• Catches wear debris from pump
Return • Catches wear • No protection fromdebris from components, pump generatedand dirt entering contamination.through worn cylinder • Return line flow surges
rod seals before it enters may reduce filterthe reservoir. performance.
• Lower pressure • No direct componentratings result in lower protection.costs. • Relative initial cost
• May be in-line or is low.in-tank for easierinstallation.
Off-Line • Continuous “polishing” of • Relative initial cost is high.the main system hydraulic • Requires additional space.fluid, even if the system is • No direct componentshut down. protection.
• Servicing possible withoutmain system shut down.
• Filters not affected by flowsurges allowing for optimumelement life and performance.
• The discharge line can bedirected to the main systempump to provide superchargingwith clean, conditioned fluid.
• Specific cleanliness levelscan be more accuratelyobtained and maintained.
• Fluid cooling may be easilyincorporated.
7/27/2019 Manual Parker
http://slidepdf.com/reader/full/manual-parker 36/37
Fluid Analysis Methods
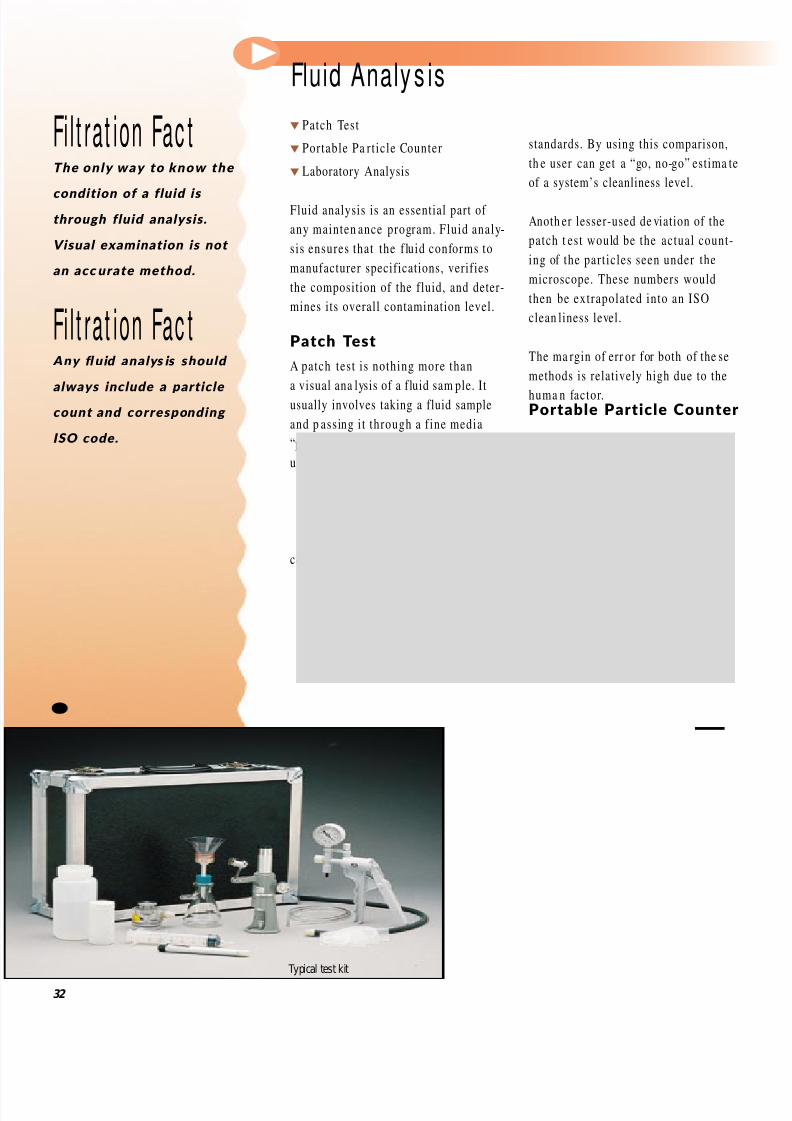
Patch Test
Portable Pa rticle Counter
Laboratory Analysis
Fluid analysis is an essential part of
any mainten ance program. Fluid analy-
sis ensures that the f luid conforms to
manufacturer specifications, verifies
the composition of the fluid, and deter-
mines its overall contamination level.
Patch Test
A patch test is nothing more than
a visual ana lysis of a fluid sam ple. Itusually involves taking a fluid sample
and p assing it through a f ine media
“patch”. The patch is then analyzed
under a m icroscope for both color and
content, and compared t o known ISO
standards. By using this comparison,
th e user can get a “go, no-go” estima te
of a system’s cleanliness level.
Anoth er lesser-used de viation of the
patch t est would be the actual count-
ing of the particles seen under the
microscope. These numbers would
then be extrapolated into an ISO
clean liness level.
The ma rgin of err or for both of the se
methods is relatively high due to the
huma n factor.Portable Particle C ounter
Fluid Analy s is
32
Fi l t rat ion Fac tThe only way to k now the
condition of a fluid is
through fluid analysis.
Visual examination is not
an accurate method.
Fi l t rat ion Fac tAny fluid analysis should
always include a particle count and corresponding
ISO code.
Typical test kit
7/27/2019 Manual Parker
http://slidepdf.com/reader/full/manual-parker 37/37
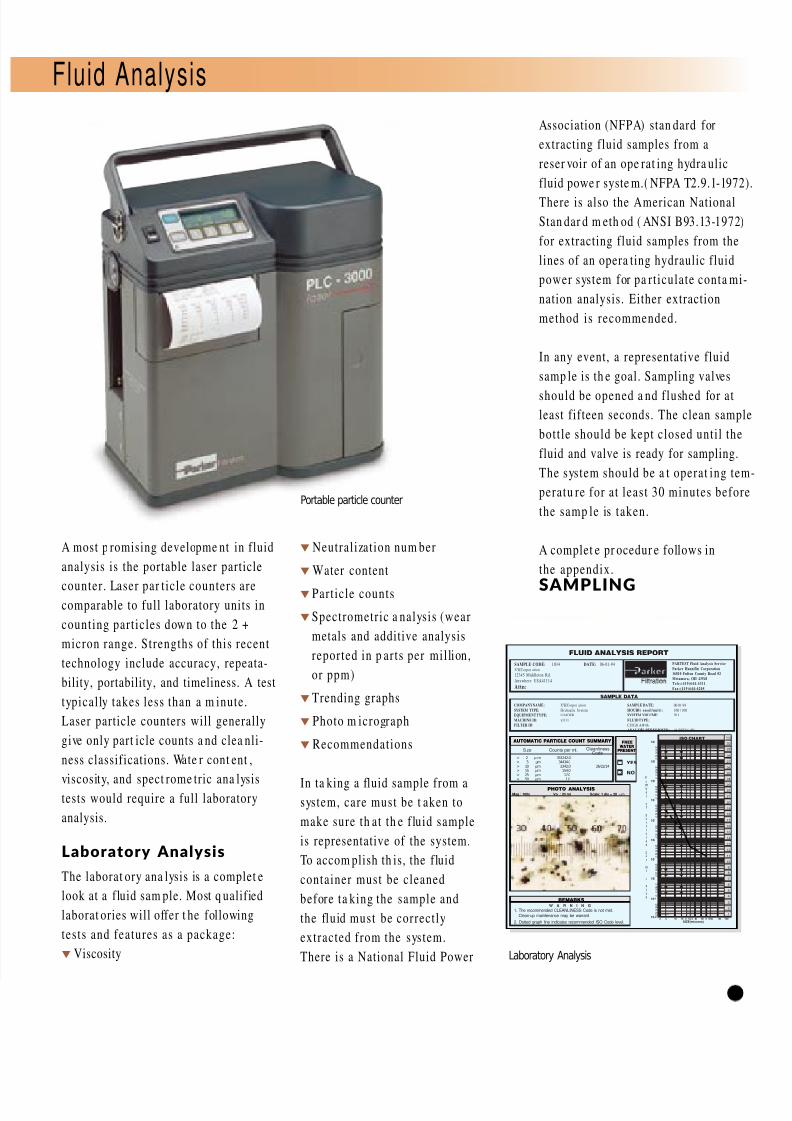
A most p romising developme nt in fluid
analysis is the portable laser particle
counter . Laser par ticle counters arecomparable to full laboratory units in
counting particles down to the 2 +
micron range. Strengths of this recent
technology include accuracy, repeata-
bility, portability, and timeliness. A test
typically takes less than a m inute.
Laser particle counters will generally
give only part icle counts a nd clea nli-
ness classifications. Wate r cont ent ,
viscosity, and spect rome tric ana lysistests would require a full laboratory
analysis.
Laboratory A nalysis
The laborat ory ana lysis is a complet e
look at a fluid sam ple. Most q ualified
Neutralization num ber
Water content
Particle counts
Spectrometric a nalysis (wear
metals and additive analysis
reported in p arts per million,
or ppm)
Trending graphs
Photo m icrograph
Recommendations
In ta king a fluid sample from asystem, care must be t aken to
make sure th at th e f luid sample
is representative of the system.
To accom plish th is, the fluid
container must be cleaned
before ta king the sample and
Association (NFPA) stan dard for
extracting fluid samples from a
reser voir of an ope rat ing hydra ulic
fluid powe r syste m.( NFPA T2.9.1-1972
There is also the American National
Stan dar d m eth od ( ANSI B93.13-1972)
for extracting fluid samples from the
lines of an opera ting hydraulic fluid
power system for pa rticulate conta mi
nation analysis. Either extraction
method is recommended.
In any event, a representative fluid
samp le is th e goal. Sampling valves
should be opened a nd f lushed for at
least fifteen seconds. The clean samp
bottle should be kept closed until the
fluid and valve is ready for sampling.
The system should be a t operat ing tem
peratu re for at least 30 minutes befor
the samp le is taken.
A complet e pr ocedur e follows in
the appendix.
SAMPLING
Fluid Analysis
Portable particle counter
FLUID ANALYSIS REPORT
SAMPLE DATA
COMPANYNAME: XYZCorpor ation
SYSTEM TYPE: Hydraulic System
EQUIPMENT TYPE: LOADER
MACHINE ID: x1111
FILTER ID:
SAMPLE DATE: 06-01-94
HOURS ( o n o il/u n it): 100 / 100
SYSTEM VOLUME: 20 L
FLUID TYPE:
CITGO AW46
ANALYSIS PERFORMED: AI-BSTV4 (W)
AUTOMATIC PARTICLE COUNT SUMMARY
W A R N I N G
CleanlinessCode
Size Counts per ml.
> 2 µ m 353242.0> 5 µm 34434.0
> 10 µm 2342.0 26/22/14> 15 µm 154.0
> 25 µm 17.0> 50 µm 1.0
FREE
WATER
PRESENT
YES
NOX
PARTEST Fluid Analysis Service
Parker Hannifin Corporation
16810 Fulton County Road #2
Metamora, OH 43540
Tele:(4 1 9 )6 4 4 -4 3 1 1
Fa x :(4 1 9 )6 4 4 -6 2 0 5
SAMPLE CODE: 1034 DATE: 06-01-94XYZCorpor ation
12345 Middleton Rd.
Anywhere USA41114
Attn:
30
29
28
27
26
25
24
2322
21
20
19
18
17
16
15
14
13
12
11
10
9
8
7
6
5
4
3
107
5.04.03.0
2.01.5
106
5.04.03.0
2.01.5
105
5.04.03.0
2.01.5
104
5.04.03.0
2.01.5
103
5.04.03.0
2.01.5
102
5.04.03.0
2.01.5
101
5.04.03.0
2.01.5
100
5.04.03.0
2.0
1.5
10-1
5.0
Nu
mber
of
particles
per
ml
>
size
ISO CHART RANGE
CODE
REMARKS
PHOTO ANALYSIS
Mag.: 100x Vol.: 20 ml Scale: 1 div = 20 µm