manuals and guidelines for micro-hydropower...
TRANSCRIPT

DEPARTMENT OF ENERGY ENERGY UTILIZATION MANAGEMENT BUREAU
Manuals and Guidelines
for
Micro-hydropower Development
in Rural Electrification
Volume I
June 2009

Through the Project on “Sustainability Improvement of Renewable Energy Development for Village Electrification in the Philippines” under technical assistance of Japan International Cooperation Agency (JICA), this manual was developed by the Department of Energy (DOE) reviewing the “Manual for Micro-hydropower Development in March 2003.

Manuals and Guidelines
for Micro-hydropower Development in Rural Electrification
Volume I
MHP-1 Manual for Design, Implementation and Management for Micro-hydropower
Volume II
MHP-2 Guideline for Selection of Potential Sites and Rehabilitation Sites of Micro-hydropower
MHP-3 Project Evaluation Guideline for Micro-hydropower Development MHP-4 Micro-hydropower Plant Site Completion Test Manual MHP-5 Micro-hydropower Operator Training Manual MHP-6 Training Manual for Micro-hydropower Technology

1

DEPARTMENT OF ENERGY ENERGY UTILIZATION MANAGEMENT BUREAU
MANUAL
for
Design, Implementation and Management
For
Micro-hydropower Development
June 2009
MHP – 1

Through the Project on “Sustainability Improvement of Renewable Energy Development for Village Electrification in the Philippines” under technical assistance of Japan International Cooperation Agency (JICA), this manual was developed by the Department of Energy (DOE) reviewing the “Manual for Micro-hydropower Development in March 2003.
Manual for Micro-Hydro Power Development Contents
- c-1 -
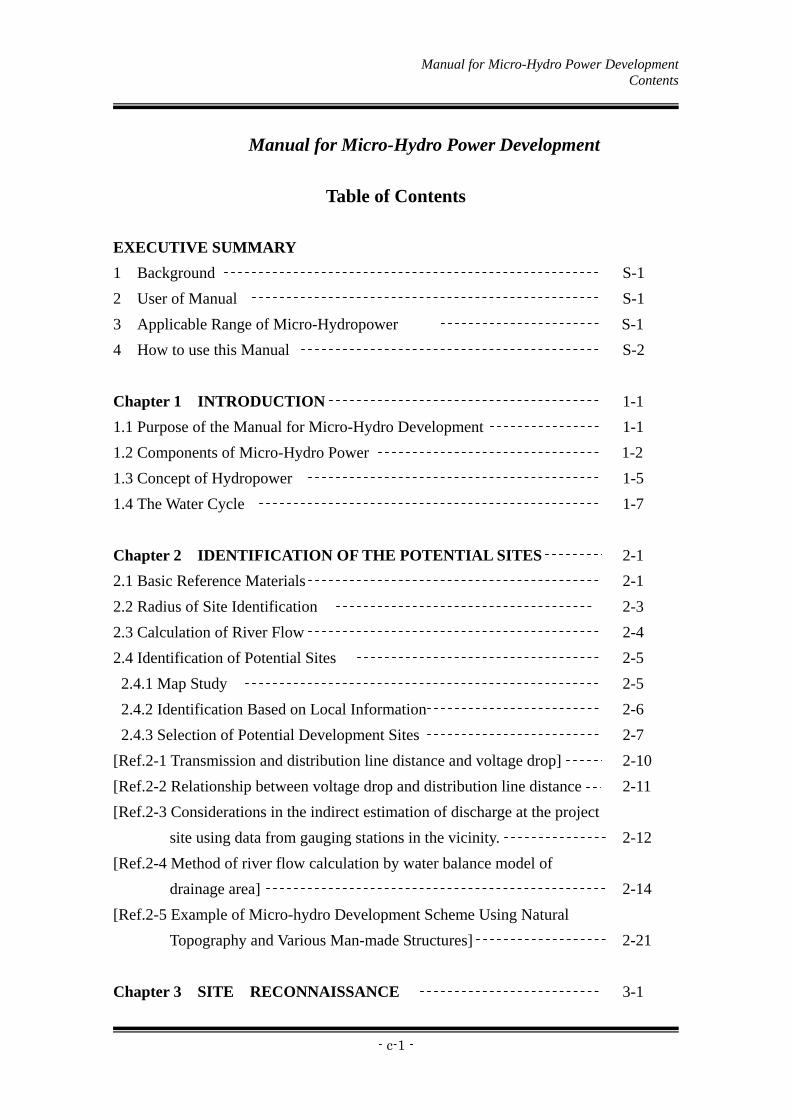
Manual for Micro-Hydro Power Development
Table of Contents
EXECUTIVE SUMMARY
1 Background S-1
2 User of Manual S-1
3 Applicable Range of Micro-Hydropower S-1
4 How to use this Manual S-2
Chapter 1 INTRODUCTION 1-1
1.1 Purpose of the Manual for Micro-Hydro Development 1-1
1.2 Components of Micro-Hydro Power 1-2
1.3 Concept of Hydropower 1-5
1.4 The Water Cycle 1-7
Chapter 2 IDENTIFICATION OF THE POTENTIAL SITES 2-1
2.1 Basic Reference Materials 2-1
2.2 Radius of Site Identification 2-3
2.3 Calculation of River Flow 2-4
2.4 Identification of Potential Sites 2-5
2.4.1 Map Study 2-5
2.4.2 Identification Based on Local Information 2-6
2.4.3 Selection of Potential Development Sites 2-7
[Ref.2-1 Transmission and distribution line distance and voltage drop] 2-10
[Ref.2-2 Relationship between voltage drop and distribution line distance 2-11
[Ref.2-3 Considerations in the indirect estimation of discharge at the project
site using data from gauging stations in the vicinity. 2-12
[Ref.2-4 Method of river flow calculation by water balance model of
drainage area] 2-14
[Ref.2-5 Example of Micro-hydro Development Scheme Using Natural
Topography and Various Man-made Structures] 2-21
Chapter 3 SITE RECONNAISSANCE 3-1

Manual for Micro-Hydro Power Development Contents
- c-2 -
3.1 Objective of Site Reconnaissance 3-1
3.2 Preparation for Site Reconnaissance 3-1
3.2.1 Information gathering and preparation 3-1
3.2.2 Planning of preliminary site reconnaissance 3-2
3.2.3 Necessary equipment for preliminary site reconnaissance 3-2
3.3 Survey for Outline the Project Site 3-3
3.4 Validation of Geological Conditions Affecting Stability
of Main Civil Structures 3-5
3.5 Survey on Locations of Civil Structures 3-6
3.6 Measurement of River Flow 3-7
3.7 Measurement of Head 3-9
3.8 Demand Survey 3-10
3.8.1 Demand survey 3-10
3.8.2 Factors to consider in the Demand survey items 3-10
3.9 Actual Field Survey 3-12
[Ref.3-1 Method of Stream Flow Measurement] 3-13
[Ref.3-2 Method of Head Measurement] 3-18
[Ref.3-3 Sample Form Sheet for Potential Site Survey] 3-22
[Ref.3-4 Questionnaire for households of non-electrified barangays] 3-26
Chapter 4 PLANNING 4-1
4.1 Scheme of Development Layout 4-1
4.2 Data and Reference to Consider for Planning 4-3
4.2.1 Hydrograph and Flow Duration Curve 4-3
4.2.2 Plant Factor and Load Factor 4-4
4.3 Selection of Locations for Main Civil Structures 4-6
4.3.1 Location of Intake 4-6
4.3.2 Headrace Route 4-8
4.3.3 Location of Head Tank 4-8
4.3.4 Penstock Route 4-9
4.3.5 Location of Powerhouse 4-12
4.3.6 Location of Tailrace 4-13
4.4 Supply and Demand Plan 4-14
4.4.1 Selection of Power Demand Facilities 4-14

Manual for Micro-Hydro Power Development Contents
- c-3 -
4.4.2 Scheme of Development based on Supply and Demand 4-15
4.4.3 Daily Supply and Demand Plan 4-22
Chapter 5 DESIGN FOR CIVIL STRUCTURES 5-1
5.1 Basic Equation for Civil Design 5-1
5.2 Intake Weir (Dam) 5-1
5.2.1 Types of Intake Weir 5-1
5.2.2 Weir Height Calculation 5-5
5.3 Intake 5-9
5.3.1 Types of Intake 5-9
5.3.2 Important Points for Intake Design (for Side-Intake) 5-12
5.4 Settling basin 5-14
5.5 Headrace 5-17
5.5.1 Types and Structures of Headrace 5-17
5.5.2 Determining the Cross Section and Longitudinal Slope 5-21
5.6 Headtank 5-24
5.6.1 Headtank Capacity 5-24
5.6.2 Important Points for Headtank Design 5-26
5.7 Penstock 5-30
5.7.1 Penstock Material 5-30
5.7.2 Calculation of Steel Pipe Thickness 5-30
5.7.3 Determining Diameter of Penstock 5-30
5.8 Foundation of Powerhouse 5-34
5.8.1 Foundation for Impulse Turbine 5-34
5.8.2 Foundation for Reaction Turbine 5-35
[Ref. 5-1 Simple Method for Determining the Cross Section] 5-37
[Ref.5-2 Simple Method for Determining the Diameter of Penstock] 5-41
[Ref.5-3 Calculation of Head Loss] 5-42
Chapter 6 DESIGN FOR MECHANICAL AND ELECTRICAL STRUCTURES 6-1
6.1 Fundamental Equipment Components for Power Plant 6-1
6.2 Turbine (Water turbine) 6-5
6.2.1 Types and Output of Water Turbine 6-5
6.2.2 Specific Speed and Rotation Speed of Turbine 6-8
Manual for Micro-Hydro Power Development Contents
- c-4 -
6.2.3 Design of Crossflow Turbine 6-12
6.2.4 Design of Reverse Pump Type Turbine (Pump As Turbine) 6-13
6.3 Generator 6-14
6.3.1 Types of Generator 6-14
6.3.2 Output of Generator 6-16
6.3.3 Speed and Number of Poles of Generator 6-17
6.4 Power Transmission Facility (Speed Increaser) 6-19
6.5 Control Facility of Turbine and Generator 6-20
6.5.1 Speed Governor 6-20
6.5.2 Exciter of Generator 6-21
6.5.3 Single Line Diagram 6-23
6.6 Control, Instrumentation and Protection of Plant 6-24
6.6.1 Control Method of Plant 6-24
6.6.2 Instrumentation of Plant 6-24
6.6.3 Protection of Plant and 380/220V Distribution Line 6-25
6.6.4 Protection of 20kV Distribution Line 6-25
6.7 Inlet Valve 6-26
Annex 6.1 Brief Design of Cross Flow Turbine (SKAT T-12,13 & 14) 6-28
Annex 6.2 Brief Design of Reverse Pump Turbine (PAT) 6-33
Annex 6.3 Technical Application Sheet of Tender for
for Rural Electrification 6-46
Annex 6.4 Breif Design for Electro-mechanical Equipment of
Micro-hydropower Plant 6-49
Chapter 7 DESIGN OF DISTRIBUTION FACILITIES 7-1
7.1 Concept of Electricity 7-1
7.2 Selection for Distribution Route 7-3
7.3 Distribution Facilities 7-5
7.4 Pole 7-6
7.4.1 Span Length of Poles 7-6
7.4.2 Allowable Minimum Clearance of Conductors and Environment 7-7
7.4.3 Height of Poles 7-7
7.4.4 Size of Poles 7-8
7.5 Guy wire 7-9
Manual for Micro-Hydro Power Development Contents
- c-5 -
7.6 Conductors and Cables 7-12
7.6.1 Advantages/Disadvantages of Conductors and Cables 7-12
7.6.2 Sizes of Conductors 7-12
7.6.3 Allowable Sag of Conductors 7-12
7.6.4 Allowable Load per Phase 7-12
7.6.5 Application of 3-Phase Line 7-12
7.7 Distribution Transformers 7-13
7.7.1 Types of Distribution Transformer 7-13
7.7.2 Necessity of Transformers 7-14
7.7.3 Application of Distribution Transformers 7-15
7.7.4 Selection of Unit Capacity 7-15
7.7.5 Location 7-15
7.8 House Connection (HC) 7-16
7.8.1 Application of House Connection 7-16
7.8.2 In-house Wiring 7-17
[Ref.7-1 Standard of Steel poles] 7-18
[Ref.7-2 Construction of house connection crossing village road] 7-19
Chapter 8 PROJECT COST ESTIMATION 8-1
8.1 Rough Cost Estimation During Planning Stage 8-1
8.2 Cost Estimation During Detail Design Stage 8-3
8.2.1 Items 8-3
8.2.2 Quantity 8-5
8.2.3 Unit Cost 8-6
[ Ref. 8-1 Cross-sectional method to calculate quantity] 8-11
[Ref.8-2 Example of Bill of Quantities] 8-13
Chapter 9 CONSTRUCTION MANAGEMENT 9-1
9.1 Construction Management for Civil Facilities 9-1
9.1.1 Purpose 9-1
9.1.2 Progress Control 9-1
9.1.3 Dimension Control 9-2
9.1.4 Quality Control 9-3

Manual for Micro-Hydro Power Development Contents
- c-6 -
9.2 Construction Management for Turbine, Generator and
their Associated Equipment 9-5
9.2.1 Installation 9-5
9.2.2 Adjustment during Test Run Operation 9-6
Chapter 10 OPERATION AND MAINTENANCE 10-1
10.1 Introduction 10-1
10.2 Operation 10-2
10.2.1 Basic Operation 10-2
10.2.2 Operation in case of Emergency 10-4
10.2.3 Others 10-5
10.3 Maintenance 10-6
10.3.1 Daily Patrol 10-6
10.3.2 Periodic Inspection 10-8
10.3.3 Special Inspection 10-8
10.4 Recording 10-9
Chapter 11 MANAGEMENT 11-1
11.1 Establishment of Organization 11-1
11.2 Management System 11-1
11.3 Reporting and Monitoring 11-2
11.4 Decision-Making System 11-2
11.5 Accounting System 11-3
11.6 Roles and Responsibilities of BAPA 11-3
11.6.1 BAPA Officials 11-3
11.6.2 Consumers 11-5
11.6.3 Local Government Unit (LGU) 11-5
11.6.4 Department of Energy (DOE) 11-5
11.7 Training 11-5
11.8 Collection of Electricity Charges and Financial management 11-6
11.8.1 Tariff Setting 11-6
11.8.2 Tariff Collection 11-6
11.8.3 Financial Management 11-7

Manual for Micro-Hydro Power Development Executive Summary
- S-1 -
EXECUTIVE SUMMARY
1. Background
The first micro-hydropower plant was constructed in the 1930’s in San Pablo City,
Laguna Province. Although the Philippines has more than 60-year history in
micro-hydro development, most of the micro-hydropower plants, particularly those that
are recently installed, are not operational or have some problems in their operation.
Some identified issues or problems are the results of insufficient site assessment, poor
quality of power plant facilities and electro-mechanical equipment, and inadequate
operation and maintenance. In order to provide solution to these issues, as well as to
ensure sustainable development, it is required to use a guide and/or manual for
micro-hydro development.
This manual was provided as a technical supplement of the “Guide on Micro-hydro
Development for Rural Electrification” which was developed under JICA Expert
Dispatch Program for Rural Electrification utilizing Micro-hydro Technology.
2. User of Manual
This manual is intended to assist prospective micro-hydropower developers/proponents
for rural electrification in the off-grid and/or isolated barangays, such as local
government units (LGU’s), cooperatives and NGOs. This manual mainly deals with
technical aspects of micro-hydropower technology to facilitate the community based
micro-hydro development.
3. Applicable Range of Micro-Hydropower
The selection of best turbines depends on the site characteristics, the dominant factor on
the selection process being the head available and the power required. Selection also
depends on the speed at which it is desired to run the generator or other device loading
the turbine. It should be considered that whether or not the turbine will be expected to
produce power under part-flow conditions, also play an important role in the selection.
In the micro-hydropower scheme, turbines could be classified and grouped according to
operating principle as shown in the table below.

Manual for Micro-Hydro Power Development Executive Summary
- S-2 -
Table S.1 Classification and applicability range of turbines HEAD (pressure) Turbine Type High < 40 m. Medium 20-40 m. Low 5-20 m.
Impulse Pelton
Turgo
Crossflow (Banki)
Turgo Pelton
Crossflow (Banki)
Reaction Francis Pump-as-turbine (PAT)
Kaplan Propeller
Propeller Kaplan
4. How to use this manual
This manual is composed of eleven (11) chapters in relation with the “Project Cycle of
Sustainable Rural Electrification by Utilizing Micro-Hydro Technology”.
The conduct of site assessment and investigation in the study for a proposed
micro-hydropower development are necessary to upgrade its level of accuracy. However,
high precision survey or detailed investigation for preliminary design during the
planning stage is not recommended due to practical and economic reasons. The
development scale of micro-hydro is small and the cost of survey work is relatively
high.
The stages of mini-hydropower development project cycle are as follows.
Project Planning Stage
Project Implementation Stage
Project Operation Stage
In the first stage of the project cycle, termed as the “Project Planning Stage, the major
activities are “Selection of Potential Sites”, “Site Reconnaissance”, “Planning of the
Potential Sites” and “Formulation of the Project Development Plan” in the target area
utilizing decentralized power generation. Several potential sites will be considered in
this stage in order to formulate the electrification plan for the whole target area. Chapter
3 through Chapter 4, Chapter 8-1 and Chapter 11 of this manual will comprise the
pre-implementation stage.

Manual for Micro-Hydro Power Development Executive Summary
- S-3 -
Figure S.1 Flowchart of Micro-hydropower Development (DOE’s BEP Projects)
Community Dept. of Energy / Other Donors
Proponent (LGUs/NGOs)
List of
unenergized
sites identified
for NRE
Project
Op
eration Stage
Project Im
plem
entation
Stage P
roject Plan
nin
g Stage
Site Reconnaissance
Layout and Design
Mobilization
House wiring/Construction/ Installation
O & M Training
Monitoring and
Technical advice
for the Project Management and O & M of the project
LGU/NGO request Request for
consultant
Data Analysis
Commissioning
Data Collection
Technical
Assistance, if
necessary
Technical A i t
BAPA Formulation Approval
Proposal preparation
Periodic

Manual for Micro-Hydro Power Development Executive Summary
- S-4 -
The second stage is the “Project Implementation Stage”. This stage covers the “Detail
Design” and “Construction” of the particular site. Chapter 5 through Chapter 9 of this
manual will be used in the project implementation stage.
The final stage is the “Project Operation Stage”. In this stage, “Operation and
Maintenance” and “Management” will be discussed. These activities are described in
Chapter 10 through Chapter 11 of this manual.
The descriptions in each chapter are follows,
Chapter 1 Introduction
Introduces the concept of the micro-hydropower.
Chapter 2 Selection of Potential Sites
Deals with the technical aspects for site selection on the topographical map and
local information.
Chapter 3 Site Reconnaissance
Provides procedural activities on how to conduct the survey on social condition
as well as technical aspects of the potential site that were revealed in the above
activities. In site reconnaissance, it is important to consider the possibility and
capacity of the power generation and the demand in the area concerned.
Chapter 4 Planning
Shows the technical aspects for the planning of the project as shown in Figure
S.2.
Chapter 5 Design of Civil Structures
The main problem for the development of a small-scale hydropower plant is the
high upfront cost. In this chapter, various techniques were described to possibly
reduce the construction cost of civil structures.
Chapter 6 Design of Mechanical and Electrical Structures
Provides the technical aspects for Mechanical and Electrical Structures such as
Inlet valve, Turbine and Generator.
Manual for Micro-Hydro Power Development Executive Summary
- S-5 -
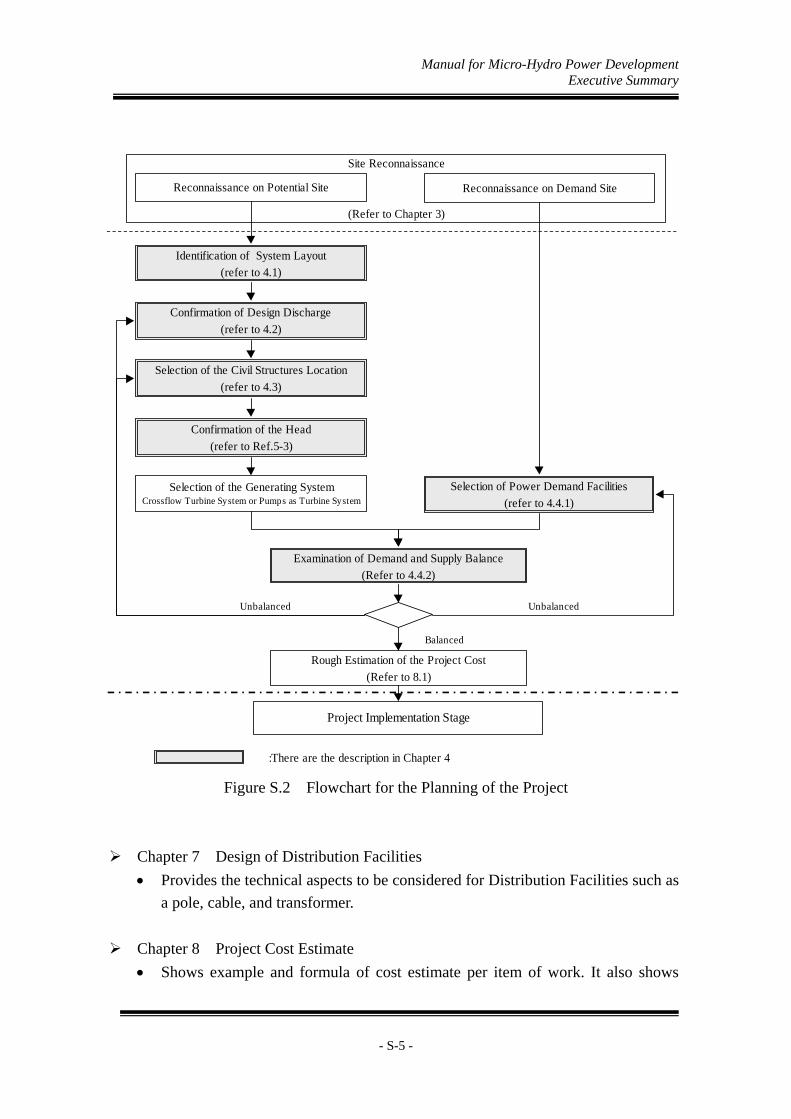
Figure S.2 Flowchart for the Planning of the Project
Chapter 7 Design of Distribution Facilities
Provides the technical aspects to be considered for Distribution Facilities such as
a pole, cable, and transformer.
Chapter 8 Project Cost Estimate
Shows example and formula of cost estimate per item of work. It also shows
Identification of System Layout
(refer to 4.1)
Confirmation of Design Discharge
(refer to 4.2)
Selection of the Civil Structures Location
(refer to 4.3)
Confirmation of the Head
(refer to Ref.5-3)
Selection of Power Demand Facilities
(refer to 4.4.1)Selection of the Generating System
Crossflow Turbine System or Pumps as Turbine System
Examination of Demand and Supply Balance
(Refer to 4.4.2)
Reconnaissance on Potential Site Reconnaissance on Demand Site
Site Reconnaissance
(Refer to Chapter 3)
Unbalanced Unbalanced
Rough Estimation of the Project Cost
(Refer to 8.1)
Balanced
Project Implementation Stage
:There are the description in Chapter 4

Manual for Micro-Hydro Power Development Executive Summary
- S-6 -
how to calculate quantity per work item.
Chapter 9 Construction Management
Refers to the purpose of Construction Management. It also includes progress
control, dimension control and quality control.
Chapter 10 Operation and Maintenance
Shows the necessity of a manual for operation and maintenance and the
importance of daily and periodic inspection.
Chapter 11 Management
In this chapter, the importance of establishing an association in the barangay for
smooth performance in the management of the Micro-hydropower system was
clarified.

Manual for Micro-Hydro Power Development Chapter 1
- 1-1 -
Chapter 1 INTRODUCTION
1.1 Purpose of the Manual for Micro-Hydro Development
Usually, Micro-Hydroelectric Power, or Micro-Hydro, are used in the rural
electrification and does not necessarily supply electricity to the national grid. They are
utilized in isolated and off-grid barangays for decentralized electrification.
There is an increasing need in many developing countries for rural electrification
purposely to provide illumination at night and to support livelihood projects. Also, the
government is faced with the high costs of extending electricity grids. Often,
Micro-Hydro system offers an economical option or alternative to grid extension. The
high cost of transmission lines and the very low load factor in the rural areas contributes
to the non-viability of the grid extension scheme. On the contrary, Micro-Hydro
schemes can be designed and built by the local people and smaller organizations
following less strict regulations and using local technology like traditional irrigation
facilities or locally fabricated turbines. This approach is termed as the Localized
Approach. Fig 1.1.1 illustrates the significance of this approach in lowering the
development cost of Micro-Hydro systems. It is hoped that this Manual will help to
promote the Localized Approach.
Fig 1.1.1 Micro-Hydro’s Economy of Scale ( based on 1985 data)
Manual for Micro-Hydro Power Development Chapter 1
- 1-2 -
1.2 Components of Micro-Hydro Power
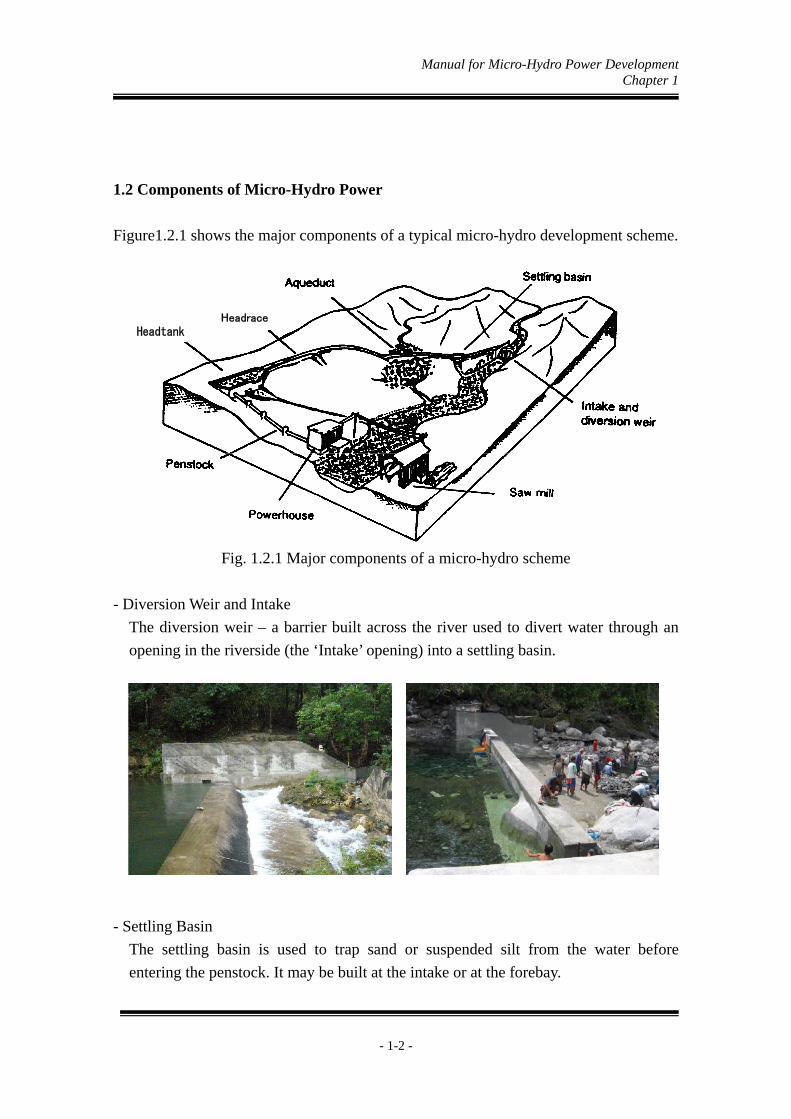
Figure1.2.1 shows the major components of a typical micro-hydro development scheme.
Fig. 1.2.1 Major components of a micro-hydro scheme
- Diversion Weir and Intake
The diversion weir – a barrier built across the river used to divert water through an
opening in the riverside (the ‘Intake’ opening) into a settling basin.
- Settling Basin
The settling basin is used to trap sand or suspended silt from the water before
entering the penstock. It may be built at the intake or at the forebay.
Headtank Headrace

Manual for Micro-Hydro Power Development Chapter 1
- 1-3 -
- Headrace
A channel leading water to a forebay or turbine. The headrace follows the contour of
the hillside so as to preserve the elevation of the diverted water.
- Headtank
Pond at the top of a penstock or pipeline; serves as final settling basin, provides
submergence of penstock inlet and accommodation of trash rack and
overflow/spillway arrangement.

Manual for Micro-Hydro Power Development Chapter 1
- 1-4 -
- Penstock
A close conduit or pressure pipe for supplying water under pressure to a turbine.
- Water Turbine and Generator
A water turbine is a machine to directly convert the kinetic energy of the flowing
water into a useful rotational energy while a generator is a device used to convert
mechanical energy into electrical energy.
There are of course many variations on the design layout of the system. As an
example, the water is entered directly to the turbine from a channel without a
penstock. This type is the simplest method to get the waterpower. Another variation is
that the channel could be eliminated, and the penstock will run directly to the turbine.
Variations like this will depend on the characteristics of the particular site and the
requirements of the user of system.
Manual for Micro-Hydro Power Development Chapter 1
- 1-5 -
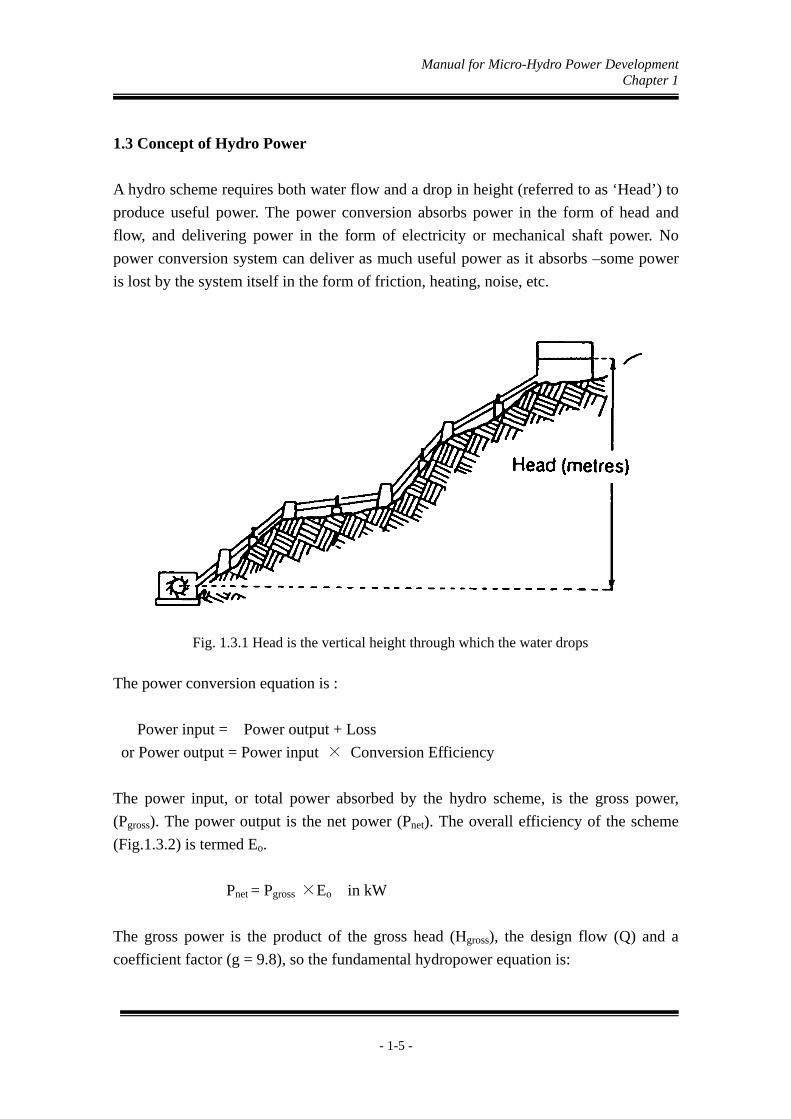
1.3 Concept of Hydro Power
A hydro scheme requires both water flow and a drop in height (referred to as ‘Head’) to
produce useful power. The power conversion absorbs power in the form of head and
flow, and delivering power in the form of electricity or mechanical shaft power. No
power conversion system can deliver as much useful power as it absorbs –some power
is lost by the system itself in the form of friction, heating, noise, etc.
The power conversion equation is :
Power input = Power output + Loss
or Power output = Power input × Conversion Efficiency
The power input, or total power absorbed by the hydro scheme, is the gross power,
(Pgross). The power output is the net power (Pnet). The overall efficiency of the scheme
(Fig.1.3.2) is termed Eo.
Pnet = Pgross ×Eo in kW
The gross power is the product of the gross head (Hgross), the design flow (Q) and a
coefficient factor (g = 9.8), so the fundamental hydropower equation is:
Fig. 1.3.1 Head is the vertical height through which the water drops
Manual for Micro-Hydro Power Development Chapter 1
- 1-6 -
Pnet = g ×Hgross × Q ×Eo kW (g=9.8)
where the gross head is in meters and the design flow is in cubic meter per second. Eo is
derived as follows:
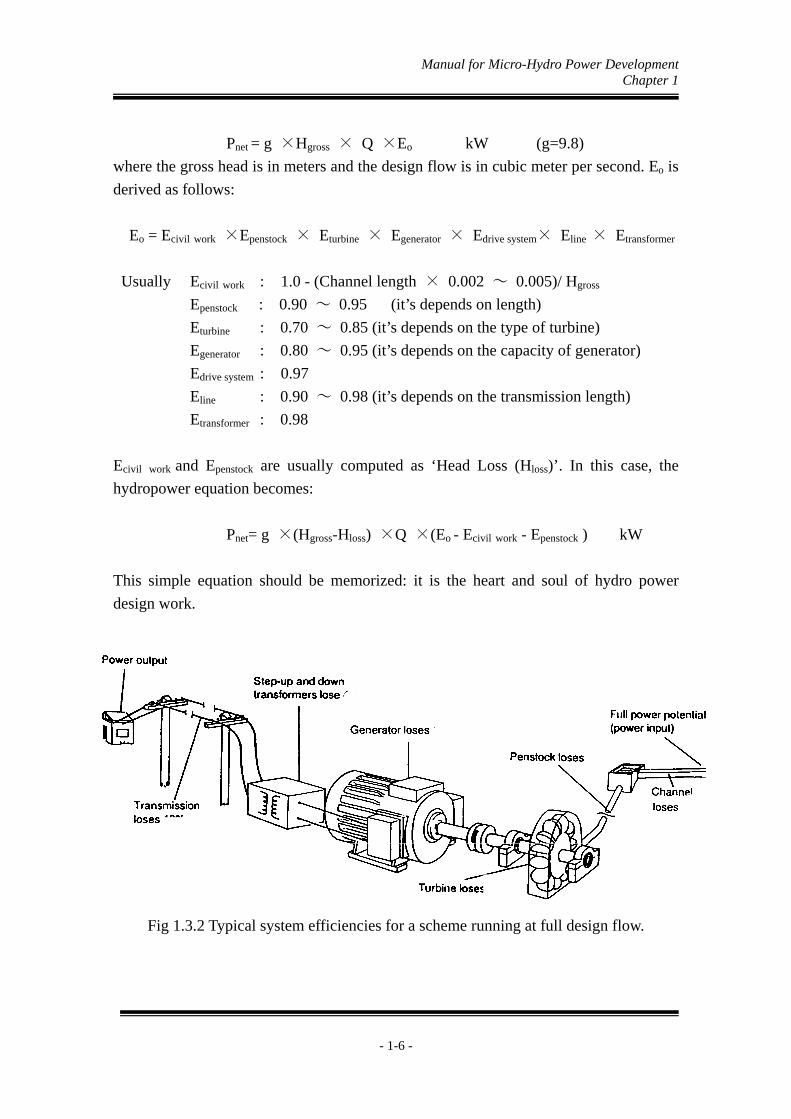
Eo = Ecivil work ×Epenstock × Eturbine × Egenerator × Edrive system× Eline × Etransformer
Usually Ecivil work : 1.0 - (Channel length × 0.002 ~ 0.005)/ Hgross
Epenstock : 0.90 ~ 0.95 (it’s depends on length)
Eturbine : 0.70 ~ 0.85 (it’s depends on the type of turbine)
Egenerator : 0.80 ~ 0.95 (it’s depends on the capacity of generator)
Edrive system : 0.97
Eline : 0.90 ~ 0.98 (it’s depends on the transmission length)
Etransformer : 0.98
Ecivil work and Epenstock are usually computed as ‘Head Loss (Hloss)’. In this case, the
hydropower equation becomes:
Pnet= g ×(Hgross-Hloss) ×Q ×(Eo - Ecivil work - Epenstock ) kW
This simple equation should be memorized: it is the heart and soul of hydro power
design work.
Fig 1.3.2 Typical system efficiencies for a scheme running at full design flow.
Fig 1.3.2 Typical system efficiencies for a scheme running at full design flow.
Fig 1.3.2 Typical system efficiencies for a scheme running at full design flow.
Fig 1.3.2 Typical system efficiencies for a scheme running at full design flow.
Manual for Micro-Hydro Power Development Chapter 1
- 1-7 -
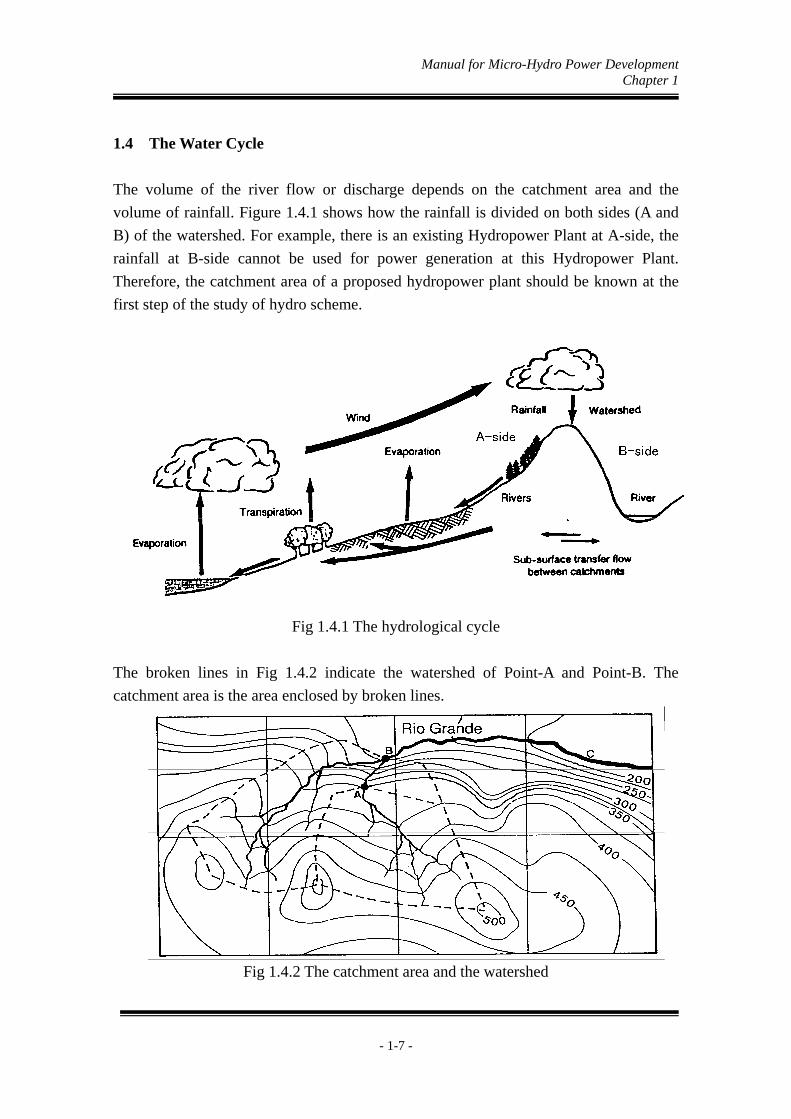
1.4 The Water Cycle
The volume of the river flow or discharge depends on the catchment area and the
volume of rainfall. Figure 1.4.1 shows how the rainfall is divided on both sides (A and
B) of the watershed. For example, there is an existing Hydropower Plant at A-side, the
rainfall at B-side cannot be used for power generation at this Hydropower Plant.
Therefore, the catchment area of a proposed hydropower plant should be known at the
first step of the study of hydro scheme.
Fig 1.4.1 The hydrological cycle
The broken lines in Fig 1.4.2 indicate the watershed of Point-A and Point-B. The
catchment area is the area enclosed by broken lines.
Fig 1.4.2 The catchment area and the watershed
Manual for Micro-Hydro Power Development Chapter 2
- 2-1 -
Chapter 2 IDENTIFICATION OF POTENTIAL SITES
It is necessary to roughly examine (i) whether or not the construction of a small-scale
hydropower plant near the power demand area is feasible and (ii) how much power
capacity can be generated sufficiently and where, and then (iii) how to select a potential
site among the candidate sites.
The initial examination is basically a desk study using available reference materials and
information and the procedure involved and important issues to be addressed are
explained below.
2.1 Basic Reference Materials
The basic reference materials required are the following:
1) Topographical map: scale: 1/50,000
Topographical map provides important information, such as landform, location of
communities, slope of the river, catchment area of proposed sites, access road, etc.
In the Philippines, topographical maps of scale 1/50,000 are available at the
National Mapping & Resources Information Authority (NAMRIA)
2) Rainfall data: isohyetal map and others (cf. Fig 2.1.1)
Although it is unnecessary to gather detailed rainfall data at this stage, it is
necessary to have a clear understanding of the rainfall characteristics of the project
area using an isohyetal map for the region and existing rainfall data for the
adjacent area. Isohyetal map provides the interpolation and averaging will give an
approximate indication of rainfall.
Manual for Micro-Hydro Power Development Chapter 2
- 2-2 -
Figure 2.1.1 (a)
Fig 2.1.1(b) An example of isohyetal map for micro-hydro scheme

Manual for Micro-Hydro Power Development Chapter 2
- 2-3 -
2.2 Radius of Site Identification
As most of the electric energy generated by a small-scale hydropower plant is basically
intended for the consumption of the target area, it is important to consider that the plant
site should be as nearer as possible to the load center. In the case of highly dispersed
communities, which are distributed over a relatively large area, it may be more
advantageous to construct individual micro-hydropower plants, rather than to supply
power to all groups by a single plant, due to lower transmission cost, easier operation
and maintenance and fewer impacts due to unexpected plant stoppage, etc. To be more
efficient in planning individual-type micro-hydropower plants, it is recommended to
gradually widen the scope of the survey, starting from the geographical area of each
group.
The transmission distance from the potential site to the target site should depend on
various parameters, the power output, demand level, topography, accessibility
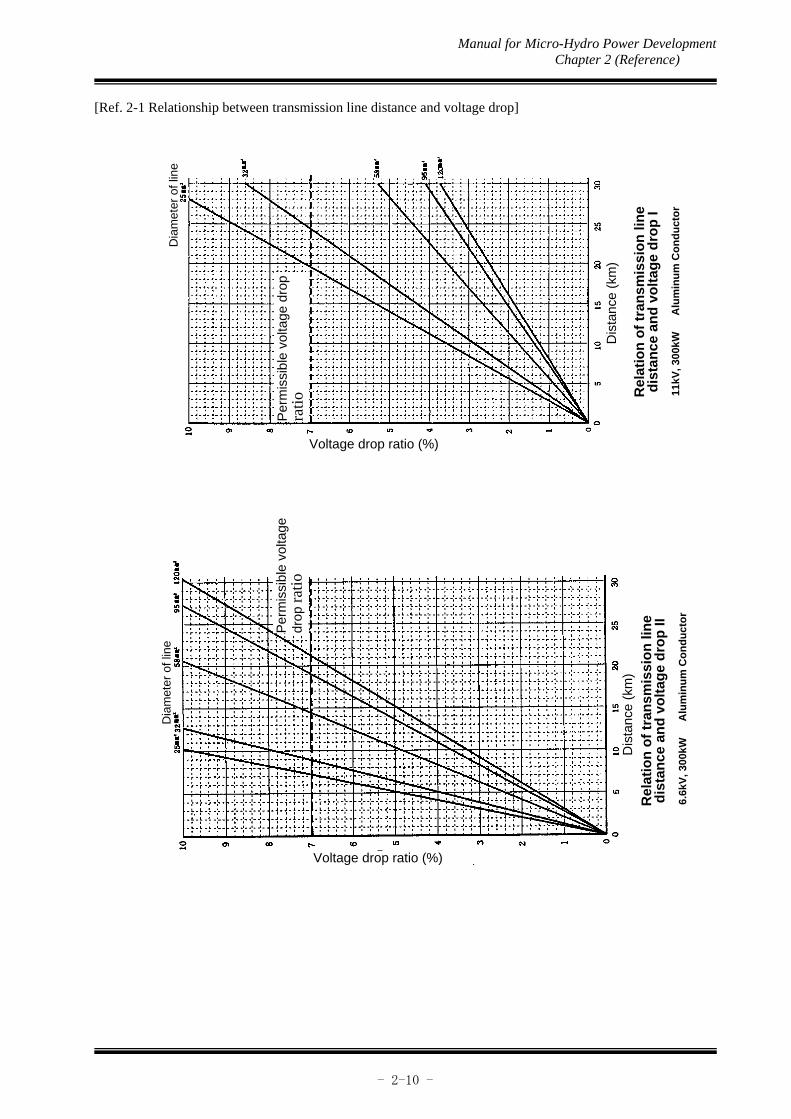
conditions, transmission voltage and cost of transmission lines. In Japan, the
transmission distance to the demand site is set to ensure a voltage drop rate which does
not exceed 7%. [Reference 2-1: Transmission and distribution line distance and voltage
drop]
In case of Micro-hydro Scheme in the Philippines, the rough estimate for the maximum
allowable transmission distance is 1.5 kilometers (km) from the load center. This
distance is based on the premise that the voltage at the end of distribution line should be
kept at not less than 205 volts (V) or the permissible voltage drop is only 15V on the
regulated voltage of 220V, without using a transformer. [Reference 2-2 Relationship
between voltage drop and distribution line distance]
If a good potential site is not found within the above distance, the radius of
identification should be expanded over a larger area with the provision that the
transformer should be installed.

Manual for Micro-Hydro Power Development Chapter 2
- 2-4 -
2.3 Calculation of River Flow
Among the river flow data mentioned earlier, historical records of flow data in the
area surrounding the project site should be used to estimate the river flow, taking the
rainfall distribution characteristics into consideration.
Qp = Rr×Qo/Ao
Where,
Qp : river flow per unit catchment area in project area (m3/s/km2)
Rr : rainfall ratio between catchment area of the proposed site for micro-hydro
project and of existing gauging station
Qo : observed river flow at existing gauging station or existing hydro-power station
(m3/s)
Ao : catchment area of existing gauging station (km2)
[See Reference 2-3: Considerations when estimating river flow at the project site
(indirectly from existing data of vicinity gauging stations) for the important points to
note for river flow based on the existing gauging station nearby.]
Particularly in the micro-hydro scheme, it is important to note that the firm discharge,
which is the flow during the driest time of the year, should be estimated accurately.
If no flow data is available, it is possible to estimate the rough flow duration curve
referring to “Reference 2-3: Simple calculating method of river flow by the water
balance model of drainage area”.

Manual for Micro-Hydro Power Development Chapter 2
- 2-5 -
2.4 Identification of Potential Sites
2.4.1 Map Study
Potential sites are identified on the topographical map with a scale of 1/50,000 by
interpreting the head.
The following parameters should be considered in the map study:
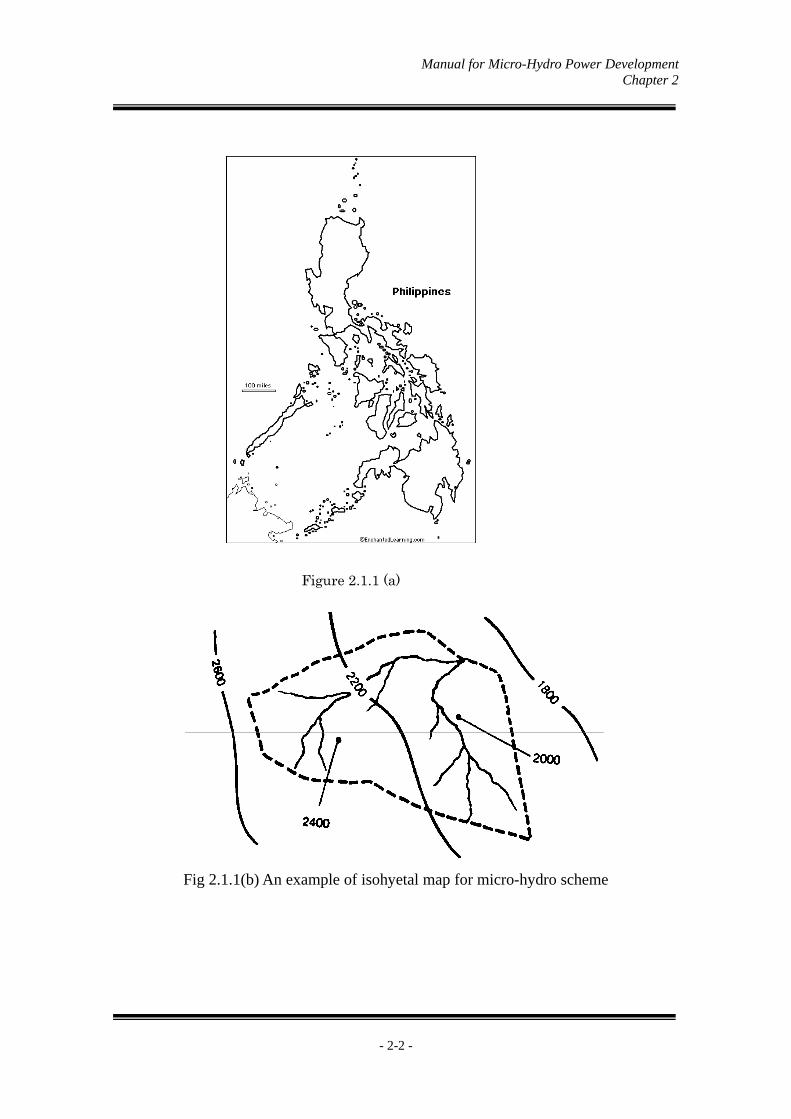
(1) Site identification considering river gradient and catchment area
Sites with high head, shortest waterway and high discharge level are naturally
advantageous for hydropower generation.
The information on the river gradient (elevation difference and river length) and the
drainage area could be obtained in the map study. While some experience is required to
identify potential sites from a topographical map, if the diagrams shown Fig 2.4.1 are
prepared in advance for the subject river, the identification of potential sites is much
easier.
(2) Identification based on waterway construction conditions
As far as the basic layout of a micro-hydro scheme is concerned, most civil structures
are planned to have an exposed structure. Because of this, the topography at any
potential site must be able to accommodate such exposed civil structures. (Refer to
Chapter 4, 4.1 System Layout )
Manual for Micro-Hydro Power Development Chapter 2
- 2-6 -
Fig 2.4.1 River Profile and Changes in Drainage Area of River to consider in the
Identification of Promising Sites for Hydropower Development
2.4.2 Identification Based on Local Information
In cases where potential sites cannot be interpreted on the topographical map because of
the small usable head or the presence of a fall or pool, etc. as well as existing
infrastructures like intake facilities for irrigation and forest roads, potential sites are
identified on the basis of information provided by a local public body and/or local
residents’ organization. [Reference 2-5: Example of Natural Topography and Various
Infrastructures]
Confluence
Suitable section for power E
leva
tion
C
atch
men
t A
rea
River
Change in Catchment Area
Distance

Manual for Micro-Hydro Power Development Chapter 2
- 2-7 -
2.4.3 Selection of Potential Development Sites
The potential sites identified in the previously described study are then examined for
their suitability in hydropower development.
(1) Level of firm discharge
While it is difficult to judge the suitability for development based on the absolute
volume of firm discharge, a potential site with a relatively high level of firm discharge
is more favourable site for a micro-hydro plant designed to supply power throughout the
year.
Figure 2.4.2 shows the relation of specific firm discharge and the ratio of firm discharge
to maximum discharge (Qmax/QF: refer to the figure below) in existing small-scale
hydropower plants. Generally, the Qmax/QF values of micro hydropower plant for rural
electrification are shown about 1.0. This is meaning that the maximum discharges of
micro hydropower plants are the same as the firm discharge. This is because constant
electric power through a year is required to the micro hydropower plant for the rural
electrification program. And the specific firm discharge in the Qmax/QF range are
0.8~2.0 m3/s/100km2. The difference of vegetation of the catchment area and the
annual precipitation cause this difference. For the initial identification of potential site,
the maximum discharge/firm discharge will be set as 1.0 m3/s/100km2 . However,
the discharge set up in here should be reviewed at the time of site reconnaissance.
Qmax
Duration Curve
QF
Riv
erfl
ow(m
3 /s)
Days

Manual for Micro-Hydro Power Development Chapter 2
- 2-8 -
Fig 2.4.2 Relationship between firm discharge/maximum discharge ratio
and specific firm discharge
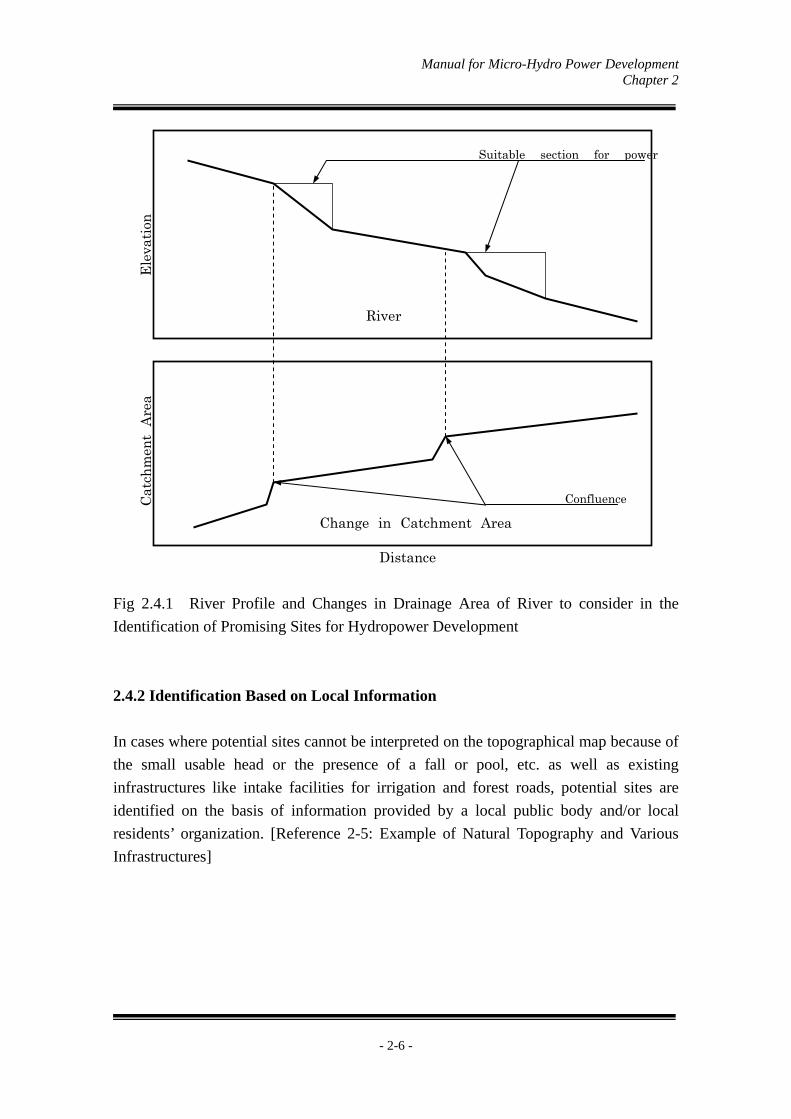
(2) L/H [ratio between waterway length (L) and total head (H)]
A site with a smaller L/H value is more advantageous for small-scale hydropower.
Figure 2.4.3 shows the relation of the ratio between the total head (H) and the waterway
length (L) (L/H) among existing small-scale hydropower sites where the total head is
not less than 10 m (the minimum head which can be interpreted on an existing
topographical map). As clearly indicated in the figure, the L/H of existing sites is
generally not higher than 40 or is an average of 25.
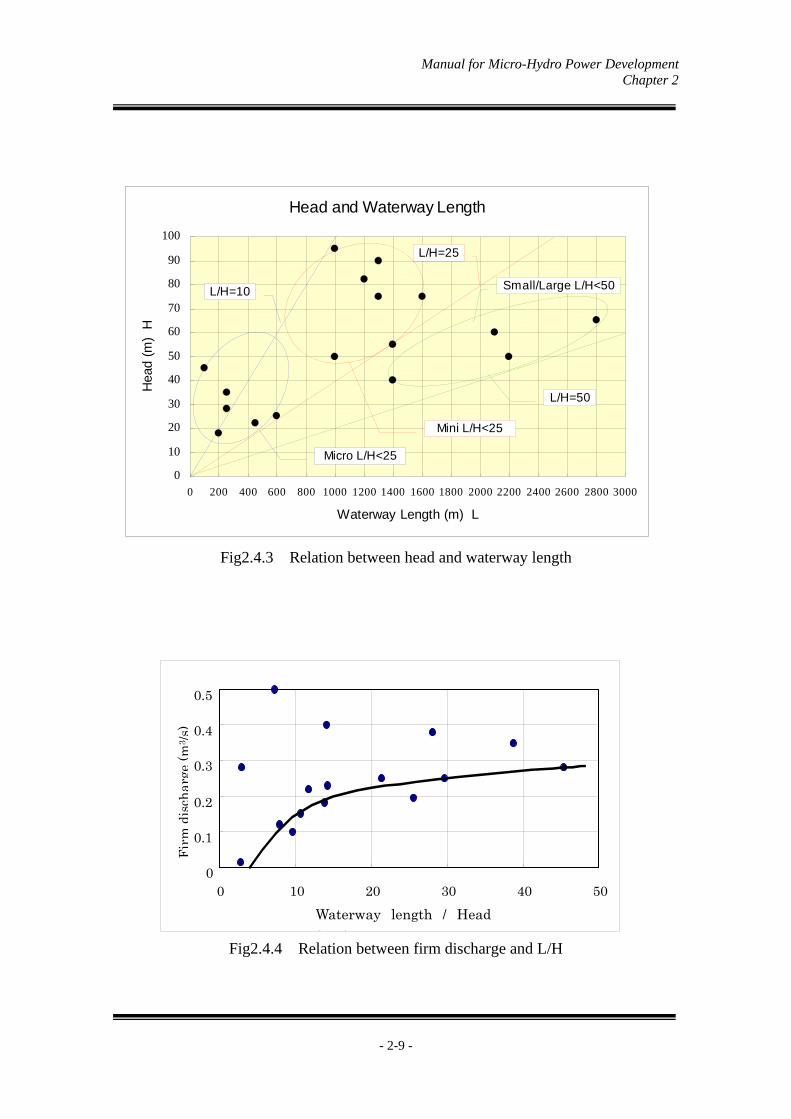
Figure 2.4.4 shows the relation of firm discharge and L/H, the sites with smaller firm
discharge has smaller L/H. The L/H of sites with less than 0.2m3/s firm discharge is
approximately below 15.
Maximum and Firm Discharge in Hydropower Plant
0.0
0.2
0.4
0.6
0.8
1.0
1.2
1.4
1.6
1.8
2.0
2.2
0 10 20 30 40 50 60 70 80 90 100 110
Percentage of Firm/Maximum Discharge (%)
Un
it F
irm
Dis
cha
rge
(m3 /s
/10
0km
2 )
Large
SmallMini
Micro
Manual for Micro-Hydro Power Development Chapter 2
- 2-9 -
Fig2.4.3 Relation between head and waterway length
Fig2.4.4 Relation between firm discharge and L/H
0
0.1
0.2
0.3
0.4
0.5
0 10 20 30 40 50
Waterway length / Head
( )
Fir
mdi
sch
arge
(m3 /
s)
Head and Waterway Length
0
10
20
30
40
50
60
70
80
90
100
0 200 400 600 800 1000 1200 1400 1600 1800 2000 2200 2400 2600 2800 3000
Waterway Length (m) L
Hea
d (m
) H
Micro L/H<25
Mini L/H<25
Small/Large L/H<50L/H=10
L/H=25
L/H=50
Manual for Micro-Hydro Power Development Chapter 2 (Reference)
- 2-10 -
[Ref. 2-1 Relationship between transmission line distance and voltage drop]
Per
mis
sibl
e vo
ltage
dro
p ra
tio
Voltage drop ratio (%)
Voltage drop ratio (%)
Per
mis
sibl
e vo
ltage
dr
op r
atio
Dis
tanc
e (k
m)
Dis
tanc
e (k
m)
Rel
atio
n o
f tr
ansm
issi
on
lin
e d
ista
nce
an
d v
olt
age
dro
p I
11kV
, 300
kW
Alu
min
um
Co
nd
uct
or
Rel
atio
n o
f tr
ansm
issi
on
lin
e d
ista
nce
an
d v
olt
age
dro
p II
6.6k
V, 3
00kW
A
lum
inu
m C
on
du
cto
r
Dia
met
er o
f lin
e D
iam
eter
of l
ine

Manual for Micro-Hydro Power Development Chapter 2 (Reference)
- 2-11 -
[Ref. 2-2 Relationship between distribution line distance and voltage drop]
Dis
tanc
e (m
)
Voltage drop ratio (%)
Per
mis
sibl
e vo
ltage
dr
op r
atio
Rel
atio
n o
f tr
ansm
issi
on
lin
e d
ista
nce
an
d v
olt
age
dro
p II
I
400V
, 50k
W
Alu
min
um
Co
nd
uct
or
Dia
met
er o
f lin
e
Manual for Micro-Hydro Power Development Chapter 2 (Reference)
- 2-12 -
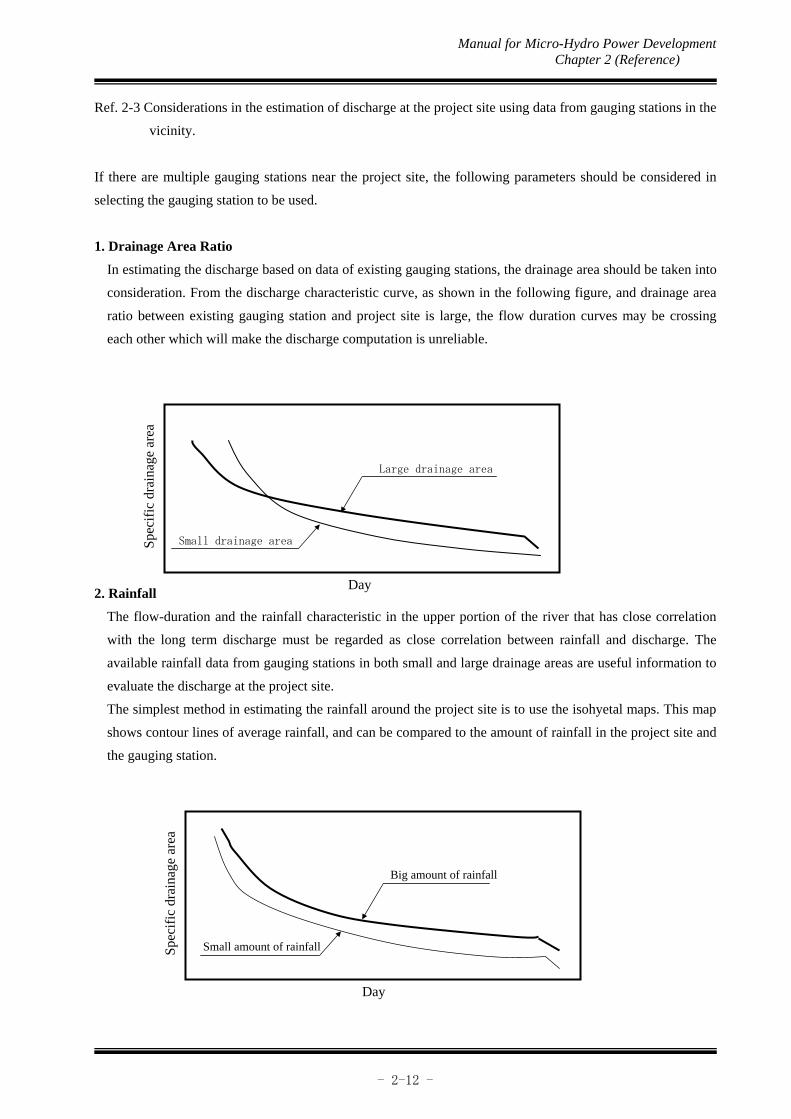
Ref. 2-3 Considerations in the estimation of discharge at the project site using data from gauging stations in the
vicinity.
If there are multiple gauging stations near the project site, the following parameters should be considered in
selecting the gauging station to be used.
1. Drainage Area Ratio
In estimating the discharge based on data of existing gauging stations, the drainage area should be taken into
consideration. From the discharge characteristic curve, as shown in the following figure, and drainage area
ratio between existing gauging station and project site is large, the flow duration curves may be crossing
each other which will make the discharge computation is unreliable.
2. Rainfall
The flow-duration and the rainfall characteristic in the upper portion of the river that has close correlation
with the long term discharge must be regarded as close correlation between rainfall and discharge. The
available rainfall data from gauging stations in both small and large drainage areas are useful information to
evaluate the discharge at the project site.
The simplest method in estimating the rainfall around the project site is to use the isohyetal maps. This map
shows contour lines of average rainfall, and can be compared to the amount of rainfall in the project site and
the gauging station.
Large drainage area
Day
Spe
cifi
c dr
aina
ge a
rea
Small drainage area
Big amount of rainfall
Small amount of rainfall
Day
Spe
cifi
c dr
aina
ge a
rea
Manual for Micro-Hydro Power Development Chapter 2 (Reference)
- 2-13 -
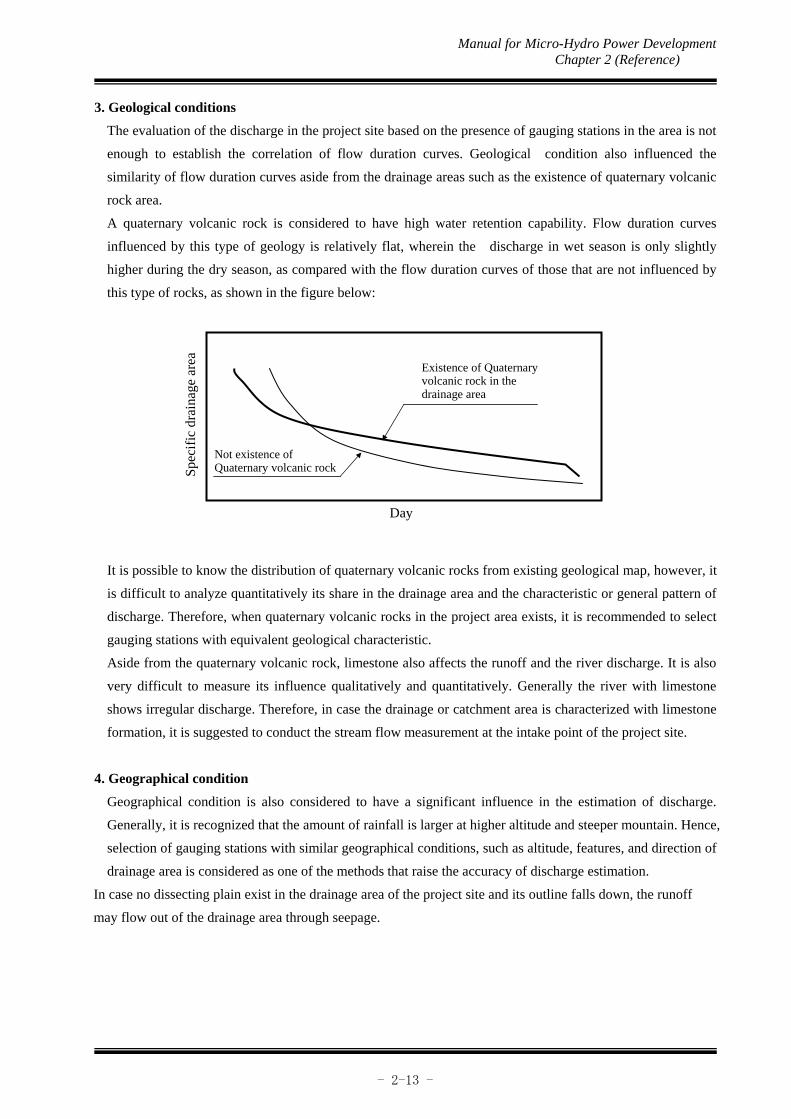
3. Geological conditions
The evaluation of the discharge in the project site based on the presence of gauging stations in the area is not
enough to establish the correlation of flow duration curves. Geological condition also influenced the
similarity of flow duration curves aside from the drainage areas such as the existence of quaternary volcanic
rock area.
A quaternary volcanic rock is considered to have high water retention capability. Flow duration curves
influenced by this type of geology is relatively flat, wherein the discharge in wet season is only slightly
higher during the dry season, as compared with the flow duration curves of those that are not influenced by
this type of rocks, as shown in the figure below:
It is possible to know the distribution of quaternary volcanic rocks from existing geological map, however, it
is difficult to analyze quantitatively its share in the drainage area and the characteristic or general pattern of
discharge. Therefore, when quaternary volcanic rocks in the project area exists, it is recommended to select
gauging stations with equivalent geological characteristic.
Aside from the quaternary volcanic rock, limestone also affects the runoff and the river discharge. It is also
very difficult to measure its influence qualitatively and quantitatively. Generally the river with limestone
shows irregular discharge. Therefore, in case the drainage or catchment area is characterized with limestone
formation, it is suggested to conduct the stream flow measurement at the intake point of the project site.
4. Geographical condition
Geographical condition is also considered to have a significant influence in the estimation of discharge.
Generally, it is recognized that the amount of rainfall is larger at higher altitude and steeper mountain. Hence,
selection of gauging stations with similar geographical conditions, such as altitude, features, and direction of
drainage area is considered as one of the methods that raise the accuracy of discharge estimation.
In case no dissecting plain exist in the drainage area of the project site and its outline falls down, the runoff
may flow out of the drainage area through seepage.
Existence of Quaternaryvolcanic rock in the drainage area
Day
Spe
cifi
c dr
aina
ge a
rea
Not existence of Quaternary volcanic rock

Manual for Micro-Hydro Power Development Chapter 2 (Reference)
- 2-14 -
[Ref. 2-4 Method of river flow by the water balance model of drainage area]
If there are no discharge observation data and only rainfall data is available, it is possible to estimate river
discharge from the water balance data of the drainage area.
1. Calculation method
(1) Water balance of the drainage area
The relation of rainfall, runoff (direct runoff, base runoff), and evaporation is indicated by the viewpoint of
annual water balance as shown in the formula below. In this case, pooling of drainage area and inflow and
runoff from/to other drainage area are not necessary.
P = R + Et
= Rd + Rb + Et
where,
P : Annual rainfall (mm)
R : Annual runoff (mm)
Rd : Annual direct runoff (mm)
Rb : Annual base runoff (mm)
Et : Annual evaporation (mm)
Runoff (R) is obtained from calculated evaporation (Et) by the presumption formula and observed rainfall
(P).
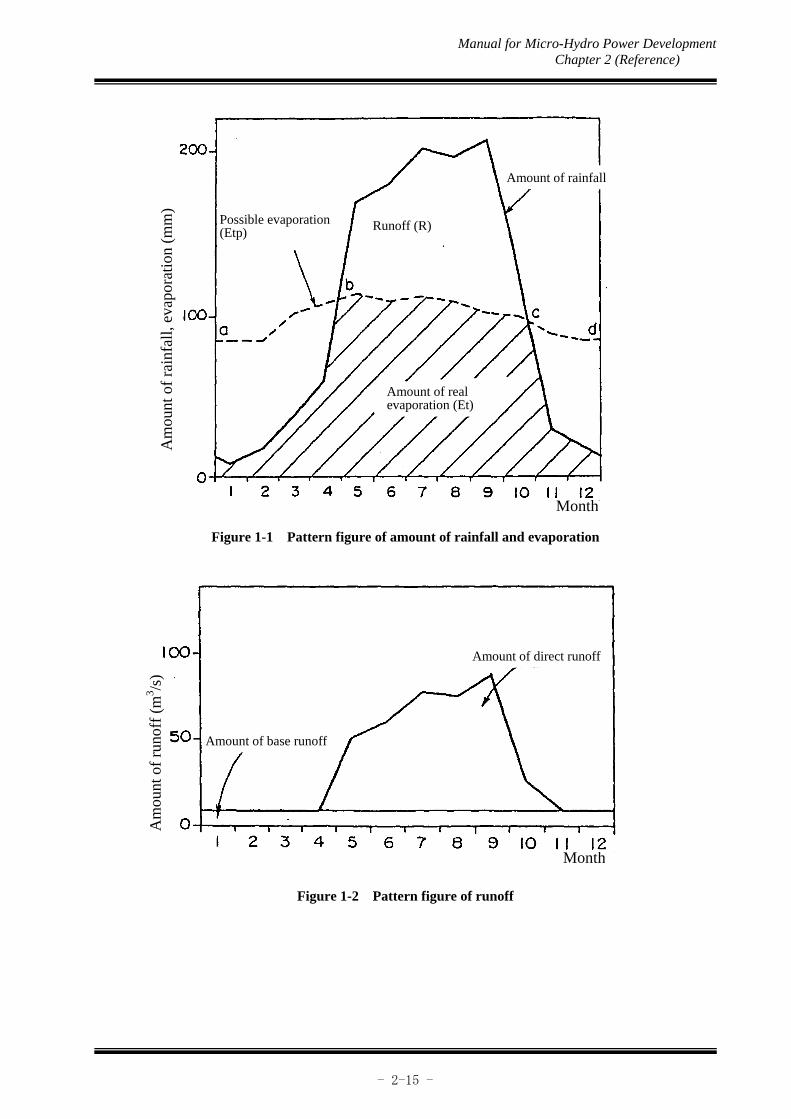
A pattern figure of the relation of rainfall (R), possible evaporation (Etp), and real evaporation (Et) is shown
Figure 1-1. Indicated as diagonal line is real evaporation, and area above line b-c is river runoff including
sub-surface water. Possible evaporation (a-b-c-d) is obtained by presumption formula.
(2) Direct runoff and base runoff
A pattern of annual runoff is shown Figure 1-2. The runoff is provided from sub-surface water, and it
contained base runoff with less seasonal fluctuation and direct runoff wherein the rainfall immediately
becomes the runoff. The ratio of sub-surface water to annual runoff (R) is shown in Table 1-1. Where, Rg = Rb,
Rb / R = 0.25 constant, and the base runoff is taken as constant.
Manual for Micro-Hydro Power Development Chapter 2 (Reference)
- 2-15 -
Figure 1-1 Pattern figure of amount of rainfall and evaporation
Figure 1-2 Pattern figure of runoff
Amount of rainfall
Amount of real evaporation (Et)
Possible evaporation (Etp) Runoff (R)
Am
ount
of
rain
fall
, eva
pora
tion
(m
m)
Month
Am
ount
of
runo
ff (
m3 /s
)
Month
Amount of direct runoff
Amount of base runoff

Manual for Micro-Hydro Power Development Chapter 2 (Reference)
- 2-16 -
Table 1-1 World water balance model
(Note) Source: Lvovich 1973
Data of Japan from Ministry of Land, Infrastructure and Transport
(3) Calculation of possible evaporation
The calculation formulas are Blaney-Criddle formula, Penman formula, and Thornthwaite formula etc. Herein,
Blaney-Criddle formula was used which is the simplest method using the longitude and temperature of the
project site. The observed value of evaporation from free water surface was also considered.
(a) Calculation method
① Blaney-Criddle formula
where,
u : Monthly evaporation (mm)
K : Monthly coefficient of vegetation
P : Monthly rate of annual sunshine (%)
t : Monthly average temperature (℃)
② Monthly average temperature and monthly rate of annual sunshine
・Monthly average temperature ; Using temperature at the drainage area of dam site
・Monthly rate of annual sunshine ; Obtained by the latitude at the drainage area of dam site
In the northern hemisphere, use Table 1-2, and in the southern hemisphere, use Table 1-3.
③ K value depends on the vegetation condition. Herein, a constant of 0.6 was used.
(b) Example of calculation
① Conditions : Position of drainage area lat. 16゜N
② Calculation of possible evaporation : Table 1-4
u = K・P・ 100
( 45.7t + 813 )
Area Asia Africa North America South America Europe Australia JapanRainfall(P) 726 686 670 1648 734 736 1788Runoff(R) 293 139 287 583 319 226 1197 Direct runoff (Rd) 217 91 203 373 210 172 - Subsoilwater 76 48 84 210 109 54 -Evaporation(Et) 433 547 383 1065 415 510 597
Rg / R 26 35 32 36 34 24 -

Manual for Micro-Hydro Power Development Chapter 2 (Reference)
- 2-17 -
(4) Calculation of evaporation
It is shown in Table 1-4, the monthly evaporations are obtained by lower value of rainfall or possible
evaporation.
(5) Computation of monthly runoff data
a) Computation by the procedure shown in Table 1-5.
b) Derivation of the monthly mean discharge data at the dam site by the following formula.
where,
Q (i) : Monthly mean discharge at dam site in ‘i (month)’ (m3/s)
CA : Drainage area (km2)
n : Number of days in the month
The discharge for the drainage area of 300 km2 is shown in Table 1-5.
In addition, the ratio of the base runoff to the total runoff (25%) and the monthly distribution of base
runoff (constant) can be analyzed with regards to the characteristic of runoff at the area.
Q (i) = ×CA×106× 1000 86,400×n
Monthly runoff (④of Table 1-5 ) 1

Manual for Micro-Hydro Power Development Chapter 2 (Reference)
- 2-18 -
Table 1-2 Monthly rate of annual sunshine (Northern Hemisphere) (%)
North Jan. Feb. Mar. Apr. May Jun. Jul. Aug. Sep. Oct. Nov. Dec.
Latitude
65 3.52 5.13 7.96 9.97 12.72 14.15 13.59 11.18 8.55 6.53 4.08 2.6264 3.81 5.27 8.00 9.92 12.50 13.63 13.26 11.08 8.56 6.63 4.32 3.0263 4.07 5.39 8.04 9.86 12.29 13.24 12.97 10.97 8.56 6.73 4.52 3.3662 4.31 5.49 8.07 9.80 12.11 12.92 12.73 10.87 8.55 6.80 4.70 3.6561 4.51 5.58 8.09 9.74 11.94 12.66 12.51 10.77 8.55 6.88 4.86 3.91
60 4.70 5.67 8.11 9.69 11.78 12.41 12.31 10.68 8.54 6.95 5.02 4.1459 4.86 5.76 8.13 9.64 11.64 12.19 12.13 10.60 8.53 7.00 5.17 4.3558 5.02 5.84 8.14 9.59 11.50 12.00 11.96 10.52 8.53 7.06 5.30 4.5457 5.17 5.91 8.15 9.53 11.38 11.83 11.81 10.44 8.52 7.13 5.42 4.7156 5.31 5.98 8.17 9.48 11.26 11.68 11.67 10.36 8.52 7.18 5.52 4.87
55 5.44 6.04 8.18 9.44 11.15 11.53 11.54 10.29 8.51 7.23 5.63 5.0254 5.56 6.10 8.19 9.40 11.04 11.39 11.42 10.22 8.50 7.28 5.74 5.1653 5.68 6.16 8.20 9.36 10.94 11.26 11.30 10.16 8.49 7.32 5.83 5.3052 5.79 6.22 8.21 9.32 10.85 11.14 11.19 10.10 8.48 7.36 5.92 5.4251 5.89 6.27 8.23 9.28 10.76 11.02 11.09 10.05 8.47 7.40 6.00 5.54
50 5.99 6.32 8.24 9.24 10.68 10.92 10.99 9.99 8.46 7.44 6.08 5.6548 6.17 6.41 8.26 9.17 10.52 10.72 10.81 9.89 8.45 7.51 6.24 5.8546 6.33 6.50 8.28 9.11 10.38 10.53 10.65 9.79 8.43 7.58 6.37 6.0544 6.48 6.57 8.29 9.05 10.25 10.39 10.49 9.71 8.41 7.64 6.50 6.2242 6.61 6.65 8.30 8.99 10.13 10.24 10.35 9.62 8.40 7.70 6.62 6.39
40 6.75 6.72 8.32 8.93 10.01 10.09 10.22 9.55 8.39 7.75 6.73 6.5438 6.87 6.79 8.33 8.89 9.90 9.96 10.11 9.47 8.37 7.80 6.83 6.6836 6.98 6.85 8.35 8.85 9.80 9.82 9.99 9.41 8.36 7.85 6.93 6.8134 7.10 6.91 8.35 8.80 9.71 9.71 9.88 9.34 8.35 7.90 7.02 6.9332 7.20 6.97 8.36 8.75 9.62 9.60 9.77 9.28 8.34 7.95 7.11 7.05
30 7.31 7.02 8.37 8.71 9.54 9.49 9.67 9.21 8.33 7.99 7.20 7.1628 7.40 7.07 8.37 8.67 9.46 9.39 9.58 9.17 8.32 8.02 7.28 7.2726 7.49 7.12 8.38 8.64 9.37 9.29 9.49 9.11 8.32 8.06 7.36 7.3724 7.58 7.16 8.39 8.60 9.30 9.19 9.40 9.06 8.31 8.10 7.44 7.4722 7.67 7.21 8.40 8.56 9.22 9.11 9.32 9.01 8.30 8.13 7.51 7.56
20 7.75 7.26 8.41 8.53 9.15 9.02 9.24 8.95 8.29 8.17 7.58 7.6518 7.83 7.31 8.41 8.50 9.08 8.93 9.16 8.90 8.29 8.20 7.65 7.7416 7.91 7.35 8.42 8.47 9.01 8.85 9.08 8.85 8.28 8.23 7.72 7.8314 7.98 7.39 8.43 8.43 8.94 8.77 9.00 8.80 8.27 8.27 7.79 7.9312 8.06 7.43 8.44 8.40 8.87 8.69 8.92 8.76 8.26 8.31 7.85 8.01
10 8.14 7.47 8.45 8.37 8.81 8.61 8.85 8.71 8.25 8.34 7.91 8.098 8.21 7.51 8.45 8.34 8.74 8.53 8.78 8.66 8.25 8.37 7.98 8.186 8.28 7.55 8.46 8.31 8.68 8.45 8.71 8.62 8.24 8.40 8.04 8.264 8.36 7.59 8.47 8.28 8.62 8.37 8.64 8.58 8.23 8.43 8.10 8.342 8.43 7.63 8.49 8.25 8.55 8.29 8.57 8.53 8.22 8.46 8.16 8.42
0 8.50 7.67 8.49 8.22 8.49 8.22 8.50 8.49 8.21 8.49 8.22 8.50

Manual for Micro-Hydro Power Development Chapter 2 (Reference)
- 2-19 -
Table 1-3 Monthly rate of annual sunshine (Southern Hemisphere) (%)
(Note) Southern part more than lat. 50°S will be calculated using example from Table 1-2. Concretely,
the monthly rate of southern latitude is corresponding to below showing months of northern
latitude.
Southern lat. - Northern lat. Southern lat. - Northern lat.
January - July July - January
February - August August - February
March - September September - March
April - October October - April
May - November November - May
June - December December - June
South Jan. Feb. Mar. Apr. May Jun. Jul. Aug. Sep. Oct. Nov. Dec.Latitude
0 8.50 7.67 8.49 8.22 8.49 8.22 8.50 8.49 8.21 8.49 8.22 8.502 8.55 7.71 8.49 8.19 8.44 8.17 8.43 8.44 8.20 8.52 8.27 8.554 8.64 7.76 8.50 8.17 8.39 8.08 8.20 8.41 8.19 8.56 8.33 8.656 8.71 7.81 8.50 8.12 8.30 8.00 8.19 8.37 8.18 8.59 8.38 8.748 8.79 7.84 8.51 8.11 8.24 7.91 8.13 8.12 8.18 8.62 8.47 8.84
10 8.85 7.86 8.52 8.09 8.18 7.84 8.11 8.28 8.18 8.65 8.52 8.9012 8.91 7.91 8.53 8.06 8.15 7.79 8.08 8.23 8.17 8.67 8.58 8.9514 8.97 7.97 8.54 8.03 8.07 7.70 7.08 8.19 8.16 8.69 8.65 9.0116 9.09 8.02 8.56 7.98 7.96 7.57 7.94 8.14 8.14 8.78 8.72 9.1718 9.18 8.06 8.57 7.93 7.89 7.50 7.88 8.10 8.14 8.80 8.80 9.24
20 9.25 8.09 8.58 7.92 7.83 7.41 7.73 8.05 8.13 8.83 8.85 9.3222 9.36 8.12 8.58 7.89 7.74 7.30 7.76 8.00 8.13 8.86 8.90 9.3824 9.44 8.17 8.59 7.87 7.65 7.24 7.68 7.95 8.12 8.89 8.96 9.4726 9.52 8.28 8.60 7.81 7.56 7.07 7.49 7.90 8.11 8.94 9.10 9.6128 9.61 8.31 8.61 7.79 7.49 6.99 7.40 7.85 8.10 8.97 9.19 9.74
30 9.69 8.33 8.63 7.75 7.43 6.94 7.30 7.80 8.09 9.00 9.24 9.8032 9.76 8.36 8.64 7.70 7.34 6.85 7.20 7.73 8.08 9.04 9.31 9.8734 9.88 8.41 8.65 7.68 7.25 6.73 7.10 7.69 8.06 9.07 9.38 9.9936 10.06 8.53 8.67 7.61 7.16 6.59 6.99 7.59 8.06 9.15 9.51 10.2138 10.14 8.61 8.68 7.59 7.07 6.46 6.87 7.51 8.05 9.19 9.60 10.34
40 10.24 8.65 8.70 7.54 6.96 6.33 6.73 7.46 8.04 9.23 9.69 10.4242 10.39 8.72 8.71 7.49 6.85 6.20 6.60 7.39 8.01 9.27 9.79 10.5744 10.52 8.81 8.72 7.44 6.73 6.04 6.45 7.30 8.00 9.34 9.91 10.7246 10.68 8.88 8.73 7.39 6.61 5.87 6.30 7.21 7.98 9.41 10.03 10.9048 10.85 8.98 8.76 7.32 6.45 5.69 6.13 7.12 7.96 9.47 10.17 11.09
50 11.03 9.06 8.77 7.25 6.31 5.48 5.98 7.03 7.95 9.53 10.32 11.30
Manual for Micro-Hydro Power Development Chapter 2 (Reference)
- 2-20 -
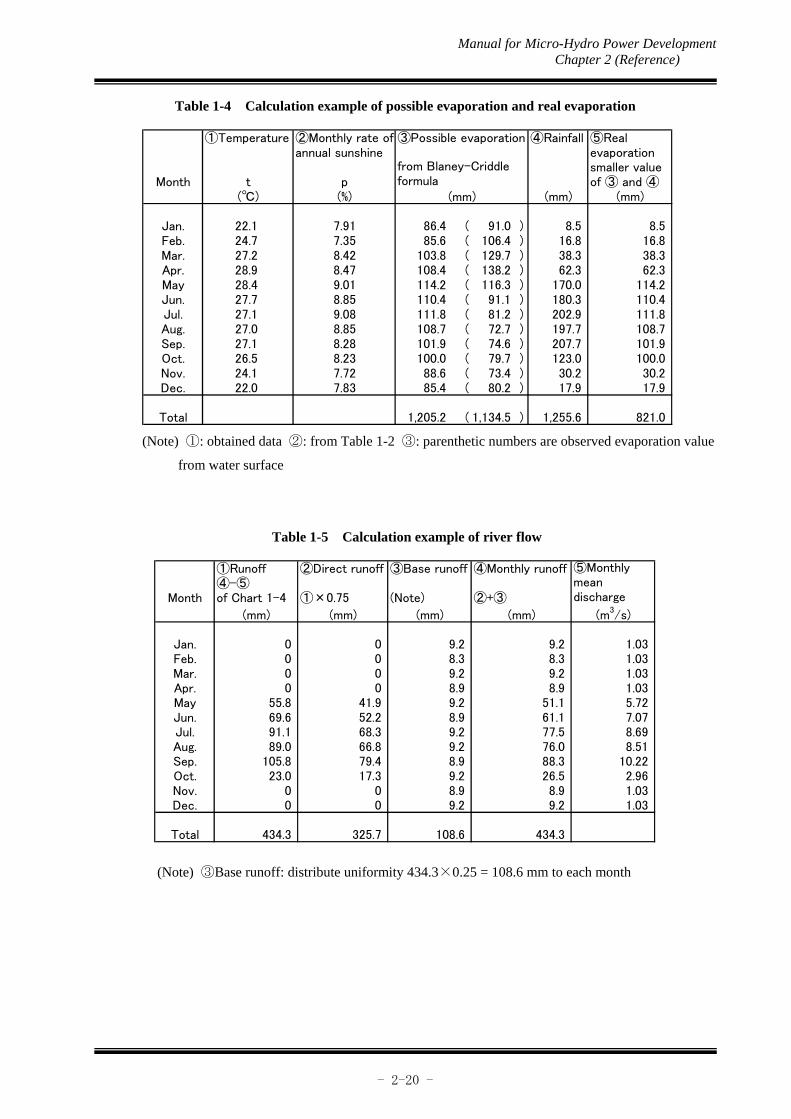
Table 1-4 Calculation example of possible evaporation and real evaporation
(Note) ①: obtained data ②: from Table 1-2 ③: parenthetic numbers are observed evaporation value
from water surface
Table 1-5 Calculation example of river flow
(Note) ③Base runoff: distribute uniformity 434.3×0.25 = 108.6 mm to each month
①Temperature ②Monthly rate ofannual sunshine
④Rainfall ⑤Realevaporation
Month t psmaller valueof ③ and ④
(℃) (%) (mm) (mm)
Jan. 22.1 7.91 86.4 ( 91.0 ) 8.5 8.5Feb. 24.7 7.35 85.6 ( 106.4 ) 16.8 16.8Mar. 27.2 8.42 103.8 ( 129.7 ) 38.3 38.3Apr. 28.9 8.47 108.4 ( 138.2 ) 62.3 62.3May 28.4 9.01 114.2 ( 116.3 ) 170.0 114.2Jun. 27.7 8.85 110.4 ( 91.1 ) 180.3 110.4Jul. 27.1 9.08 111.8 ( 81.2 ) 202.9 111.8Aug. 27.0 8.85 108.7 ( 72.7 ) 197.7 108.7Sep. 27.1 8.28 101.9 ( 74.6 ) 207.7 101.9Oct. 26.5 8.23 100.0 ( 79.7 ) 123.0 100.0Nov. 24.1 7.72 88.6 ( 73.4 ) 30.2 30.2Dec. 22.0 7.83 85.4 ( 80.2 ) 17.9 17.9
Total 1,205.2 ( 1,134.5 ) 1,255.6 821.0
③Possible evaporation
from Blaney-Criddleformula
(mm)
①Runoff ②Direct runoff ③Base runoff ④Monthly runoff
Month④-⑤of Chart 1-4 ①×0.75 (Note) ②+③
(mm) (mm) (mm) (mm) (m3/s)
Jan. 0 0 9.2 9.2 1.03Feb. 0 0 8.3 8.3 1.03Mar. 0 0 9.2 9.2 1.03Apr. 0 0 8.9 8.9 1.03May 55.8 41.9 9.2 51.1 5.72Jun. 69.6 52.2 8.9 61.1 7.07Jul. 91.1 68.3 9.2 77.5 8.69Aug. 89.0 66.8 9.2 76.0 8.51Sep. 105.8 79.4 8.9 88.3 10.22Oct. 23.0 17.3 9.2 26.5 2.96Nov. 0 0 8.9 8.9 1.03Dec. 0 0 9.2 9.2 1.03
Total 434.3 325.7 108.6 434.3
⑤Monthlymeandischarge

Manual for Micro-Hydro Power Development Chapter 2 (Reference)
- 2-21 -
[Ref. 2-5 Example of Micro-hydro Development Scheme Using Natural Topography and Various Man-Made
Structures]
1. Using existing irrigation channel and naturally formed pool downstream of fall
River
Headrace
River
Power house
Penstock Spillway
Irrigation channel Headtank Screen
Intake weir
Water fall

Manual for Micro-Hydro Power Development Chapter 2 (Reference)
- 2-22 -
2. Intake water from two rivers
Ⅱ-2-5入る
Headrace
Intake weir
River
Intake weir
HeadtankScreen
Penstock
Power houseTailrace
River
Manual for Micro-Hydro Power Development Chapter 2 (Reference)
- 2-23 -
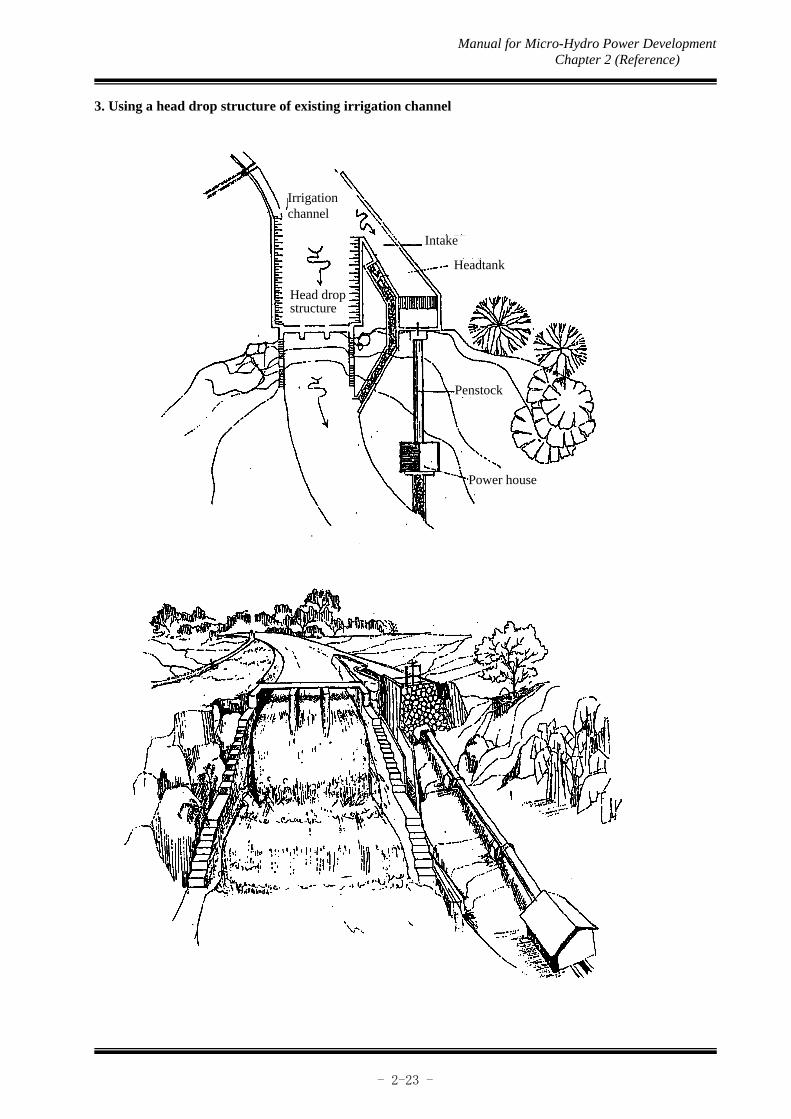
3. Using a head drop structure of existing irrigation channel
Ⅱ-2-6入る
Intake
Headtank
Irrigation channel
Head drop structure
Penstock
Power house

Manual for Micro-Hydro Power Development Chapter 2 (Reference)
- 2-24 -
4. Using a head drop structure of existing irrigation channel
Ⅱ-2-7入る
River
Intake
Headrace
Road Irrigation channel
Headtank
Penstock
Power house
Tailrace

Manual for Micro-Hydro Power Development Chapter 3
- 3-1 -
CHAPTER 3 SITE RECONNAISSANCE
3.1 Objective of Site Reconnaissance
The objective of site reconnaissance for micro-hydro is to investigate potential sites and
supply area in order to evaluate the feasibility of projects and get information for
electrification planning. One of the most important activities in site reconnaissance is to
measure water discharge and head that could be utilized for micro-hydropower
generation. Investigations of intake site, waterway route, powerhouse site and
transmission route etc. are also conducted to assess the feasibility of project sites.
Power demand survey is also important in the planning of the electrification system.
Socio-economic data such as number of households and public facilities in supply area,
availability of local industries which will use electricity, solvency of local people for
electricity and the acceptability of local people to the electrification scheme are
gathered during the reconnaissance survey.
3.2 Preparation for Site Reconnaissance
To achieve effective and fruitful site reconnaissance, it is important to prepare for site
reconnaissance such as gathering of available information, devise sufficient plan and
schedule of survey activities in advance.
3.2.1 Information gathering and preparation
As advance information, 1/50,000 topographic maps are prepared to check the
topography of the target site and villages, the catchment area, village’s distribution and
access road. More accurate information on site accessibility could be collected by
contacting local people concerned.
Copies of 1/50,000 topographic maps and route maps enlarged by 200 to 400% are
prepared for the fieldwork.
Check list and interview sheet are also prepared for each site reconnaissance.

Manual for Micro-Hydro Power Development Chapter 3
- 3-2 -
3.2.2 Planning of preliminary site reconnaissance
Although it may be required to deviate from original plan and schedule in accordance
with site condition, it is important to make sufficient plan and schedule for site
reconnaissance activities in advance. It is also necessary to coordinate with local
officials concerned to insure safety and successful conduct of the reconnaissance
activities. Since most of micro-hydro sites are located in mountainous and isolated areas,
it requires longer time to conduct site reconnaissance activities. Therefore, sufficient
schedule should be considered to have enough time for the fieldwork. Also,
measurement and other activities for site reconnaissance should be taken into account. A
check list or interview sheet should be prepared beforehand to efficiently perform
necessary activities of site reconnaissance.
3.2.3 Necessary equipment for preliminary site reconnaissance
Necessary equipment for preliminary site reconnaissance depends on purpose and
accuracy and site condition. Basic equipment is as follows:
Table 3.2.1 Check sheet of basic equipment for site reconnaissance as an example
Equipment Equipment
○ Route map ○ Altimeter
○ Topographic map ○ GPS (portable type)
○ Reconnaissance schedule ○ Camera, Film
○ Check list ○ Current meter
○ Interview sheet ○ Distance meter, measuring tape
Geological map ○ Hand level
Aerial photograph ○ Convex scale (2-3m)
Related reports Hammer
Map
, She
et
Clinometer
○ Field notebook Knife
○ Scale Scoop
○ Pencil ○ Torch, Flashlight
○ Eraser Sampling baggage
○ Color pencil Label
Section paper ○ Compass
Stop watch
Stat
iona
ry
Equ
ipm
ent
Battery
Notes: ○: necessary equipment for preliminary site reconnaissance

Manual for Micro-Hydro Power Development Chapter 3
- 3-3 -
3.3 Survey to Outline the Project Site
During the reconnaissance at the proposed site of power generating facilities and around
the power demand area, a survey is conducted on the following items:
(1) Access conditions
The equipment and machinery used for the construction and operation of a micro-
hydropower plant are smaller and lighter than those used for an ordinary hydropower
plant and it may be possible in some cases that such equipment and machinery can be
brought to the site either manually or using simple vehicles.
Given the smaller capacity of the power generated by a micro-hydropower plant, careful
consideration is required in the use of transportation method and access other than the
use of an existing road or vehicle since the construction of a new access road could be a
factor that would considerably reduces the economy of a project. In the case of a
mountainous area, there may be an abandoned road (previously used for the hauling of
cut trees, etc.) which is difficult to find because it has been covered by vegetation and it
is important to interview local residents on the existence of such a road.
(2) Situation of existing system and future plan
Even for a project site in which the development of an individual system is assumed, a
survey should be conducted on the tail end location, route and voltage, etc. of the
existing system and also on the availability of extension and rehabilitation plans for the
said system.
(3) Situation of river water utilization
The existence of facilities utilizing the river flow, the flow volume and any relevant
future plans regarding the river from which a planned micro-hydropower plant will
draw water should also be surveyed. At the project formulation stage, the situation of
the portion or section of the river for water utilization should be surveyed taking into
consideration the assumed recession section and the possibility of changes in the
position of the intake and the waterway route.
When a fall or steep valley is to be used for power generation, local information on the
use of such a fall or valley should be obtained together with a survey on the relevant
legal regulations.

Manual for Micro-Hydro Power Development Chapter 3
- 3-4 -
(4) Existence of other development plans/projects
A survey should be conducted on the existence of other development plans/projects in
terms of roads, farmland, housing and tourism, etc. which may affect the planned
project site and/or its surrounding area.
(5) Civil structures in adjacent area and materials used
Most civil structures of a small-scale hydropower plant are similar to those of irrigation
facilities and road drainage facilities. The materials used for these structurers are often
available or can be obtained near the planned project site.
The use of constructors, human resources and local materials involved in these civil
structures is important from the viewpoint of reducing the construction cost,
contribution to the local economy and ensuring easy maintenance and repair. Hence, a
survey should be conducted on similar civil structures in the adjacent area of a project
site to obtain useful reference materials for project planning and design.
(6) Presence of natural topographical features and existing structures usable for power
generation
When an existing irrigation channel or similar is used (including widening and/or
reinforcement) as a waterway for power station, it is necessary to check the
cross-section, gradient and current water conveyance volume, etc. of such a channel.
(7) Existence of important ground features and vegetation
Even a small-scale hydropower plant necessitates some alteration of the local
topography. When important ground features and/or vegetation exist along the planned
route of the waterway, they must be carefully dealt with. For this purpose, their
locations and conditions, etc. should be duly noted for discussions with concerned
parties such as the landowner(s) and representatives of the local government.
Manual for Micro-Hydro Power Development Chapter 3
- 3-5 -
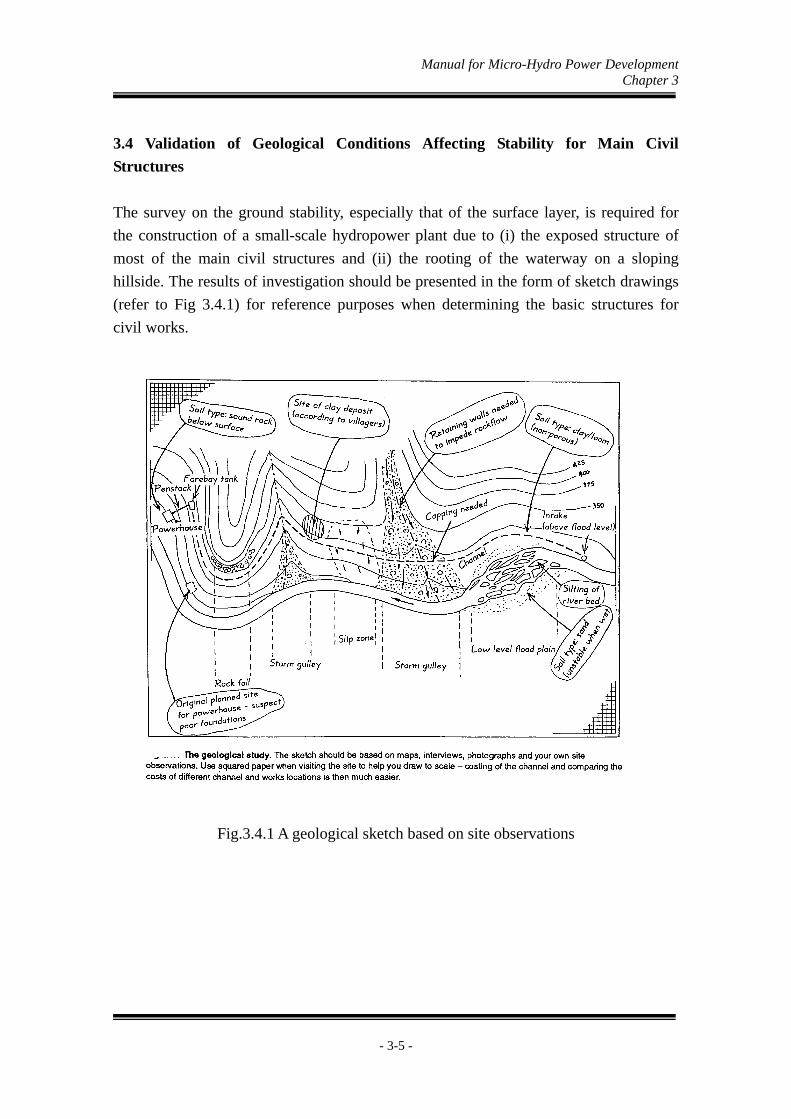
3.4 Validation of Geological Conditions Affecting Stability for Main Civil
Structures
The survey on the ground stability, especially that of the surface layer, is required for
the construction of a small-scale hydropower plant due to (i) the exposed structure of
most of the main civil structures and (ii) the rooting of the waterway on a sloping
hillside. The results of investigation should be presented in the form of sketch drawings
(refer to Fig 3.4.1) for reference purposes when determining the basic structures for
civil works.
Fig.3.4.1 A geological sketch based on site observations

Manual for Micro-Hydro Power Development Chapter 3
- 3-6 -
3.5 Survey on Locations of Civil Structures
Field reconnaissance by the hydropower specialist is important to establish a waterway
route based on an existing topographical map and other relevant information for the
planning of a micro-hydropower plant. The results of the reconnaissance survey will
determine if the project will proceed or not.
The items to be checked during this survey are listed below. It is necessary to repeat the
field reconnaissance in line with the progress of the planning and design. When
uncertainties emerge, particularly at the design stage, field verification is necessary.
Moreover, there is a need to keep the expected demand in mind. Therefore, this survey
should be conducted in parallel with the demand survey.
It is important not only to select suitable locations for such individual facilities as the
intake weir and waterway, etc. but also to carefully examine the locations of their tie-in
sites.
For the development of micro-hydro, the maximum use of natural topographical
features is important from the viewpoint of cost reduction. It is, therefore, necessary to
conduct the survey based on a full understanding of the items discussed in “Chapter
4,4.3 Selection of Location for Main Civil Structures”.

Manual for Micro-Hydro Power Development Chapter 3
- 3-7 -
3.6 Measurement of River Flow
(1) Necessity of Measurement of River Flow
(2)
The estimated river flow at a project site is considered reasonably reliable if it is based
on data from a nearby gauging station. As such, it may not be necessary to conduct
actual discharge measurement at the project site.
However, when river flow data is difficult to obtain, it is preferable to measure the river
discharge in the dry season, by means of simple method, to confirm the appropriateness
of the estimated flow duration. Any stoppage of power generation due to a reduced
water flow volume significantly affects the generation of a micro-hydropower plant,
thus it is essential to check the discharge at dry season. Although it is necessary to
record the river flow for at least one year in mini hydropower development, the river
flow during the dry season should be checked even for micro hydropower development.
Fig.3.4.2 shows the Flowchart to check Minimum Flow/ Duration Curve.
Should there be a need to measure the discharge, the observation period must be
carefully determined based on past rainfall records and information relative to the
climate.
It is also necessary to check and evaluate the observation results in connection with the
characteristics (for example, drought year or wet year) of the year of observation based
on past rainfall records, etc.
The stream flow measuring method, frequency and water level observation unit can be
simplified in the following manner to reduce the survey cost.

Manual for Micro-Hydro Power Development Chapter 3
- 3-8 -
Water Level DischargeH Q
(m) (m3/s)
XXX 0.230 0.111YYY 0.550 1.734ZZZ 0.300 0.272
WWW 0.380 0.600
Date
Installation of Staff Gauge(Base Point)
Selection of MeasurementPoint
Measuring of Cross Section
Measuring of Cross SectionalArea(A)
Measuring of Velocity /Speed(V)
Calculation of Discharge(Q=A x V)
Record the water levelon Staff gauge (H)
An
oth
er d
ayat
leas
t 3
tim
esre
pea
t
DailyRecord
(Hd)
Calculation of Rating Curve
Calculation of DailyDischarge
Calculation of DurationCurve
Micro-Hydro
1
2
3
4
5
Staff Gauge
Rating Curve
0.10
0.15
0.20
0.25
0.30
0.35
0.40
0.45
0.50
0.00 0.05 0.10 0.15 0.20 0.25 0.30 0.35 0.40 0.45 0.50 0.55 0.60 0.65 0.70 0.75 0.80 0.85 0.90 0.95 1.00
Discharge (m3/s)
Wat
er L
evel
(m)
Q=9.579*H2-2.428H+0.154
Discharge of Ambangal Brook at Intake (20.2km2)
0.00.20.40.60.81.01.21.41.61.82.02.22.42.62.83.03.23.43.63.84.04.24.44.64.85.0
5/19/06 6/18/06 7/18/06 8/17/06 9/16/06 10/16/06 11/15/06 12/15/06 1/14/07 2/13/07 3/15/07 4/14/07 5/14/07 6/13/07 7/13/07
Date
Dis
char
ge (m
3/s
)
Daily DischargeDischarge of Ambangal Brook at Intake (20.2km2)
0.00.20.40.60.81.01.21.41.61.82.02.22.42.62.83.03.23.43.63.84.04.24.44.64.85.0
5/19/06 6/18/06 7/18/06 8/17/06 9/16/06 10/16/06 11/15/06 12/15/06 1/14/07 2/13/07 3/15/07 4/14/07 5/14/07 6/13/07 7/13/07
Date
Dis
char
ge (m
3/s
)
Daily Discharge
Duration Curve at Intake Site (C.A.=20.2km2)
0.00.20.40.60.81.01.21.41.61.82.02.22.42.62.83.03.23.43.63.84.04.24.44.64.85.0
0 5 10 15 20 25 30 35 40 45 50 55 60 65 70 75 80 85 90 95 100
Percentage (%)
Dis
char
ge (m
3/s
)
Fig.3.4.2 Flowchart to check Minimum Flow/ Duration Curve
Manual for Micro-Hydro Power Development Chapter 3
- 3-9 -
(2) Flow measuring method A stream flow measuring method which is appropriate for the river conditions can be adopted. [Reference 3-1: Simple method of stream flow measuring] (3) Frequency of stream flow measuring In principle, stream flow measuring should be conducted at least three times a year to analyze the relation between the water level and the discharge in the range below the assumed maximum discharge. (4) Water level observation unit A staff gauge should be set up at a point near the flow observation point where visual water level observation can be easily carried out. 3.7 Measurement of Head The head between the intake point and the headtank and the head between the headtank and the outlet point should be measured. At the initial planning stage, however, it may be sufficient to measure the head between the planned headtank location and the outlet level. While a surveying level can be used for the purpose of measuring, a more simple head measuring method may be sufficient. [Reference 3-2: Simple methods of head measuring]

Manual for Micro-Hydro Power Development Chapter 3
- 3-10 -
3.8 Demand Survey 3.8.1 Demand survey method There can be many types of power demand facilities for small-scale hydropower generation to respond to the conditions of the subject area for development. In the preparation of development plan, accurate understanding of the power demand facilities in the subject area for development is essential. What is important is to ensure the efficiency and practicality of a demand survey. It is necessary to estimate a slightly higher demand level than the assumed scale of power generation so that it would adequately respond to the scale of development as well as to the seasonal fluctuations of the power demand. 3.8.2 Factors to consider in demand survey The demand survey items are described below. When there is more than one power demand facility, each facility should be survey. (1) Location The suitable route and distance, etc. to each power demand facility should be surveyed to examine the optimal transmission and distribution lines. (2) Owners The opinions and intentions of the owners of power demand facilities regarding the introduction of a new power supply source should be clarified. (3) Types and required quality of equipment The situation of power use by equipment (for power, heating, lighting and electrical control, etc.) and the required level of accuracy (in terms of the allowable voltage fluctuation and frequency fluctuation) should be surveyed. (4) Equipment capacity, etc. The equipment capacity, power consumption level and electricity tariff (or estimated electricity tariff in the case of planning) should be surveyed.

Manual for Micro-Hydro Power Development Chapter 3
- 3-11 -
(5) Period of use Any seasonal or daily fluctuation of power use and the range of fluctuation should be surveyed. (6) Year of installation and service life The year (date) of installation of each power demand equipment and its service life or planned period of use should be surveyed. (7) Likely problems associated with power cut The likely problems and financial losses associated with a power cut to power demand facilities should be surveyed.

Manual for Micro-Hydro Power Development Chapter 3
- 3-12 -
3.9 Actual Field Survey Actual field survey for the design of structures for micro-hydropower system should be conducted after the identification of their location and route. The following should be done if necessary: (1) A proper understanding of the local topography is important for the planning of a
small-scale hydropower plant like the main exposed structure civil structures. Topographical surveying is particularly required for such structures as the intake facility, headtank and generating station, etc., each of which covers a wide area, to improve their design accuracy. In general, the accuracy of the topographical surveying around civil structures tends to be in the range of 1/100 – 1/200 for small to medium-scale hydropower plants. However, topographical surveying accuracy in the region of 1/500 should be sufficient for independent micro-hydro scheme because an error in topographical surveying hardly affects the work volume for small structures.
(2) During the implementation stage: For the waterway and access road, etc., route
surveying (center line and cross-section surveying) may be sufficient for planning and design purposes and should be effective from the viewpoint of cost reduction, particularly when the required surveying length is long. These routes must, however, be carefully determined based on the results of the field reconnaissance conducted by the planner(s).

Manual for Micro-Hydro Power Development Chapter 3 (Reference)
- 3-13 -
[Ref. 3-1 Method of stream flow measurement]
1. Using electromagnetic current meter
Generally, the current meter used for the measurement of river flow is screw type. But nowadays, an
electromagnetic current meter that doesn’t have rotating parts is available in the market. This is suitable for
measurement of river flow in a small-scale hydro site. It is lightweight, and can be measured even in shallow
river.
In case of survey for small-scale hydropower development, a simple method like the following are sufficient
for discharge measurement using electromagnetic current meter.
(1) Three-points measuring method・・・・Vm = 0.25×( V0.2 + 2V0.6 + V0.8 )
(2) Two-points measuring method ・・・・Vm = 0.50×( V0.2 + V0.8 )
(3) One-point measuring method・・・・・Vm = V0.6
(4) Surface measuring method・・・・・・Vm = 0.8×Vs
where, Vm: Mean velocity Vs: Surface velocity
V0.2: Velocity at the depth of 20% below the water surface
V0.6: Velocity at the depth of 60% below the water surface
V0.8: Velocity at the depth of 80% below the water surface
Following should be considered when selecting the point of measurement in the stream .
(1) No irregular wave and whirlpools at the surface.
(2) No subsurface flow, back-flow, and stagnation.
(3) No irregular change of water level.
(4) No crossing-over of stream line.
During measurement, the riverbed should be cleaned, if necessary.

Manual for Micro-Hydro Power Development Chapter 3 (Reference)
- 3-14 -
2. Float measuring method
Basically, float measuring method is applied during floods when measurement with current meter is not
possible. But, it is applicable during the stage where development sites are not decided yet or the current meter
is not available.
(1) Measuring method
1) Measurement should be made at the place where the axis of streambed is straight and the cross section
of the river is almost uniform.
2) Flowing distance of floats should be more than the width of river.
3)Setting transverse lines at the upstream and downstream perpendicular to the axis of streambed.
Flow-down distance (upstream and downstream lines) = L
4) Measuring the cross sectional areas at the upper and lower transverse lines to get the average value of
the cross sectional areas of flow (Amean).
Additional measurement should be made at the middle section of two lines if the cross
section of river is not uniform.
5) Floats are dropped at upstream of the upper transverse line, the time required from upper to lower
transverse line is measured.
6) Measurement should be done several times at different divisions of the river cross-section in the
transverse direction. (more than three divisions)
(2) Stream flow calculation formula
Vm = C×Vmean
C: (1) Concrete channel which cross section is uniform = 0.85
(2) Small stream where a riverbed is smooth = 0.65
(3) Shallow flow (about 0.5m) = 0.45
(4) Shallow and riverbed is not flat = 0.25
(1) (2)
Vm = 0.85×Vmean Vm = 0.65×Vmean
(3) (4)
0.5 m
Vmean
Vmean Vmean
Vm = 0.45×Vmean Vm = 0.25×Vmean
Vmean

Manual for Micro-Hydro Power Development Chapter 3 (Reference)
- 3-15 -
3. Weir measuring method
The discharge is small and the use of current meter or float measuring method is impossible, the weir as shown
below is built and discharge is measured by measuring the overflow depth at the river.
Upstream line
Downstream line
Flo
win
g di
stan
ce o
f fl
oats
(L
)
Drop line of floats
A – A’ Cross section
B – B’ Cross section
C – C’ Cross section
A – A’ C – C’ Mean Cross section

Manual for Micro-Hydro Power Development Chapter 3 (Reference)
- 3-16 -
In this method, the stream flow can be obtained by following formula.
Q = C・L・h1.5
Q:Discharge (m3/s) C:Discharge coefficient L:Opening width of weir (m)
h:Overflow depth (m)
4. Others
It is applicable to use the following method to measure smaller stream flow.
C = 1.838 ( 1 + ) ( 1 - ) h 10
0.0012 ( h/L )1/2

Manual for Micro-Hydro Power Development Chapter 3 (Reference)
- 3-17 -
Place of survey date time : water levelNo. RemarksDistance from left bankDepth of riverArea of flow section
Waterdepth Discharge
Waterdepth Discharge
Waterdepth Discharge
Waterdepth Discharge
Waterdepth Discharge
Average of Velocity (cm/s)dischage(l/s)
Survey sheet of discharge
1 2 3 4 5 6 7 8 9 10 11
50.0
40.0
30.0
20.0
10.0
Depth at point and velocity(cm, cm/s)
60.0
Cross-Section of river0.0

Manual for Micro-Hydro Power Development Chapter 3 (Reference)
- 3-18 -
[Ref. 3-2 Method of head measurement]
1. Using clear hose method
The figure below shows this method. The method is useful for low head sites, since it is cheap and reasonably
accurate. To get the head of two points, measuring the difference of water level of the water-filled clear hose at
two points. Even a man who does not have a skill of survey work can apply this method.
H1
H3
H4
H5
H6
H2
Head
H1
H3
H4
H5
H6
H2
Head
Head = H1+H2+H3+H4+H5+H6
H1 = B1-A1
B1
H1
A1
Date :
No.Hi=Bi-Ai(meters)
1 0.85
2 0.86
3 0.86
4 0.91
5 0.99
6 0.75
7 0.30
8 0.90
9 0.70
10 0.74
11 2.30
12 0.66
10.82
Location :
0.70 1.36
Total Height (meters)=
1.00 1.74
0.20 2.50
1.00 1.90
1.00 1.70
1.00 1.75
1.00 1.30
1.00 1.91
1.00 1.99
1.00 1.86
1.00 1.86
Ai(meters)
Bi(meters)
1.00 1.85
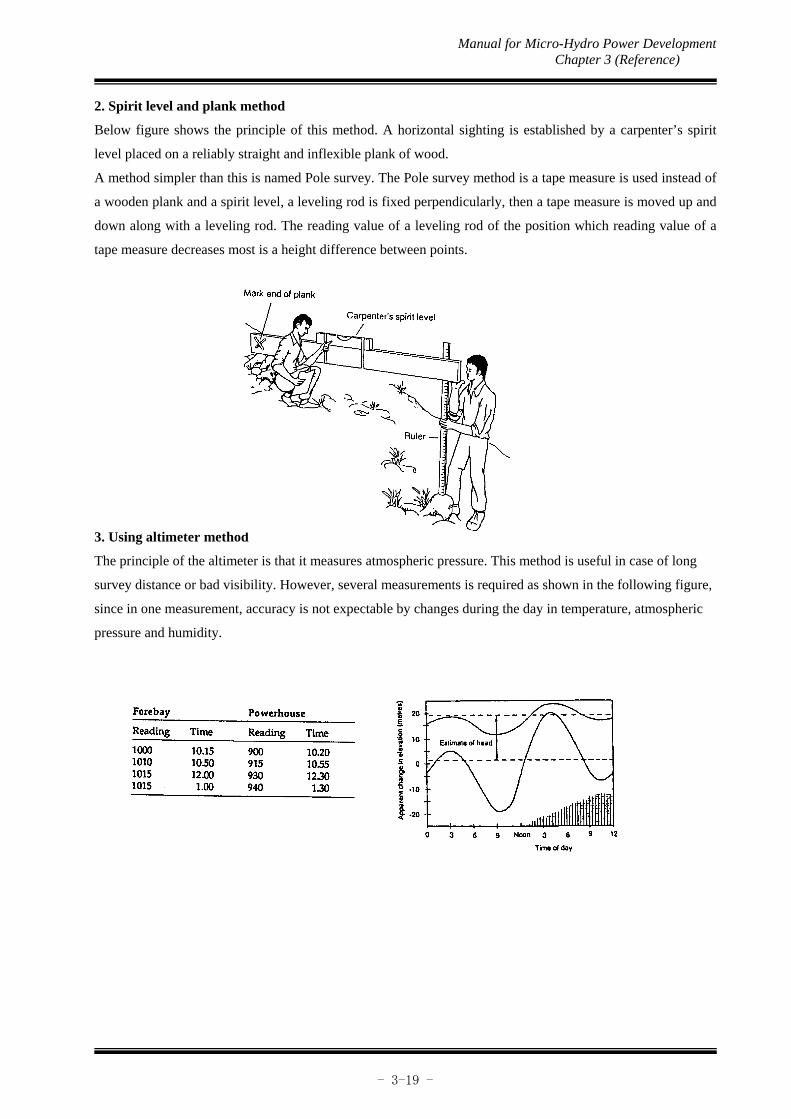
Manual for Micro-Hydro Power Development Chapter 3 (Reference)
- 3-19 -
2. Spirit level and plank method
Below figure shows the principle of this method. A horizontal sighting is established by a carpenter’s spirit
level placed on a reliably straight and inflexible plank of wood.
A method simpler than this is named Pole survey. The Pole survey method is a tape measure is used instead of
a wooden plank and a spirit level, a leveling rod is fixed perpendicularly, then a tape measure is moved up and
down along with a leveling rod. The reading value of a leveling rod of the position which reading value of a
tape measure decreases most is a height difference between points.
3. Using altimeter method
The principle of the altimeter is that it measures atmospheric pressure. This method is useful in case of long
survey distance or bad visibility. However, several measurements is required as shown in the following figure,
since in one measurement, accuracy is not expectable by changes during the day in temperature, atmospheric
pressure and humidity.
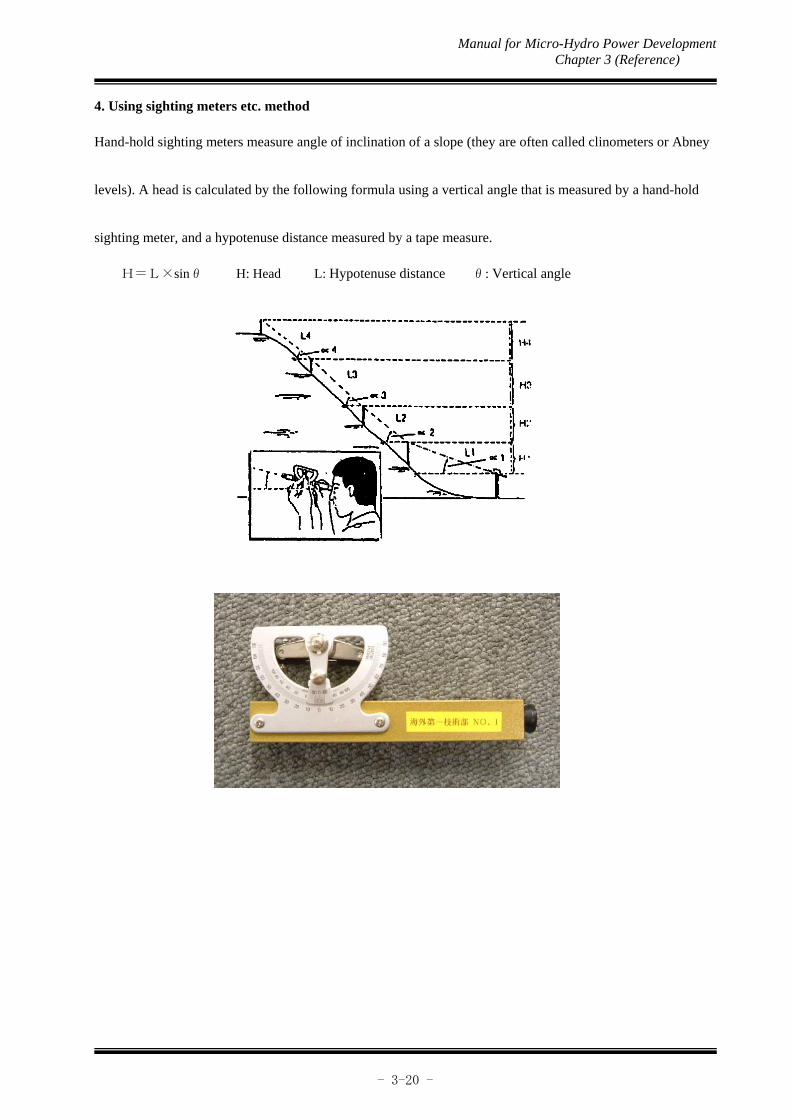
Manual for Micro-Hydro Power Development Chapter 3 (Reference)
- 3-20 -
4. Using sighting meters etc. method
Hand-hold sighting meters measure angle of inclination of a slope (they are often called clinometers or Abney
levels). A head is calculated by the following formula using a vertical angle that is measured by a hand-hold
sighting meter, and a hypotenuse distance measured by a tape measure.
H=L×sinθ H: Head L: Hypotenuse distance θ: Vertical angle

Manual for Micro-Hydro Power Development Chapter 3 (Reference)
- 3-21 -
Place date Observing point Survey point Distance (m) Azimuth (°) Vertical interval Remarks
. . . . . . . . . . . . . . . . . . . . . . . . . . . . . . . . . . . . . . . . . . . . . . . . . . . . . . . . . . . . . . . . . . . . . . . . . . . . . . . . . . . . . . . . . . . . . . . . . . . . . .
Field-note of Topographic surveying

Manual for Micro-Hydro Power Development Chapter 3 (Reference)
- 3-22 -

Manual for Micro-Hydro Power Development Chapter 3 (Reference)
- 3-23 -
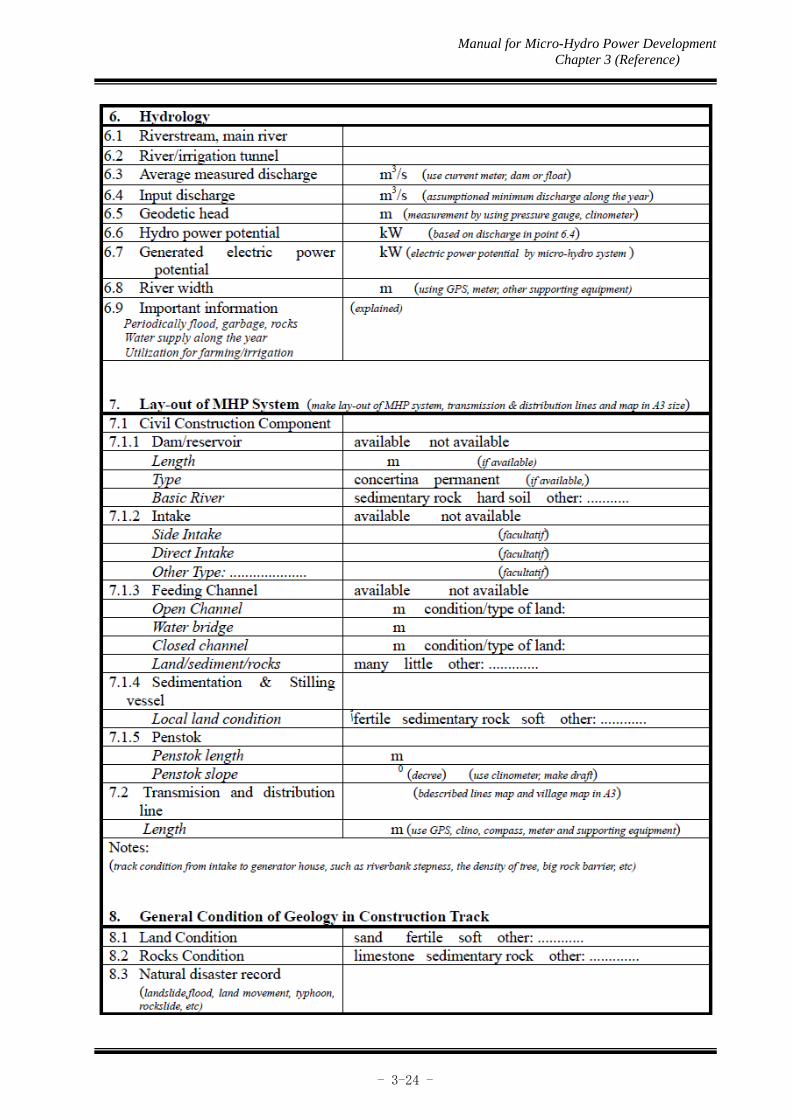
Manual for Micro-Hydro Power Development Chapter 3 (Reference)
- 3-24 -

Manual for Micro-Hydro Power Development Chapter 3 (Reference)
- 3-25 -

Manual for Micro-Hydro Power Development Chapter 3 (Reference)
- 3-26 -
[Ref.3-4 Questionnaire for Households of Non-Electrified Villages] Household number
Name of Respondent
Sub unit of village
Barangay (village)
Circle the final result of the visit to this household 1. Completed 2. No household member at home or no competent respondent at home at time of visit 3. Postponed 4. Refused 5. Other (specify) Interviewer’s name Date Time interview began Time interview completed
Data input by Final Check by
1. FAMILY PROFILE 1. Number of family members (only living together in the same house)
Male adults at 20 yrs or over personsFemale adults at 20 yrs or over personsChildren less than 20 yrs old personsTotal persons
2. Number of school going children
University student personsHigh school student personsJunior high school student personsElementary school student personsTotal persons
3. How many of your family are earning income in the village in the village? persons 4. How many of your family members are living in other town to work? persons 5. Is your household headed by male or female?
Tick () Male Female
6. Which organization does any of your family belong
Barangay Cooperative PersonsBarangay Council PersonsOther (specify) Persons
7. How many of your family members graduated from (upper) high school? persons

Manual for Micro-Hydro Power Development Chapter 3 (Reference)
- 3-27 -
2. Housing 8. How many rooms does your house have? rooms (including kitchen) 9. What is floor area of your house? m2 10. What type of roof is used for the house?
Type of roof Tick ()Tiled roof GI Sheet roof Thatched roof (straw, palm leaf)
3. Economic aspects
3-1. Household income
11. How much is your family earning from agriculture? Type of crops
Average amount of
production per cropping (kg)
Times of cropping per year
Average farm gate
price (Rp.)
Approximate annual earning (Rp.)
Average annual cost
(Rp.)
Subsistence/ cash crop
Rice Subsistence/cash crop
Subsistence/cash crop
Subsistence/cash crop
Subsistence/cash crop
Subsistence/cash crop
12. Earnings from Fishery
Type of fish Annual average earning (Rp.)
Annual average cost (Rp.)
Subsistence/cash
Subsistence/cash
Subsistence/cash
Subsistence/cash
Subsistence/cash
13. What kind of income sources does your family have? Insert the amount of earning of the last month in
each category by each income earner.
Income earner Income source
1st income earner
2nd income earner
3rd income earner
4th income earner
5th income earner
Salaries/wages
Pension
Handicraft
Other cottage industry
Shops/restaurant
Services (e.g. hair-dress, car/bike garage)
Money transfer from outside the village
Others (Specify:)
Total
LIVING PLACE
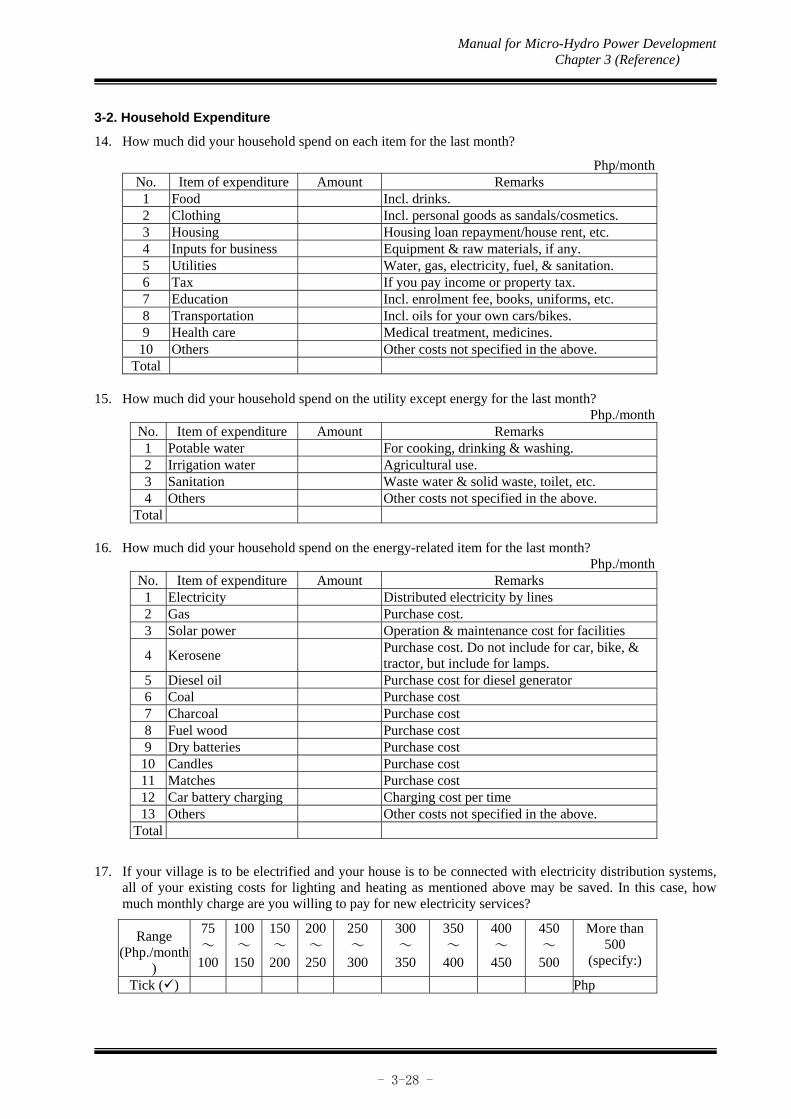
Manual for Micro-Hydro Power Development Chapter 3 (Reference)
- 3-28 -
3-2. Household Expenditure
14. How much did your household spend on each item for the last month?
Php/monthNo. Item of expenditure Amount Remarks 1 Food Incl. drinks. 2 Clothing Incl. personal goods as sandals/cosmetics. 3 Housing Housing loan repayment/house rent, etc. 4 Inputs for business Equipment & raw materials, if any. 5 Utilities Water, gas, electricity, fuel, & sanitation. 6 Tax If you pay income or property tax. 7 Education Incl. enrolment fee, books, uniforms, etc. 8 Transportation Incl. oils for your own cars/bikes. 9 Health care Medical treatment, medicines.
10 Others Other costs not specified in the above. Total
15. How much did your household spend on the utility except energy for the last month? Php./month
No. Item of expenditure Amount Remarks 1 Potable water For cooking, drinking & washing. 2 Irrigation water Agricultural use. 3 Sanitation Waste water & solid waste, toilet, etc. 4 Others Other costs not specified in the above.
Total
16. How much did your household spend on the energy-related item for the last month? Php./month
No. Item of expenditure Amount Remarks 1 Electricity Distributed electricity by lines 2 Gas Purchase cost. 3 Solar power Operation & maintenance cost for facilities
4 Kerosene Purchase cost. Do not include for car, bike, &
tractor, but include for lamps. 5 Diesel oil Purchase cost for diesel generator 6 Coal Purchase cost 7 Charcoal Purchase cost 8 Fuel wood Purchase cost 9 Dry batteries Purchase cost
10 Candles Purchase cost 11 Matches Purchase cost 12 Car battery charging Charging cost per time 13 Others Other costs not specified in the above.
Total
17. If your village is to be electrified and your house is to be connected with electricity distribution systems, all of your existing costs for lighting and heating as mentioned above may be saved. In this case, how much monthly charge are you willing to pay for new electricity services?
Range (Php./month
)
75 ~
100
100 ~
150
150 ~
200
200 ~
250
250 ~
300
300 ~
350
350 ~
400
400 ~
450
450 ~
500
More than 500
(specify:)
Tick () Php

Manual for Micro-Hydro Power Development Chapter 3 (Reference)
- 3-29 -
4. Energy related property
18. Do you have following equipment for lighting and/or heating?
Kind of equipment
a) Generator b) Kerosene
lamp
c) Gas fired cooking
appliance
d) Car battery e) Others (Specify:)
Number ( )
19. What kind of electrical appliances does your household currently use? [ ] Bulb/fluorescent light units [ ] TV-set units [ ] Radio & cassette recorder set units [ ] Refrigerator units [ ] Air conditioner units [ ] Other, specify units 20. What kind of electrical appliances does your household currently use for productive activities? [ ] Sawmill machine [ ] Rice milling machine [ ] Rice dryer [ ] Irrigation pump [ ] Others, specify
5. Needs for electricity
5-1. Priority needs 21. Could you give your priority order on the followings needs?
Priority ExampleWater supply 1 Education 2 Health care 3 Sanitation (toilet, solid waste, drainage, etc.) 7 Electrification 4 Irrigation 6 Road improvement 5 Others (specify) 5-2. Effort to have access to electricity 22. Has your household ever attempted to have access to electricity? [ ] yes go to Question 23. [ ] no go to Question 30. 23. What type of electricity generation did your household plan to have access to? [ ] Diesel generator set [ ] Solar home system [ ] Wind power [ ] Micro hydropower [ ] Biomass [ ] Other, specify

Manual for Micro-Hydro Power Development Chapter 3 (Reference)
- 3-30 -
24. Specify the reason for selecting the type of electricity generation. 25. Did your household succeed in having access to electricity? [ ] yes go to Question 26. [ ] no go to Question 27. 26. Is your generating system functioning as expected? [ ] yes go to Question 28. [ ] no go to Question 29. 27. If your household did not succeed in having access to electricity, explain the reason for the failure. 28. What positive impact could your household receive from electricity? Explain. 29. What problems did your household encounter regarding generating facility?
Problem Tick ()Expensive cost for fuel Unable to fix breakdown Insufficient electric power to meet the demand Other (specify)
5-3. Purpose of using electricity 30. If you can have access to electricity, what kind of electrical appliances and how many appliances do you
want to use? [ ] Bulb/fluorescent light units [ ] TV-set units [ ] Radio & cassette recorder set units [ ] Refrigerator units [ ] Air conditioner units [ ] Other, specify units 31. What facility/equipment do you want to use electricity for productive activities? [ ] Sawmill machine [ ] Rice milling machine [ ] Rice dryer [ ] Irrigation pump [ ] Others, specify
32. What public facilities do you think should have access to electricity? [ ] School [ ] Mosque/church [ ] Clinic/health center [ ] Water pump for drinking water [ ] Others, specify

Manual for Micro-Hydro Power Development Chapter 3 (Reference)
- 3-31 -
5-4. Electrification by the organization other than Rural Electric Cooperative 33. Who/what organization do you think would be the most appropriate for the installation of the electricity
supply system? [ ] Provincial LGU [ ] Municipal LGU [ ] Barangay Association [ ] Barangay LGU [ ] NGO [ ] Private contractor [ ] Village members (including village head) [ ] Others, specify [ ] Don’t know 34. Do you and/or your family member volunteer to participate in working for the construction without any
cash reward if the generating facility is to be installed in the village? [ ] yes [ ] no 35. Who/what organization should be responsible for operation and maintenance of the system? [ ] Rural Electric Cooperative (REC) [ ] Provincial LGU [ ] Municipal LGU [ ] Barangay Association [ ] Barangay Council [ ] NGO [ ] Private contractor [ ] Barangay members (including barangay head) [ ] Others, specify [ ] Don’t know 36. Do you and/or your family member want to participate in working for operation and maintenance? [ ] yes [ ] no 37. Who/what organization should be responsible for billing and collection of charges for electricity? [ ] Rural Electric Cooperative [ ] Provincial LGU [ ] Municipal LGU [ ] Barangay Association [ ] Barangay Council [ ] NGO [ ] Private contractor [ ] Barangay members (including barangay head) [ ] Others, specify [ ] Don’t know 38. How should the electricity tariff be decided? [ ] Same level as REC’s tariff system [ ] Based on consultation with and consensus of the community [ ] Free of charge [ ] Other, specify

Manual for Micro-Hydro Power Development Chapter 4
- 4-1 -
Chapter 4 PLANNING
4.1 Scheme of Development Layout
The tree types of waterway routes shown in Figure 4.1.1 below are examples of possible
layouts of micro-hydropower system. The ‘short penstock’ option, in most cases, is
considered the most economic scheme, but this is not necessarily the case.
Note: The channel could be shortened to avoid the risk and expense of construction across a steep slope.
Fig.4.1.1 Channel and penstock option:
Considering each option:
(1) Short Penstock
In this case, the penstock is short but the
channel is long. The long channel is exposed
to the greater risk of blockage, or of collapse
or deterioration as a result of poor
maintenance. Installing the channel across a
steep slope may be difficult and expensive.
The risk that the steep slope may erode
makes the short penstock layout an
unacceptable option, because the projected
operation and maintenance cost of the
scheme could be very expensive, and it may
outweigh the benefit of initial purchase cost.

Manual for Micro-Hydro Power Development Chapter 4
- 4-2 -
(2) Long Penstock
In this case, the penstock follows the river.
If this layout is necessary, because the
terrain would not allow the construction of
a channel, certain precautions must be
taken. The most important consideration is
to ensure that seasonal flooding of the river
will not damage or deteriorate the penstock.
It is also important to calculate the most
economic diameter of penstock; in the case
of a long penstock, the cost will be
particularly high.
(3) Mid-length Penstock
The mid-length penstock may cost more
than the short penstock, but the cost of
constructing a channel that can safely cross
the steep slope may also be avoided. Even
if the initial purchase and construction
costs are greater in this case, this option
may be preferable in case there are signs of
instability in the steep slope.
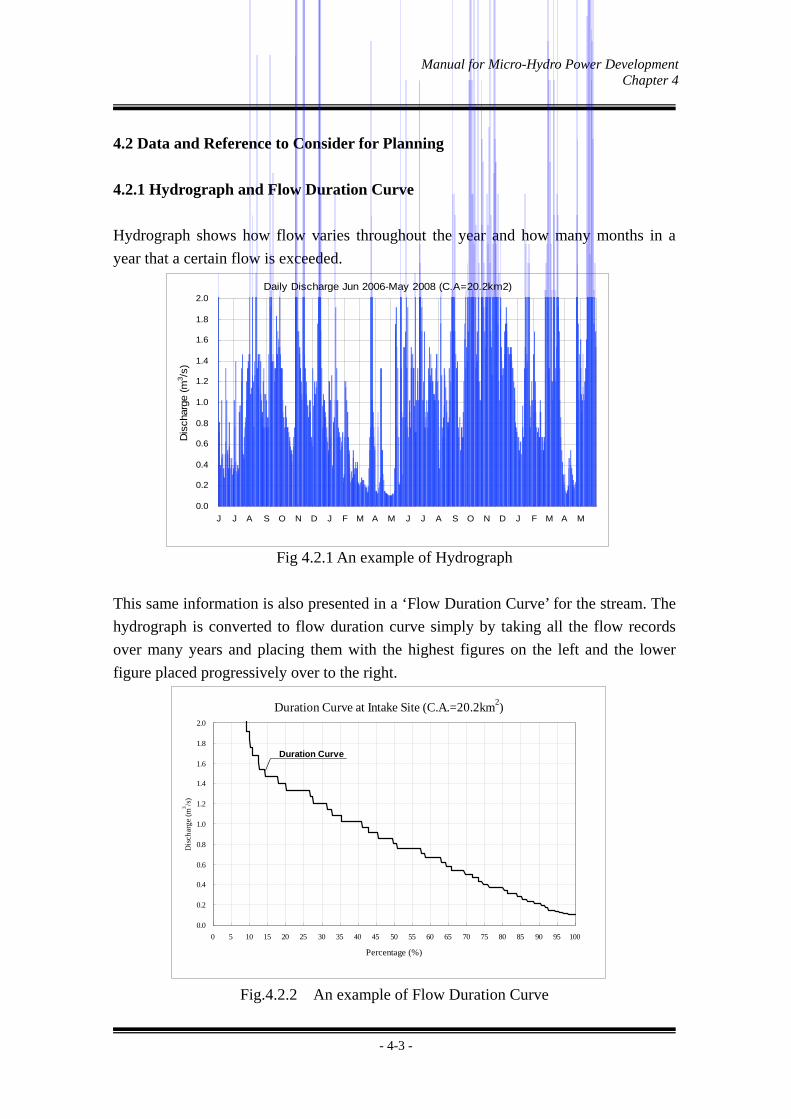
Manual for Micro-Hydro Power Development Chapter 4
- 4-3 -
4.2 Data and Reference to Consider for Planning
4.2.1 Hydrograph and Flow Duration Curve
Hydrograph shows how flow varies throughout the year and how many months in a
year that a certain flow is exceeded.
Fig 4.2.1 An example of Hydrograph
This same information is also presented in a ‘Flow Duration Curve’ for the stream. The
hydrograph is converted to flow duration curve simply by taking all the flow records
over many years and placing them with the highest figures on the left and the lower
figure placed progressively over to the right.
Fig.4.2.2 An example of Flow Duration Curve
Daily Discharge Jun 2006-May 2008 (C.A=20.2km2)
0.0
0.2
0.4
0.6
0.8
1.0
1.2
1.4
1.6
1.8
2.0
J J A S O N D J F M A M J J A S O N D J F M A M
Dis
char
ge (
m3 /s
)
Duration Curve at Intake Site (C.A.=20.2km2)
0.0
0.2
0.4
0.6
0.8
1.0
1.2
1.4
1.6
1.8
2.0
0 5 10 15 20 25 30 35 40 45 50 55 60 65 70 75 80 85 90 95 100
Percentage (%)
Dis
char
ge (m
3/s
)
Duration Curve

Manual for Micro-Hydro Power Development Chapter 4
- 4-4 -
The flow duration curve is useful because the power that could be generated can be
superimposed onto it so that it is possible to calculate the time in a year that certain
power levels can be obtained. This is also a planning tool to determine the size of
turbine to be installed indicating the required variable flow performance of turbine and
the plant factor constraints which will result from any particular choice of turbine size.
4.2.2 Plant Factor and Load Factor
(1) Plant Factor
‘Plant Factor’ is very important term for hydropower planning. Plant factor is defined in
the next equation.
Geannual
Plant Factor = %
Pmax × 365 × 24
and
Qave’ Area of A-b-c-C-D in Fig.4.2.3
Plant Factor of Flow = or %
Qd Area A-B-C-D in Fig.4.2.3
Where;
Geannual : the possible annual electric generation (kWh)
Pmax : maximum output (kW)
Qave’ : average discharge which is less than Qd (m3/s・day)
Qd : design discharge (m3/s)
For a run-of-river type of hydropower scheme, optimum plant factor can be generally
taken from the following range:.
For micro-hydro : 80 ~ 100 % (For Rural Electrification)
Mini-hydro : 70 ~ 90 % (In the Philippines)
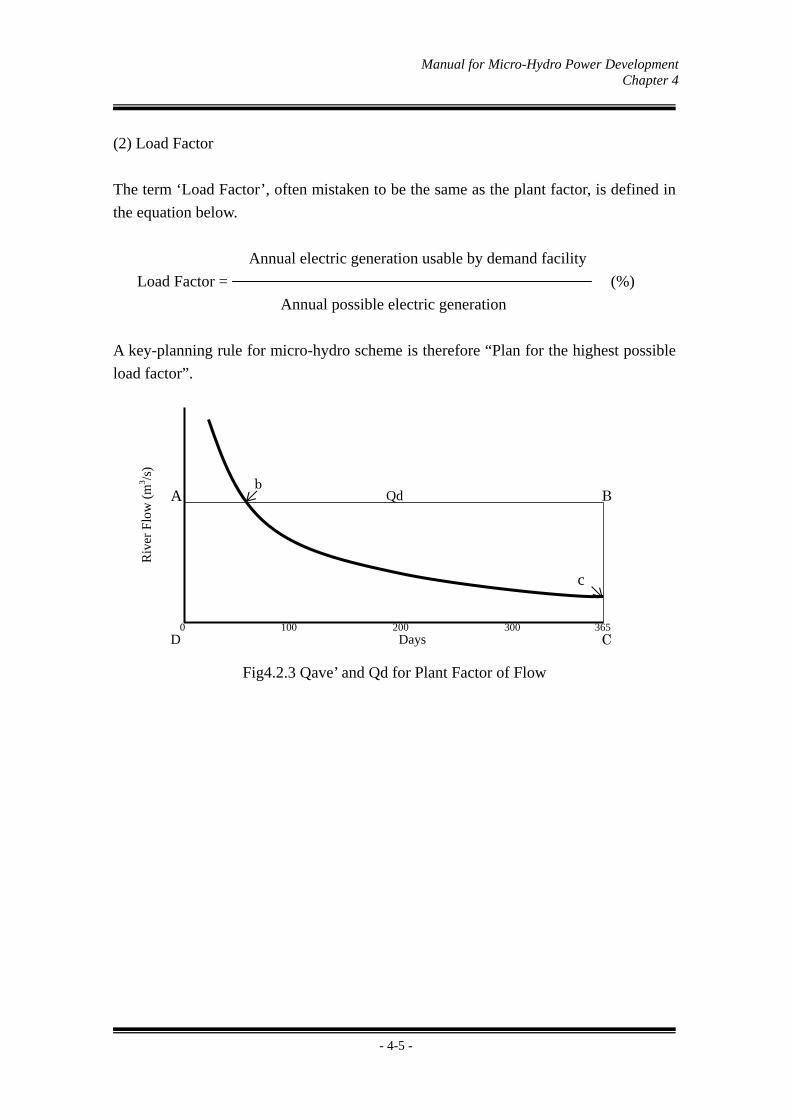
Manual for Micro-Hydro Power Development Chapter 4
- 4-5 -
(2) Load Factor
The term ‘Load Factor’, often mistaken to be the same as the plant factor, is defined in
the equation below.
Annual electric generation usable by demand facility
Load Factor = (%)
Annual possible electric generation
A key-planning rule for micro-hydro scheme is therefore “Plan for the highest possible
load factor”.
Fig4.2.3 Qave’ and Qd for Plant Factor of Flow
0 100 200 300 365
Riv
er F
low
(m
3 /s)
Days
A B
C
b
c
Qd
D

Manual for Micro-Hydro Power Development Chapter 4
- 4-6 -
4.3 Selection of Locations for Main Civil Structures
4.3.1 Location of Intake
The location of the intake is selected considering the conditions described below.
Extreme care must be taken in this selection for the development of small-scale
hydropower as the cost of the intake facilities significantly determines the development
project economy.
(1) River Channel Alignment
For small-scale and run-of-river types of hydropower plant, the appropriate section
within the river channel to construct the intake structure is where the channel is as
straight as possible in order to ensure steady and smooth flow of water to the intake and
also to prevent scouring of the river banks downstream of the intake site.
(2) Stability of Hillside Slope
The presence of a landslide or unsteady slope near an intake weir site causes concerns
for possible obstruction at the water intake by sediments from the landslide or erosion.
Sufficient consideration should, therefore, be given to the stability of nearby hillsides as
part of the intake location selection process.
(3) Use of existing civil structures
In small-scale hydropower development, the use of existing civil structures such as
barangay roads, intake facilities for agriculture and irrigation channels, etc. can
contribute to the reduction of the development cost. Careful consideration should,
therefore, be given to the selection of the intake location so that such civil structures
already in place can be used.
(4) Use of natural topographical features
The use of naturally formed pool for water intake will not only help in the cost
reduction but also conserving the waterfront environment, including the riverside
landscape and riparian ecosystem.
When the use of natural topographical features is planned, proper analysis of the

Manual for Micro-Hydro Power Development Chapter 4
- 4-7 -
following concerns should be considered:
Preservation of the natural pool
Removal method of sedimentation
(5) Intake Volume and Flood Water Level
In general, an intake weir is located at a narrow section of a river to reduce the
construction cost of the main body of the intake weir. However, it must be noted that the
selection of such a narrow section is not necessarily advantageous for a small-scale
hydropower plant because of the following reasons.
In the case of the Tyrolean-type intake method, the length in the cross-sectional
direction must match the anticipated design discharge. (0.1m3/s of inflow water per
1m of intake length)
When a weir is constructed at a narrow section, the flood water level at the site
inevitably becomes higher, necessitating an increased cross-sectional area of the weir
as well as an increased bank protection height and length to ensure the stability of the
weir.
(6) Site Conditions for Settling Basin and Headrace, etc.
Select the preferable site for the settling basin, headrace and other structures taking into
consideration the conditions for the weir. It is also important to carefully consider the
topographical and geological conditions of the settling basin site and headrace route.
(7) Existence of River Water Use in Reduced Discharge Section
Water intake for agricultural or other purposes should be considered in the survey in
order that the use of river water for power generation will not affect the present use of
the river water.
8) Existing Features in Backwater Section
Existing features, such as roads and farmland, etc., in lower areas should also be
considered in the selection of the location of the intake weir to avoid flooding.
If the location of the intake weir is in a location which affects existing features, the
Manual for Micro-Hydro Power Development Chapter 4
- 4-8 -
geographical area to be affected by backwater due to the construction of the intake weir
should be clarified by appropriate calculation. It will also be necessary to construct river
bank protections and drainage structures to protect the existing facilities.
4.3.2 Headrace Route
(1) Topography
A careful survey of the topography of the headrace route of a micro-hydropower system
is necessary since the headrace is usually an exposed structure such as an open or
covered channel. When an open channel is to be constructed on a hillside, proper
investigation as to the gradient or slope of the headrace route must be done. If a valley
or a ridge exists along the headrace route, the actual route should be selected after
examining the best route (siphon for a valley section; open excavation or culvert for an
elevated ridge section).
(2) Ground Stability
The ground stability of the headrace route must be carefully examined to avoid
incidents of loss of the waterway due to slope collapse in the case of the ground-type
(exposed) headrace.
(2) Use of Existing Structures
It is advantageous to locate the headrace route along an existing road or irrigation
channel to reduce the cost, improve the workability and make it relatively easy to
evaluate the slope stability. However, the following concerns must be taken into
consideration for the use of existing structures:
Maintenance of existing canal, road, drainage, etc.
Ensure water quantity for irrigation and efficient water diversion method
4.3.3 Location of Head Tank
(1) Topographical and geological conditions
The headtank is often located at a ridge section and on a highly stable ground consisting
of hard rock, etc. The possibility of minimal excavation work, including that for the
penstock, offers favorable condition for selection of the site for headtank.

Manual for Micro-Hydro Power Development Chapter 4
- 4-9 -
However, it must be noted that the location of the headtank at a ridge section is not
appropriate under the following conditions:
The level of consolidation is generally low at the ridge section which is located in a
shallow area developed from advanced erosive dissection of the valley.
There will be larger fluctuations in the water level inside the tank which will cause
possible obstruction to the smooth flow of operation due to the large volume of water
required as the load changes. In such a case, it is advisable to design a headtank with
a bigger diameter that covers an area wide enough to absorb load fluctuations. In this
case, the desired location for the headtank should be on a relatively flat area rather
than on a ridge section.
(2) Ease of Dealing with Effluents
A spillway for a small-scale hydropower system may be omitted, however, if a spillway
for the headtank is introduced, the method of dealing with effluents must be carefully
examined. (There have been reports of the ground being washed away because of the
absence of a spillway for the excess water from the headtank.)
The installation of a spillway parallel to the penstock route should not cause any major
problems, however, the direct discharge of surplus water and sediment inside the
headtank to a nearby stream or hillside slope requires careful examination of the
discharge point. The profile as well as cross-sectional alignment of the spillway are
carefully designed to prevent scouring of the nearby ground due to expected volume of
water spillage.
The combined function of a settling basin and headtank will significantly help in
reducing of overall investment cost of micro-hydropower development. Therefore, the
possibility of introducing a combined headtank and settling basin should be carefully
examined at the planning stage.
4.3.4 Penstock Route
The penstock route should be selected considering the following parameters:
(1) Hydraulic gradient

Manual for Micro-Hydro Power Development Chapter 4
- 4-10 -
(2) Topography of the penstock route
(3) Ground stability of the penstock route
(4) Use of existing infrastructures like roads, irrigation canals and others
The parameters to note for the selection of the penstock route are basically the same as
those for the selection of the headrace route but its relationship with the hydraulic
gradient must be carefully analyzed.
The penstock route must be designed to ensure safety vis-à-vis specific internal as well
as external pressures and that the profile of the penstock route must be below the
minimum hydraulic gradient line, i.e. minimum pressure line.
This minimum pressure line is determined by taking the internal pressure fluctuation in
the penstock at the time of rapid load shut-down into consideration. The range of
pressure fluctuation is larger in the downstream because it is influenced by changes of
the discharge at the turbine over time. Therefore, careful attention is necessary at a site
where the length of the penstock route is long compared to the head as shown in the Fig.
4.3.1.
Careful examination is also required in setting the location of the Francis turbine with a
slower specific speed as the range of pressure fluctuation can be widened due to the
abrupt control vane operation because of the increasing revolution (speed) even at
longer closure time of the control vane.
For other turbines, closing speed of the control vane is almost in proportion to the speed
of discharge reduction, however, no special problem occurs provided that an adequate
closure time is set.

Manual for Micro-Hydro Power Development Chapter 4
- 4-11 -
Fig. 4.3.1 Example of site where penstock route is long compared to head
Fig. 4.3.2 Change of discharge at rapid load shut-off for Francis turbine with
slower specific speed
Powerhouse
Penstock
Minimum Pressure
Negative pressure will occurin this area
Head Tank Maximum Pressure Line
Change of flow due to operation by the control vane
(longer closure time)
Time 0
Qmax
Change of flow due to change of the revolution
(Shorter closure time)
Dis
char
ge

Manual for Micro-Hydro Power Development Chapter 4
- 4-12 -
4.3.5 Location of powerhouse
Careful attention must be made to the following conditions in the selection of the
powerhouse location:
(1) Accessibility
It is desirable for the powerhouse to be located at a site with easy access for operation
and maintenance purposes.
(2) Conditions of the Foundation
The foundations of the powerhouse must be strong enough to withstand the installation
of heavy loads like the electro-mechanical equipment. For a micro-hydropower plant, a
compacted gravel layer may be sufficient because of the relatively lightweight
equipment (approximately 2 – 3 tons/m2).
(3) Flood Water Level
The location of the powerhouse must avoid the level and section where the water flows
to avoid scouring and to prevent inundation of the powerhouse during high flows.
A small-scale hydropower station is planned for a small river in a mountainous area
where the flood stage is not recorded or established. In this case, the flood water level
could be assumed based on the information listed below that could be used in the
determination of the ground elevation of the powerhouse with sufficient margin:
Information obtained from local residents
Ground elevation of nearby structures (roads, embankments and bridges, etc.)
Traces of flooding and vegetation boundary
(4) Installation Conditions for Auxiliary Facilities
Space for the installation of an outdoor substation is required near the powerhouse and
the site must be selected in consideration to the possible extension and the direction of
the transmission line.
However, when the transmission voltage is the same as the generating voltage, the size
of the required space is small. Accordingly, the space created by the construction of the
Manual for Micro-Hydro Power Development Chapter 4
- 4-13 -
foundations for the powerhouse is often sufficient to accommodate such auxiliary
facilities.
4.3.6 Location of Tailrace
The location of the tailrace is determined using the same conditions as the powerhouse
location because it is located adjacent to the powerhouse. In other cases, the location of
the tailrace is decided by taking the following items into consideration.
(1) Flood Water Level
The tailrace channel should be preferably placed above the expected flood water level.
When the base elevation of the tailrace is planned to be lower than the flood level, the
location and base elevation of the tailrace must be decided in consideration of (i)
suitable measures to deal with the inundation or seepage of water into the powerhouse
due to flooding and (ii) a method to remove sediment which may occur in the tailrace
canal.
(2) Existence of Riverbed Fluctuation at Tailrace
When riverbed fluctuation is expected to take place in the future, the location of the
water outlet must be selected so as to avoid any trouble to its operation due to
sedimentation in front of the tailrace.
(3) Possibility of Scouring
Careful attention must be made to avoid the scouring of the riverbed and nearby ground.
The selection of a location where protective measures can be easily applied is essential.
(4) Flow Direction of River Water
The tailrace must be directed (in principle, facing downstream) so as not to disrupt the
smooth flow of the river water or a location which allows the direction of the tailrace as
that of the river flow should be selected.

Manual for Micro-Hydro Power Development Chapter 4
- 4-14 -
4.4 Supply and Demand Plan
4.4.1 Selection of Power Demand Facilities
The following items must be considered in the installed capacity:
(1) Power Uses
Each power demand facility shows specific load characteristics depending on various
power uses, the selection of the power demand facilities to be served should take the
specifications of the generating unit and the load characteristics of each facility into
consideration.
The load characteristics corresponding to specific power uses are outlined below:
a) Use for Lighting
The load for lighting is constant while it is in use and less fluctuations than other
power uses. In general, power use for lighting is concentrated at night and the
time of use fluctuates depending on the weather and length of sunshine duration.
b) Use for Heating and Drying
The main power uses are heating, keeping warm and drying using electric heaters.
However, the continuous use of power for heating is rare. In most cases, power is
intermittently used in response to a set temperature.
In an area with distinctive dry and wet seasons where agricultural products are
currently dried by solar heat, the use of electric dryers, etc. enable power
consumption in line with seasonal fluctuations of the generated power output.
This constitutes a very effective means of improving the efficient use of electrical
power.
c) Use for Motive Power
The use of power to operate a motor shows the following load characteristics:
At start-up, current is several times higher than the rated current flows (the
duration is generally not more than 10 seconds).
The load fluctuates in relation to the motive power required by a machine. The
load is basically constant in the case of an electric fan or pump, etc. but
considerably fluctuates in the case of sawing operation, etc.

Manual for Micro-Hydro Power Development Chapter 4
- 4-15 -
An automatically controlled motor for air-conditioning as well as heating
frequently, in repetitive manner, starts and stops.
In the case of a power plant in an isolated operation, the start up of its motor may
temporarily cause a state of excessive load that may result to the stoppage of
generating operation.
(2) Transmission and Distribution Costs
The construction of a small-scale hydropower station near the power demand facilities
is desirable in order to increase its efficiency. Accordingly, it is necessary to select the
power demand facilities when planning the demand by taking into consideration both
the benefits and the transmission and distribution costs of power supply.
(3) Contribution to Local Development
The main purpose of the small-scale hydropower development discussed here is the
vitalization of the local economy. It is desirable to give priority to the types of power
demand facilities listed below because of their perceived strong to local development:
a) Those capable of using local resources.
b) Those capable of appealing to the environment near or outside the area.
c) Those capable of assisting the creation of employment opportunities.
d) Those capable of contributing to the promotion of close cooperation among
residents.
4.4.2 Scheme of Development based on Supply and Demand
It is necessary that the output of a small-scale hydropower plant that has no back-up
power generation source to be higher than the demand. In the case of a run-of-river type
micro-hydropower plant, the optimal scale is that which corresponds to the maximum
demand capacity within the range of “the developable maximum output”1 which is
basically determined based on “the minimum usable discharge for generation”2. The
procedure for this examination is described next.
1 Maximum output which can be developed. 2 Drought discharge among the various river discharges which can be used for power generation.

Manual for Micro-Hydro Power Development Chapter 4
- 4-16 -
(1) Decision on Minimum Usable Discharge (Qumin) for Generation
The minimum usable discharge for generation (Qumin) is decided in consideration of the
following items:
a) Establishment of usable river discharge for generation (Qu)
The Qumin is determined based on the discharge which is calculated by subtracting
the maintain discharge in the reduced discharge section from the river discharge
at the intake point (usable discharge for generation: Qu).
b) Frequency of permissible break power generation
The Qumin is also determined by the frequency of permissible break power
generation (see Fig. 4.4.1 and Fig.4.4.2).
The frequency of permissible break power generation is in turn decided by the
type and importance of the power demand facilities/equipment, user intentions
and other factors. In general, the drought discharge under the flow duration for Qu
calculated by the method described above or some 90 – 95% discharge rate3
forms the base. However, as the flow duration changes every year, a standard
flow duration year must be selected through sufficient discussions with users for
the planning of the base discharge.
(2) Decision on Maximum Output (Pumax)
The maximum output (Pumax) that could be develop is decided in the following manner
depending on whether or not seasonal demand fluctuations exist.
a) Case of constant demand throughout the year
When a plant is assumed to be a run-of-river type, the Pumax is the power
generation potential under the Qumin described earlier.
3 Discharge rate (percentage) when 365 days constitute 100% in the flow duration diagramme.
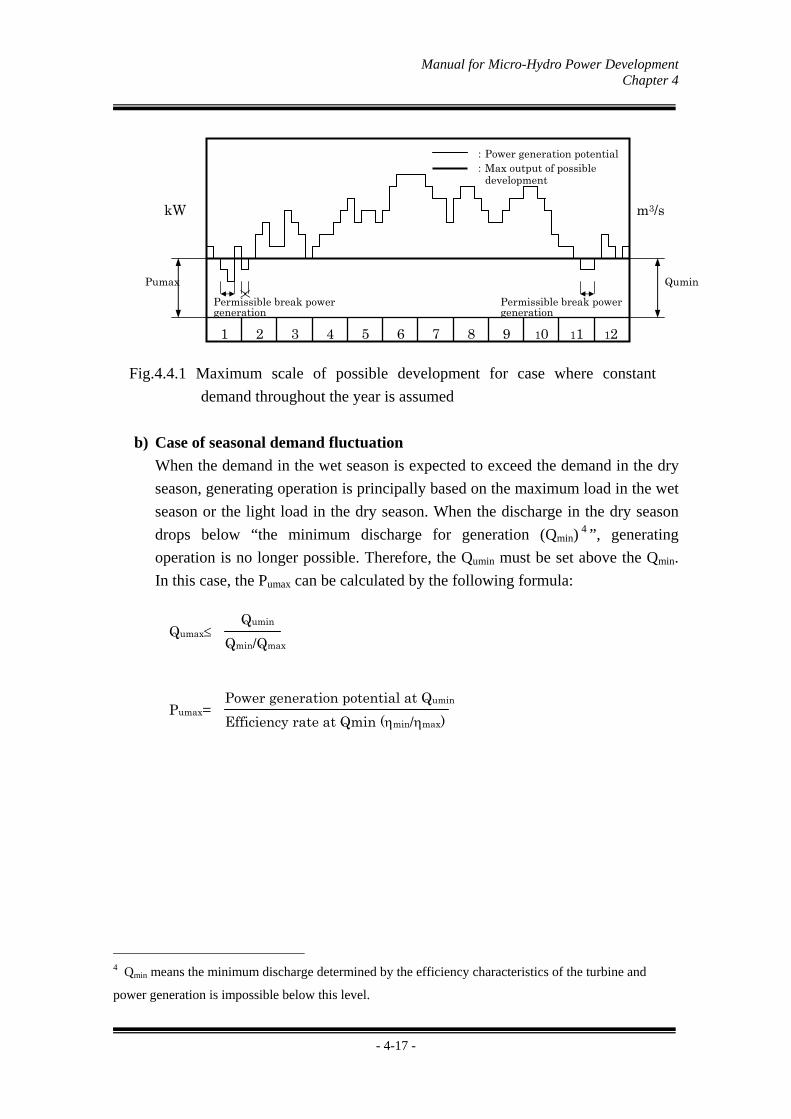
Manual for Micro-Hydro Power Development Chapter 4
- 4-17 -
Fig.4.4.1 Maximum scale of possible development for case where constant
demand throughout the year is assumed
b) Case of seasonal demand fluctuation
When the demand in the wet season is expected to exceed the demand in the dry
season, generating operation is principally based on the maximum load in the wet
season or the light load in the dry season. When the discharge in the dry season
drops below “the minimum discharge for generation (Qmin)4 ”, generating
operation is no longer possible. Therefore, the Qumin must be set above the Qmin.
In this case, the Pumax can be calculated by the following formula:
4 Qmin means the minimum discharge determined by the efficiency characteristics of the turbine and
power generation is impossible below this level.
Permissible break powergeneration
Qumin
m3/skW
:Power generation potential :Max output of possible development
1 2 3 4 5 6 7 8 9 10 11 12
Permissible break power generation
Pumax
Qumax Qumin
Qmin/Qmax
Pumax= Power generation potential at Qumin
Efficiency rate at Qmin (min/max)
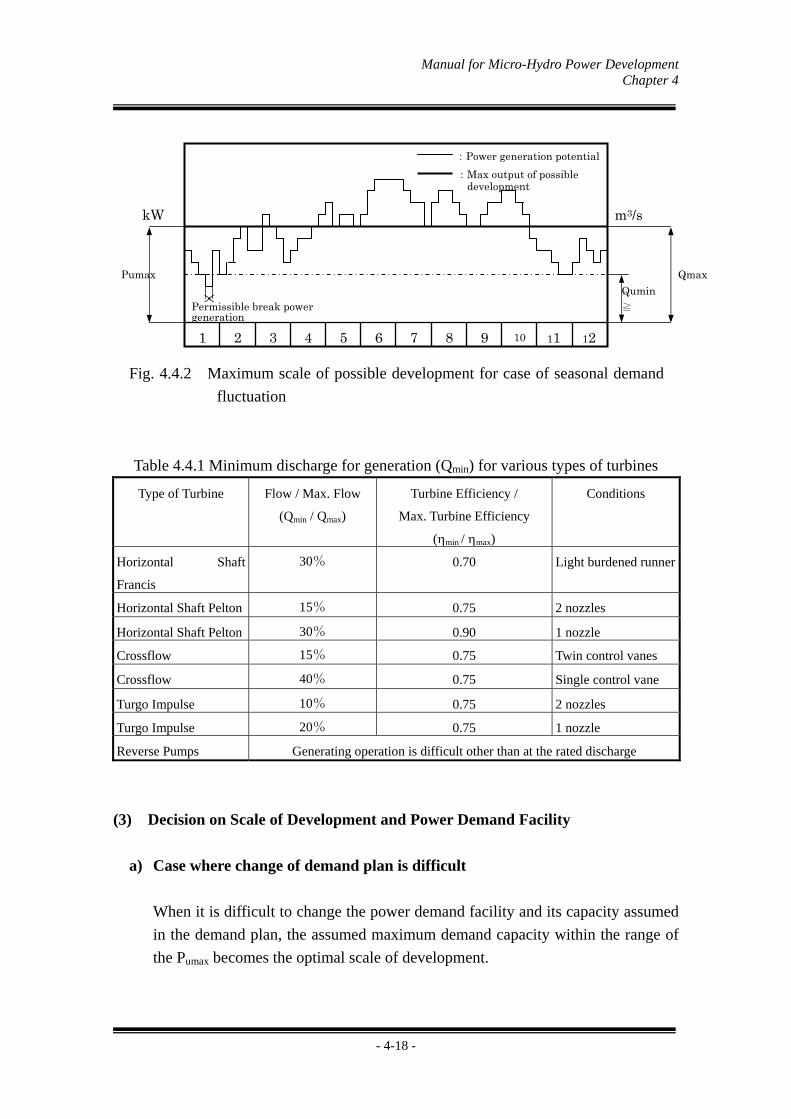
Manual for Micro-Hydro Power Development Chapter 4
- 4-18 -
Fig. 4.4.2 Maximum scale of possible development for case of seasonal demand
fluctuation
Table 4.4.1 Minimum discharge for generation (Qmin) for various types of turbines
Type of Turbine Flow / Max. Flow
(Qmin / Qmax)
Turbine Efficiency /
Max. Turbine Efficiency
(min / max)
Conditions
Horizontal Shaft
Francis
30% 0.70 Light burdened runner
Horizontal Shaft Pelton 15% 0.75 2 nozzles
Horizontal Shaft Pelton 30% 0.90 1 nozzle
Crossflow 15% 0.75 Twin control vanes
Crossflow 40% 0.75 Single control vane
Turgo Impulse 10% 0.75 2 nozzles
Turgo Impulse 20% 0.75 1 nozzle
Reverse Pumps Generating operation is difficult other than at the rated discharge
(3) Decision on Scale of Development and Power Demand Facility
a) Case where change of demand plan is difficult
When it is difficult to change the power demand facility and its capacity assumed
in the demand plan, the assumed maximum demand capacity within the range of
the Pumax becomes the optimal scale of development.
Qumin
≧
m3/s kW
1 2 3 4 5 6 7 8 9 10 11 12
Qmax
:Power generation potential
:Max output of possible development
Permissible break power generation
Pumax

Manual for Micro-Hydro Power Development Chapter 4
- 4-19 -
Fig. 4.4.3 Optical scale of development for case where constant demand
throughout the year is assumed
Figure 4.4.4 Optimal scale of development for case of seasonal demand
fluctuation
Qumin
m3/skW
1 2 3 4 5 6 7 8 9 10 11 12
Optimum development
scale
:Power generation potential :Max. output of possible development
:Max. demand capacity
Qumin
≧Qmin
m3/skW
1 2 3 4 5 6 7 8 9 10 11 12
Qmax
:Power generation potential :Max. output of possible development
: Estimated power
Optimum development
scale

Manual for Micro-Hydro Power Development Chapter 4
- 4-20 -
b) Case where change of demand plan is possible
When a change of the demand plan to some extent is possible, the demand
capacity is changed within the range of the Pumax to select the most effective case.
The following criteria can be used to judge the best case. Their general priority
can be difficult to decided, however, because it depends on each development
site.
Economy
Social advantages (creation of new employment, promotion of tourism / industry
and others)
Intentions of developer
Others
When economy of the project is given priority, the demand plan must be
formulated to maximize the effective utilization rate of the power generation
potential. This is in view of the fact that generated electric energy in excess of the
demand capacity by an independent system such as a small-scale hydropower
plant cannot be expected to have any benefit.
Annual electric generation usable by demand facility
Load Factor = (%)
Annual possible electric generation
The concrete processes to determine the optimal scale of development are
described below:
a. Setting up of demand
Several cases of demand plan are formulated based on the demand projection
from survey results but within the range of the distribution. At this time, the
priority of each demand facility must be carefully analyzed, taking the
following items into consideration:
Importance of facility (equipment)
Profit from each demand facility

Manual for Micro-Hydro Power Development Chapter 4
- 4-21 -
Fig.4.4.5 Example of demand plan
b. Calculation of effective use of electric energy
The annual effective use of electric energy is calculated by comparing the
power generation potential not higher than Pumax with the demand set in “a.”
above for each season.
Fig.4.4.6 Example of annual supply and demand balance
c. Decision on optimal scale of development
By calculating the unit construction cost or the cost-benefit ratio per kWh for
kW
1 2 3 4 5 6 7 8 9 10 11 12
:Demand ‘Case 1’
:Demand ‘Case 2’
:Demand ‘Case 3’
kW
1 2 3 4 5 6 7 8 9 10 11 12
Efficient use of energy
In case of demand ‘Case
:Demand ‘Case 1’
:Power Generation Potential
:Max. Scale of Possible Development

Manual for Micro-Hydro Power Development Chapter 4
- 4-22 -
the effective use of electric energy, the optimal scale of development is
established to minimize such unit cost or cost-benefit ratio.
Formula 3-1a: Case of Unit Construction Cost
Formula 3-1b: Case of Cost-Benefit Ratio
Annual cost (C) = annual cost of the plant in question
= construction cost×annual expense ratio (use of the
standard calculation method for an ordinary case)
Benefit (V) = (electricity charge for each power demand facility)
= (demand capacity (kW)×basic charge×months+
effective electric energy (kWh)×metered charge)
C/V = annual cost (C) / benefit (V)
4.4.3 Daily Supply and Demand Plan
Electricity is basically used for lighting and operation of household appliances such as
television and radio. Because of lesser demand in daytime, electricity is more than
enough so the excess electricity is only used by a dummy load. So it is necessary to
plan the use of the excess power for livelihood or local industry such as rice mill, coffee
mill and ice plant in the daytime. That image is shown as follows Fig. 4.4.7.
Unit construction cost per kWh =Construction cost
Annual effective electric energy

Manual for Micro-Hydro Power Development Chapter 4
- 4-23 -
Fig.4.4.7 Effective use in the daytime electricity
forHouseholds
LampT.V
Radioetc.
forHouseholds
LampT.V
Radioetc.
Night Time Night TimeDay Time
Outp
ut
and
Dem
and
(kW
)
No Demands
Time
Dai
ly O
utu
t (k
W)
forHouseholds
LampT.V
Radioetc.
forHouseholds
LampT.V
Radioetc.
Night Time Night TimeDay Time
Outp
ut
and
Dem
and
(kW
)
No Demands
Time
Local Industry
Rice millCoffee millIce plant
etc.
Dai
ly O
utu
t (k
W)

Manual for Micro Hydro Power Development Chapter 5
-5- 1 -
Chapter 5 DESIGN FOR CIVIL STRUCTURES
The main obstacle for a small-scale hydropower plant is the high development cost. In
this chapter, element technologies are described assuming the need to reduce the
construction cost of civil structures (no description is given for those which equally
apply to the design of an ordinary hydropower plant).
5.1 Basic Equation for Civil Design
The discharge is one of the important aspects to consider in the design. It is directly proportional to
the cross sectional area and velocity of the water.
5.2 Intake Weir (Dam)
5.2.1 Types of Intake Weir
There are a number of basic types of dam or intake weirs as listed below:
(1) Concrete gravity dam
(2) Floating concrete dam
(3) Earth dam
(4) Rockfill dam
(5) Wet masonry dam
(6) Gabion dam
(7) Concrete reinforced gabion dam
(8) Brushwood dam
(9) Wooden dam Wet masonry dam
Q = A x V
Q: Discharge (m3/s)
A: Cross sectional area of water (m2)
V: Velocity of water (m/s)
V = Q / A
A = Q / V AV
1 secondV
A
1 second
○ meters/
○ meters/

Manual for Micro Hydro Power Development Chapter 5
-5- 2 -
(10) Wooden frame with gravel dam
The rockfill and gabion dams and the like are popularly used in Southeast Asian
countries because of several advantages such as (i) little influence by the conditions of
the ground base and (ii) relatively easy to repair when damaged. However, they could
be damaged by flooding due to their structure and their application should be carefully
examined on the importance of constructing such a civil structure and the conditions of
the downstream.

Manual for Micro Hydro Power Development Chapter 5
-5- 3 -
Table 5.2.1 Basic types of intake weirs for small-scale hydropower plant and application
conditions
Type Outline Drawing Application Conditions Concrete gravity dam
Concrete is used for the construction of the entire body.
Foundations: in principle, bedrock River conditions: not affected by the
gradient, discharge or level of sediment load
Intake conditions: good interception performance and intake efficiency
Floating concrete dam
Lengthened infiltration path of the foundations by means of cut-off, etc. to improve the interception performance
Foundations: in principle, gravel River conditions: not affected by the
gradient, discharge or level of sediment load
Intake conditions: good interception performance and intake efficiency
Earth dam Earth is used as the main material for the body; the introduction of a riprap and core wall may be necessary depending on the situation.
Foundations: variable from earth to bedrock River conditions: gentle flow and
easy to deal with flooding
Intake conditions: good intake efficiency because a high interception performance is possible with careful work
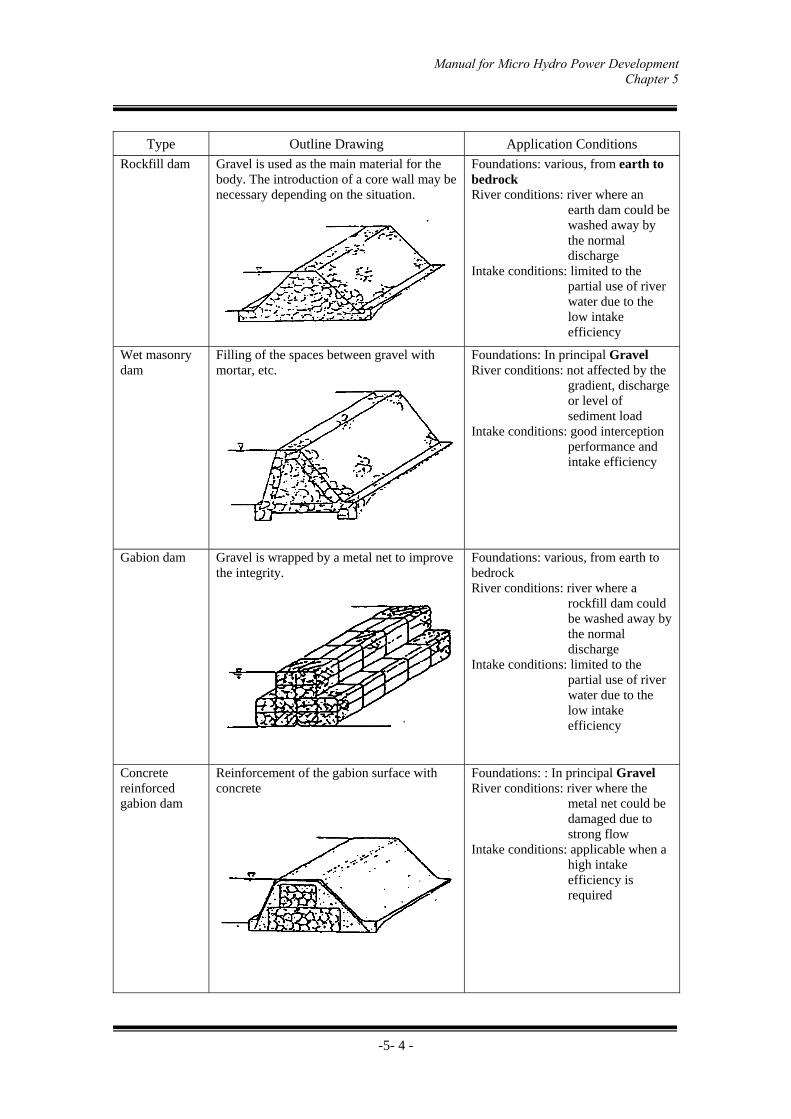
Manual for Micro Hydro Power Development Chapter 5
-5- 4 -
Type Outline Drawing Application Conditions
Rockfill dam Gravel is used as the main material for the body. The introduction of a core wall may be necessary depending on the situation.
Foundations: various, from earth to bedrock River conditions: river where an
earth dam could be washed away by the normal discharge
Intake conditions: limited to the partial use of river water due to the low intake efficiency
Wet masonry dam
Filling of the spaces between gravel with mortar, etc.
Foundations: In principal Gravel River conditions: not affected by the
gradient, discharge or level of sediment load
Intake conditions: good interception performance and intake efficiency
Gabion dam Gravel is wrapped by a metal net to improve the integrity.
Foundations: various, from earth to bedrock River conditions: river where a
rockfill dam could be washed away by the normal discharge
Intake conditions: limited to the partial use of river water due to the low intake efficiency
Concrete reinforced gabion dam
Reinforcement of the gabion surface with concrete
Foundations: : In principal Gravel River conditions: river where the
metal net could be damaged due to strong flow
Intake conditions: applicable when a high intake efficiency is required

Manual for Micro Hydro Power Development Chapter 5
-5- 5 -
Type Outline Drawing Application Conditions
Brushwood dam
Simple weir using locally produced tree branches, etc.
Foundations: various, from earth to gravel layer River conditions: loss due to flooding is assumed Intake conditions: at a site with a low
intake volume or intake from a stream to supplement the droughty water flow
Wooden dam Weir using wood
Foundations: various, from earth to bedrock River conditions: relatively gentle
flow with a low level of sediment transport
Intake conditions: a certain level of intake efficiency is secured with a surface coating, etc.
Wooden frame with gravel dam
The inside of the wooden frame is filled with gravel to increase the stability.
Foundations: various, from earth to bedrock River conditions: river at which a
rockfill dam could be washed away by the normal discharge
Intake conditions: limited to the partial use of river water due to the low intake efficiency
5.2.2 Weir Height Calculation
The weir volume is proportionate to the square of the height, it is important to decide
the weir height taking the following conditions into consideration.
(1) Conditions restricting waterway elevation
Manual for Micro Hydro Power Development Chapter 5
-5- 6 -
To decide for the weir height, it is necessary to take the topographical and geological
conditions of the waterway route into consideration in addition to the conditions at the
weir construction site. Careful examination is necessary at the site where the
construction cost accounts for a large portion of the total construction cost.
In case the waterway is to be constructed along an existing road, the weir height is
often planned with reference to the elevation of the road.
(2) Possibility of riverbed rise in downstream
Since the weir height for a small-scale hydropower plant is generally low, there is
possibility that its normal function could be disrupted by a rise of the riverbed in the
downstream.
Accordingly, the future riverbed rise should be considered in the selection of the weir
height if the planned site falls under any of the following cases:
1) Gently sloping river with a high level of transported sediment
2) Existence of not fully filled check dam, etc. in the downstream of the planned
intake weir
3) Presence of erosion in the downstream with possibility of continuous erosion in
the future
4) Existence of a narrow section in the downstream which obstructs the flow of
sediment and/or driftwood
(3) Conditions to remove sediment from upstream of the weir and settling basin by
intake method (Tyrolean intake and side intake)
Under normal circumstances, the weir height should be planned to exceed the calculated
value by the following method to ensure the smooth removal of sediment from the
upstream of the weir and the settling basin.
1) Side intake
In the case of side intake, following Case (a) or Case (b), whichever is higher, is
adopted.
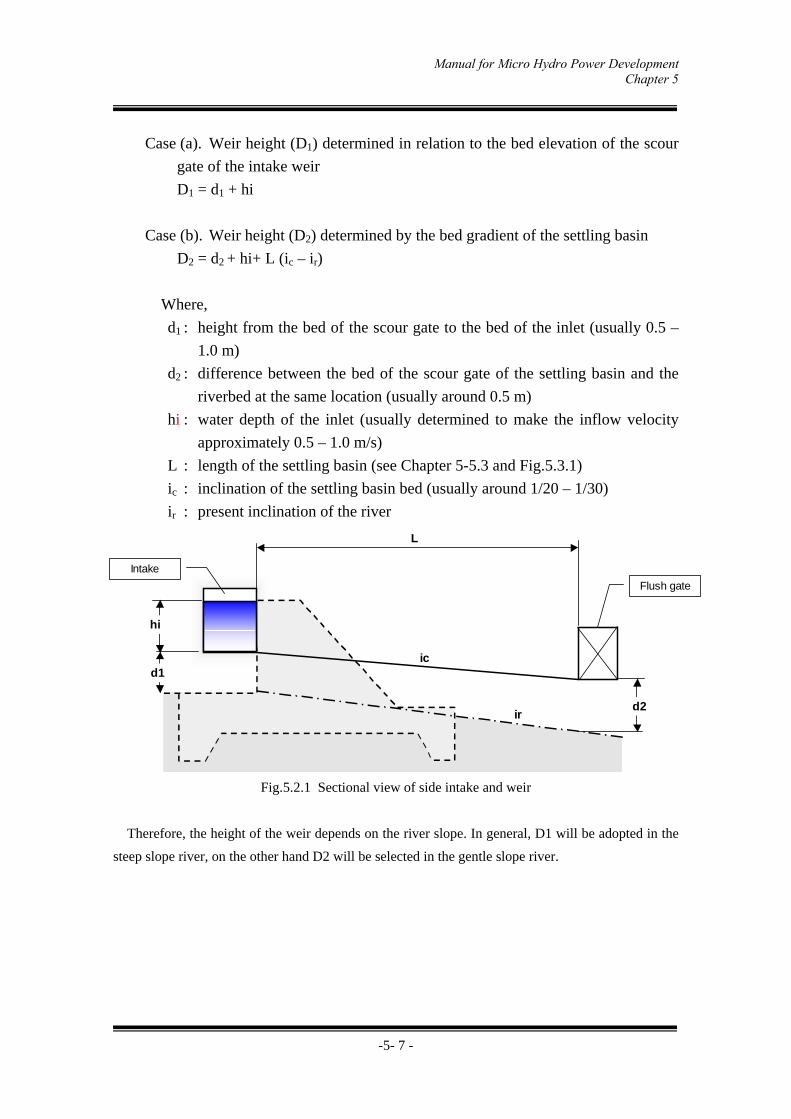
Manual for Micro Hydro Power Development Chapter 5
-5- 7 -
Case (a). Weir height (D1) determined in relation to the bed elevation of the scour
gate of the intake weir
D1 = d1 + hi
Case (b). Weir height (D2) determined by the bed gradient of the settling basin
D2 = d2 + hi+ L (ic – ir)
Where,
d1 : height from the bed of the scour gate to the bed of the inlet (usually 0.5 –
1.0 m)
d2 : difference between the bed of the scour gate of the settling basin and the
riverbed at the same location (usually around 0.5 m)
hi : water depth of the inlet (usually determined to make the inflow velocity
approximately 0.5 – 1.0 m/s)
L : length of the settling basin (see Chapter 5-5.3 and Fig.5.3.1)
ic : inclination of the settling basin bed (usually around 1/20 – 1/30)
ir : present inclination of the river
Fig.5.2.1 Sectional view of side intake and weir
Therefore, the height of the weir depends on the river slope. In general, D1 will be adopted in the
steep slope river, on the other hand D2 will be selected in the gentle slope river.
Flush gate
ic
ir
Intake
L
hi
d1
d2

Manual for Micro Hydro Power Development Chapter 5
-5- 8 -
2) Tyrolean intake
A Tyrolean intake where water is taken from the bottom assumes that the front of
the weir is filled with sediment and, therefore, the weir height is determined by
Case D2 for side intake.
D2 = d2 + hi + L (ic – ir)
Fig.5.2.2 Sectional view of Tyrolean intake and weir
() Influence on electric energy generated
At a site where the usable head is small or where it is planned to secure the necessary
head by a weir, the weir height significantly influences the level of generated electric
energy. Accordingly, it is necessary to determine the weir height at a site by comparing
the expected changes of both the construction cost and the generated electric energy
because of different weir heights.
(5) Influence of back water
When roads, residential land, farmland and bridges, etc. exist in a lower elevation area
in the upstream of a planned intake weir site, it is necessary to determine the weir height
to prevent flooding due to back water. Particularly at a site with a high weir height, the
degree of influence on the above features must be checked by means of back water
calculation or other methods.
Inlet L
ic
ir d2
D2 hi
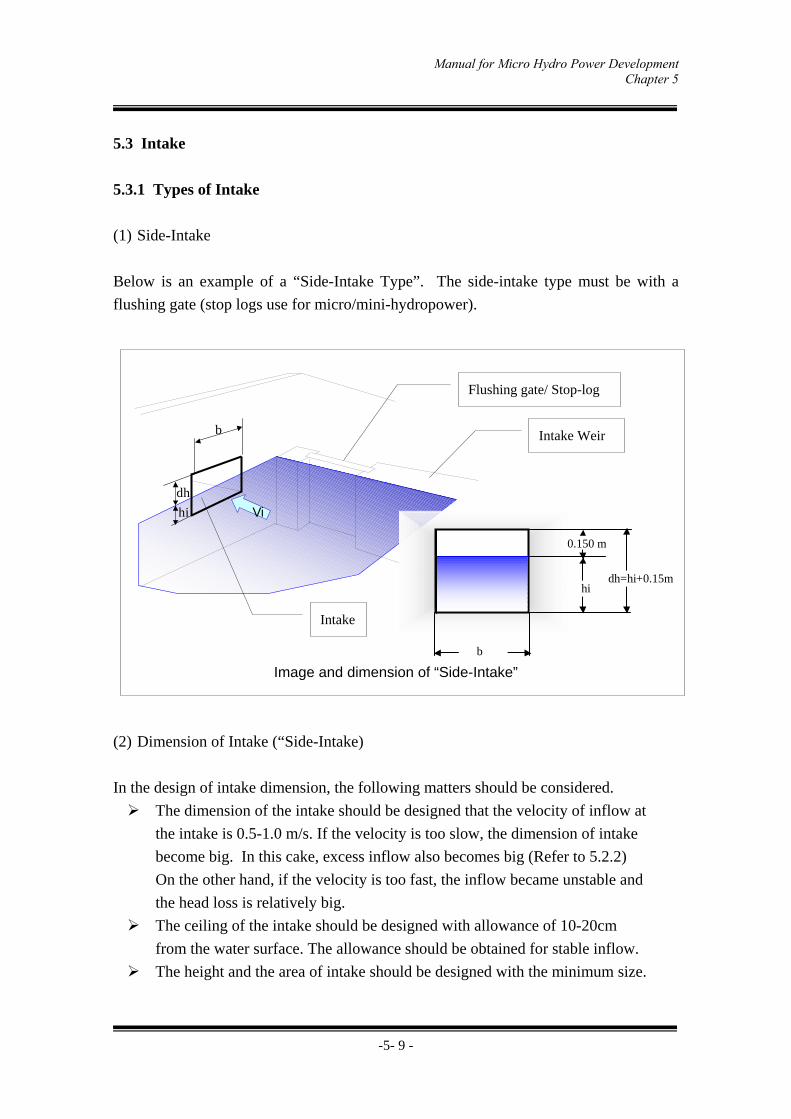
Manual for Micro Hydro Power Development Chapter 5
-5- 9 -
5.3 Intake
5.3.1 Types of Intake
(1) Side-Intake
Below is an example of a “Side-Intake Type”. The side-intake type must be with a
flushing gate (stop logs use for micro/mini-hydropower).
Image and dimension of “Side-Intake”
(2) Dimension of Intake (“Side-Intake)
In the design of intake dimension, the following matters should be considered.
The dimension of the intake should be designed that the velocity of inflow at
the intake is 0.5-1.0 m/s. If the velocity is too slow, the dimension of intake
become big. In this cake, excess inflow also becomes big (Refer to 5.2.2)
On the other hand, if the velocity is too fast, the inflow became unstable and
the head loss is relatively big.
The ceiling of the intake should be designed with allowance of 10-20cm
from the water surface. The allowance should be obtained for stable inflow.
The height and the area of intake should be designed with the minimum size.
b
hi
dh
Vi
hidh=hi+0.15m
0.150 m
b
Intake Weir
Flushing gate/ Stop-log
Intake

Manual for Micro Hydro Power Development Chapter 5
-5- 10 -
(3) Tyrolean Intake
There are several types of simple intake designs, which aims at reducing the weir height
and omitting the flushing gate (hereinafter referred to as the Tyrolean intake design) for
a hydropower plant. Two typical examples are listed below.
Bar screen type
Bar-less type
The details of these two types are shown in Table 5.3.1.

Manual for Micro Hydro Power Development Chapter 5
Table 5.3.1 Typical examples of Tyrolean intake methods
Intake Method Outline Drawing Characteristics Advantages and Problems Found by Actual Performance Survey
Bar screen type
If a screen is installed to cover most of the river channel, it is highly resistant to riverbed fluctuations. A sufficiently wide intake width enables 100% intake of river water. As overflow may occur due to fallen leaves, etc. gathering on the screen surface, the screen width should have a sufficient margin. The sedimentation capacity of the weir to deal with sediment inflow should also be analysed.
This type is popularly used and the intake rate is said to be generally 0.1 – 0.3 m3/s per unit width based on a bar installation angle of up to 30, an inter-bar space of 20 – 30 mm and a bar length of approximately 1 m.
< Advantages > A scour gate of intake weir can be omitted. A compact intake facility is suitable for a
narrow or rapid river. Stable intake is possible despite a change of the
riverbed upstream. < Problems > At the time of flooding or water discharge,
sediment and litter flow into the waterway. A screen which is clogged with gravel, etc.
requires much labour for its removal.
Bar-less type The running water usually overflows the fixed weir top and is guided into the settling basin via an intake channel placed across the river channel and along the endsill (deflector). With an increase of the river discharge, the running water overflows the endsill and eventually becomes a rapid flow to fly over the endsill, making intake impossible at the time of flooding. However, sediment deposited in the intake channel is washed away towards the downstream of the endsill, making maintenance of the intake channel easier. While the sectional form of this type is similar to that of the bar screen type, the absence of a screen means a reduction of the maintenance cost and labour related to the screen.
< Advantage) A compact intake facility is suitable for a
narrow or rapid river. Stable intake is possible despite a change of the
riverbed upstream. Sediment and litter are discharged naturally at
the time of flooding. < Problem > Plenty of sediment and litter inflow to the
waterway. Frequently of scouring of settling basin is
required.
-5- 11-

Manual for Micro Hydro Power Development Chapter 5
-5- 12-
5.3.2 Important Points for Intake Design (for Side-Intake)
For the design of the intake for a small-scale hydropower plant, it is necessary to
examine the possible omission of an intake gate in order to achieve cost reduction.
In the case of a small-scale hydropower plant, the headrace is usually an open channel, a
covered channel or a closed conduit. When this type of headrace is employed, it is
essential to avoid inflow of excess water , which considerably exceeds the design
discharge, as it will directly lead to the destruction of the headrace.
Meanwhile, the use of an automatic control gate for a small-scale hydropower plant
results an increase in construction cost, a manual control is an option. In the case of the
intake facility for a small-scale hydropower plant being constructed in a remote
mountain area, a swift response to flooding is difficult. The following method is,
therefore, proposed to control the inflow at the time of flooding without the use of a
gate.
(1) Principle
This method intends the design of an intake which becomes an orifice with a rise of the
river water level due to flooding.
The inflow volume in this case is calculated by the formula below.
Flood Water Level
→
Water Level of Spillway
Normal Water Level
Bsp
hsp
Ai
hi
dh
dh
hi
bi
H

Manual for Micro Hydro Power Development Chapter 5
-5- 13-
Q f= Ai ×Cv × Ca × (2 ×g × H ) 0.5
Where,
Qf : inflow volume of submerged orifice (m3/s)
Ai : area of intake (m2) Ai=bi × (dh + hi) dh=0.10~0.15m
hi : water depth at the intake opening (m)
bi : width of the intake opening (m)
dh : clearance at the intake
Cv : coefficient of velocity: Cv = 1/(1 + f)
f : coefficient of inflow loss (see Fig.5.2.1)
Fig.5.2.1 Coefficient of inflow loss of various inlet form
Bsp, hsp: refer to Chapter 5-5.3 Settling basin
Ca : coefficient of contraction (approximately 0.6)
H: water level difference between upstream and downstream of the orifice during
flood (m)
(2) Equipment outline
The important points for design are listed below:
1) It is necessary for the intake to have a closed tap instead of an open tap so that it
becomes a pressure intake when the river water level rises.
2) The intake should be placed at a right angle to the river flow direction wherever
possible so that the head of the approaching velocity at the time of flooding is
minimized.
3) As water inflow at the time of flooding exceeds the design discharge, the spillway
capacity at the settling basin or starting point of the headrace should be fairly
large.
Angularity Haunch Rounded
Bellmouth Protruding
f = 0.1 (round) - 0.2 (orthogon)
f = 0.5 f = 0.25
f = 0.05 – 0.01 f = 0.1 f = 0.5 + 0.3 cosθ + 0.2 cos2θ
θ
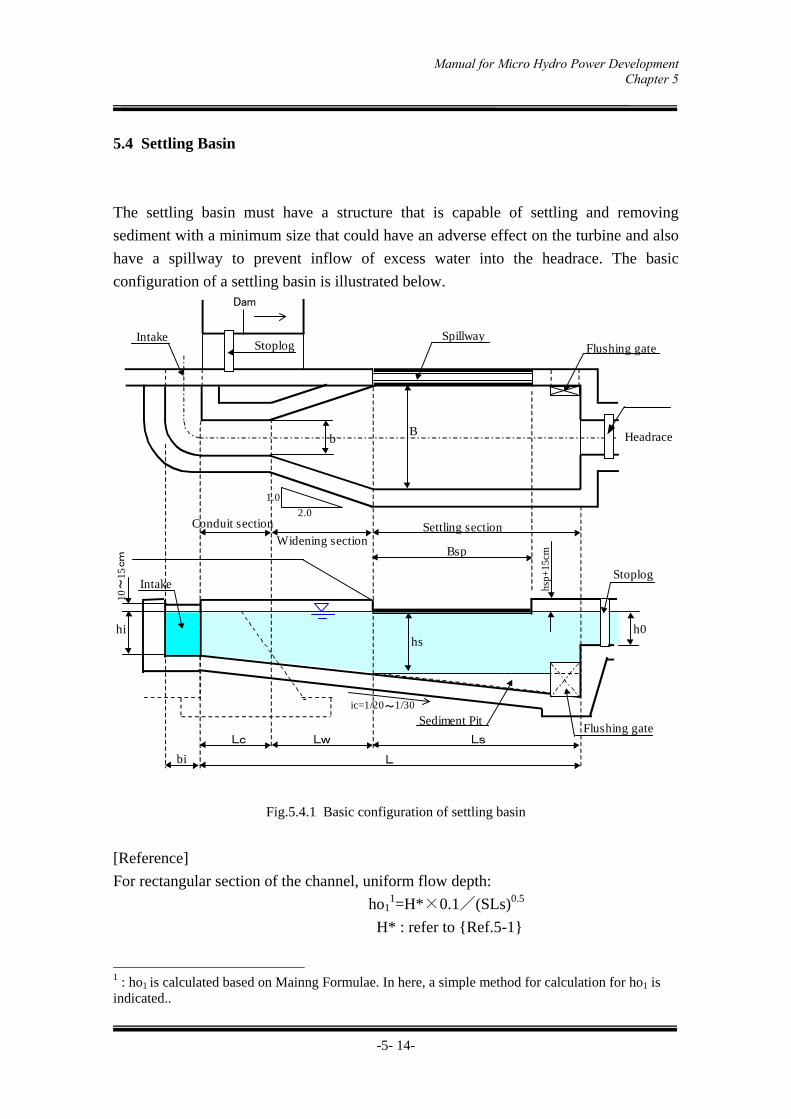
Manual for Micro Hydro Power Development Chapter 5
-5- 14-
5.4 Settling Basin
The settling basin must have a structure that is capable of settling and removing
sediment with a minimum size that could have an adverse effect on the turbine and also
have a spillway to prevent inflow of excess water into the headrace. The basic
configuration of a settling basin is illustrated below.
Fig.5.4.1 Basic configuration of settling basin
[Reference]
For rectangular section of the channel, uniform flow depth:
ho11=H*×0.1/(SLs)0.5
H* : refer to {Ref.5-1}
1 : ho1 is calculated based on Mainng Formulae. In here, a simple method for calculation for ho1 is indicated..
Conduit sectionWidening section
Settling section
Bb
1.0
2.0
Dam
SpillwayStoplog Flushing gate
Intake
Headrace
Bsp
hs
hsp+
15cm
h0
10~
15cm
hi
ic=1/20~1/30
IntakeStoplog
bi
Lc Lw Ls
L
Sediment PitFlushing gate
Manual for Micro Hydro Power Development Chapter 5
-5- 15-
SLs : slope of top end of the headrace
ho2={(α×Qd2)/(g×B2)}1/3
α=1.1
Qd= Design Discharge (m3/s)
g=9.8
B:Width of Headrace (m)
if ho1<ho2, ho=ho1
if ho1≦ho2, ho=ho2
Each of these sections has the following function.
(1) Conduit section
Conduit section connects the intake with the settling basin. The length of the conduit
section should be minimized.
(2) Widening section:
This section regulates water flow from the conduit channel to prevent the occurrence of
whirlpools and turbulent flow and reduces the flow velocity inside the settling basin to a
predetermined velocity.
(3) Settling section:
This section functions to settle sediments/grains size of 0.5 – 1 mm. Theminimum
length (l) is calculated by the following formula based on the relation between the
settling speed (U), flow velocity in the settling basin (V) and water depth (hs).
The length of the settling basin (Ls) is usually determined so as to incorporate a margin
to double the calculated length by the said formula.
Where,
l : minimum length of settling basin (m)
hs : water depth of settling basin (m) ( -see Fig.5.31)
U : marginal settling speed for sediment to be settled (m/s)
usually around 0.1 m/s for a target grain size of 0.5 – 1 mm.
l ×hs L s= 2×l V
U

Manual for Micro Hydro Power Development Chapter 5
-5- 16-
V : mean flow velocity in settling basin (m/s)
usually around 0.3 m/s but up to 0.6 m/s is tolerated in the case where the
width of the settling basin is restricted.
V = Qd/(B×hs)
Qd: design discharge (m3/s)
B : width of settling basin (m)
(4) Sediment pit:
This is the area in which sediment is deposited.
(5) Spillway
Spillway drains the submerged inflow which flows from the intake. The sizes of
spillway will be decided by following equation.
Qf= C×Bsp×hsp1.5 →hsp={Qf /(C×Bcp)}1/1.5
Where,
Qf : inflow volume of submerged orifice (m3/s, see Chapter 5-5.2.2 (1))
C : coefficient =1.80
hsp: water depth at the spillway (m, see Fig 5.3.1)
Bsp: width of the spillway (m, see Fig.5.3.1)

Manual for Micro Hydro Power Development Chapter 5
-5- 17-
5.5 Headrace
5.5.1 Types and Structures of Headrace
Because of the generally small amount of water conveyance, the headrace for a small-
scale hydropower plant basically adopts an exposed structure, such as an open channel
or a covered channel, etc. Some examples and their basic structures are given in Table
5.5.1 and Table 5.5.2 respectively.

Manual for Micro Hydro Power Development Chapter 5
Table 5.5.1 Types of headraces for small-scale hydropower plants
Type Outline Drawing Advantages and Problems Typical Structure
Open channel < Advantages > Relatively inexpensive Easy construction < Problems > Possible inflow of sediment from
the slope above High incursion rate of fallen leaves,
etc.
Simple earth channel Lined channel (dry or wet
masonry lining; concrete lining) Fenced channel (made of wood,
concrete or copper) Sheet-lined channel Half-tube channel (corrugated
piping, etc.)
Closed conduit / Covered channel
< Advantages > Generally large earth work volume Low incursion rate of sediment and
fallen leaves, etc. into the channel < Problems > Less easier channel inspection,
maintenance work, including sediment removal, and repair
Buried tube (Hume, PVC or FRPM)
Box culvert Fenced channel with cover
-5- 18 -

Manual for Micro Hydro Power Development Chapter 5
- 5-19 -
Table 5.5.2 Basic structure of headraces for small-scale hydropower plants
Type Outline Diagram Advantages and Problems
Simple earth channel
< Advantages > Easy construction Inexpensive Easy repair < Problems > Possible scouring or collapse of the
walls Not applicable to highly permeable
ground Difficult to mechanise the sediment
removal work Lined channel (rock and stone)
< Advantages > Relatively easy construction Can be constructed using only local
materials High resistance to side scouring Relatively easy repair < Problems > Not applicable to highly permeable
ground
Wet masonry channel
< Advantages > Local materials can be used Strong resistance to back scouring Can be constructed on relatively high
permeable ground. Easy construction at the curved
section due to the non-use of forms < Problems > More expensive than a simple earth
channel or dry masonry channel (rock/stone-lined channel)
Relatively takes labour hours. Concrete channel
< Advantages > High degree of freedom for cross-
section design < Problems > Difficult construction when the inner
diameter is small Relatively long construction period
n=0.030
n=0.025
Plastered : n=0.015
Non Plastered : n=0.020
n=0.015

Manual for Micro Hydro Power Development Chapter 5
- 5-20 -
Type Outline Diagram Advantages and Problems
Wood fenced channel
< Advantages > Less expensive than a concrete
channel Flexible to allow minor ground
deformation < Problems > Limited use with earth foundations Unsuitable for a large cross-section Difficult to ensure perfect water-
tightness Liable to decay
Box culvert channel
< Advantages > Easier construction than a Hume pipe
on a slope with a steep cross-sectional gradient
Relatively short construction period and applicable to a small cross-section when ready-made products are used
Rich variety of ready-made products < Problems > Heavy weight and high
transportation cost when ready-made products are used
Long construction period when box culverts are made on site
Concrete pipe channel
< Advantages > Easy construction on a gently sloping
site Relatively short construction period High resistance to external pressure Applicable to a small cross-section Elevated construction with a short
span is possible < Problems > Heavy weight and high
transportation cost
n=0.015
n=0.015
n=0.015

Manual for Micro Hydro Power Development Chapter 5
- 5-21 -
5.5.2 Determining the Cross Section and Longitudinal Slope
The size of cross section and slope should be determined in such a matter that the
required turbine discharge can be economically guided to the head tank. Generally, the
size of cross section is closely related to the slope. The slope of headrace should be
made gentler for reducing head loss (difference between water level at intake and at
head tank) but this cause a lower velocity and thus a lager cross section. On the contrary,
a steeper slope will create a higher velocity and smaller section but also a lager head
loss.
Generally, in the case of small-hydro scheme, the slope of headrace will be determined
as 1/500 – 1/1,500. However in the case of micro-hydro scheme, the slope will be
determined as 1/50 – 1/500, due to low skill on the survey of levelling and construction
by local contractor.
The cross section of headrace is determined by following method.
(1) Method of calculation
Qd= A ×R 2/3×SL 1/2 /n
Qd : design discharge for headrace (m3/s)
A : area of cross section (m2)
R : R=A/P (m)
P : length of wet sides/ Wetted perimeter (m) refer to next figure.
h
b
A
bLength of red-line : P
1
m
Slope =1/m: SL
Q
Slope of headrace SL Wetted perimeter

Manual for Micro Hydro Power Development Chapter 5
- 5-22 -
SL : longitudinal slope of headrace (e.g. SL= 1/100=0.01)
n : coefficient of roughness (see Table 5.4.2)
For instants, in the case of rectangular cross section, width (B)=0.6m, water depth
(h)=0.5m, longitudinal slope (SL)=1/200=0.005, coefficient of roughness (n)=0.015.
A= B×h = 0.6 × 0.5 = 0.30 m2
P= B + 2 × h = 0.6 + 2 × 0.5 =1.60 m
R= A/P = 0.30/1.60 = 0.188 m
∴ Qd= A ×R 2/3×SL1/2 /n = 0.30 ×1.60 2/3×0.005 1/2 /0.015 = 1.94 m3/s
(2) Simple method
In order to simplify the above method, following method for determining the cross
section is perpetrated in [Reference 5-1 Simple Method for Determining the Cross
Section]
This reference will be used in determination of cross section in following two sectional
forms.
Rectangular cross section Trapezoid cross section
H* should be calculated on each different slopes. For instants, in the case of trapezoid
cross section, design discharge (Q)=0.5m3/s, width (B)=0.8m, longitudinal slope
(SLA,B,C,D)=1/100, 1/50, 1/100, 1/200 which is the gentlest potion of the headrace,
coefficient of roughness (n)=0.015.
Water depth (H*) is approximately 0.3m in Reference 5-1 Fig-4. Therefore actual water
depth (H) is
H = H* × 0.1 /(SL)0.5
HA,C = H* × 0.1 /(SLA,C)0.5 = 0.3×0.1/(0.01) 0.5 = 0.3
HB = H* × 0.1 /(SLB)0.5 = 0.3×0.1/(0.02) 0.5 = 0.21
HD = H* × 0.1 /(SLD)0.5 = 0.3×0.1/(0.005) 0.5 = 0.42
and height of the cross section of Slope A,C is 0.60m(0.3+0.2~0.3),
B=0.6 and 0.8m
1.0
m=0.5 B=0.6 and 0.8m
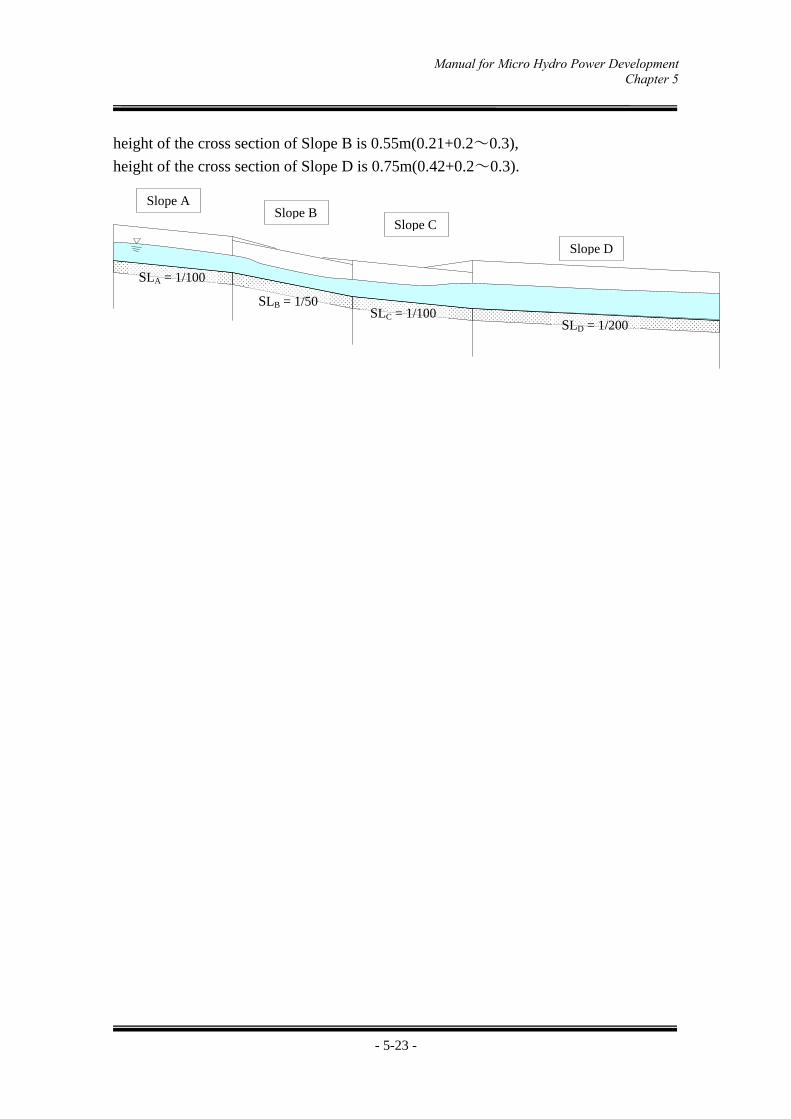
Manual for Micro Hydro Power Development Chapter 5
- 5-23 -
height of the cross section of Slope B is 0.55m(0.21+0.2~0.3),
height of the cross section of Slope D is 0.75m(0.42+0.2~0.3).
Slope A Slope B
Slope C
Slope D
SLA = 1/100
SLB = 1/50 SLC = 1/100
SLD = 1/200
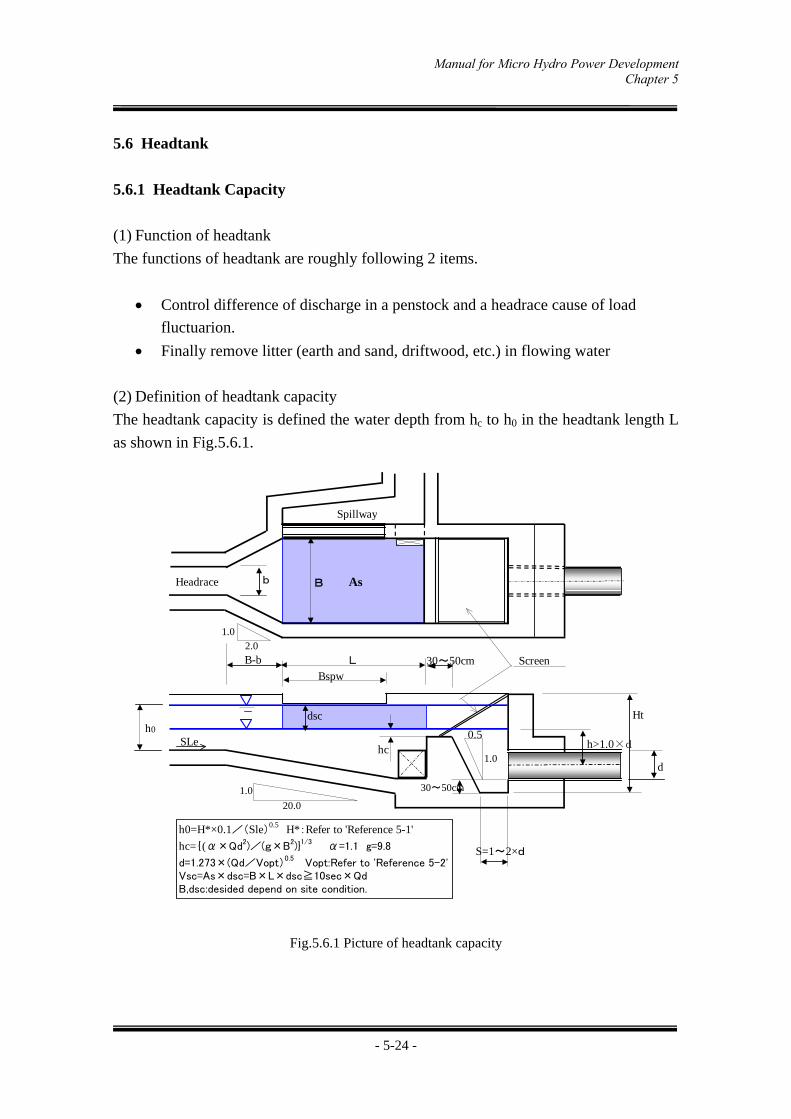
Manual for Micro Hydro Power Development Chapter 5
- 5-24 -
5.6 Headtank
5.6.1 Headtank Capacity
(1) Function of headtank
The functions of headtank are roughly following 2 items.
Control difference of discharge in a penstock and a headrace cause of load
fluctuarion.
Finally remove litter (earth and sand, driftwood, etc.) in flowing water
(2) Definition of headtank capacity
The headtank capacity is defined the water depth from hc to h0 in the headtank length L
as shown in Fig.5.6.1.
Fig.5.6.1 Picture of headtank capacity
0.5
1.0
dsc
As
d
Bspw
hc
h0
h>1.0×d
S=1~2×d
1.0
20.0
B
L
1.02.0
30~50cm
b
B-b
Headrace
30~50cm
Ht
Spillway
Screen
SLe
h0=H*×0.1/(Sle)0.5 H*:Refer to 'Reference 5-1'
hc={(α×Qd2)/(g×B2)}1/3 α=1.1 g=9.8
d=1.273×(Qd/Vopt)0.5
Vopt:Refer to 'Reference 5-2'Vsc=As×dsc=B×L×dsc≧10sec×QdB,dsc:desided depend on site condition.

Manual for Micro Hydro Power Development Chapter 5
- 5-25 -
Headtank capacity Vsc = As×dsc=B×L×dsc
where, As: area of headtank
B : width of headtank
L : length of headtank
dsc: water depth from uniform flow depth of a headrace when using
maximum discharge (h0) to critical depth from top of a dike for sand
trap in a headtank (hc)
[Refference]
In oblong section, uniform flow depth: ho=H*×0.1/(SLe)0.5
H* : refer to {Ref.5-1}
SLe : slope of tail end of the headrace
critical depth: hc={(α×Qd2)/(g×B2)}1/3 α: 1.1 g : 9.8
(3) Determine a headtank capacity
The headtank capacity should be determined in consideration of load control method
and discharge method as mentioned below.
a. In case only the load is controlled
The case only control load (demand) fluctuation is considered, a dummy load
governor is adopted. A dummy load governor is composed of water-cooled heater
or air-cooled heater, difference of electric power between generated in powerhouse
and actual load is made to absorb heater. The discharge control is not performed.
The headtank capacity should be secured only to absorb the pulsation from
headrace that is about 10 times to 20 times of the design discharge (Qd).
A view showing a frame format of load controlled by a dummy load governor is
shown in Fig.5.6.2.
Fig.5.6.2 Pattern diagram of dummy load consumption
Generated power
Dummy load consumption
Time
Power demand
Ele
ctri
c po
wer
Wat
er d
isch
arge
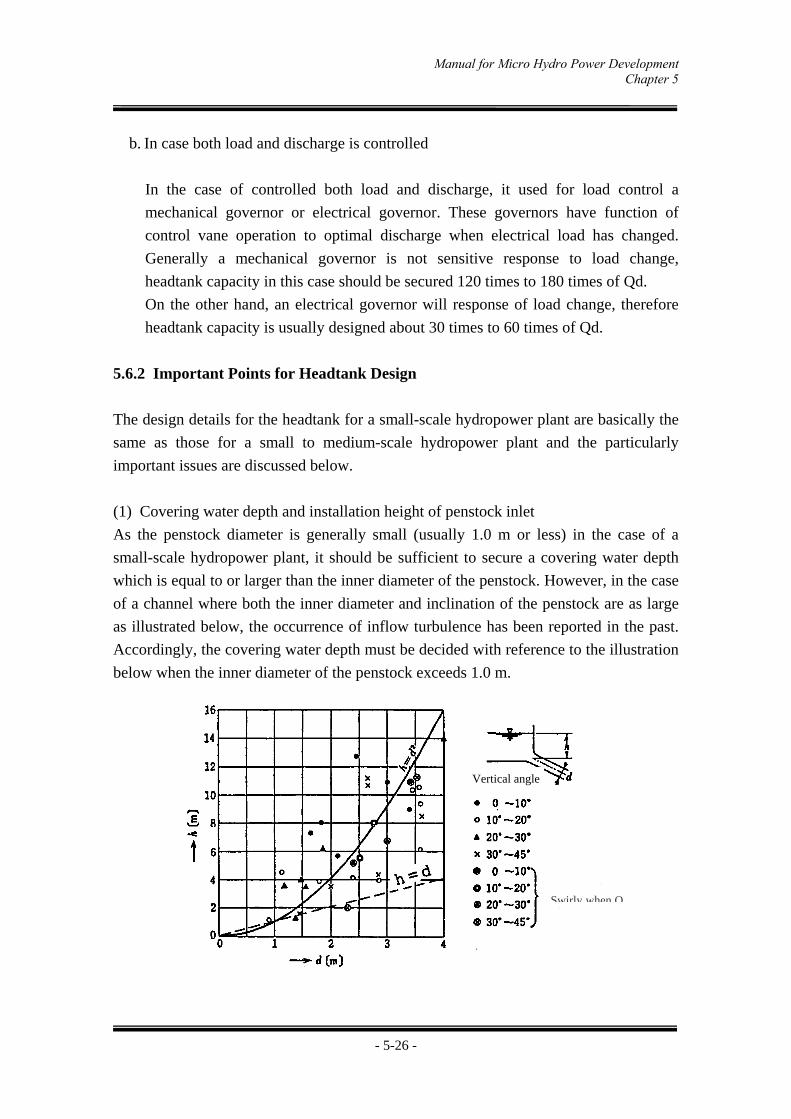
Manual for Micro Hydro Power Development Chapter 5
- 5-26 -
b. In case both load and discharge is controlled
In the case of controlled both load and discharge, it used for load control a
mechanical governor or electrical governor. These governors have function of
control vane operation to optimal discharge when electrical load has changed.
Generally a mechanical governor is not sensitive response to load change,
headtank capacity in this case should be secured 120 times to 180 times of Qd.
On the other hand, an electrical governor will response of load change, therefore
headtank capacity is usually designed about 30 times to 60 times of Qd.
5.6.2 Important Points for Headtank Design
The design details for the headtank for a small-scale hydropower plant are basically the
same as those for a small to medium-scale hydropower plant and the particularly
important issues are discussed below.
(1) Covering water depth and installation height of penstock inlet
As the penstock diameter is generally small (usually 1.0 m or less) in the case of a
small-scale hydropower plant, it should be sufficient to secure a covering water depth
which is equal to or larger than the inner diameter of the penstock. However, in the case
of a channel where both the inner diameter and inclination of the penstock are as large
as illustrated below, the occurrence of inflow turbulence has been reported in the past.
Accordingly, the covering water depth must be decided with reference to the illustration
below when the inner diameter of the penstock exceeds 1.0 m.
Vertical angle
Swirly when Qmax

Manual for Micro Hydro Power Development Chapter 5
- 5-27 -
h = d2
Where,
h : water depth from the centre of the inlet to the lowest water level of the
headtank = covering water depth (m)
d : inner diameter of the penstock (m)
Covering Water Depth
The covering water depth at the penstock inlet must be above the following value
to prevent the occurrence of inflow turbulence.
d 1.0 m h 1.0 d
d > 1.0 m h d2
Where,
h : water depth from the centre of the inlet to the lowest water level of the
headtank = covering water depth (m)
d : inner diameter of the penstock (m)
Installation height of penstock
There are many reports of cases where inappropriate operation has caused the
inflow of sediment into the penstock, damage the turbine and other equipment.
Accordingly, it is desirable for the inlet bottom of the penstock to be placed
slightly higher than the apron of the headtank (some 30 – 50 cm).
NWL
LWL
h
30~50cm d
1~2d

Manual for Micro Hydro Power Development Chapter 5
- 5-28 -
(2) Appropriate spacing of screen bars for turbine type, etc.
The spacing of the screen bars (effective screen mesh size) is roughly determined by the
gate valve diameter but must be finalised in consideration of the type and dimensions of
the turbine and the quantity as well as quality of the litter. The reference value of an
effective screen mesh size is shown below.
Effective screen mesh size (reference)
(3) Installation of vent pipe to complement headtank gate
When a headtank gate is installed instead of a gate valve for a power station, it is
necessary to install a vent pipe behind the headtank gate to prevent the rupture of the
penstock line.
In this case, the following empirical formula is proposed to determine the dimensions of
the vent pipe.
Where,
d : inner diameter of the vent pipe (m)
P : rated output of the turbine (kW)
L : total length of the vent pipe (m)
H : head (m)
200 400 600 800 1000
20
50
Gate Valve Diameter (mm)
Effective Screen Mesh Size (mm)
d = 0.0068 ( ) 0.273 P2・L
H2

Manual for Micro Hydro Power Development Chapter 5
- 5-29 -
Source: Sarkaria, G.S., “Quick Design of Air Vents for Power Intakes”, Proc. A.S.C.E.,
Vol. 85, No. PO.6, Dec., 1959
(4) Spillway at the headtank
Generally, the spillway will be installed at the headtank in order to release eexcess
water is discharged to the river safely when the turbine stopped it.
The sizes of spillway are decided by following equation.
Qd=C×Bspw×hspw1.5 → hspw={Qd/(C×Bspw)}1/1.5
Qd : design discharge (m3/s)
C : cofficient, usually C=1.8
Bspw : width of spillway (m , refer to Fig 5.1.1)
hspw : depth at the spillway (m)

Manual for Micro Hydro Power Development Chapter 5
- 5-30 -
5.7 Penstock
5.7.1 Penstock Material
At present, the main pipe materials for a penstock are steel, ductile iron and FRPM
(fibre reinforced plastic multi-unit). In the case of a small-scale hydropower plant, the
use of hard vinyl chloride, Howell or spiral welded pipes can be considered because of
the small diameter and relatively low internal pressure. The characteristics of each pipe
material are shown in “Table 5.7.1 – Penstock pipe materials for small-scale
hydropower plant”.
5.7.2 Calculation of Steel Pipe Thickness
The minimum thickness of steel pipe of penstock is determined by following formula.
where, t0: minimum thickness of pipe
P: design water pressure i.e. hydrostatic pressure + water hammer
(kgf/cm2) , in micro-hydro scheme P=1.1×hydrostatic pressure.
for instance, if the head (Hp, refer to following figure) which from
headtank to turbine is 25m, P=2.5×1.1=2.75 kgf/cm2.
d: inside diameter (cm)
θa: admissible stress (kgf/cm2) SS400: 1300kgf/cm2
η: welding efficiency (0.85~0.9)
δt : margin (0.15cm in general)
5.7.3 Determining Diameter of Penstock
Generally the diameter of penstock is determined by comparison between the cost of
penstock and head loss at penstock. However a simple method for determining the
diameter of penstock indicated in [Reference 5-2 Simple Method for Determining the
Diameter of Penstock] .
The diameter of penstock will be determined from “Average angle of Penstock (Ap: see
following figure) “ and “Design Discharge (Qd)”.
t0 = + δt (cm) P×d
2×θa×η and t0=≧0.4cm or t0≧(d+80)/40 cm

Manual for Micro Hydro Power Development Chapter 5
- 5-31 -
For instances like in the design discharge (Qd)=0.50m3/s,length of penstock (Lp)=60m,
height from head tank to power house (Hp)=15m, average angle (Ap)=15/60=0.25, the
optimum velocity (Vopt) is determined as about 2.32 in Reference 5-2. Therefore the
diameter of penstock pipe (d) is
d = ( × Qd/Vopt)0.5 =(1.273 × 0.5/2.32)0.5 = 0.52 m
Lp
Head Tank
Power House
Hp
Ap = Hp / Lp
4
3.142
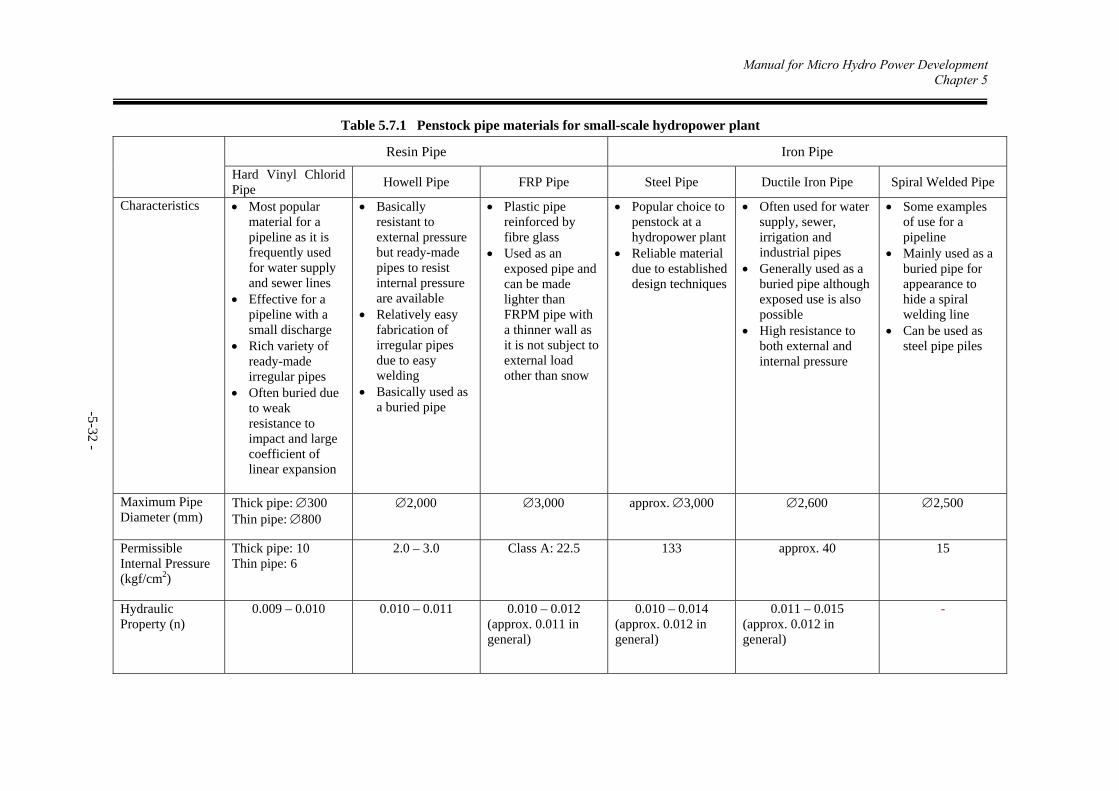
Manual for Micro Hydro Power Development Chapter 5
Table 5.7.1 Penstock pipe materials for small-scale hydropower plant
Resin Pipe Iron Pipe
Hard Vinyl Chlorid Pipe
Howell Pipe FRP Pipe Steel Pipe Ductile Iron Pipe Spiral Welded Pipe
Characteristics Most popular material for a pipeline as it is frequently used for water supply and sewer lines
Effective for a pipeline with a small discharge
Rich variety of ready-made irregular pipes
Often buried due to weak resistance to impact and large coefficient of linear expansion
Basically resistant to external pressure but ready-made pipes to resist internal pressure are available
Relatively easy fabrication of irregular pipes due to easy welding
Basically used as a buried pipe
Plastic pipe reinforced by fibre glass
Used as an exposed pipe and can be made lighter than FRPM pipe with a thinner wall as it is not subject to external load other than snow
Popular choice to penstock at a hydropower plant
Reliable material due to established design techniques
Often used for water supply, sewer, irrigation and industrial pipes
Generally used as a buried pipe although exposed use is also possible
High resistance to both external and internal pressure
Some examples of use for a pipeline
Mainly used as a buried pipe for appearance to hide a spiral welding line
Can be used as steel pipe piles
Maximum Pipe Diameter (mm)
Thick pipe: 300 Thin pipe: 800
2,000 3,000 approx. 3,000 2,600 2,500
Permissible Internal Pressure (kgf/cm2)
Thick pipe: 10 Thin pipe: 6
2.0 – 3.0 Class A: 22.5 133 approx. 40 15
Hydraulic Property (n)
0.009 – 0.010 0.010 – 0.011 0.010 – 0.012 (approx. 0.011 in general)
0.010 – 0.014 (approx. 0.012 in general)
0.011 – 0.015 (approx. 0.012 in general)
-
-5-32 -

Manual for Micro Hydro Power Development Chapter 5
Resin Pipe Iron Pipe
Hard Vinyl Chlorid Pipe
Howell Pipe FRP Pipe Steel Pipe Ductile Iron Pipe Spiral Welded Pipe
Workability Easy design and work due to light weight and rich variety of irregular pipes
Good workability due to light weight
Good workability due to light weight and no need for on-site welding as a specially formed rubber ring is used for pipe connection
Steel pipes are used for irregular sections because of the limited availability of irregular FRP pipes
Inferior workability to FRP pipes
Inferior workability to FRP pipes
Inferior workability to FRP pipes
Water-tightness Good water-tightness as bonding connection is possible
No problem of water-tightness at the joints
No problem of water-tightness as the joint connection method is established
No problem of water-tightness as the joint connection method is established
Good No problems
-5-33-
Manual for Micro Hydro Power Development Chapter 5
-5-34-
5.8 Foundation of Powerhouse
Powerhouse can be classified into ‘the above ground type’, the semi-underground
type’ and ‘the under ground type’. Most of small-scale hydropower plants are of ‘the
above ground type’
The dimensions for the floor of powerhouse as well as the layout of main and
auxiliary equipment should be determined by taking into account convenience during
operation, maintenance and installation work, and the floor area should be effectively
utilized.
Various types of foundation for powerhouse can be considered depending on the type
of turbine. However the types of foundation for powerhouse can be classified into ‘for
Impulse turbine’ (such as Pelton turbine, Turgo turbine and Crossflow turbine) and
‘for Reaction turbine’ (Francis turbine, Propeller turbine).
5.8.1 Foundation for Impulse Turbine
Figure 5.8.1 shows the foundation for Crossflow turbine which frequently is used in
the micro-hydro scheme as an impulse turbine. In case of impulse turbine, the water
which passed by the runner is directly discharged into air at tailrace. The water
surface under the turbine will be turbulent. Therefore the clearance between the slab
of powerhouse and water surface at the afterbay should be kept at least 30-50cm. The
water depth (hc) at the afterbay can be calculated by following equation.
hc: water depth at afterbay (m)
Qd: design discharge (m3/s)
b : width of tailrace channel (m)
The water level at the afterbay should be higher than estimated flood water level.
Then in case of impulse turbine, the head between the center of turbine and water
level at the outlet became head-loss(HL3:refer to Ref.5-3).
hc= { (( )1/3 }1/3 1.1×Qd2
9.8×b2

Manual for Micro Hydro Power Development Chapter 5
-5-35-
Fig.5.8.1 Foundation of Powerhouse for Impulse Turbine (Crossflow turbine)
5.8.2 Foundation for Reaction Turbine
Figure 5.8.2(a) shows the foundation for Francis turbine which is a typical turbine of
the reaction turbine. The water is discharged into the afterbay through the turbine.
In case of reaction turbine, the head between center of turbine and water-level can be
use for power generation. Then it is possible that turbine is installed under flood
water level on condition to furnish the following equipment.(see Fig.5.7.2(b))
a. Tailrace Gate
b. Pump at powerhouse
Flood Water Level(Maximum)
20cm
boSection A-A
20cm
b
bo: depends on Qd and He
30~50cm
hc
30~50cm
HL3
(see Ref.5-3)
hc={ }1/31.1×Qd2
9.8×b2
A
A
Afterbay Tailrace cannel Outlet

Manual for Micro Hydro Power Development Chapter 5
-5-36-
Fig 5.8.2(a) Foundation of powerhouse for Reaction Turbine (Francis turbine)
Fig 5.8.2(b) Example of Installation to Lower Portion
Section A-A
1.5×d3
Flood Water Level(Maximum)30~50cmhc
2×d3
d3
20cm
1.15×d3
1.5×d3
Hs
Hs:depens on characteristic of turbine
HL3
(see Ref.5-3)
hc={ }1/31.1×Qd2
9.8×b2
A
A
Pump
Gate
HL3
Flood Water Level (Maxmum)

Manual for Micro-Hydro Power Development Chapter 5 (Reference)
-5- 37-
[Ref. 5-1 Simple Method for Determining the Cross Section]
0.00
0.05
0.10
0.15
0.20
0.25
0.30
0.35
0.40
0.45
0.50
0.55
0.60
0 0.1 0.2 0.3 0.4 0.5 0.6 0.7 0.8 0.9 1
Turbine Discharge Q (m3/s)
Wat
er D
epth
Dam
my
H*
(m)
n=0.015
n=0.020
n=0.025
n=0.030
H
0.2~0.3m
0.6m
H=H*×0.1/(SLmin)0.5
Fig.1 Determining the Cross Section of Headrace
Rectangular Form (B=0.6m)

Manual for Micro-Hydro Power Development Chapter 5 (Reference)
-5- 38-
0.00
0.05
0.10
0.15
0.20
0.25
0.30
0.35
0.40
0.45
0.50
0.55
0.60
0.65
0.70
0.75
0.80
0 0.1 0.2 0.3 0.4 0.5 0.6 0.7 0.8 0.9 1
Turbine Discharge Q (m3/s)
Wat
er D
epth
Dam
my
H*
(m)
n=0.015
n=0.020
n=0.025
n=0.030
H
0.2~0.3m
0.8m
H=H*×0.1/(SLmin)0.5
Fig.2 Determining the Cross Section of Headrace
Rectangular Form (B=0.8m)
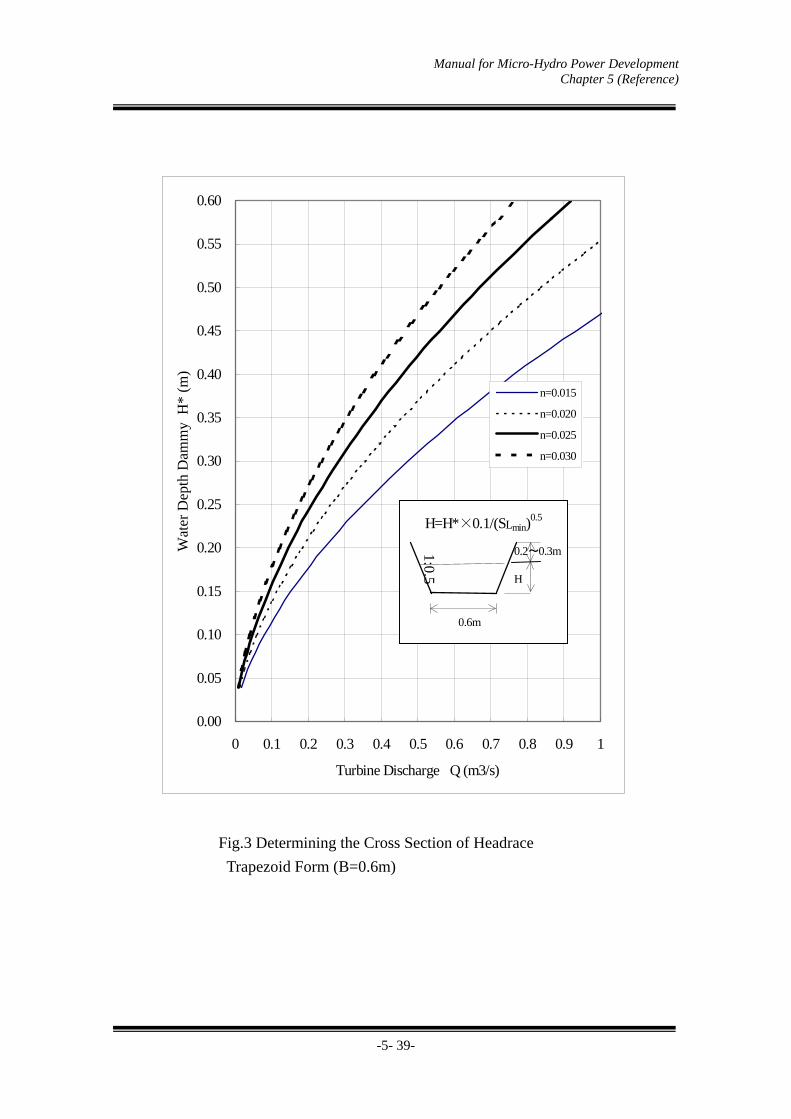
Manual for Micro-Hydro Power Development Chapter 5 (Reference)
-5- 39-
Fig.3 Determining the Cross Section of Headrace
Trapezoid Form (B=0.6m)
0.00
0.05
0.10
0.15
0.20
0.25
0.30
0.35
0.40
0.45
0.50
0.55
0.60
0 0.1 0.2 0.3 0.4 0.5 0.6 0.7 0.8 0.9 1
Turbine Discharge Q (m3/s)
Wat
er D
epth
Dam
my
H*
(m)
n=0.015
n=0.020
n=0.025
n=0.030
H
0.2~0.3m
0.6m
H=H*×0.1/(SLmin)0.5
1:0.5
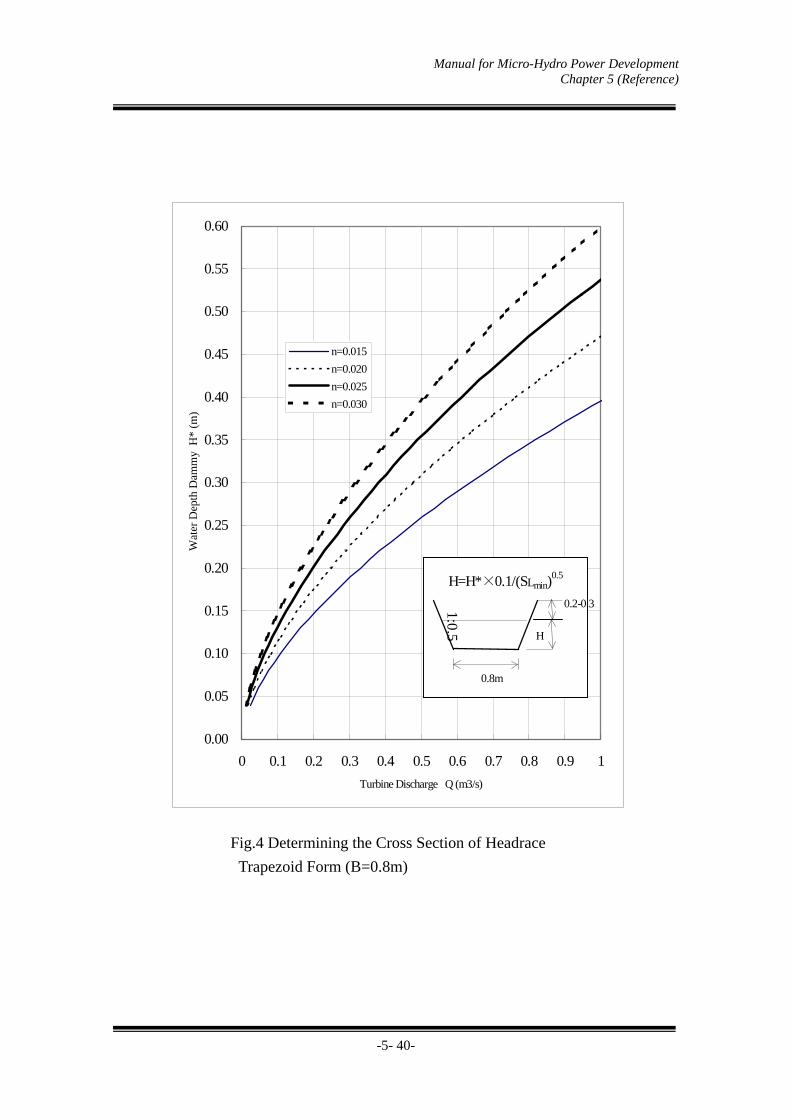
Manual for Micro-Hydro Power Development Chapter 5 (Reference)
-5- 40-
Fig.4 Determining the Cross Section of Headrace
Trapezoid Form (B=0.8m)
0.00
0.05
0.10
0.15
0.20
0.25
0.30
0.35
0.40
0.45
0.50
0.55
0.60
0 0.1 0.2 0.3 0.4 0.5 0.6 0.7 0.8 0.9 1
Turbine Discharge Q (m3/s)
Wat
er D
epth
Dam
my
H*
(m)
n=0.015
n=0.020
n=0.025
n=0.030
0.2~0.3m
H
0.8m
H=H*×0.1/(SLmin)0.5
1:0.5
0.2-0.3

Manual for Micro-Hydro Power Development Chapter 5 (Reference)
-5- 41-
[Ref.5-2 Simple Method for Determining the Diameter of Penstock]
0.500.600.700.800.901.001.101.201.301.401.501.601.701.801.902.002.102.202.302.402.502.602.702.802.903.003.103.20
0.00 0.05 0.10 0.15 0.20 0.25 0.30 0.35 0.40
Average angle of penstock Ap
Opt
imum
vel
ocit
y V
opt (
m/s
)
D=1.273×(Q/Vopt)0.5
D: diameter of pipe(m)
Q: design discharge(m3/s)Vopt: optimum velocity(m/s)
Graph to Determine the Diameter of Penstock Pipe
(1.273 x Q x Vopt) 0.5

Manual for Micro-Hydro Power Development Chapter 5 (Reference)
-5-42-
[Ref. 5-3 Calculation on Head Loss]
Head losses are indicated by the figure of hydropower system below. HL1 can be
calculated easily as the differential water level between the intake to the forebay
tank. Similarly HL3 can be calculated as differential level between the center of
turbine to the tailrace.
He = Hg – (HL1 + HL2 + HL3 )
Where: He - Effective Head
Hg - Gross Head
HL1 - Loss from intake to forebay
HL2 - Loss at penstock
HL3 - Installation head and Loss at tailrace
Then HL2 can be calculated by the following equations.
(1) Friction loss
Friction loss (Hf) is one of the biggest losses at penstock.
Hf = f ×Lp×Vp2 /(2×g×Dp)
Where:
Hf - Friction loss at penstock (m)
f - Coefficient on the diameter of penstock pipe (Dp).
f= 124.5×n2/Dp1/3
Lp - Length of penstock. (m)
Hg He
HL1 HL2
HL3
Forebay
Penstock
Settling Basin
Headrace Intake
Powerhouse Tailrace
H
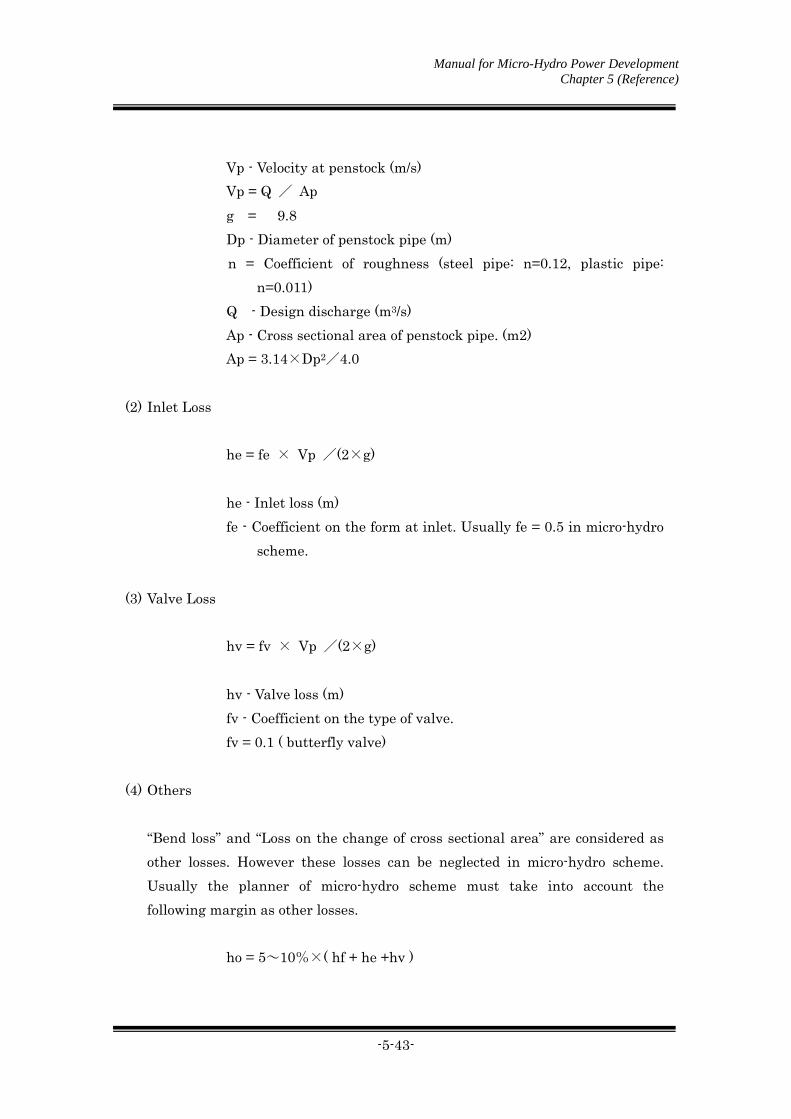
Manual for Micro-Hydro Power Development Chapter 5 (Reference)
-5-43-
Vp - Velocity at penstock (m/s)
Vp = Q / Ap
g = 9.8
Dp - Diameter of penstock pipe (m)
n = Coefficient of roughness (steel pipe: n=0.12, plastic pipe:
n=0.011)
Q - Design discharge (m3/s)
Ap - Cross sectional area of penstock pipe. (m2)
Ap = 3.14×Dp2/4.0
(2) Inlet Loss
he = fe × Vp /(2×g)
he - Inlet loss (m)
fe - Coefficient on the form at inlet. Usually fe = 0.5 in micro-hydro
scheme.
(3) Valve Loss
hv = fv × Vp /(2×g)
hv - Valve loss (m)
fv - Coefficient on the type of valve.
fv = 0.1 ( butterfly valve)
(4) Others
“Bend loss” and “Loss on the change of cross sectional area” are considered as
other losses. However these losses can be neglected in micro-hydro scheme.
Usually the planner of micro-hydro scheme must take into account the
following margin as other losses.
ho = 5~10%×( hf + he +hv )

Manual for Micro-Hydro Power Development Chapter 6
- 6-1 -
Chapter 6 DESIGN FOR MECHANICAL AND ELECTRICAL STRUCTURES
6.1 Fundamental Structure of Equipment for Power Plant
The fundamental equipment and facilities briefly discussed in the preceding chapters are
tackled in more detailed manner in this chapter. In addition, the summary of
micro-hydropower generating equipment for rural electrification is also presented herein
for quick reference.
Summary of Micro Hydropower Turbines for Rural Electrification in the
Philippines
1. Fundamental Conditions
The following conditions are necessary for rural electrification in the Philippines:
1) Stable operation for long term
2) Easy operation by semi-skilled operator(s) or villager(s)
3) Locally made turbines for easier maintenance and repair (except small parts)
4) Cheaper cost of equipment including installation
5) Acceptable technical guarantees of the turbine.
Table 6.1.1 Recommended Micro Hydropower Generating Equipment
Discription Synchronous Generator with Cross flow type Turbine
Asynchronous Generator with Reverse Pump type Turbine(PAT)
Advantages/Disadvantages Advantage *Very reliable power source with
stable frequency & voltage for independent network. *Machine suitable to any actual site condition can be designed and manufactured.
*Lower cost if a pump with motor suitable for site design condition is found. *Construction of machine is simple.
Disadvantages *A little higher cost than PAT
*Difficulty to select a suitable pump with motor at market *No control of voltage * Short life time of capacitors for this system
Technical aspect Net head Hn 4 – 50 m 4 - 20 m Water flow (discharge) Q 0.1 - 0.8 m3/s (Discharge is a little
variable) 0.04 - 0.13 m3/s (discharge shall be kept always constant )
Turbine output at turbine shaft
Pt 10 – 250 kW Pt =0.98 x Hn x Q x t (t= 0.7)
2 – 7 kW Pt =0.98 x Hn x Q x p
(p= t =0.65)
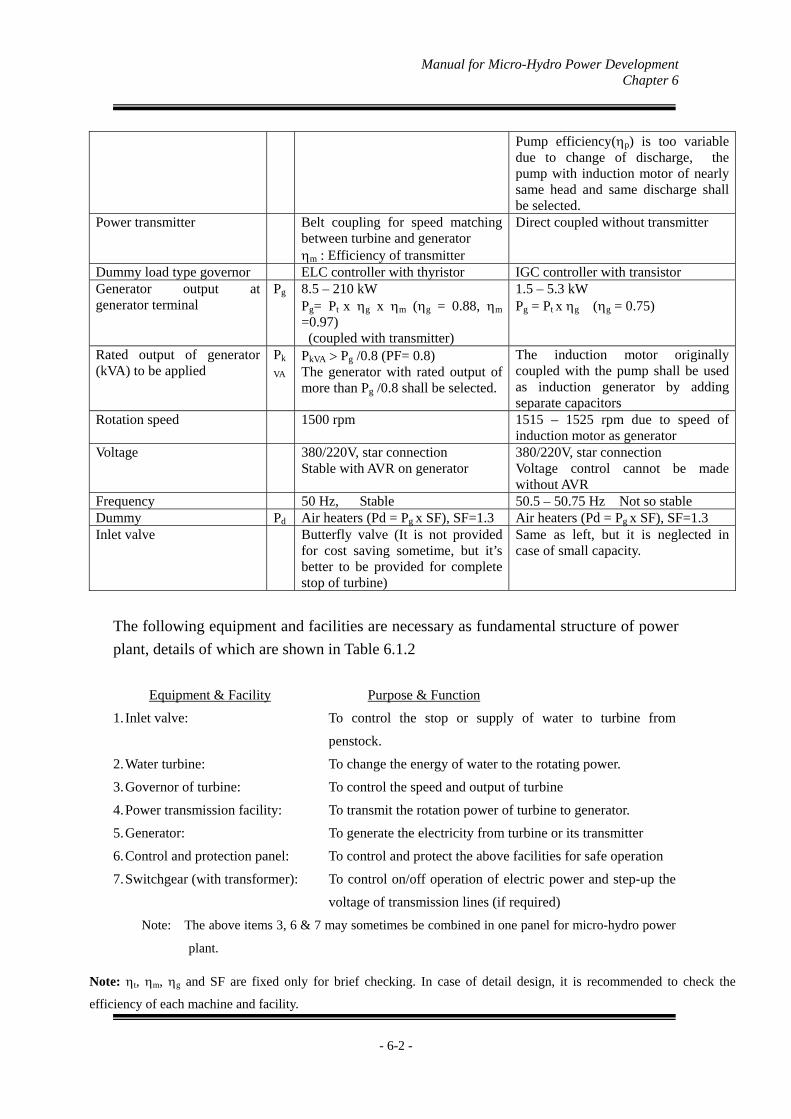
Manual for Micro-Hydro Power Development Chapter 6
- 6-2 -
Pump efficiency(p) is too variable due to change of discharge, the pump with induction motor of nearly same head and same discharge shall be selected.
Power transmitter Belt coupling for speed matching between turbine and generator m : Efficiency of transmitter
Direct coupled without transmitter
Dummy load type governor ELC controller with thyristor IGC controller with transistor Generator output at generator terminal
Pg 8.5 – 210 kW Pg= Pt x g x m (g = 0.88, m =0.97) (coupled with transmitter)
1.5 – 5.3 kW Pg = Pt x g (g = 0.75)
Rated output of generator (kVA) to be applied
Pk
VA PkVA Pg /0.8 (PF= 0.8) The generator with rated output of more than Pg /0.8 shall be selected.
The induction motor originally coupled with the pump shall be used as induction generator by adding separate capacitors
Rotation speed 1500 rpm 1515 – 1525 rpm due to speed of induction motor as generator
Voltage 380/220V, star connection Stable with AVR on generator
380/220V, star connection Voltage control cannot be made without AVR
Frequency 50 Hz, Stable 50.5 – 50.75 Hz Not so stable Dummy Pd Air heaters (Pd = Pg x SF), SF=1.3 Air heaters (Pd = Pg x SF), SF=1.3 Inlet valve Butterfly valve (It is not provided
for cost saving sometime, but it’s better to be provided for complete stop of turbine)
Same as left, but it is neglected in case of small capacity.
The following equipment and facilities are necessary as fundamental structure of power
plant, details of which are shown in Table 6.1.2
Equipment & Facility Purpose & Function
1. Inlet valve: To control the stop or supply of water to turbine from
penstock.
2. Water turbine: To change the energy of water to the rotating power.
3. Governor of turbine: To control the speed and output of turbine
4. Power transmission facility: To transmit the rotation power of turbine to generator.
5. Generator: To generate the electricity from turbine or its transmitter
6. Control and protection panel: To control and protect the above facilities for safe operation
7. Switchgear (with transformer): To control on/off operation of electric power and step-up the
voltage of transmission lines (if required)
Note: The above items 3, 6 & 7 may sometimes be combined in one panel for micro-hydro power
plant.
Note: t, m, g and SF are fixed only for brief checking. In case of detail design, it is recommended to check the
efficiency of each machine and facility.
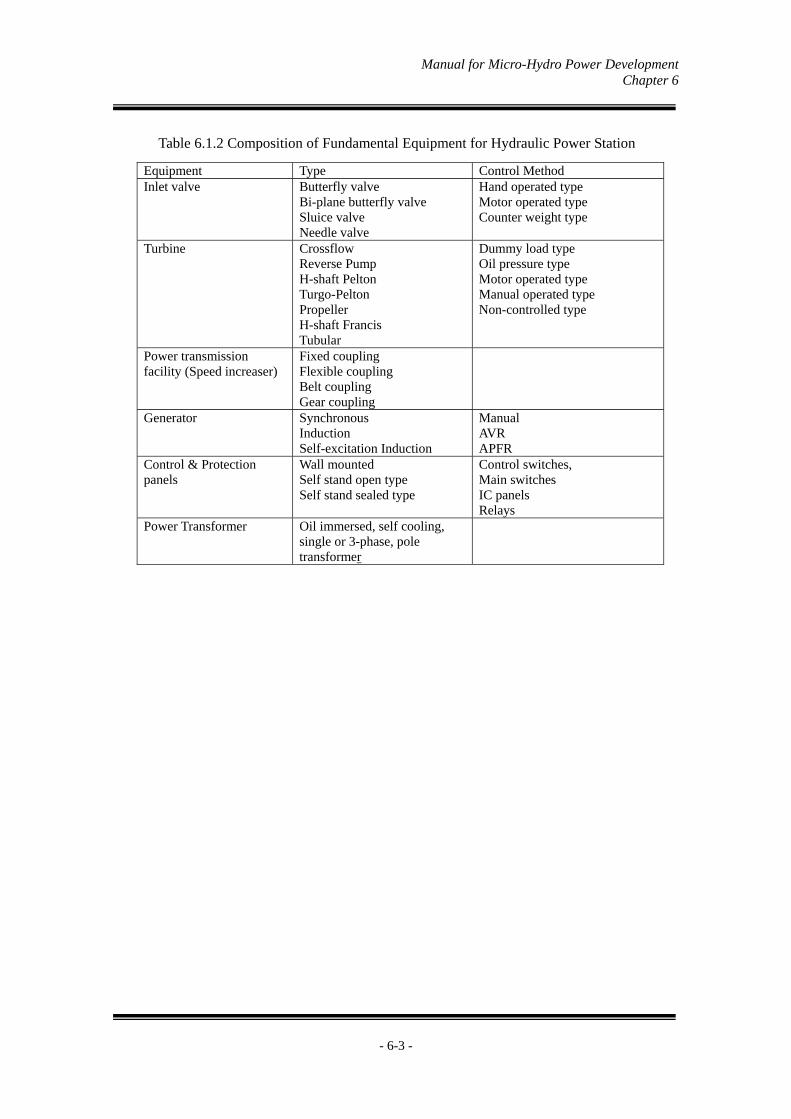
Manual for Micro-Hydro Power Development Chapter 6
- 6-3 -
Table 6.1.2 Composition of Fundamental Equipment for Hydraulic Power Station
Equipment Type Control Method Inlet valve Butterfly valve
Bi-plane butterfly valve Sluice valve Needle valve
Hand operated type Motor operated type Counter weight type
Turbine Crossflow Reverse Pump H-shaft Pelton Turgo-Pelton Propeller H-shaft Francis Tubular
Dummy load type Oil pressure type Motor operated type Manual operated type Non-controlled type
Power transmission facility (Speed increaser)
Fixed coupling Flexible coupling Belt coupling Gear coupling
Generator Synchronous Induction Self-excitation Induction
Manual AVR APFR
Control & Protection panels
Wall mounted Self stand open type Self stand sealed type
Control switches, Main switches IC panels Relays
Power Transformer Oil immersed, self cooling, single or 3-phase, pole transformer

Manual for Micro-Hydro Power Development Chapter 6
- 6-4 -
1
10
100
40 50 60 70 80 90 100 110 120 130 140
Discharge (l/s)
Net
Hea
d (m
)
7 kW6 kW
5 kW
4 kW3 kW2 kW
20
4
50
Figure 6.1.2 (b) Applicable limit of PAT at Turbine Shaft
Discharge Q [l/s]
Figure 6.1.2 (a) Applicable of Crossflow and PAT at Turbine
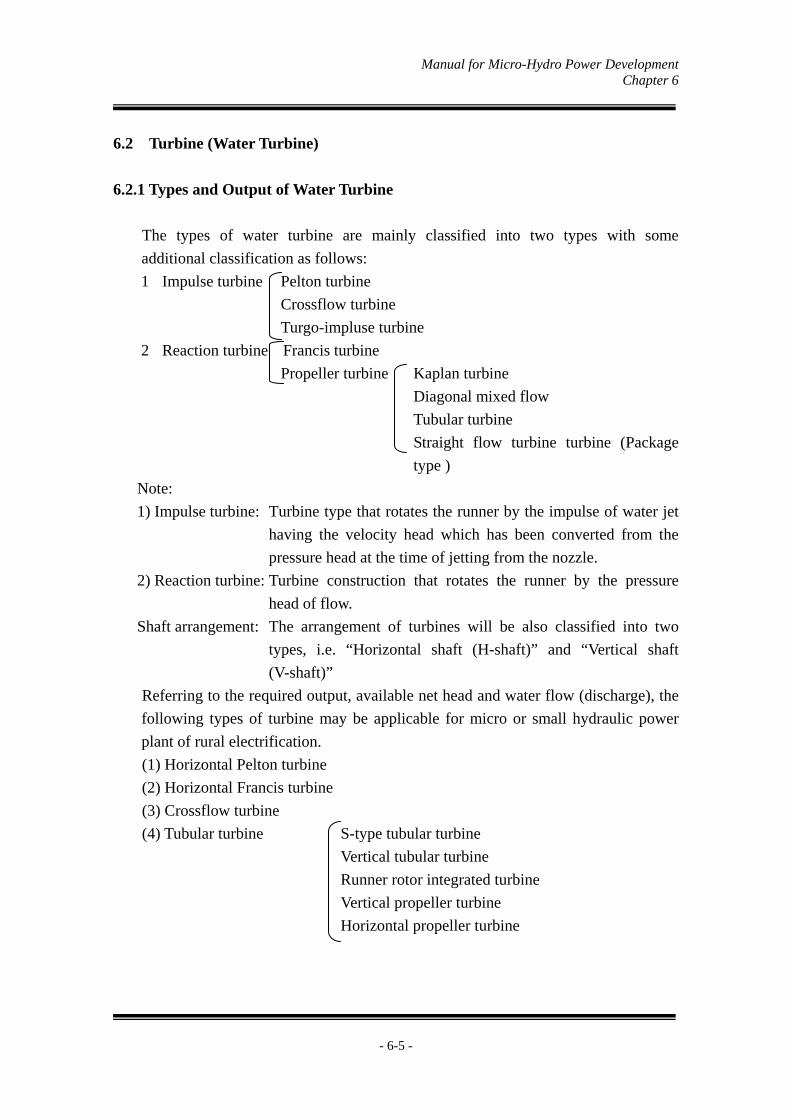
Manual for Micro-Hydro Power Development Chapter 6
- 6-5 -
6.2 Turbine (Water Turbine)
6.2.1 Types and Output of Water Turbine
The types of water turbine are mainly classified into two types with some
additional classification as follows:
1 Impulse turbine Pelton turbine
Crossflow turbine
Turgo-impluse turbine
2 Reaction turbine Francis turbine
Propeller turbine Kaplan turbine
Diagonal mixed flow
Tubular turbine
Straight flow turbine turbine (Package
type )
Note:
1) Impulse turbine: Turbine type that rotates the runner by the impulse of water jet
having the velocity head which has been converted from the
pressure head at the time of jetting from the nozzle.
2) Reaction turbine: Turbine construction that rotates the runner by the pressure
head of flow.
Shaft arrangement: The arrangement of turbines will be also classified into two
types, i.e. “Horizontal shaft (H-shaft)” and “Vertical shaft
(V-shaft)”
Referring to the required output, available net head and water flow (discharge), the
following types of turbine may be applicable for micro or small hydraulic power
plant of rural electrification.
(1) Horizontal Pelton turbine
(2) Horizontal Francis turbine
(3) Crossflow turbine
(4) Tubular turbine S-type tubular turbine
Vertical tubular turbine
Runner rotor integrated turbine
Vertical propeller turbine
Horizontal propeller turbine

Manual for Micro-Hydro Power Development Chapter 6
- 6-6 -
(5) Turgo impulse turbine
(6) Reverse pump turbine Vertical propeller type
Horizontal propeller type
Submerged pump type
The output of turbine is calculated with following formula:
Pmax = 9.8 x He x Qmax x t
Pmax : Maximum output (kW)
He : Net head (m)
Qmax : Maximum discharge (m3/s)
t : Maximum turbine efficiency (%) Please refer to chapter 6.2.2
The brief characteristics, explanation and drawing of each type are shown in Table 6.2.1.
The applicable range of each type turbine is shown in Figure 6.2.1.
Referring to the said table and figure, the customer can select the type of turbine, which
is most suitable to the actual site condition including the total cost of civil work and
equipment.
At present, however, it is recommended to apply “Crossflow turbine”, which are
designed and manufactured locally, because the proper design of “Crossflow turbine”
can be achieved by applying available model test data and the cost is comparably low.
The reverse pump may also be used as reverse pump turbine by reversing the direction
of rotation, if the characteristic of water pump, which is available in market, is matched
almost strictly to that of the turbine required from the site condition (head, water
discharge, output, efficiency, rotation speed etc.).
However, as the site condition of each power plant is not always the same and the
matching of characteristics of pump and proposed turbine is difficult, the selection of
standard pump for turbine shall be made carefully and circumspectly. In case the
characteristics are well matched between pump and turbine, the application of reverse
pump turbine is recommended and the cost of such machine will be cheaper.
In the future, other types of turbine will be selected widely because other types of
turbines may also be manufactured locally with proper design and fabrication capability.

Manual for Micro-Hydro Power Development Chapter 6
- 6-7 -
Figure 6.2.1 Applicable Type (Selection) of Turbines

Manual for Micro-Hydro Power Development Chapter 6
- 6-8 -
6.2.2 Specific Speed and Rotational Speed of Turbine
The specific speed is the ratio between the rotational speeds of two runners
geometrically similar to each other, which derived from the conditions of the laws of
similarity, and specific speed of similar runners in a group by the rotational speed
obtained when one runner has effective head H = 1m and output P = 1kW.
It may be understood that the specific speed is a numerical value expressing the
classification of runners correlated by three factors of effective head, turbine output and
rotational speed as follows:
Ns = (N x P1/2)/ H5/4 N = (Ns x H5/4 )/ P1/2
Where, Ns; Specific speed (m-kw)
N; Rotational speed of turbine (rpm)
P; Output of turbine (kW) = 9.8 x Q x H x
H; Effective head (m)
Q; Discharge (m3/s)
; Maximum efficiency (%, but a decimal is used in calculations)
= 82 % for Pelton turbine
= 84 % for Francis turbine
= 77 % for Crossflow turbine*
= 84 % for S-type tubular turbine
Note: * 40-50% should be applied for Crossflow type turbine manufactured locally at
present stage because due to fabrication quality.
The specific speed of each turbine is specified and ranged according to the construction
of each type on the basis of experiments and actual proven examples.
The limitation of specific speed of turbine (Ns-max) can be checked in following
formula.
Pelton turbine: Ns-max ≦ 85.49H-0.243
Crossflow turbine: Ns-max ≦ 650H-0.5
Francis turbine: Ns-max ≦ (20000/(H+20))+30
Horizontal Francis turbine: Ns-max ≦ 3200H-2/3
Propeller turbine: Ns-max ≦ (20000/(H+20))+50
Tubular turbine Ns-max ≦ (20000/(H+16))
The range of specific speed of turbine is also shown in Figure 6.2.2

Manual for Micro-Hydro Power Development Chapter 6
- 6-9 -
Figure 6.2.2 Range of specific speed by turbine type
Specific speed (m-kW)200 400 600 800
Pelton turbine 1 2≦ Ns ≦ 25
Francis turbine 60 ≦ Ns ≦ 300
Cross flow turbine 40 ≦ Ns ≦ 200
Propeller turbine 250 ≦ Ns ≦ 1000
10000
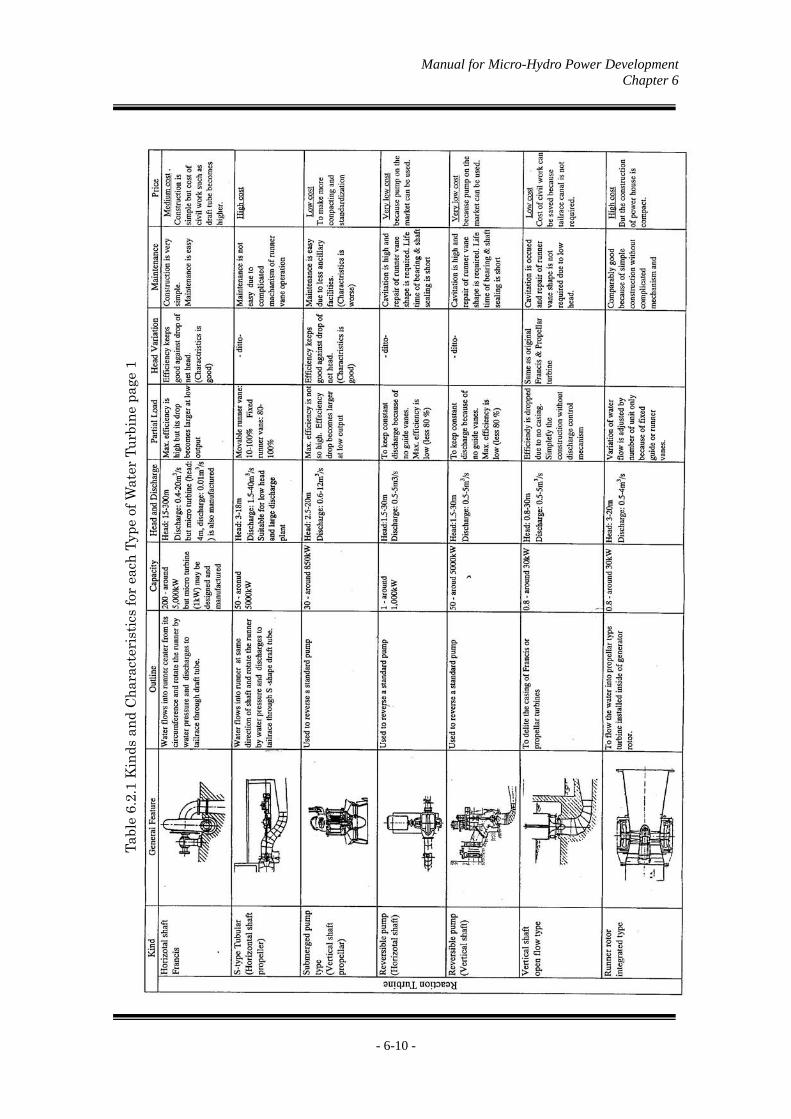
Manual for Micro-Hydro Power Development Chapter 6
- 6-10 -
Tab
le 6
.2.1
Kin
ds a
nd
Ch
arac
teri
stic
s fo
r ea
ch T
ype
of W
ater
Tu
rbin
e pa
ge 1

Manual for Micro-Hydro Power Development Chapter 6
- 6-11 -
Tab
le 6
.2.1
Kin
ds a
nd
Ch
arac
teri
stic
s fo
r ea
ch T
ype
of W
ater
Tu
rbin
e pa
ge 2

Manual for Micro-Hydro Power Development Chapter 6
- 6-12 -
6.2.3 Design of Crossflow Turbine
Brief design of Crossflow turbine T-13 and T-14, designed and manufactured in
Indonesia according to appropriate design data, is shown hereunder. The detailed design
shall be referred to the design sheet from the manufacturer. The design shall be
conducted in the following procedures:
1 Get the basic data for rated water flow (m3 /s), elevations (m) of water level at
forebay and turbine center (or tailrace water if designed as special case) from civil
design.
2 Calculate net head from gross head by deducting head loss of penstock (friction
and turbulence).
3 Estimate the net hydraulic power and turbine shaft output from water flow, net
head and turbine efficiency.
4 Calculate width of turbine runner according to manufacturer’s recommendation.
5 Calculate the mechanical power to generator from efficiency of power transmitter
(speed increaser)
6 Calculate rated electrical output of generator (kW). ----Maximum output of
electricity
7 Calculate the rotational speed of turbine from specific speed, turbine shaft output
(Item 3) and net head.
8 Select suitable generator available at market and its output (kVA), frequency,
voltage, power factor and rotational speed (frequency), referring to catalogue of
generator manufacturer.
9 Calculate the ratio of rated rotational speed of turbine and generator.
10 Select the width and length of belt referring to belt manufacturer’s
recommendation.
11 Calculate the capacity of dummy load and suitable ELC (Electronic Load
Controller) or IGC (Induction Generator Control) in case of induction generator.
12 Calculate the diameters of the pulley for the turbine and generator.
Notes:
Basic data of T-13 and 14 available from the model test.
Diameter of turbine: 300mm No. of runner blade: 28nos. Unit speed: 133 rpm
Detailed design shall be referred to the “Design Manual for Crossflow Turbine”
attached herewith.

Manual for Micro-Hydro Power Development Chapter 6
- 6-13 -
6.2.4 Design of Reverse Pump Type Turbine (Pump As Turbine)
A water pump used as turbine by reversing rotation of pump is called the Pump As
Turbine (PAT).
1 To calculate and get the effective head (net head), water flow (discharge), and
net hydraulic power as same method as item 1, 2 and 3 of above Crossflow
turbine in chapter 6.2.3.
2 To check suitable pump available in the market, considering maximum
efficiency point of pump, rotation speed of motor (generator: 2, 4 or 6 poles)
because the direct coupling between turbine and generator is usually adopted for
this kind of turbine. The rotation speed shall be referred to Table 6.3.1. In case of
induction generator, the speed of turbine shall be a little higher ( i.e. 2 - 5 %)
than that of generator at rated frequency. (1,550 rpm from 1,500 rpm)
3 To select and finalize the pump as turbine, considering the maximum efficiency
point of pump, applicable efficiency for actual output of turbine shaft because
the range of high. Efficiency point of pump is very narrow.
4 The selection method shall be referred to the “Design Manual for Reverse Pump
Turbine”.

Manual for Micro-Hydro Power Development Chapter 6
- 6-14 -
6.3 Generator
6.3.1 Type of Generator
Two kinds of generator can be adopted for generating electric power from the energy
produced by water turbines.
1. Fundamental classification of AC generator
( DC generator is not usually used for small-scale hydropower plant)
(1) Synchronous generator Independent exciter of rotor is provided for each unit
Applicable for both independent and existing power
network
(2) Induction generator No exciter of rotor is provided (squirrel cage type)
(Asynchronous) Usually applicable for network with other power source.
Sometimes applicable for independent network with
additional capacitors for less than 25 kW but not so
recommendable for independent network due to difficulty
of voltage control and life time of capacitors except cost
saving.
Shaft arrangement Either vertical shaft or horizontal shaft is applied to both
type of above generators.
(mainly horizontal high speed type in case of micro/small
plant except reverse pump turbine)
2. Another classification is also applied to AC generator as follows;
1) Three phase generator Star (λ) connection For 3 phase 4 wire network
Delta(Δ) connection For single phase 2 wire network
2) Single phase generator This type is not used in power network system because
it is difficult to purchase the generator with capacity of
more than 2kW in market. In this case three phase
generator with delta connection is applied as shown
above.
The winding connections of generator (Star and Delta ) are shown in Figure 6.3.1 as
follows:
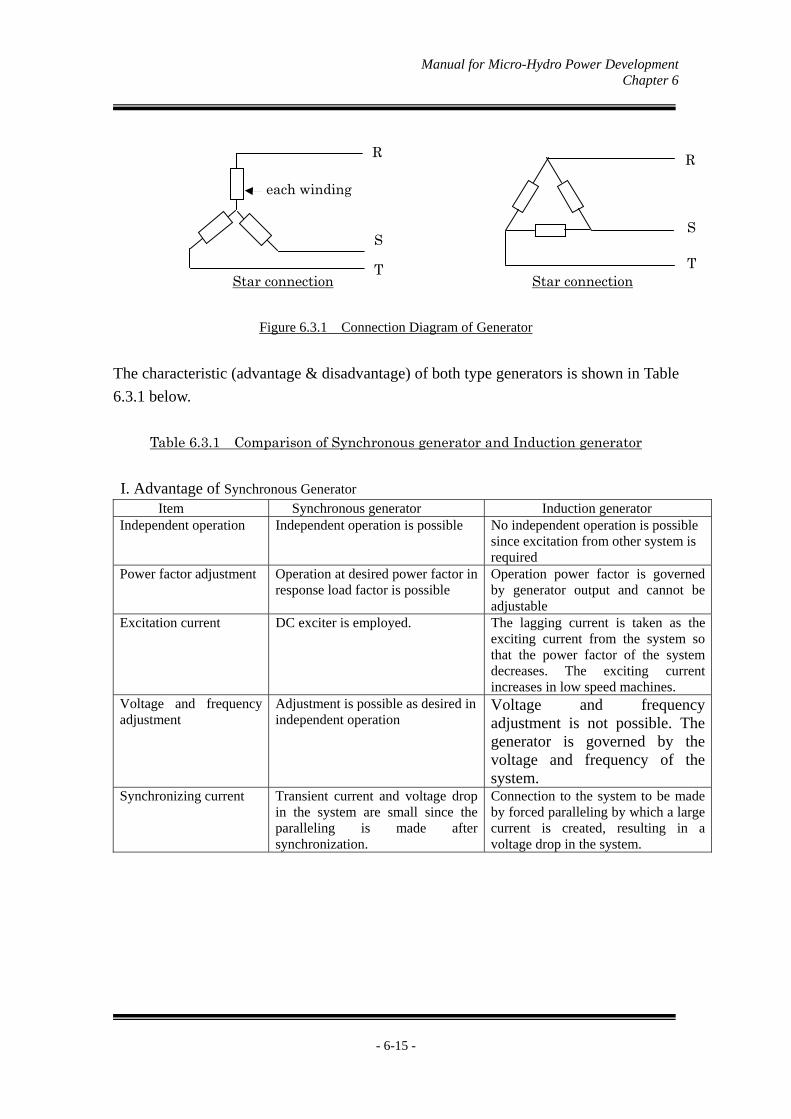
Manual for Micro-Hydro Power Development Chapter 6
- 6-15 -
each winding
Figure 6.3.1 Connection Diagram of Generator
The characteristic (advantage & disadvantage) of both type generators is shown in Table
6.3.1 below.
Table 6.3.1 Comparison of Synchronous generator and Induction generator
I. Advantage of Synchronous Generator Item Synchronous generator Induction generator
Independent operation Independent operation is possible No independent operation is possible since excitation from other system is required
Power factor adjustment Operation at desired power factor in response load factor is possible
Operation power factor is governed by generator output and cannot be adjustable
Excitation current DC exciter is employed. The lagging current is taken as the exciting current from the system so that the power factor of the system decreases. The exciting current increases in low speed machines.
Voltage and frequency adjustment
Adjustment is possible as desired in independent operation
Voltage and frequency adjustment is not possible. The generator is governed by the voltage and frequency of the system.
Synchronizing current Transient current and voltage drop in the system are small since the paralleling is made after synchronization.
Connection to the system to be made by forced paralleling by which a large current is created, resulting in a voltage drop in the system.
R
S
T
R
S
T Star connection Star connection
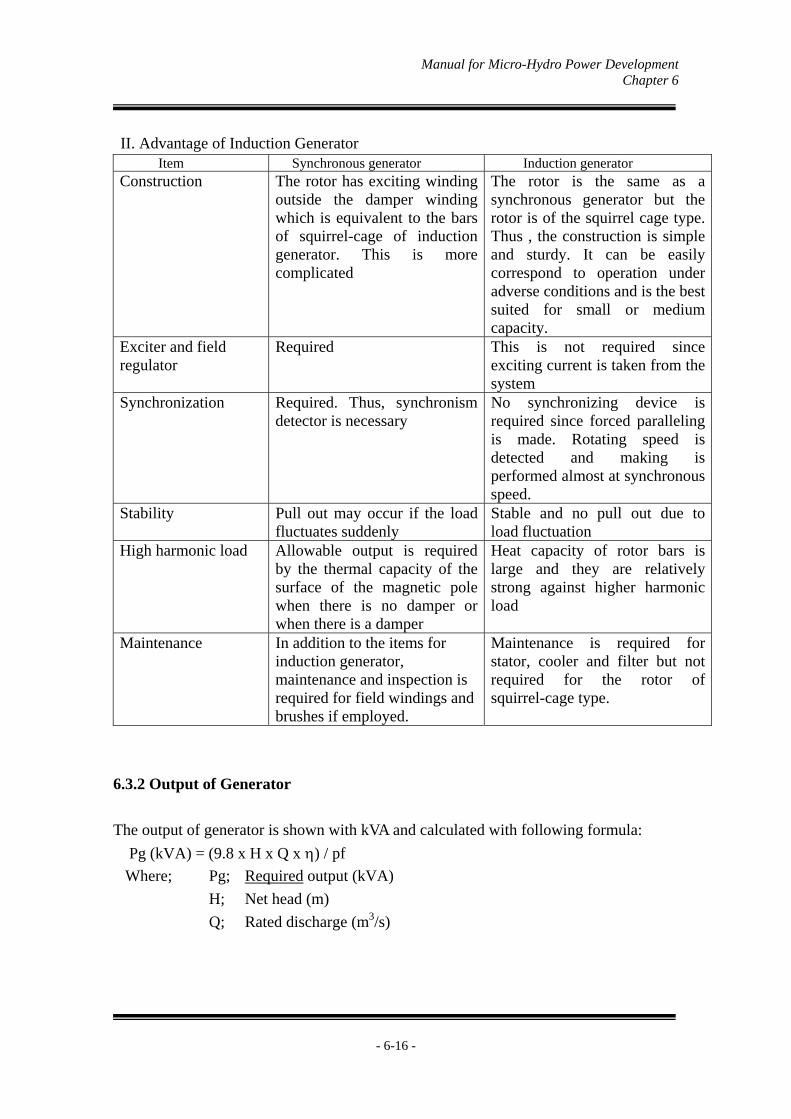
Manual for Micro-Hydro Power Development Chapter 6
- 6-16 -
II. Advantage of Induction Generator Item Synchronous generator Induction generator
Construction The rotor has exciting winding outside the damper winding which is equivalent to the bars of squirrel-cage of induction generator. This is more complicated
The rotor is the same as a synchronous generator but the rotor is of the squirrel cage type. Thus , the construction is simple and sturdy. It can be easily correspond to operation under adverse conditions and is the best suited for small or medium capacity.
Exciter and field regulator
Required This is not required since exciting current is taken from the system
Synchronization Required. Thus, synchronism detector is necessary
No synchronizing device is required since forced paralleling is made. Rotating speed is detected and making is performed almost at synchronous speed.
Stability Pull out may occur if the load fluctuates suddenly
Stable and no pull out due to load fluctuation
High harmonic load Allowable output is required by the thermal capacity of the surface of the magnetic pole when there is no damper or when there is a damper
Heat capacity of rotor bars is large and they are relatively strong against higher harmonic load
Maintenance In addition to the items for induction generator, maintenance and inspection is required for field windings and brushes if employed.
Maintenance is required for stator, cooler and filter but not required for the rotor of squirrel-cage type.
6.3.2 Output of Generator
The output of generator is shown with kVA and calculated with following formula:
Pg (kVA) = (9.8 x H x Q x ) / pf
Where; Pg; Required output (kVA)
H; Net head (m)
Q; Rated discharge (m3/s)

Manual for Micro-Hydro Power Development Chapter 6
- 6-17 -
; Combined efficiency of turbine, transmitter & generator (%)
= turbine efficiency (t) x transmitter efficiency (m) x generator
efficiency (g)
pf; Power factor ( % or decimal), the value is based on the type of
load in the system. If inductive load, such as electric motor, low
power factor lamps, is high in the system, the power factor is low
i.e. the generator capacity should be larger according to above
formula. However, 80% is usually applied for convenient purpose
of selection.
In case of micro hydro power plant, the rated output of generator is selected from the
standard output (kVA) with allowance from the manufacturer’s catalogue in the market.
6.3.3 Speed and Number of Poles of Generator
The rated rotational speed is specified according to the frequency (50 or 60 Hz) of
power network and the number of poles as shown in following formula
For synchronous generator
P (nos.) = 120 x f / N0 N0 (rpm) = 120 x f / P
Where, P: Number of poles (nos.)
N0: Rated rotational speed (rpm)
f : Frequency of network (Hz),
For induction generator
The speed is a little higher than that of synchronous generator for excitation with slip.
N (rpm) = (1-S) x N0
Where, N: Actual speed of induction generator
S: Slip (normally S= -0.02)
N0: Rated rotation speed
As the rotational speed is fixed with number of pole, the speed and pole number of
generator are shown in Table 6.3.1 hereunder.
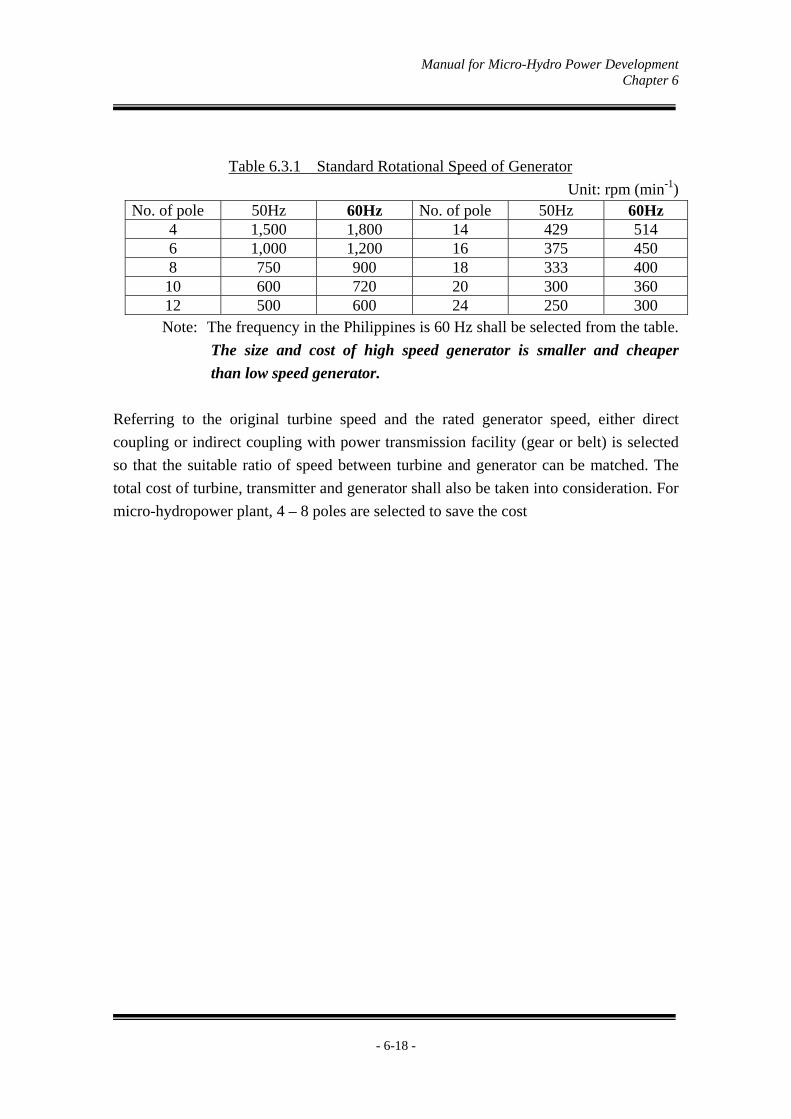
Manual for Micro-Hydro Power Development Chapter 6
- 6-18 -
Table 6.3.1 Standard Rotational Speed of Generator
Unit: rpm (min-1) No. of pole 50Hz 60Hz No. of pole 50Hz 60Hz
4 1,500 1,800 14 429 514 6 1,000 1,200 16 375 450 8 750 900 18 333 400 10 600 720 20 300 360 12 500 600 24 250 300 Note: The frequency in the Philippines is 60 Hz shall be selected from the table.
The size and cost of high speed generator is smaller and cheaper
than low speed generator.
Referring to the original turbine speed and the rated generator speed, either direct
coupling or indirect coupling with power transmission facility (gear or belt) is selected
so that the suitable ratio of speed between turbine and generator can be matched. The
total cost of turbine, transmitter and generator shall also be taken into consideration. For
micro-hydropower plant, 4 – 8 poles are selected to save the cost

Manual for Micro-Hydro Power Development Chapter 6
- 6-19 -
6.4 Power Transmission Facility (Speed Increaser)
There are two ways of coupling the turbine and generator. One is a direct coupling with
turbine shaft and generator shaft. The other is an indirect coupling by using power
transmission facility (speed increaser) between turbine shaft and generator shaft.
Rated turbine speed is fixed by the selected type of turbine and the original design
condition of net head and water flow (discharge) cannot be changed. On the other hand,
generator speed is to be selected from frequency as shown in the above table. Therefore,
if the speeds of both turbine and generator are completely the same, turbine and
generator can be coupled directly. However, such design of direct coupling is not always
applicable due to high cost of turbine and generator, especially in case of micro or small
hydropower plant. The power transmission facility (speed increaser) is usually adopted
in order to match the speed of turbine and generator and save on cost.
Two kinds of speed increaser adopted for coupling turbine and generator are as follows:
1. Gear box type: Turbine shaft and generator shaft is coupled with parallel shaft helical
gears in one box with anti-friction bearing according to the ratio of
speed between turbine and generator. The lifetime is long but the cost
is relatively high. (Efficiency: 97 – 95% subject to the type)
2. Belt type: Turbine shaft and generator shaft is coupled with pulleys (flywheels)
and belt according to the ratio of speed between turbine and generator.
The cost is relatively low but lifetime is short. (Efficiency: 98 – 95%
subject to the type of belt)
In case of micro hydro-power plant, V-belt or flat belt type coupling is adopted usually
to save the cost because gear type transmitter is very expensive.

Manual for Micro-Hydro Power Development Chapter 6
- 6-20 -
6.5 Control Facility of Turbine and Generator
6.5.1 Speed Governor
The speed governor is adopted to keep the turbine speed constant because the speed
fluctuates if there are changes in load, water head and flow. The change of generator
rotational speed results in the fluctuation of frequency. The governor consists of speed
detector, controller and operation. There are two kinds of governor to control water flow
(discharge) through turbine by operation of guide vane or to control the balance of load
by interchanging of actual and dummy load as follows:
1. Mechanical type: To control water discharge always with automatic operation of guide
vane(s) according to actual load. There are following two types.
Pressure oil operating type of guide vane(s)
Motor operating type of guide vane(s)
2. Dummy load type: To control the balancing of both current of actual load and dummy
load by thyristor i.e. to keep the summation of both actual and
dummy load constant always for the same output and speed of
generator.
The speed detection is made by PG (Pulse Generator), PMG (Permanent Magnet
Generator) or generator frequency.
In case of the mechanical type, ancillary equipment such as servomotor of guide vane,
pressure pump, pressure tank, sump tank, piping etc. or electric motor operating guide
vane with control system, are required. This means the cost of the hydropower plant will
be higher with such ancillary equipment.
In case of motor operating type, power source, motor and operating mechanism are also
required. For a micro-hydropower plant, the dummy load type governor is cheaper and
recommended.
Dummy load type governor can be controlled by IGC (Induction Generator Controler)
or ELC (Electronic Load Controller), which was developed and fabricated in Indonesia
and supplied to more than 30 micro-hydropower plants. Two types of dummy load are
adopted with heater, the air cooled and water cooled. In Indonesia, air cooled method
are usually applied instead of water cooled type due to durability and simple

Manual for Micro-Hydro Power Development Chapter 6
- 6-21 -
construction of heater.
The capacity of dummy load is calculated as follows:
Pd (kW) = Pg (kVA) x pf (decimal) x SF
Where Pd: Capacity of dummy load (Unity load: kW)
Pg: Rated output of generator (KVA)
pf: Rated power factor of generator (%, a decimal is used for
calculation)
SF: Safety factor according to cooling method (1.2 – 1.4 times of
generator output in kW) in order to avoid over-heat of the heater
according to climate
Note: Maximum output of turbine (kW) may be applied instead of “Pg
(kVA) x pf (decimal)” because maximum generator output is limited
by turbine output even if the generator with larger capacity is
adopted.
6.5.2 Exciter of Generator
In case of synchronous generator, an exciter is necessary for supplying field current to
generator and keeping the output voltage constant even if the load fluctuates.
Various kinds of exciter are available, but at present the following types of exciter are
usually adopted:
1. Brush type: Direct thyrister excitation method. DC current for field coil is
supplied through slip ring from thyrister with excitation
transformer.
2. Brush-less type: Basic circuit consists of an AC exciter directly coupled to main
generator, a rotary rectifier and separately provided thyrister
type automatic voltage regulator (AVR).
The typical wiring diagrams for both brush type and brush-less type are shown in Figure
6.5.1 and 6.5.2.

Manual for Micro-Hydro Power Development Chapter 6
- 6-22 -
Figure 6.5.1 Wiring diagram of brush type exciter
Figure 6.5.2 Wiring diagram of brush-less type exciter
For micro hydro-power plant the brush-less type is recommended due to easy
maintenance.
G
PT
CT
Ex. Tr
AVRPulse
Generator
Slip ring
(Speed Detector)
G
PT
CT
Ex. Tr
AVR
DC100V
Pulse
Generator
Rotating section
ACEx
(Speed Detector)
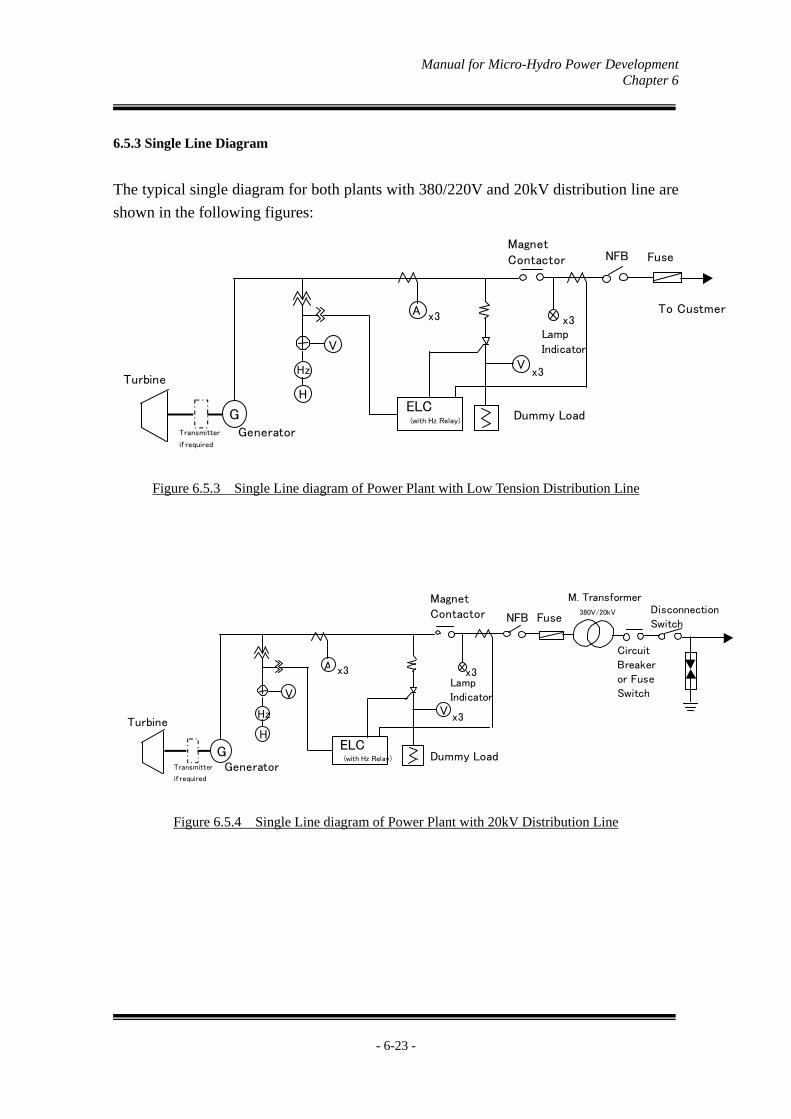
Manual for Micro-Hydro Power Development Chapter 6
- 6-23 -
6.5.3 Single Line Diagram
The typical single diagram for both plants with 380/220V and 20kV distribution line are
shown in the following figures:
Figure 6.5.3 Single Line diagram of Power Plant with Low Tension Distribution Line
Figure 6.5.4 Single Line diagram of Power Plant with 20kV Distribution Line
V
Hz
H
A x3
ELC (with Hz Relay)
G
Turbine
Transmitter
if required
Dummy Load
MagnetContactor
x3
NFB
Generator
Vx3
Fuse
To Custmer
Lamp
Indicator
V
Hz
H
A x3
ELC (with Hz Relay)
G
Turbine
Transmitter
if required
Dummy Load
MagnetContactor
x3
NFB
Generator
Vx3
Fuse
Lamp
Indicator
M. Transformer
380V/20kV
Circuit
Breaker
or Fuse
Switch
Disconnection
Switch

Manual for Micro-Hydro Power Development Chapter 6
- 6-24 -
6.6 Control, Instrumentation and Protection of Plant
The general evaluation of the potential sites selected through the above-described study
is then examined considering the methods described below to assess their suitability for
hydropower development.
6.6.1 Control Methods of Plant
There are many control methods for hydropower plant, such as supervisory control,
operation control and output control
1. Supervisory control method is classified into continuous supervisory, remote
continuous control and occasional control.
2. Operational control method is classified into manual control, one-man control and
full automatic control.
3. Output control method is classified into output by single governor for independent
network and water level control, discharge control and program control for
parallel operation with other power source.
In case of an isolated micro-hydropower plant for rural electrification, the occasional
control, manual control and governor control with dummy load is usually adopted
because no person can monitor the plant in full time basis and also to save on the cost of
control equipment. This means that the operator can visit the plant occasionally to start
and stop its operation if it is equipped with governor control and when some trouble
occurs, the operator could conveniently inspect the plant to take some necessary
measure.
6.6.2 Instrumentation of Plant
Though many instruments are required in the monitoring of hydropower plant during
operation, the following instruments may be furnished as the minimum requirement for
micro-hydropower plant in rural electrification.
1. Pressure gage for penstock
2. Voltmeter with change-over switch for output voltage
3. Voltmeter with change-over switch for output of dummy load (ballast)

Manual for Micro-Hydro Power Development Chapter 6
- 6-25 -
4. Ammeter with change-over switch for ampere of generator output
5. Frequency meter for rotational speed of generator
6. Hour meter for operation time
7. KWH (kW hour) meter and KVH(Kvar hour) meter, which is recommended in
order to check and summarize total energy produced by the power plant if there is
some allowance in budget
6.6.3 Protection of Plant and 380/220V Distribution Line
Considering the same reason for cost saving in instrumentation, the following protection
is required as minimum protection for micro-hydro power plant in rural electrification.
1. Over speed of turbine and generator ( detected by frequency)
2. Under voltage
3. Over voltage
4. Over current by NFB (No Fuse Breaker) or MCCB(Molded Case Circuit Breaker)
for low tension circuit.
When items 1, 2 and 3 are detected by IGC or ELC (with adjustable by screw), MC
(Magnet Contactor) is activated and trips the main circuit of generator
6.6.4 Protection of 20kV Distribution Line
Normal protection system of line (Pole-mounted type Lighting Arresters and Fuses or
Fuse Switches) is to be provided throughout the line. However, the following two kinds
of system could be installed as protection of 20kV outgoing facility at power station.
1. The following facilities are to be installed at 20kV switchgear of power station in
case 20kV switchgear for large capacity and long outgoing line is required.
1) 1 no. 24kV Circuit Breaker, driven by AC operated closing and tripping
system of capacitor trip power supply device (3-phase, 200A for MHP )
2) 3 nos. 24kV Fuse Switches with fuse, hand operated type (3-phase)
3) 1 no. 24kV Earthing Switch, hand operated type (3-phase gang operated)
4) 3 nos. 20kV Lightning Arrester (more than 27kV, 5kA)
5) 1 no. 20 kV Voltage Transformer(3 phase, 22kV/110V )

Manual for Micro-Hydro Power Development Chapter 6
- 6-26 -
6) 3 nos. 20kV Current Transformer (1-phase, Ratio to be fixed by the actual
capacity of MHP)
7) 1 set 20kV Busbars system
8) 1 no. Control and Protection Panel
In case 20kV cubicle is applied all the above facilities are to be installed in the
cubicle.
2. The following facilities only are to be installed by connection from 20kV terminal
of 20kV/380V transformer on the terminal pole at Power Plant, in case only
20kV/380V transformer is installed for step-up purpose due to small capacity
distribution line. In this case, protection panel for 20kV line is not required.
1) 3 nos. 24kV Fuse Switches with fuse, hand operated type (3-phase)
2) 3 nos. 20kV Lightning Arrester (more than 27kV, 5kA)
3) 1 lot 20kV line connection materials (Insulators, support structure, wires)
6.7 Inlet valve
Referring of water quantity and head of plant, suitable inlet valve is applied between
penstock and turbine for tight stopping of water supply for safety and maintenance.
However, it may sometimes be omitted for purpose of cost saving in case of low head
power plant if the stop log or gate at forebay can almost stop the water leakage from
forebay into penstock or separate discharge pass-way is provided at forebay
The inlet valve for micro and small power plant is classified into three(3) kinds as
follows:
Type Applicable head Applicable diameter Head loss Leakage
1.Butterfly valve; Not exceeding 200m Medium(up to 2.5m) Medium Medium
2.Bi-plane valve; Not exceeding 350m More than 500mmm Little Medium
3.Sluice valve; Exceeding 200m Small Almost zero Very less
More details are shown in Table 6.7.1.
For micro or small power plant, butterfly valve is adopted due to simple construction
and low cost.

Manual for Micro-Hydro Power Development Chapter 6
- 6-27 -

Manual for Micro-Hydro Power Development Chapter 6 (ANNEX)
- 6-28 -
ANNEX.
Annex. 6.1 Brief Design of Cross Flow Turbine (SKAT T-12, 13 &14)
1. Cross Flow Turbine
At present Cross Flow turbine is the preferred turbine for micro power plant,. SKAT T-12, T-13 and
T-14 are recommended for micro-hydro power generation. The major advantages are as follows:
• Available technical data for design.
• Proper design with a wide range of heads and flows according to available actual site condition.
• Comparably low cost
• Easy installation
• Local fabrication, maintenance and repair
2. Fundamental Design Data
The following fundamental data shall be taken from the civil design.
1. Elevation of water level at forebay _______ m
2. Elevation of turbine center _______ m
3. Elevation of tailrace water if required _______ m
4. Rated flow (discharge) _______ m3/s
5. Internal diameter of penstock _______ cm
6. Length of penstock _______ m
7. Condition of nos. of bends of penstock, etc.
3. Application Limits
The applicable limit of Cross Flow turbine (T-12, T-13 & 14) can be summarized in following Table
6.A1.1.
Table 6.A1.1 Limit of Cross Flow Turbine (at turbine shaft)
Unit Lower limit Upper limit
Hnet Net head m 4 50
Q Discharge (Flow) l/s 100 820
P Shaft power output kW 10 250
bo Inlet width mm 100 1120
Number of intermediate discs - 0 8
Note: These limits must be respected. Engineering consideration such as practicability, relative cost,
tightness of inlet valve in closed position, opening force on inlet valve, strength of the rotor
blades, strength of the connection of the side discs to the rotor shaft, diameter of the shaft etc
demand the respect of these limits

Manual for Micro-Hydro Power Development Chapter 6 (ANNEX)
- 6-29 -
On Chart 1 curves are shown for various outputs P. The corresponding formula is :
netHQP 8.9
The approximate rotational speed n of turbine can be read from the vertical scale on the right side of Chart
1. Its exact value is calculated with following formula for T-12, 13 & 14:
netHn 133
Example within the limits:
For a net head Hnet =30.89 m and a discharge Q=497 l/s, the following values can be determined on the
T-13 and T-14 application Fig. 6.A1.1.
The point of intersection of the Hnet and Q values is within the range of the white field, which means
that the T-13 and T-14 design is appropiate.
The shaft power output is just above 100 kW.
The rotational speed n is about 740 min-1.
Example outside the limits
Hnet = 6m and Q = 200 l/s
Although both Hnet and Q are within the limits, the intersection point on Fig. 6.A1.1 lies outside the
white, non-dotted field. For this application T-12, T-13 and T-14 cannot be used.
Please refer to Fig. 6.A1.1 in next page

Manual for Micro-Hydro Power Development Chapter 6 (ANNEX)
- 6-30 -
Fig. 6.A1.1 Application Limits of The T-12, T-13 & T-14
/APPLICATION LIMITS OF THE T-12, T-13 & 14 CROSS FLOW TURBINE DESIGN, POWER OUTPUT, RPM AND d-d LINE
4. Using Power Transmission Facility
One of the advantages of Cross Flow turbine is that a power transmission facility with a belt drive
(Speed increaser) is easily applied in order to match both the speed of turbine and generator. The
advantages of using power transmission arrangement are summarized below.
• Application of most suitable design of turbine itself to match the various actual site condition
Easy and wide selection of turbine speed with proper speed increaser to generator
• Easier installation – horizontal shaft, common base for generator and turbine.
• Lower cost – to apply the small size generator with high speed, such as 1500 or 1000 rpm
5. Suitable Range of Site Heads and Flows for T-12, T-13 & 14
The Figure 6.A1.1 shows the applicable range of heads and discharges (flows) of Cross Flow turbine
to be used. The applicable range of Cross Flow turbines (T-12, T-13 and T-14) is shown with white
area in the figure and d-d line in the figure shows the limitation of strength of shaft for belt pulley as
follows:

Manual for Micro-Hydro Power Development Chapter 6 (ANNEX)
- 6-31 -
(1) Intersection point below d-d line
Any transmission system between turbine and generator is permissible
(2) Intersection point above d-d line
Additional bending stress on the rotor shaft due to force created by e.g. belt tension is not
permissible, therefore, no belt pulley on the rotor shaft is allowed. In case of a belt transmission,
a separately supported pulley shaft would have to be coupled to the rotor shaft.
The range of Cross Flow turbine can be extended by using either a four-pole (1500 rpm) or a six-pole
(1000 rpm) generator.
6. Calculation of turbine design
The formulae for the calculation of the turbine performance values in design are as follows;
Formula (1): Inlet width
netH
Q
Dqb
max110
1 0b Inlet width m
netH Net head m
Q Discharge (flow) sm /3
max11q Unit discharge (flow) =0.67 for T-12
=0.76 for T-13
=0.80 for T-14
D Rotor diameter =0.3 m for T-12, T-13 & T-14 m
netH
Qb 623.30 for T-12
netH
Qb 39.40 for T-13
netH
Qb 9.40 for T-14
Formula (2): Shaft power output
netHQP 98.0 P Power kW
Turbine efficiency : 0.65 for T-12
0.76 for T-13
0.80 for T-14
Q& netH : Same as formula (1)
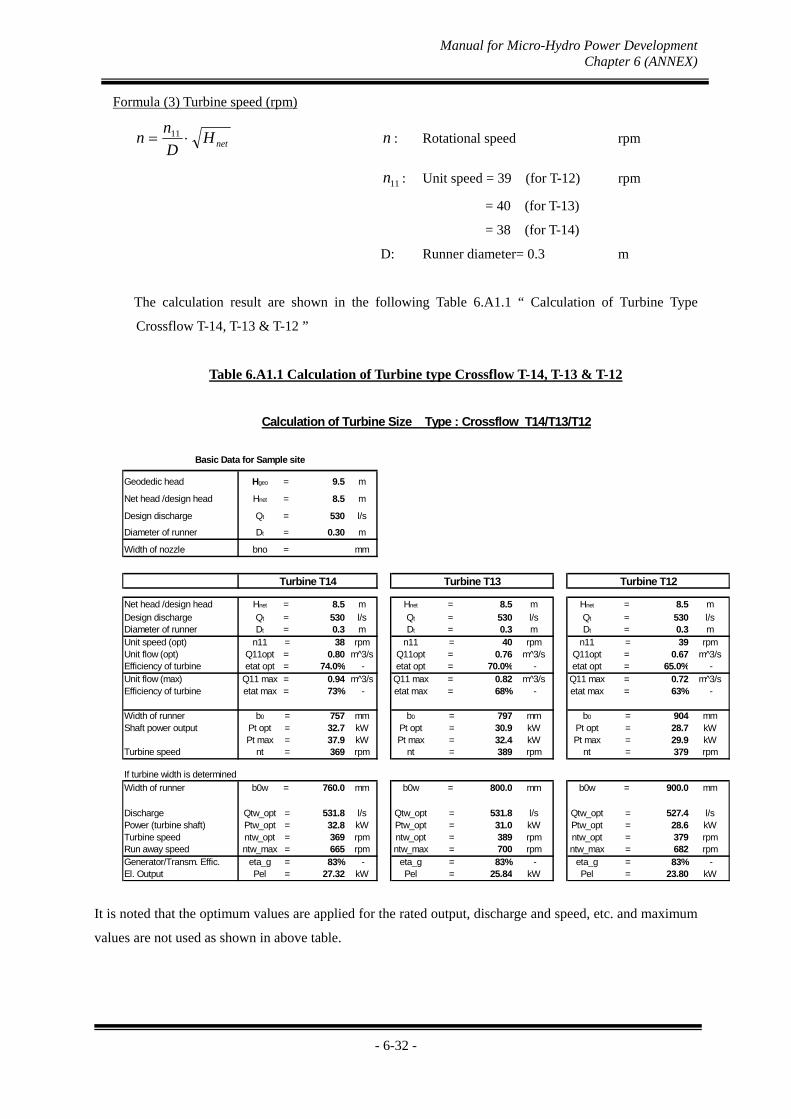
Manual for Micro-Hydro Power Development Chapter 6 (ANNEX)
- 6-32 -
Formula (3) Turbine speed (rpm)
netHD
nn 11 n : Rotational speed rpm
11n : Unit speed = 39 (for T-12) rpm
= 40 (for T-13)
= 38 (for T-14)
D: Runner diameter= 0.3 m
The calculation result are shown in the following Table 6.A1.1 “ Calculation of Turbine Type
Crossflow T-14, T-13 & T-12 ”
Table 6.A1.1 Calculation of Turbine type Crossflow T-14, T-13 & T-12
It is noted that the optimum values are applied for the rated output, discharge and speed, etc. and maximum
values are not used as shown in above table.
Geodedic head Hgeo = 9.5 m
Net head /design head Hnet = 8.5 m
Design discharge Qt = 530 l/s
Diameter of runner Dt = 0.30 m
Width of nozzle bno = mm
Net head /design head Hnet = 8.5 m Hnet = 8.5 m Hnet = 8.5 m
Design discharge Qt = 530 l/s Qt = 530 l/s Qt = 530 l/sDiameter of runner Dt = 0.3 m Dt = 0.3 m Dt = 0.3 mUnit speed (opt) n11 = 38 rpm n11 = 40 rpm n11 = 39 rpmUnit flow (opt) Q11opt = 0.80 m^3/s Q11opt = 0.76 m^3/s Q11opt = 0.67 m^3/sEfficiency of turbine etat opt = 74.0% - etat opt = 70.0% - etat opt = 65.0% -Unit flow (max) Q11 max = 0.94 m^3/s Q11 max = 0.82 m^3/s Q11 max = 0.72 m^3/sEfficiency of turbine etat max = 73% - etat max = 68% - etat max = 63% -
Width of runner b0 = 757 mm b0 = 797 mm b0 = 904 mmShaft power output Pt opt = 32.7 kW Pt opt = 30.9 kW Pt opt = 28.7 kW
Pt max = 37.9 kW Pt max = 32.4 kW Pt max = 29.9 kWTurbine speed nt = 369 rpm nt = 389 rpm nt = 379 rpm
If turbine width is determined
Width of runner b0w = 760.0 mm b0w = 800.0 mm b0w = 900.0 mm
Discharge Qtw_opt = 531.8 l/s Qtw_opt = 531.8 l/s Qtw_opt = 527.4 l/sPower (turbine shaft) Ptw_opt = 32.8 kW Ptw_opt = 31.0 kW Ptw_opt = 28.6 kWTurbine speed ntw_opt = 369 rpm ntw_opt = 389 rpm ntw_opt = 379 rpmRun away speed ntw_max = 665 rpm ntw_max = 700 rpm ntw_max = 682 rpmGenerator/Transm. Effic. eta_g = 83% - eta_g = 83% - eta_g = 83% -El. Output Pel = 27.32 kW Pel = 25.84 kW Pel = 23.80 kW
Turbine T13Turbine T14 Turbine T12
Calculation of Turbine Size Type : Crossflow T14/T13/T12
Basic Data for Sample site

Manual for Micro-Hydro Power Development Chapter 6 (ANNEX)
- 6-33 -
Annex. 6.2 Brief Design of Reverse Pump Turbine (PAT)
1. Reverse Pump Turbine (Pump as Turbine= PAT)
Standard pump units when operated in reverse as turbines have a number of advantages over
conventional turbines for micro-hydro power generation. Pumps are mass-produced, and as a result,
have advantage for micro-hydro compared with purpose-made turbines. The main advantages are as
follows:
• Integral pump and motor can be purchased for use as a turbine and generator set
• Available for a wide range of heads and flows
• Available in a large number of standard sizes
• Low cost
• Short delivery time
• Spare parts such as seals and bearings are easily available
• Easy installation – uses standard pipe fittings
There are several practical benefits of being able to use a direct drive pump as turbine (PAT), i.e. the
pump shaft is connected directly to the generator, as explained in the next section.
Pump suppliers usually stock a number of different pumps designed to be suitable for a wide range of
heads and flows. The actual range of heads and flows for which a PAT is suitable is explained in a
later section.
The simplicity of the PAT means that it does have certain limitation when compared with more
expensive types of turbine. The main limitation is that the range of flow rates over which a particular
unit can operate is much less than for a conventional turbine. Some ways of overcoming this
limitation are covered at the end of this chapter. Therefore , the selection of applicable pump should be
selected referring hereunder.
2. Using a Direct Drive Pumps as Turbine
One of the advantages of using a PAT instead of a conventional turbine is the opportunity to avoid a
belt drive. However, in some circumstances there are advantages to fitting a belt drive to a PAT.
The advantages of using a direct drive arrangement are summarized below.
• Very low friction loss in drive (saving up to 5% of output power.).
• Easier installation – PAT and generator come as one unit.
• Lower cost – no pulleys, smaller base plate.
• Lower cost (in the case of a ‘mono-bloc’ design) because of simpler construction, fewer bearings,
etc.
• Longer bearing life – no sideways forces on bearings.
• Less maintenance – no need to adjust belt tension or replace belts.
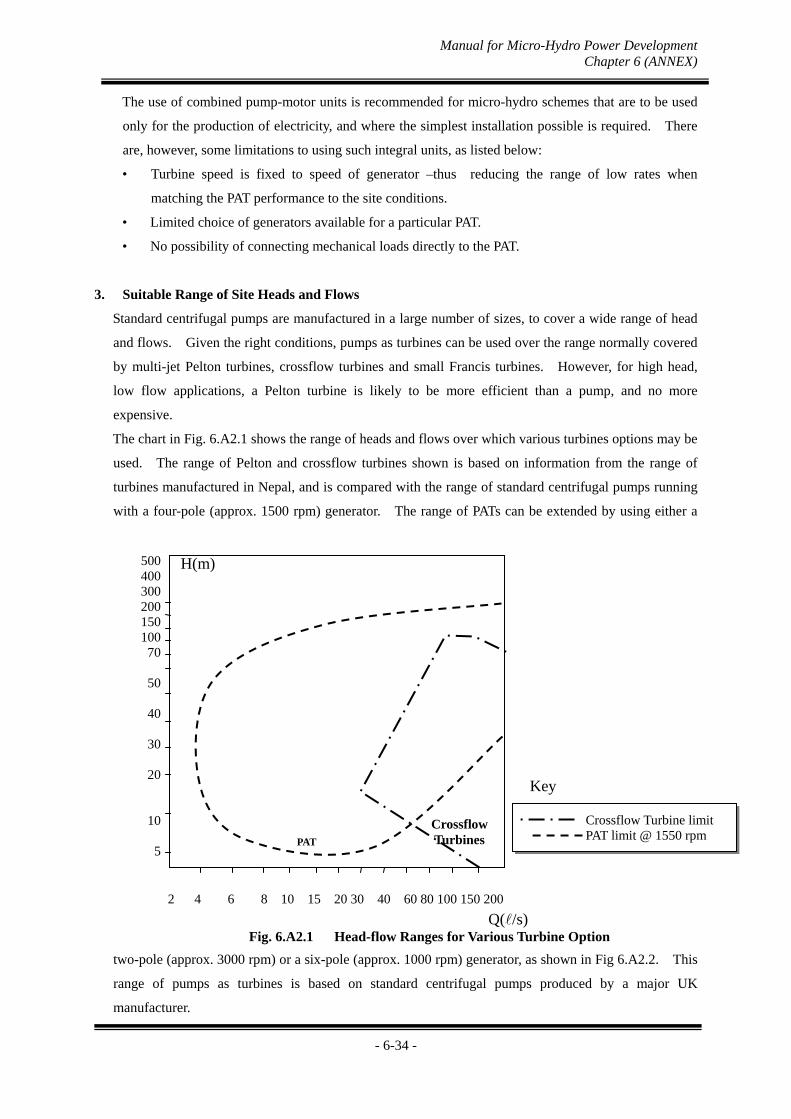
Manual for Micro-Hydro Power Development Chapter 6 (ANNEX)
- 6-34 -
The use of combined pump-motor units is recommended for micro-hydro schemes that are to be used
only for the production of electricity, and where the simplest installation possible is required. There
are, however, some limitations to using such integral units, as listed below:
• Turbine speed is fixed to speed of generator –thus reducing the range of low rates when
matching the PAT performance to the site conditions.
• Limited choice of generators available for a particular PAT.
• No possibility of connecting mechanical loads directly to the PAT.
3. Suitable Range of Site Heads and Flows
Standard centrifugal pumps are manufactured in a large number of sizes, to cover a wide range of head
and flows. Given the right conditions, pumps as turbines can be used over the range normally covered
by multi-jet Pelton turbines, crossflow turbines and small Francis turbines. However, for high head,
low flow applications, a Pelton turbine is likely to be more efficient than a pump, and no more
expensive.
The chart in Fig. 6.A2.1 shows the range of heads and flows over which various turbines options may be
used. The range of Pelton and crossflow turbines shown is based on information from the range of
turbines manufactured in Nepal, and is compared with the range of standard centrifugal pumps running
with a four-pole (approx. 1500 rpm) generator. The range of PATs can be extended by using either a
two-pole (approx. 3000 rpm) or a six-pole (approx. 1000 rpm) generator, as shown in Fig 6.A2.2. This
range of pumps as turbines is based on standard centrifugal pumps produced by a major UK
manufacturer.
H(m)
Q(/s)
Key
Crossflow Turbine limit PAT limit @ 1550 rpm
500 400 300 200 150 100 70
50
40
30
20
10
5
2 4 6 8 10 15 20 30 40 60 80 100 150 200
CrossflowTurbines PAT
Fig. 6.A2.1 Head-flow Ranges for Various Turbine Option
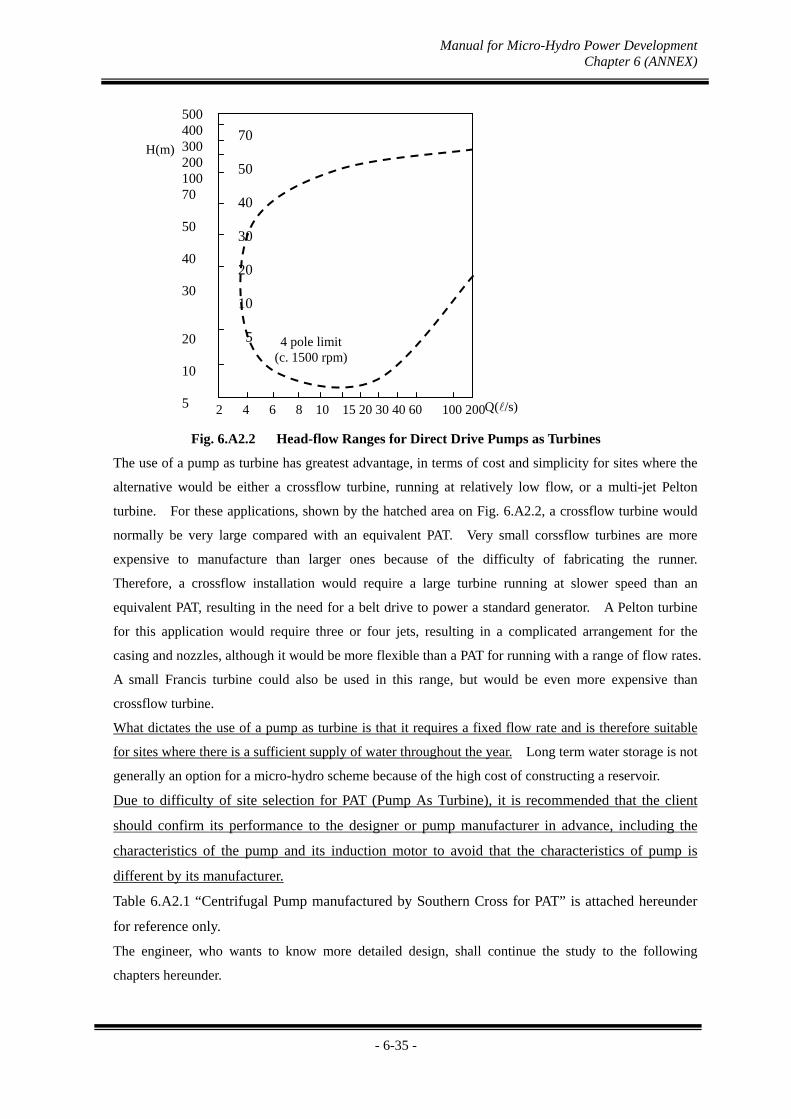
Manual for Micro-Hydro Power Development Chapter 6 (ANNEX)
- 6-35 -
Fig. 6.A2.2 Head-flow Ranges for Direct Drive Pumps as Turbines
The use of a pump as turbine has greatest advantage, in terms of cost and simplicity for sites where the
alternative would be either a crossflow turbine, running at relatively low flow, or a multi-jet Pelton
turbine. For these applications, shown by the hatched area on Fig. 6.A2.2, a crossflow turbine would
normally be very large compared with an equivalent PAT. Very small corssflow turbines are more
expensive to manufacture than larger ones because of the difficulty of fabricating the runner.
Therefore, a crossflow installation would require a large turbine running at slower speed than an
equivalent PAT, resulting in the need for a belt drive to power a standard generator. A Pelton turbine
for this application would require three or four jets, resulting in a complicated arrangement for the
casing and nozzles, although it would be more flexible than a PAT for running with a range of flow rates.
A small Francis turbine could also be used in this range, but would be even more expensive than
crossflow turbine.
What dictates the use of a pump as turbine is that it requires a fixed flow rate and is therefore suitable
for sites where there is a sufficient supply of water throughout the year. Long term water storage is not
generally an option for a micro-hydro scheme because of the high cost of constructing a reservoir.
Due to difficulty of site selection for PAT (Pump As Turbine), it is recommended that the client
should confirm its performance to the designer or pump manufacturer in advance, including the
characteristics of the pump and its induction motor to avoid that the characteristics of pump is
different by its manufacturer.
Table 6.A2.1 “Centrifugal Pump manufactured by Southern Cross for PAT” is attached hereunder
for reference only.
The engineer, who wants to know more detailed design, shall continue the study to the following
chapters hereunder.
H(m)
Q(/s)
70
50
40
30
20
10
5
2 4 6 8 10 15 20 30 40 60 100 200
4 pole limit (c. 1500 rpm)
500 400 300 200 100 70 50 40 30 20 10 5
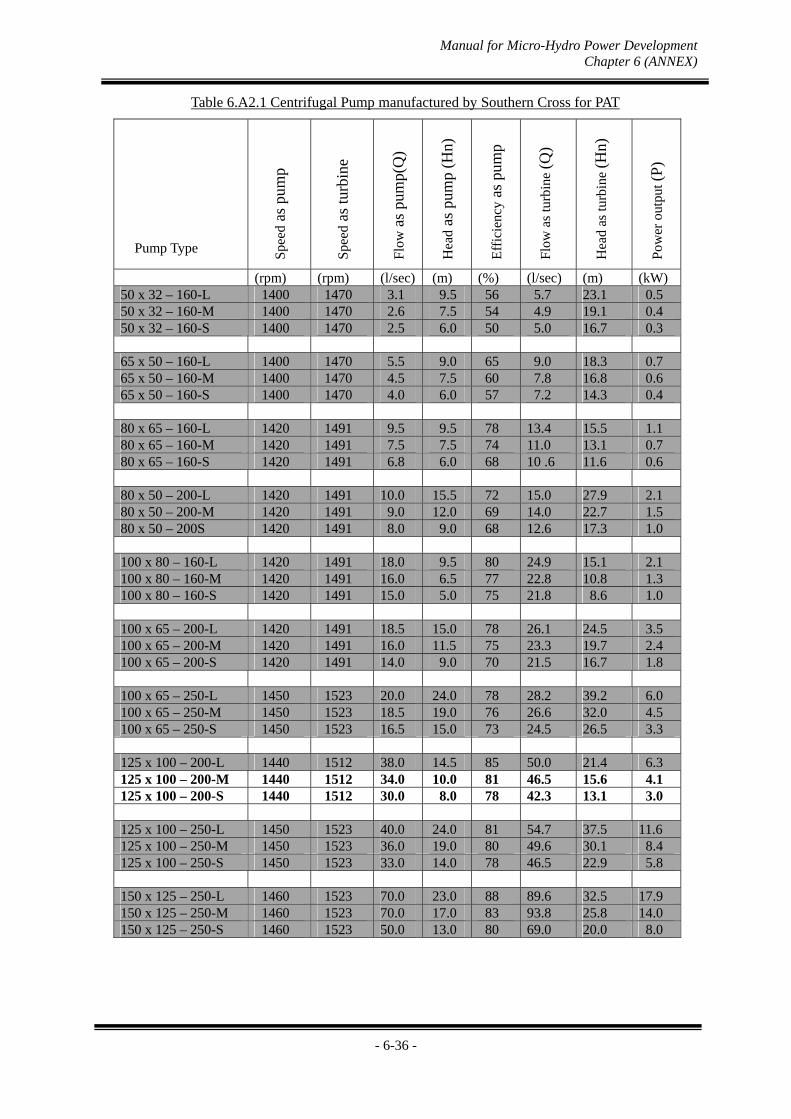
Manual for Micro-Hydro Power Development Chapter 6 (ANNEX)
- 6-36 -
Table 6.A2.1 Centrifugal Pump manufactured by Southern Cross for PAT
Pump Type
(rpm) (rpm) (l/sec) (m) (%) (l/sec) (m) (kW) 50 x 32 – 160-L 1400 1470 3.1 9.5 56 5.7 23.1 0.5 50 x 32 – 160-M 1400 1470 2.6 7.5 54 4.9 19.1 0.4 50 x 32 – 160-S 1400 1470 2.5 6.0 50 5.0 16.7 0.3 65 x 50 – 160-L 1400 1470 5.5 9.0 65 9.0 18.3 0.7 65 x 50 – 160-M 1400 1470 4.5 7.5 60 7.8 16.8 0.6 65 x 50 – 160-S 1400 1470 4.0 6.0 57 7.2 14.3 0.4 80 x 65 – 160-L 1420 1491 9.5 9.5 78 13.4 15.5 1.1 80 x 65 – 160-M 1420 1491 7.5 7.5 74 11.0 13.1 0.7 80 x 65 – 160-S 1420 1491 6.8 6.0 68 10 .6 11.6 0.6 80 x 50 – 200-L 1420 1491 10.0 15.5 72 15.0 27.9 2.1 80 x 50 – 200-M 1420 1491 9.0 12.0 69 14.0 22.7 1.5 80 x 50 – 200S 1420 1491 8.0 9.0 68 12.6 17.3 1.0 100 x 80 – 160-L 1420 1491 18.0 9.5 80 24.9 15.1 2.1 100 x 80 – 160-M 1420 1491 16.0 6.5 77 22.8 10.8 1.3 100 x 80 – 160-S 1420 1491 15.0 5.0 75 21.8 8.6 1.0 100 x 65 – 200-L 1420 1491 18.5 15.0 78 26.1 24.5 3.5 100 x 65 – 200-M 1420 1491 16.0 11.5 75 23.3 19.7 2.4 100 x 65 – 200-S 1420 1491 14.0 9.0 70 21.5 16.7 1.8 100 x 65 – 250-L 1450 1523 20.0 24.0 78 28.2 39.2 6.0 100 x 65 – 250-M 1450 1523 18.5 19.0 76 26.6 32.0 4.5 100 x 65 – 250-S 1450 1523 16.5 15.0 73 24.5 26.5 3.3 125 x 100 – 200-L 1440 1512 38.0 14.5 85 50.0 21.4 6.3 125 x 100 – 200-M 1440 1512 34.0 10.0 81 46.5 15.6 4.1 125 x 100 – 200-S 1440 1512 30.0 8.0 78 42.3 13.1 3.0 125 x 100 – 250-L 1450 1523 40.0 24.0 81 54.7 37.5 11.6 125 x 100 – 250-M 1450 1523 36.0 19.0 80 49.6 30.1 8.4 125 x 100 – 250-S 1450 1523 33.0 14.0 78 46.5 22.9 5.8 150 x 125 – 250-L 1460 1523 70.0 23.0 88 89.6 32.5 17.9 150 x 125 – 250-M 1460 1523 70.0 17.0 83 93.8 25.8 14.0 150 x 125 – 250-S 1460 1523 50.0 13.0 80 69.0 20.0 8.0
Flo
w a
s pu
mp(
Q)
Hea
d as
pum
p (H
n)
Eff
icie
ncy
as p
ump
Flo
w a
s tu
rbin
e (Q
)
Hea
d as
turb
ine
(Hn)
Pow
er o
utpu
t (P
)
Spe
ed a
s pu
mp
Spe
ed a
s tu
rbin
e
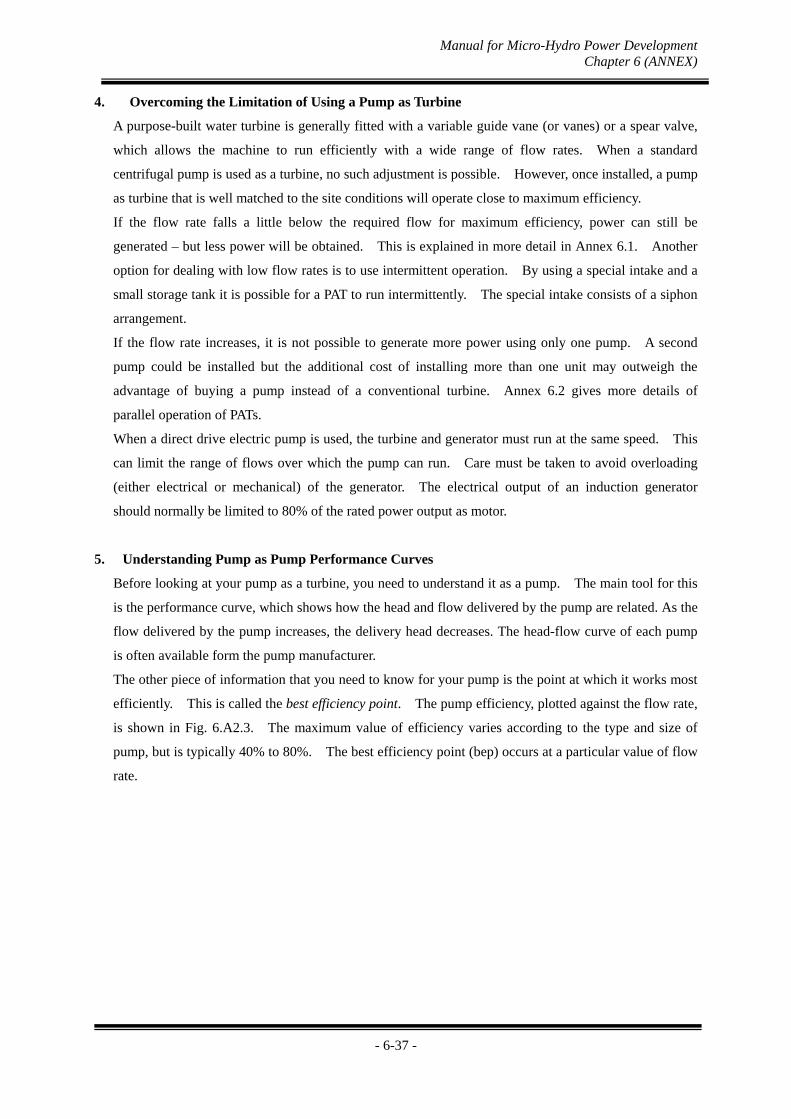
Manual for Micro-Hydro Power Development Chapter 6 (ANNEX)
- 6-37 -
4. Overcoming the Limitation of Using a Pump as Turbine
A purpose-built water turbine is generally fitted with a variable guide vane (or vanes) or a spear valve,
which allows the machine to run efficiently with a wide range of flow rates. When a standard
centrifugal pump is used as a turbine, no such adjustment is possible. However, once installed, a pump
as turbine that is well matched to the site conditions will operate close to maximum efficiency.
If the flow rate falls a little below the required flow for maximum efficiency, power can still be
generated – but less power will be obtained. This is explained in more detail in Annex 6.1. Another
option for dealing with low flow rates is to use intermittent operation. By using a special intake and a
small storage tank it is possible for a PAT to run intermittently. The special intake consists of a siphon
arrangement.
If the flow rate increases, it is not possible to generate more power using only one pump. A second
pump could be installed but the additional cost of installing more than one unit may outweigh the
advantage of buying a pump instead of a conventional turbine. Annex 6.2 gives more details of
parallel operation of PATs.
When a direct drive electric pump is used, the turbine and generator must run at the same speed. This
can limit the range of flows over which the pump can run. Care must be taken to avoid overloading
(either electrical or mechanical) of the generator. The electrical output of an induction generator
should normally be limited to 80% of the rated power output as motor.
5. Understanding Pump as Pump Performance Curves
Before looking at your pump as a turbine, you need to understand it as a pump. The main tool for this
is the performance curve, which shows how the head and flow delivered by the pump are related. As the
flow delivered by the pump increases, the delivery head decreases. The head-flow curve of each pump
is often available form the pump manufacturer.
The other piece of information that you need to know for your pump is the point at which it works most
efficiently. This is called the best efficiency point. The pump efficiency, plotted against the flow rate,
is shown in Fig. 6.A2.3. The maximum value of efficiency varies according to the type and size of
pump, but is typically 40% to 80%. The best efficiency point (bep) occurs at a particular value of flow
rate.
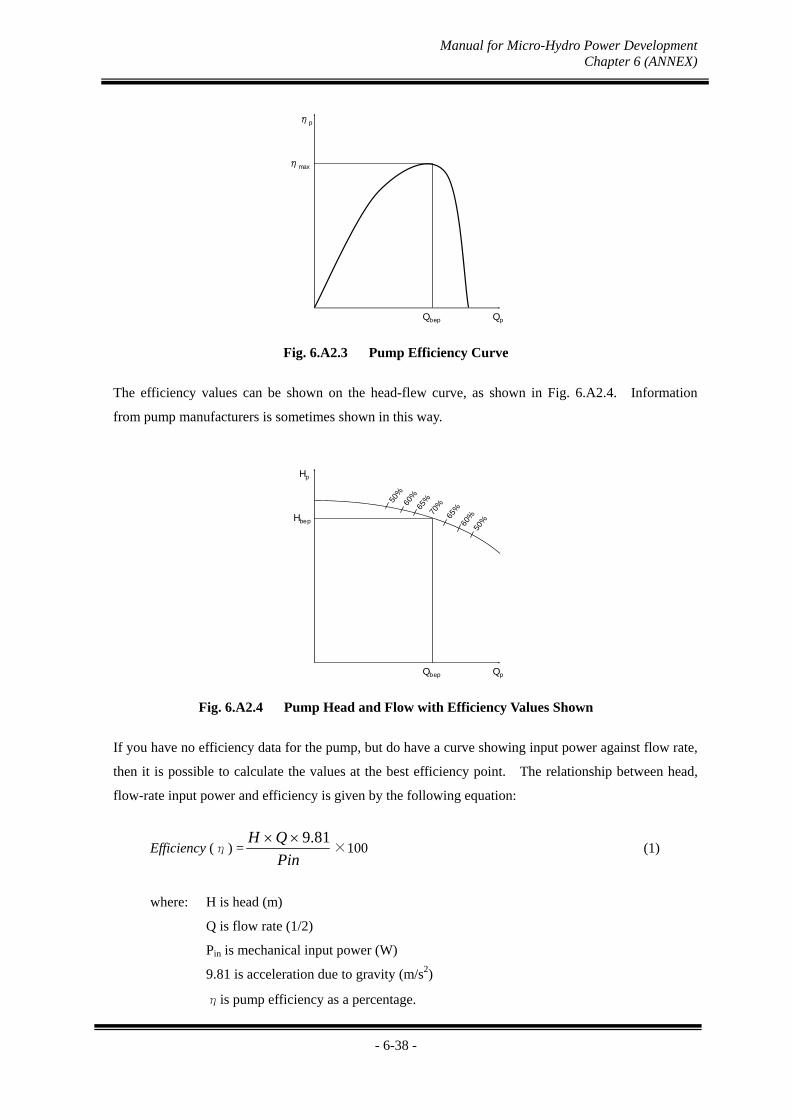
Manual for Micro-Hydro Power Development Chapter 6 (ANNEX)
- 6-38 -
ηp
ηmax
Qbep Qp
Fig. 6.A2.3 Pump Efficiency Curve
The efficiency values can be shown on the head-flew curve, as shown in Fig. 6.A2.4. Information
from pump manufacturers is sometimes shown in this way.
Hp
Hbep
Qbep Qp
50%
60%
70%65
%
65%
60%
50%
Fig. 6.A2.4 Pump Head and Flow with Efficiency Values Shown
If you have no efficiency data for the pump, but do have a curve showing input power against flow rate,
then it is possible to calculate the values at the best efficiency point. The relationship between head,
flow-rate input power and efficiency is given by the following equation:
Efficiency (η) =Pin
QH 81.9×100 (1)
where: H is head (m)
Q is flow rate (1/2)
Pin is mechanical input power (W)
9.81 is acceleration due to gravity (m/s2)
ηis pump efficiency as a percentage.

Manual for Micro-Hydro Power Development Chapter 6 (ANNEX)
- 6-39 -
The steps for calculating the value of maximum efficiency are as follows:
1. Use the head-flow curve to obtain the head and flow rate at best efficiency point (bep).
2. Use this flow rate on the power input-flow curve to get Pin.
3. Put these values in equation (1) to obtain the efficiency.
Note that, especially for pumps with integral motors, the power curve may show electrical power
consumption rather than mechanical input power. In this case, use Appendix D to estimate the
efficiency of the motor. Then sue the following equation to calculate Pin.
Pin = Pelec ×100
(%)motor (2)
Where: Pin is mechanical input power (W)
Pelec is the electrical power consumption of the motor (W)
ηmotor is motor efficiency as a percentage.
Example 1: Finding pump best efficiency conditions.
The manufacturer of a 65-40-200 (2.5” × 1.5” × 8 pump gives the head-flow curve and electrical
power input curve as shown below in Fig. 6.A2.9a and 9b. The flow at best efficiency is 14m3/hr,
which can be converted to 3.89 l/s by dividing by 3.6, the conversion factor given in Appendix E.
The head at best efficiency is 11.8m
The motor is rated at 1.5 hp (1.1 kW), 1,450 rpm, for operation on a 3-phase, 50 Hz supply.
According to the table in Appendix D, this size of motor has a maximum efficiency of around 75%.
The value of electrical power consumed, for the best efficiency point, can be found from Fig. 6.A2.
9b. At a flow rate of 14m3/hr, the power is 1,050 W. This is Pelec. Using equation (2):
Pin = Pelec × 100
(%)motor= 1050 ×
100
75 = 788W
The pump best efficiency is therefore, from equation (1):
η= inP
QH 81.9 × 100 =
788
81.989.38.11 × 100 = 57%

Manual for Micro-Hydro Power Development Chapter 6 (ANNEX)
- 6-40 -
Hp
(m)
Qp (m3/hr)
18
16
14
12
10
8
6
4
2
5 10 15 20
Pelec
(W)
Qp (m3/hr)
1000
750
500
250
5 10 15 20
(a) Head and flow, with best efficiency point (b) Electrical power consumption
Fig. 6.A2.5 Manufacturer’s Pump Curves
H
Q
Hsitehf
PAT Curve Site CurveOperatingPoint
Fig. 6.A2.6 Turbine Curve and Site Curve
The speed of the turbine will vary according to the load that is put on it, and there is a different
head-flow curve for each speed. Three such curves are shown in Fig. 6.A2.7. The middle curve,
labeled N=100% is for the normal operating speed (the same as in Fig. 6.A2.8). The curves labeled
N=130% and N=80% are for speeds 30% higher and 20% lower than normal operating speed. Note
that for each speed, the operating point it given by the intersection of the turbine curve with the site
curve.
If a load, which is higher than design load, is put on the turbine, the speed goes down. For the pump
shown in Fig. 6.A2.7, this causes a slight increase in flow rate, which is usually the case for
centrifugal pumps running as turbines. When the load on the turbine is reduced, the speed increases.
If there is no load, the speed of the turbine increases to a maximum, which is known as runaway.
The curve of maximum speeds is also shown on Fig. 6.A2.7 (labeled N=max). In the case illustrated,
the actual speed at runaway is (by extrapolation) approximately 140% of normal operating speed.
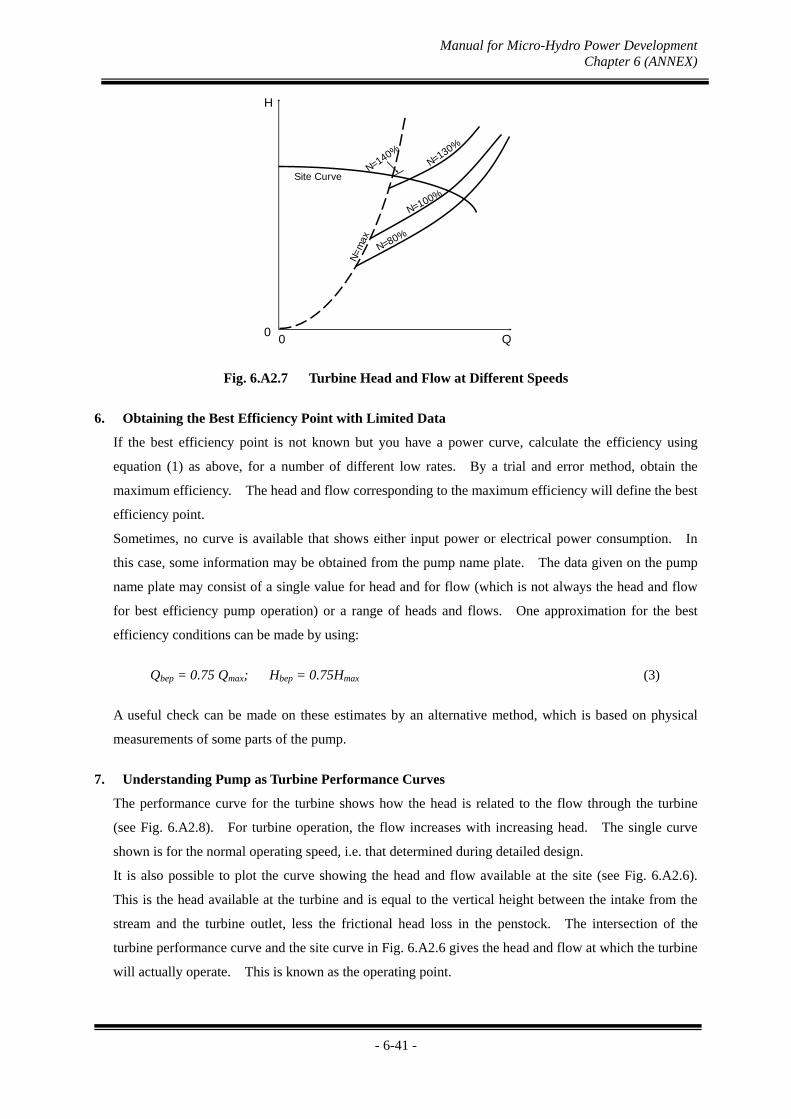
Manual for Micro-Hydro Power Development Chapter 6 (ANNEX)
- 6-41 -
H
00 Q
Site CurveN=140%
N=130%
N=100%
N=80%
N=
max
Fig. 6.A2.7 Turbine Head and Flow at Different Speeds
6. Obtaining the Best Efficiency Point with Limited Data
If the best efficiency point is not known but you have a power curve, calculate the efficiency using
equation (1) as above, for a number of different low rates. By a trial and error method, obtain the
maximum efficiency. The head and flow corresponding to the maximum efficiency will define the best
efficiency point.
Sometimes, no curve is available that shows either input power or electrical power consumption. In
this case, some information may be obtained from the pump name plate. The data given on the pump
name plate may consist of a single value for head and for flow (which is not always the head and flow
for best efficiency pump operation) or a range of heads and flows. One approximation for the best
efficiency conditions can be made by using:
Qbep = 0.75 Qmax; Hbep = 0.75Hmax (3)
A useful check can be made on these estimates by an alternative method, which is based on physical
measurements of some parts of the pump.
7. Understanding Pump as Turbine Performance Curves
The performance curve for the turbine shows how the head is related to the flow through the turbine
(see Fig. 6.A2.8). For turbine operation, the flow increases with increasing head. The single curve
shown is for the normal operating speed, i.e. that determined during detailed design.
It is also possible to plot the curve showing the head and flow available at the site (see Fig. 6.A2.6).
This is the head available at the turbine and is equal to the vertical height between the intake from the
stream and the turbine outlet, less the frictional head loss in the penstock. The intersection of the
turbine performance curve and the site curve in Fig. 6.A2.6 gives the head and flow at which the turbine
will actually operate. This is known as the operating point.
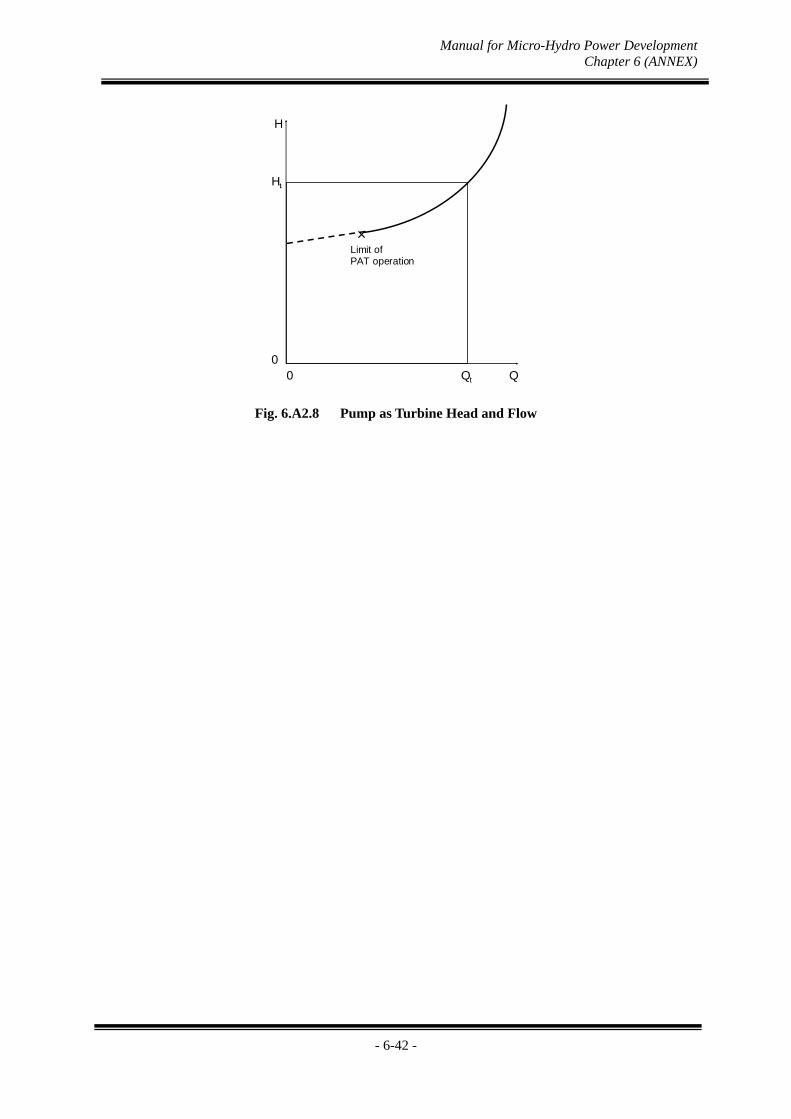
Manual for Micro-Hydro Power Development Chapter 6 (ANNEX)
- 6-42 -
H
Ht
Qt Q0
0
×Limit of PAT operation
Fig. 6.A2.8 Pump as Turbine Head and Flow

Manual for Micro-Hydro Power Development Chapter 6 (ANNEX)
- 6-43 -
SELECTING PUMP AS TURINE FOR A PARTICULAR SITE
This chapter gives procedures for selecting a pump as turbine to match a particular site, using either
performance calculations of turbine testing.
Matching a Pump as Turbine to Site Conditions
In selecting your site, you choose a particular set of head and flow conditions. The flow rate is
normally determined by the minimum flow rate, i.e. the flow that is available throughout the year. The
head is determined by the vertical height between the intake from the stream and the turbine outlet, less the
head loss in the penstock for this particular flow rate. A pump needs to be selected for which the head and
flow, at the turbine best efficiency point, are as close as possible to the site conditions.
This section gives the calculations needed to get the turbine head and flow at best efficiency point for
a particular pump. The running conditions in terms of head and flow, for best efficiency as a turbine, are
very different from the rated pump output, although the PAT efficiency will be approximately the same as
for pump operation. Friction and leakage loses, within a centrifugal pump, result in a reduction of head
and flow from the theoretical maximum. The head and flow required, when running as a turbine, will be
greater than the theoretical values, in order to make up for the losses. The following equations are given
in the literature to predict turbine head and flow for constant speed:
Q1 = maxbepQ
; H1 = maxbepH
; η1 =ηmax (4)
where Qbep is the flow rate and pump best efficiency point (bep)
Hbep is the head at pump bep
ηmax is the pump maximum efficiency
and Q1 is the flow rate at turbine best efficiency point (bep)
H1 is the head at turbine bep
η1 Is the turbine maximum efficiency.
These equations imply that the ratios Q1/Qbep and H1/Hbep are equal, but experimental results show
that the head ratio is usually greater than the flow ratio between turbine and pump modes. The prediction
can be improved by using different powers ofηmax for the head and flow ratios, following a method
proposed by KR Sharma of Kirloskar Co., India. If the turbine speed is the same as the pump speed, these
equations are:
Q1 = 8.0
maxbepQ
; H1 = 2.1
maxbepH
; η1 = ηmax (5)
The following example shows how to calculate the head and flow needed by the turbine when the
turbine speed is the same as the pump speed.

Manual for Micro-Hydro Power Development Chapter 6 (ANNEX)
- 6-44 -
Example 2: Calculation of turbine best efficiency point (at pump speed).
The manufacturer of a particular pump gives curves that show that as a pump is maximum efficiency
is 62% when delivering 20 l/s at a head of 16 in at 1,500 rpm. The pump is required for use as a
turbine, driving a synchronous generator at 1,500 rpm. The turbine performance at best efficiency
predicted from equations (5) will be:
Q1 = 8.0
maxbepQ
= 8.062.0
20 =
682.0
20= 29.3 l/s
H1 = 2.1
maxbepH
= 2.162.0
16 =
563.0
16 = 28.4 m
Often the turbine speed will not be the same as the rated pump speed and it is necessary to use
additional equations to take into account different running speeds of turbine and pump. Before
presenting the equation it is necessary to explain the ‘Affinity Laws’.
The Affinity Laws relate the head, flow and power of a pump or turbine to its speed:
Flow (Q) is proportional to speed (N)
Head (H) is proportional to N2
Power (P) is proportional to N3
These relationship can be use particularly for calculating the running conditions at best efficiency point.
The equations for head and flow are:
Q1 (at N = N1) = pN
N1 ×Q1 (at N = Np) (6)
H1 (at N = N1) = 21 )(pN
N×H1 (at N = Np) (7)
where Np is the related pump speed
N1 is the turbine running speed
Substituting these equations into equations (5) gives:
Q1 = pN
N1 × 8.0
maxbepQ
; H1 = 21 )(pN
N× 2.1
maxbepH
(8)
An example of carrying out this calculation is given on the next page. It must be stressed that,
although this methods is more accurate than the equations normally given in the literature (4) it is still
only approximate. The actual values of Qt and Ht may be as much as ±20% of the predicted value for
the dep. This may or may not have a significant effect on the PAT output, depending on the

Manual for Micro-Hydro Power Development Chapter 6 (ANNEX)
- 6-45 -
performance characteristics. It is therefore recommended that, wherever possible, after initial selection,
the pump is tested as a turbine to find out what power will be produced at the available head and flow.
The method for testing is described in the next section.
Example 3: Calculation of turbine best efficiency point at 1550 rpm.
The head available at a particular site is 26m, and the flow is 7 l/s. It was suggested that the pump
assessed in Example 2 could be used as a turbine for this site.
The induction motor is to be used as a generator directly driven from the turbine. The turbine
speed is therefore fixed by the generator speed. From the pump speed of 1450 rpm, the turbine
speed is calculated to be 1550 rpm. Using the equations above (8), the predicted best efficiency
conditions for turbine operation are:
Q1 = pN
N1 × 8.0
maxbepQ
= 1450
1550 ×
8.057.0
89.3 = 6.52 l/s
H1 = 21 )(pN
N× 2.1
maxbepH
= 2)1450
1550( ×
2.157.0
8.11 = 26.5 m
These values of head and flow are close to the site conditions, and the pump is therefore suitable.
Due to some difficulty of selection of PAT (Pump As Turbine), it is recommended as sample for brief
selection to refer to the attached Table 6.A2.1 of “Centrifugal Pump manufactured by Southern Cross
for PAT” attached hereunder,.
The client is requested to ask the designer the details of design with technical explanation for the
selected pump for PAT, with reference to the characteristics of the actual pump since each turbine is
made by different manufacturer.

Manual for Micro-Hydro Power Development Chapter 6 (ANNEX)
- 6-46 -
Annex. 6.3
Technical Application Sheet of Tender
for Electro-mechanical Equipment
1. Purchaser ______________________________________________________
2. Name of Plant ______________________________________________________
3. Location ______________________________________________________
4. Fundamental matters
1) Elevation of water level at forebay basin _______ m
2) Elevation of Turbine center _______ m
3) Rated water flow (Dischrge) _______ m3/s
4) Internal diameter of penstock _______ cm
5) Length of penstock _______ m
6) Number of house holders _______ HH
7) Proposed area of house holdesr
______________________________________________________________
8)
5. Electro-mechanical Works
1) Generating Equipment
(a) Hydraulic turbine and auxiliary equipment
- One ___kW cross flow type turbine with common base for generator (Note: Output shall be designed by the Tenderer referring to final output at generator terminal ___kW.)
- One inlet valve (diameter: _______ cm)
- One water level gauging
- Maintenance tools and spare parts
(b) Power transmitter between turbine and generator (If required)
- One Mechanical power transmitter (gear or belt) with pulleies.
(b) Generator and Control Equipment
- One ___kVA horizontal shaft drip-proof type synchronous generator with AVR (or Induction generator)
- One generator control system of ELC (or IGC) including protective relays, meters, surge absorber, space heater and control accessories
- One dummy load (air-cooling) complete with accessories
One Control panel with meters, switches, lamps, MC & MCB, etc.
- One set of spare parts for operation and maintenance

Manual for Micro-Hydro Power Development Chapter 6 (ANNEX)
- 6-47 -
6. 20kV Distribution Facilities (If required)
1) Distribution Line
(a) 20kV Switchgears for outgoing line with Circuit breakers, PT, CT, Lightning
arresters and other necessary accessories. (If required)
(b) 20kV/380V step-up and step-down Transformers
(c) 20kVoverhead lines with steel or wooden poles (7m) with accessories , insulated wires of single core (70, 35,16sq.mm), Insulators, Lightning arresters and all necessary accessories according to the Tenderer’s design, of which voltage drop calculation shall be attached the Tender.
(d) Two-cores aerial bundled conductor (ABC) cables for connection to
householder, watt-hour meters and
(e) Molded circuit-breakers (MCBs) with weather proof box for protection of house
connections (one each for 5 or 6 householders) to be mounted on pole.
7. 380/220 Distribution Facilities including connection and in-house wiring for house holders
1) Distribution Line
(a) 380/220V overhead lines with steel or wooden poles (7m) with accessories , twisted cables of four or two cores (70, 35,16sq.mm) and all necessary accessories according to the Tenderer’s design, of which voltage drop calculation shall be attached the Tender.
(b) Two-cores aerial bundled conductor (ABC) cables for connection to
householder, watt-hour meters and
(c) Molded circuit-breakers (MCBs) with weather proof box for protection of house
connections (one each for 5 or 6 householders) to be mounted on pole.
2) Other Materials to be supplied to house holder
(a) Supply and connection of the in-house connection materials and handing over
of the remaining materials for the distribution line construction.
8. Training of O&M Staff
1) During the installation works of the Plant, the Contractor shall be required to provide the plant operators with on-the-job training by engaging them in the works.
2) After the Plant is in operation, the Contractor shall be required to furnish the qualified engineers to repair the part and instruct plant operators, if requested due to any trouble of the Plant during Defect Liability Period.

Manual for Micro-Hydro Power Development Chapter 6 (ANNEX)
- 6-48 -
The Contractor is requested to fill the following Table with proposed facilities and remarks
MECHANICAL & ELECTRICAL
No Description Unit Q’ty Manufacturer Remark
1 Inlet valve (Butterfly type) 2 Crossflow Turbine a Turbine b Turbine base frame c 3 Electronic Load Controller a b 4 Dummy Load ( a. Air Cooling Heater nos. b. Housing of Ballast unit c. 4 Generator a. Synchronous Generator Stamford unit b. Generator base frame unit c. d. 5 Accessories, Spare parts & Tools unit a b c d e f 6 Set up & Installation ls 7 Transportation & Packaging ls 8 Testing and Trial run ls 9 Commissioning Test ls

Manual for Micro-Hydro Power Development Chapter 6 (ANNEX)
- 6-49 -
Annex. 6.4 Brief Design for Electro-mechanical Equipment of Micro Hydro Power Plant
1. General
Various components of power plant equipment (valve, turbines, controller and generators etc.) are
explained in this “Manual”. Micro hydro power plants for rural electrification should follow the
said approach due to the reason of reliable design data, available manufacturing abilities including
distribution line design considerations, etc. Considering difficult availability of well-trained
operator in rural area and spare parts for future maintenance, all facilities except for small parts
shall be locally manufactured or included in the order as mandatory spare parts.
It is, therefore, recommended to adopt the following Electro-mechanical equipment and facilities
for rural electrification in an isolated grid.
2. Generating Facility
The applicable main machines (turbine and generator) for micro hydro power plant for rural
electrification referring to the present technology and manufacturing capability.
2.1 Turbine
Turbine type : Net head Flow(discharge) Turbine output Generator output:
Cross Flow 4 – 30 m 0.2 – 0.7 m3/s 8 – 85 kW 10 – 75kVA
Reverse pump (PAT) 4 – 20 m 0.04 – 0.13 m3/s 2 – 5 kW 2.5 – 6.5kVA
The final output of generator is the product of Hnet, Q, t, m, & g according to site condition,
however, the turbines outside of above each range, can be applied if the results of calculation is
within acceptable range shown in this “Manual”. Therefore the output shall be calculated in detail
and finally checked referring to this “ Manual”.
In case of reverse pump turbine, the turbine is selected from a pump directly coupled to induction
motor with almost same head and discharge as design condition at site, considering efficiency apex
of the said pump.
Generator
Generator type: Frequency Rotation speed Power factor Required output
Synchronous 50Hz 1500 rpm 0.8 (80%) > kVA (=kW/0.8)*
Induction 50Hz 1500 rpm 0.8 (80%) >kVA(=kW/0.8)**
Note: * In case of synchronous generator, the generator shall be selected from the one with available standard
output (kVA) more than the calculated kW of turbine (turbine output/0.8) with AVR in market.
** In case of induction generator, the induction motor is used an induction generator with additional
capacitors. The one directly coupled with the pump shall be selected as generator because the
separate selection of generator is somewhat difficult due to best efficiency point of turbine.

Manual for Micro-Hydro Power Development Chapter 6 (ANNEX)
- 6-50 -
Table of Brief Selection of Turbine and Generator for MHPP
Euipment Type Applicable range for Indonesian manufacturer
Remarks
1-1 Turbine Cross Flow Water energy(Pw): 8 – 85kW Headnet(Hn): 4 – 30 m Discharge: 200 – 700 l/s Turbine efficiency t: 0.7 Pw= 0.98 x Pw x Hn P= Pw x t Turbine output(P): 5 – 60kW
SKAT T-12, T-13 or T-14 ELC control
1-2 Turbine Reverse pump Water energy(Pw): 3 – 8kW Headnet(Hn) 4 – 20 m Discharge: 40 – 130 l/s Turbine efficiency t: variable to bep of pump & required output of turbine bpf: Best Efficiency Point Pw= 0.98 x Pw x Hn Pt= Pw x t
Turbine output(Pt): 2 – 5kW
Available pump referring to bep (best efficiency point of induction motor) IGC control
2-1 Generator Synchronous Output(Pg) : Available standard output P (kVA)> (Pt x m x g ) / 0.8 Rotation speed: 1500 rpm Frequency: Constant (50Hz) Voltage: Constant by AVR Efficiency: High Power transmitter is usually required
With ELC AVR is furnished on generator itself
2-2 Generator Induction motor Output(Pg): Available standard output P (kVA)> (Pt x m x g ) / 0.8 or standard output of motor for the pump Capacitor: to be added for excitation Rotation speed: 1500 or 1000rpm Frequency: Constant (51-51.5Hz) but not so stable due to load Voltage: Variable without AVR Efficiency: Variable by load Direct coupling is usually applied
With IGC
2.2 Inlet valve
Butterfly valve is recommended to be installed just in front of turbine for safety operation and
maintenance. The diameter shall be not less than diameter of penstock to save head loss.
2.3 Power transmitter facility ( Speed increaser)
In case the rotation speed of turbine and generator are not matched, a power transmitter of belt type
shall be provided .

Manual for Micro-Hydro Power Development Chapter 6 (ANNEX)
- 6-51 -
2.4 Governor with Dummy Load (Ballast)
For micro hydro power plant, dummy load (ballast) type governor shall be selected as load
controller, ELC (for synchronous generator) or IGC (Induction generator) because of easy
maintenance due to electronic type and low cost. In case of air cooling type dummy load, well
ventilated system shall be considered for design of powerhouse.
2.5 Panel for Control, Instrumentation and Protection
Panel for controller (governor), instrumentation, protection and low tension (LT) switchgears shal
be provided for easy operation, monitoring and maintenance.
2.6 380/220V Distribution Line
In case the calculated voltage drop at farthest consumer area by 380/220V line is within 5 %, the
outgoing circuit shall be connected to the LT distribution line.
2.7 20kV Distribution Line
In case the calculated voltage drop at farthest consumer area by 380/220V line is over 5 %, the
outgoing circuit is to be stepped up to 20kV by transformer(s) and connected to 20kV distribution
line through 20kV switchgear. In this case step down transformer is also required near consumer
area.
3. Brief Design Procedure
The approach of brief design shall be made as follows;
1) At first, the suitable location for power plant shall be selected in that area referring the required
power consumption (for example; Total kW =(150W x Number of house holder + Public
use)/1000).
2) According to the survey results of suitable sites, the available data of gross head(m), net
head(m), water flow(l/s) through years and proposed output shall be fixed as civil data.
3) According to the above data in 2), the suitable turbine and generator shall be selected referring
to the above table
4) The necessity of power transmitter shall be checked if the rotation speed of both the turbine
and generator are not same. Usually the belt (V-belt or flat belt) type with proper diameter
pulleys on both turbine and generator is applied for micro hydro power plant
5) The capacity of dummy load (ballast) controlled by ELC or IGC shall be calculated by
following formula.
For 3-phase network: Dummy load (kW) = Generator output (kW) x safety factor (1.2 ~ 1.4)
For single phase network: D. load (kW) = Generator output (kW) x safety factor (1.2 ~ 1.4)
Note: Safety factor is 1.2 for well-ventilated room for air cooling. If not, SF should be
increased to 1.3 or 1.4 according to the cooling condition.

Manual for Micro-Hydro Power Development Chapter 6 (ANNEX)
- 6-52 -
6) The controller of synchronous generator with turbine should be ELC and that for induction
generator should be IGC, which are so far well designed panel including speed control,
instrumentation and protection system as minimum requirement for micro hydro power plant
(MHPP). Therefore, the panel with ELC (for synchronous generator) or IGC (Induction
generator) can be applied without any additional facility for L/T (low tension: 380/220V)
power supply system.
7) For distribution line, at first the voltage drop at farthest house-holder area by L/T line shall be
calculated referring “Manual”. The L/T line can be applied if the voltage drop is within 5 %.
8) If the voltage drop by L/T line becomes more than 5 %, 20kV distribution line shall be applied
for the power supply with step-up and step-down transformers and some protection facilities of
20kV lines, such as fuses, fuse switches, lightning arresters etc. Some switchgears may be
required for large capacity and long line..
9) For distribution line, it is recommended to furnish a weather proof box with single phase MCB
per each 5 – 6 house-holders on line pole for easy future maintenance.
10) For each house, 3 nos. of lamps and 1 no. of outlet respectively with switch shall be wired with
insulated cables as in-house wiring.
4. Recommendation of Main Equipment
The brief design of MHPP is shown and explained in the above chapter for the Client’s
(Purchaser’s or Employer’s) basic design purpose.
It is, however, recommended to take the following careful attention before purchasing the power
plant.
1) Water turbine
Cross Flow turbine shall have enough design data certified by complete model test results,
which shall be attached for evidence to show that the design of turbine is guaranteed for its
performance. The Cross Flow turbine without such evidence should not be accepted.
Reverse pump turbine (PAT) shall be selected the set of pump with induction motor for nearly
same head and discharge. Otherwise, it is difficult to choose the combination of pump and
generator (induction motor) due to somewhat complication of best efficiency point. The reverse
pump turbine is not recommended for the one with variable head and especially discharge.
2) Generator
Synchronous generator shall be selected the one of blush-less type, star winding with AVR
in its housing for high quality and stable electricity and easy maintenance in future.
Induction generator shall be selected from the set of the induction motor of delta winding as set
of pump with nearly same head and discharge.

Manual for Micro-Hydro Power Development Chapter 6 (ANNEX)
- 6-53 -
3) Detailed Design
It is strongly recommended to mention the following sentence clearly in Tender document
and/or Contract document for Client’s clarification, safety operation and future maintenance.
“The Contractor shall conduct all of the detailed design, which include all necessary analyses
with preparation of construction drawings, installation drawings, and others deemed to be
required. The Contractor shall fully be responsible and accountable for the detailed design in its
quality, reliability and safety. Whenever the Client so desires, the Contractor shall be provided
enough explanation to his detailed design.”
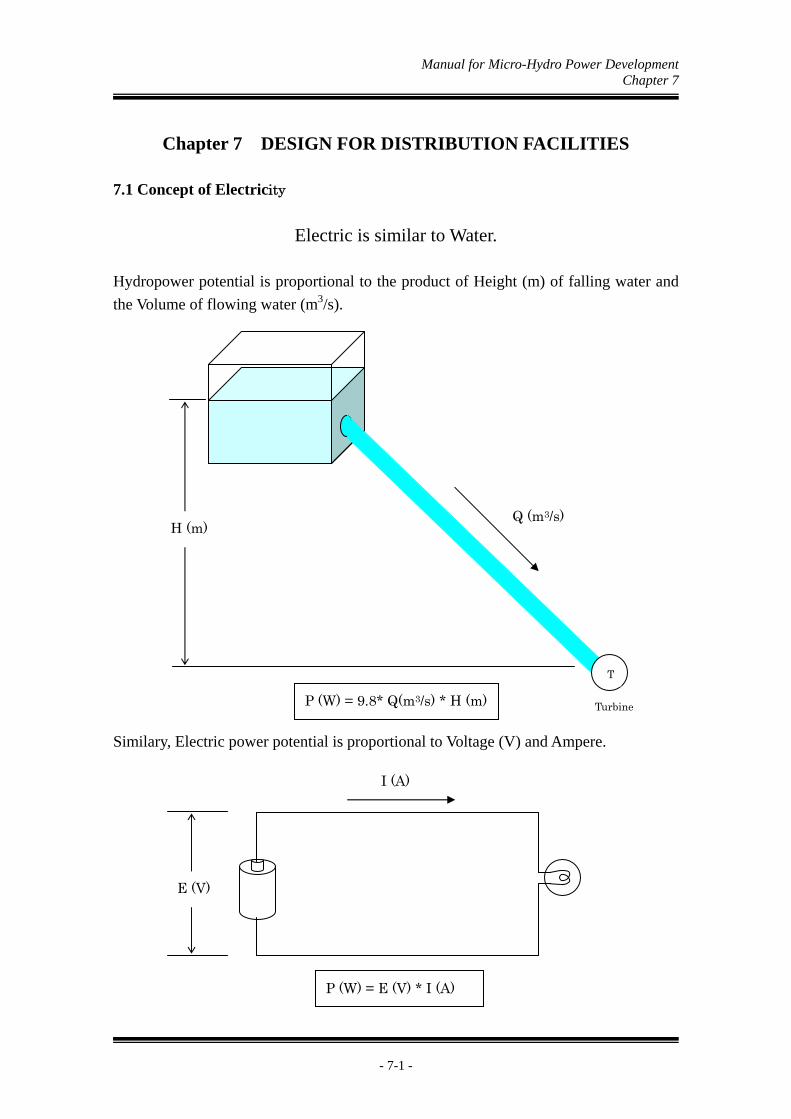
Manual for Micro-Hydro Power Development Chapter 7
- 7-1 -
Chapter 7 DESIGN FOR DISTRIBUTION FACILITIES
7.1 Concept of Electricity
Electric is similar to Water.
Hydropower potential is proportional to the product of Height (m) of falling water and
the Volume of flowing water (m3/s).
Similary, Electric power potential is proportional to Voltage (V) and Ampere.
E (V)
I (A)
P (W) = E (V) * I (A)
H (m) Q (m3/s)
Turbine P (W) = 9.8* Q(m3/s) * H (m)
T

Manual for Micro-Hydro Power Development Chapter 7
- 7-2 -
Thicker is easier to flow.
Thicker is easier to flow, because thicker is less resistance.
Note:
When designing a distribution line in detail, it is recommended to consult licensed
Electrical Engineer.
< Q (m3/s) Q (m3/s)
Pipe
I (A) I (A)
Conductor
<
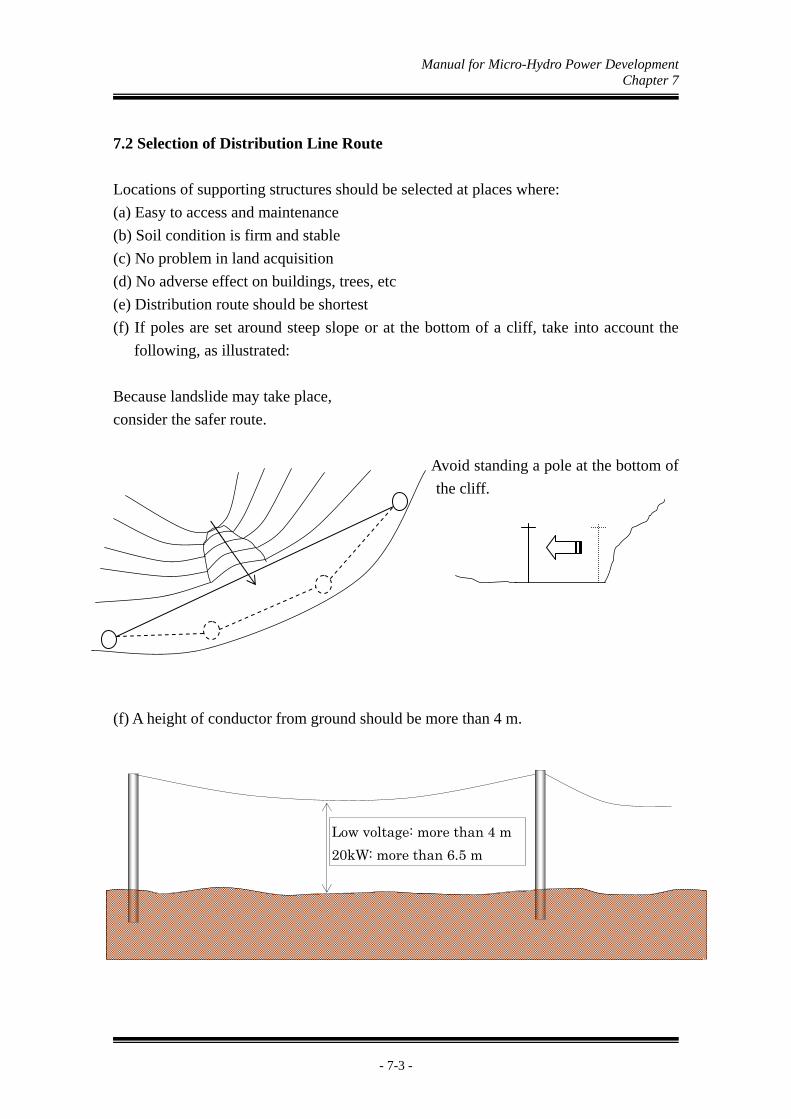
Manual for Micro-Hydro Power Development Chapter 7
- 7-3 -
7.2 Selection of Distribution Line Route
Locations of supporting structures should be selected at places where:
(a) Easy to access and maintenance
(b) Soil condition is firm and stable
(c) No problem in land acquisition
(d) No adverse effect on buildings, trees, etc
(e) Distribution route should be shortest
(f) If poles are set around steep slope or at the bottom of a cliff, take into account the
following, as illustrated:
Because landslide may take place,
consider the safer route.
Avoid standing a pole at the bottom of
the cliff.
(f) A height of conductor from ground should be more than 4 m.
Low voltage: more than 4 m
20kW: more than 6.5 m

Manual for Micro-Hydro Power Development Chapter 7
- 7-4 -
Allowable height
Low voltage: more than 4 m
20kW: more than 6.5 m
Low voltage: more than 4 m
20kW: more than 6.5 m

Manual for Micro-Hydro Power Development Chapter 7
- 7-5 -
7.3 Distribution Facilities
Supporting structures are included such as follows:
(a) Pole (d) Protection
(b) Guy wire (e) Distribution transformer
(c) Conductors and cables (f) House connection

Manual for Micro-Hydro Power Development Chapter 7
- 7-6 -
7.4 Pole
Standard poles for overhead lines are classified as shown in Table 7.4.1:
Priority of use shall be on locally manufactured concrete poles. For concrete poles,
manufacture of longer and stronger poles will be preferred to widen scope of use. To
improve workability in construction and maintenance, the pole design to enable fixing
of step bolts.
Table 7.4.1 Application of Supporting Structures Supporting structures Application Concrete poles Generally applied Wooden poles (including Bamboo poles)
Applied to areas where access of heavy machines is difficult
Steel poles Applied to areas where access of heavy machines is difficult (standard is attached to Ref. 7-1)
Concrete pole Wooden pole Steel pole
7.4.1 Span Length of Poles
The length of the span between distribution line supports is to be determined taking into
account the following:
Recommended Span is 50 m;
Maximum 80 m, for areas outside settlements, areas for rice fields, and open spaces;
Maximum 50 m, for areas within the population settlement.

Manual for Micro-Hydro Power Development Chapter 7
- 7-7 -
7.4.2 Allowable Minimum Clearance of Conductors and Environment
The minimum clearances of conductors above ground will be designed with the
following criteria: Conductor height above
ground 20 kV Low Voltage
Road crossing 6.5 m 4.0 m Along road 6.0 m 4.0 m
Other places 6.0 m 4.0 m
Vertical clearance between 20 kV bare conductor and LV insulated
conductor 0.8 m
Clearance between phases of 20 kV bare conductors 0.8 m
Vertical clearance between 20kV bare conductors 1.0 m
Clearance between LV insulated conductors 0.2 m
7.4.3 Height of Poles
The height of pole is to be determined taking into account the following factors:
(a) Necessary height of the feeder conductors above the ground can be secured under
the largest sag.
(b) Necessary clearance between the feeder conductors and buildings, other electrical
wires or trees can be secured (clearance under maximum sag should be examined).
The recommended height of the supporting structures is as follows:
Table 7.4.2 Recommended height of Supporting Structures Voltage Recommended Support Length 20 kV 9 m
Low Voltage 7 m
(a) The recommended minimum pole setting depth is one sixth of pole length. For
example:
Pole setting depth = Pole length 9m×1/6 = 1.5 m
(b) If soil condition is not stable, the root of pole should be reinforced firmly. Refer to
following pictures:

Manual for Micro-Hydro Power Development Chapter 7
- 7-8 -
7.4.4 Size of Poles
Size of pole is to be determined taking into account the moment on pole by wind load.
The following table shows the relation between size and height of poles each cable size
in case of square shape.
Concrete: 210 kgf/cm2
Reinforcement: SR235, allowable stress is 1400 kgf/cm2, 19 mm2
D0 = size of square on side of pole
Pole span: 50 m cable size:70mm2
length
of pole
height
of pole
maximum
moment by
pole
maximum
moment by
cable
sum of
moment
D0
(cm)
reinforcement
19mm2(pcs) d (cm)
7 m 5.8 m 204 898 1103 20 8 4 for LV
9 m 7.5 m 388 1155 1543 23 8 4 for 20kV
cable size:35mm2
length
of pole
height
of pole
maximum
moment by
pole
maximum
moment by
cable
sum of
moment
D0 reinforcement
19mm2(pcs) d (cm)
7 m 5.8 m 184 583 767 18 8 4 for LV
9 m 7.5 m 338 750 1088 20 8 4 for 20kV
cable size: 16mm2
length
of pole
height
of pole
maximum
moment by
pole
maximum
moment by
cable
sum of
moment
D0 reinforcement
19mm2(pcs) d (cm)
7 m 5.8 m 174 519 693 17 8 4 for LV
9 m 7.5 m 338 668 1005 20 8 4 for 20kV
D0
reinforcement
d
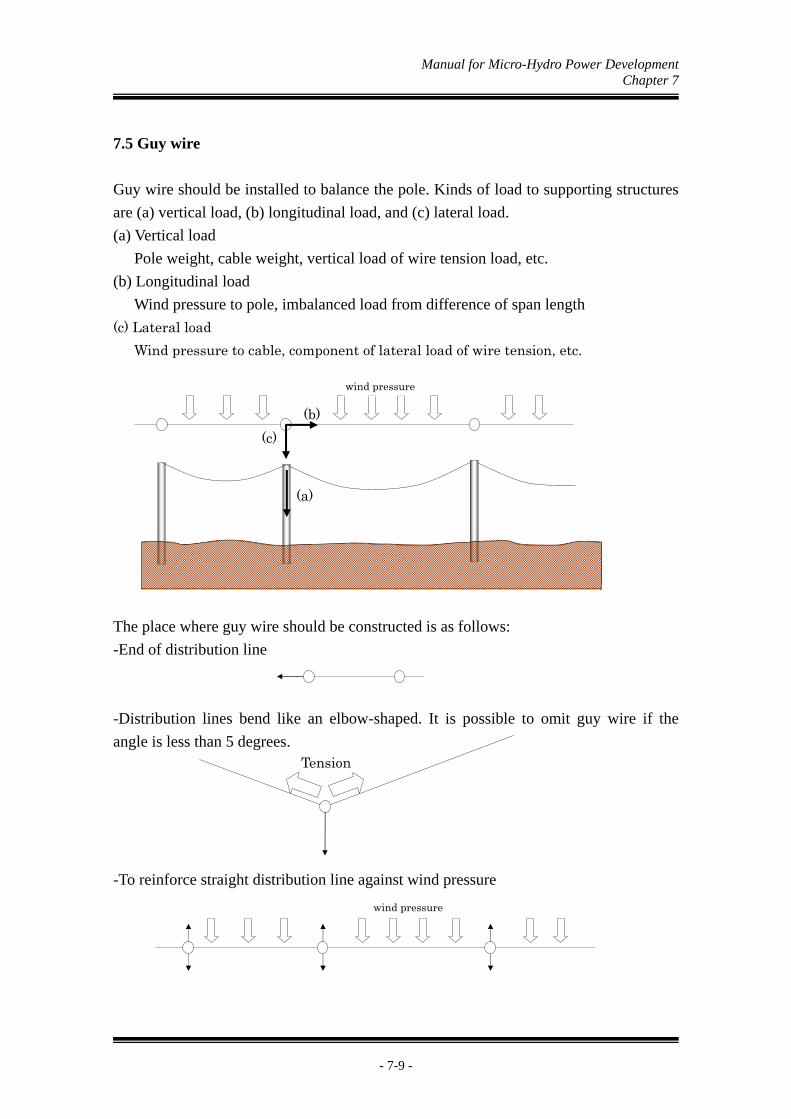
Manual for Micro-Hydro Power Development Chapter 7
- 7-9 -
7.5 Guy wire
Guy wire should be installed to balance the pole. Kinds of load to supporting structures
are (a) vertical load, (b) longitudinal load, and (c) lateral load.
(a) Vertical load
Pole weight, cable weight, vertical load of wire tension load, etc.
(b) Longitudinal load
Wind pressure to pole, imbalanced load from difference of span length
(c) Lateral load
Wind pressure to cable, component of lateral load of wire tension, etc.
The place where guy wire should be constructed is as follows:
-End of distribution line
-Distribution lines bend like an elbow-shaped. It is possible to omit guy wire if the
angle is less than 5 degrees.
-To reinforce straight distribution line against wind pressure
Tension
(a)
(c)
(b)
wind pressure
wind pressure
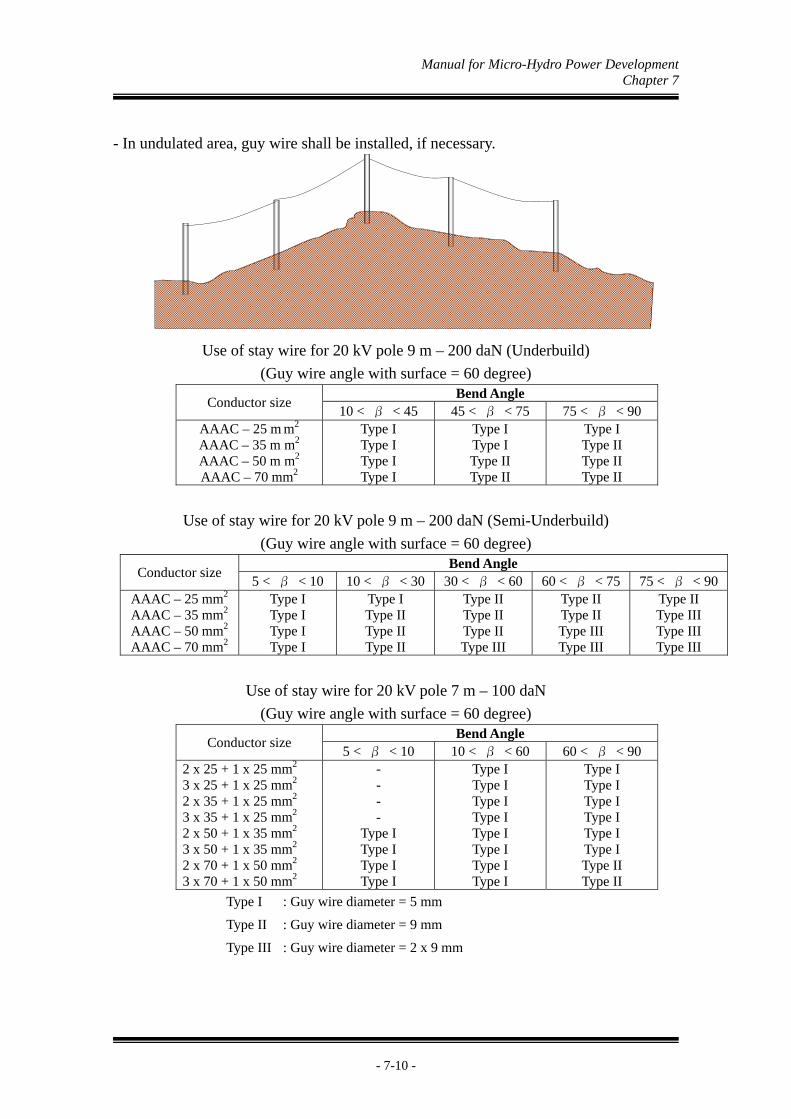
Manual for Micro-Hydro Power Development Chapter 7
- 7-10 -
- In undulated area, guy wire shall be installed, if necessary.
Use of stay wire for 20 kV pole 9 m – 200 daN (Underbuild)
(Guy wire angle with surface = 60 degree) Bend Angle
Conductor size 10 < β < 45 45 < β < 75 75 < β < 90
AAAC – 25 m m2 AAAC – 35 m m2 AAAC – 50 m m2 AAAC – 70 mm2
Type I Type I Type I Type I
Type I Type I Type II Type II
Type I Type II Type II Type II
Use of stay wire for 20 kV pole 9 m – 200 daN (Semi-Underbuild)
(Guy wire angle with surface = 60 degree) Bend Angle
Conductor size 5 < β < 10 10 < β < 30 30 < β < 60 60 < β < 75 75 < β < 90
AAAC – 25 mm2 AAAC – 35 mm2 AAAC – 50 mm2 AAAC – 70 mm2
Type I Type I Type I Type I
Type I Type II Type II Type II
Type II Type II Type II Type III
Type II Type II Type III Type III
Type II Type III Type III Type III
Use of stay wire for 20 kV pole 7 m – 100 daN
(Guy wire angle with surface = 60 degree) Bend Angle
Conductor size 5 < β < 10 10 < β < 60 60 < β < 90
2 x 25 + 1 x 25 mm2 3 x 25 + 1 x 25 mm2 2 x 35 + 1 x 25 mm2 3 x 35 + 1 x 25 mm2 2 x 50 + 1 x 35 mm2 3 x 50 + 1 x 35 mm2 2 x 70 + 1 x 50 mm2 3 x 70 + 1 x 50 mm2
- - - -
Type I Type I Type I Type I
Type I Type I Type I Type I Type I Type I Type I Type I
Type I Type I Type I Type I Type I Type I Type II Type II
Type I : Guy wire diameter = 5 mm
Type II : Guy wire diameter = 9 mm
Type III : Guy wire diameter = 2 x 9 mm
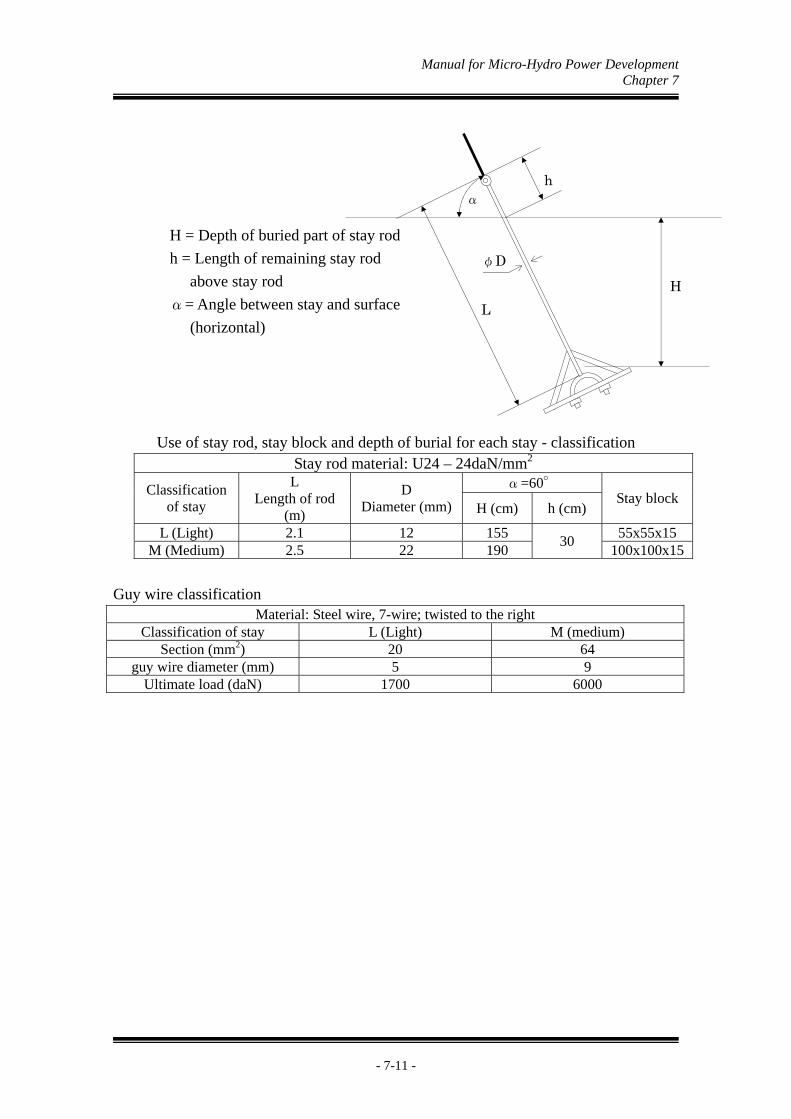
Manual for Micro-Hydro Power Development Chapter 7
- 7-11 -
H = Depth of buried part of stay rod
h = Length of remaining stay rod
above stay rod
α= Angle between stay and surface
(horizontal)
Use of stay rod, stay block and depth of burial for each stay - classification Stay rod material: U24 – 24daN/mm2
α=60° Classification of stay
L Length of rod
(m)
D Diameter (mm) H (cm) h (cm)
Stay block
L (Light) 2.1 12 155 55x55x15 M (Medium) 2.5 22 190
30 100x100x15
Guy wire classification Material: Steel wire, 7-wire; twisted to the right
Classification of stay L (Light) M (medium) Section (mm2) 20 64
guy wire diameter (mm) 5 9 Ultimate load (daN) 1700 6000
α
h
L
φD
H

Manual for Micro-Hydro Power Development Chapter 7
- 7-12 -
7.6 Conductors and Cables
7.6.1 Advantages/Disadvantages of Conductors and Cables
The feature of conductor and cable is shown at following table Advantages Disadvantages
conductors - cheap - easy to connect each conductor
- not safety
cables - safety - able to lay underground
- expensive - difficult to connect each cable
7.6.2 Sizes of Conductors
Sized of conductors should be selected taking into account amount of present load,
forecasted load, short-circuit current, current capacity of conductors, voltage drop,
power loss, mechanical strength, etc. Too many sizes shall not be used for branch
feeders.
7.6.3 Allowable Sag of Conductors
Conductors sag is to be determined taking into account the allowable conductor tension,
strength of the supporting structures, wind load on conductors, etc. Conductors sag is
needed to be keep the height above ground as following table: Conductor height above ground 20 kV Low Voltage
Road crossing 6.5 m 4.0 m Along road 6.0 m 4.0 m Other places 6.0 m 4.0 m
7.6.4 Allowable Load per Phase
3-phase distribution lines are needed to keep the load balanced. If the unbalance load
become more 20%, instruments receive a bad influence.
7.6.5 Application of 3-Phase Line
To avoid above things, it is desirable that 3-phases distribution line is expanded to
villages of demand. If it is not possible to do because of the cost, we need to give
attention to keep the balanced load.

Manual for Micro-Hydro Power Development Chapter 7
- 7-13 -
7.7 Distribution Transformers
In case 20kV distribution line is required instead of 380/220V line due to long distance
from power station to consumers with the reason of sending capacity, voltage drop etc.,
some step-up and step-down transformers shall be installed. The connection of both
step-up and step-down is completely similar. Step-up transformer is installed at power
station side for step-up from 380/220V to 20/11.5kV and step-down transformer is
installed at consumer’s area for step-down and vice versa.
7.7.1 Types of Distribution Transformer
Distribution transformers are classified into the type of insulation, as follows:
Oil immersed transformer: Windings are immersed in insulation oil in tank and
cheaper.
Dry type transformer: Windings insulated with heat-resisting epoxy (H-class)
without tank but expensive.
Distribution transformers are classified into two kinds by winding method as follows
Three-phase transformer: λ - λ connection Suitable for grounding of neutral point
Δ- λ connection
Δ-Δconnection
Note: Δ; Delta connection λ; Star connection
Single phase transformer: Usually used for voltage step-down from 20/11.5kV to
220V near consumer’s area.
Single phase transformer can be also used both star and delta connection by outside
connection with combination of 3 nos. transformers
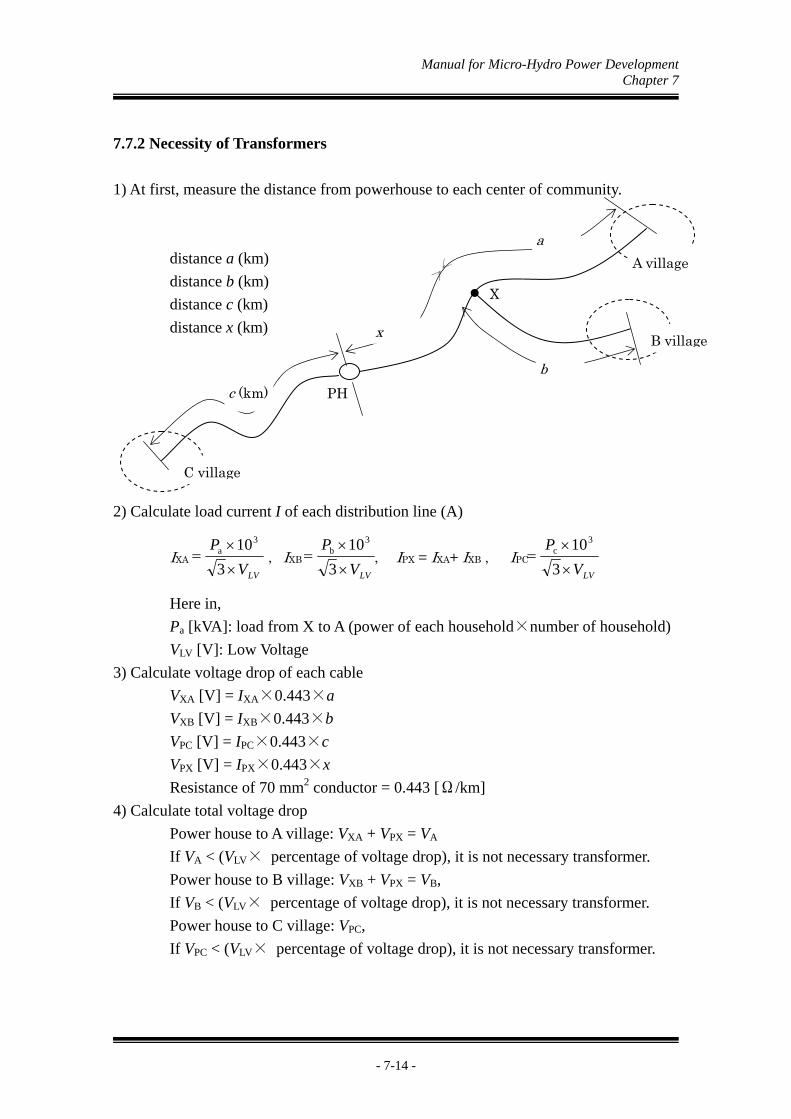
Manual for Micro-Hydro Power Development Chapter 7
- 7-14 -
7.7.2 Necessity of Transformers
1) At first, measure the distance from powerhouse to each center of community.
distance a (km)
distance b (km)
distance c (km)
distance x (km)
2) Calculate load current I of each distribution line (A)
IXA , IXB , IPX = IXA+ IXB , IPC
Here in,
Pa [kVA]: load from X to A (power of each household×number of household)
VLV [V]: Low Voltage
3) Calculate voltage drop of each cable
VXA [V] = IXA×0.443×a
VXB [V] = IXB×0.443×b
VPC [V] = IPC×0.443×c
VPX [V] = IPX×0.443×x
Resistance of 70 mm2 conductor = 0.443 [Ω/km]
4) Calculate total voltage drop
Power house to A village: VXA + VPX = VA
If VA < (VLV× percentage of voltage drop), it is not necessary transformer.
Power house to B village: VXB + VPX = VB,
If VB < (VLV× percentage of voltage drop), it is not necessary transformer.
Power house to C village: VPC,
If VPC < (VLV× percentage of voltage drop), it is not necessary transformer.
PH
X
c (km)
A village
B village
C village
a
b
x
LVV
P
3
103a
LVV
P
3
103b
LVV
P
3
103c
Manual for Micro-Hydro Power Development Chapter 7
- 7-15 -
7.7.3 Application of Distribution Transformers
Step-up and step-down distribution transformers shall be of three-phase construction,
and their standard capacities are as follows:
5 kVA, 10 kVA, 16 kVA, 25 kVA, and 50 kVA
7.7.4 Selection of Unit Capacity
Capacity of transformer should be decided 125 % (= 100 % / 80 %) of the capacity of
generator, If the power factor is 80 %. The maximum loading is 100%, and over loading
shall not be allowed so as to impair life of transformers. The transformers tend to be
used long time till their breakdown without regular maintenance. Following table shows
the relation between capacity of transformer and generator.
Table 7.7.1 Relation between capacity of transformer and generator Capacity of Transformer
5 kVA 10 kVA 16 kVA 25kVA 50kVA
Capacity of generator
-4 kW 4 kW – 8 kW
8 kW – 12.8 kW
12.8kW – 20 kW
20kW - 40 kW
Before deciding the unit capacity of new transformers, the supply area of new
transformers is to be determined taking into account the followings:
(a) Supply area of new transformers shall not overlap with that of other transformers
supplied from other feeders.
(b) Supply area of each transformer must be independent.
(c) Voltage drop restriction should be satisfied at any part of the supply area.
The capacity of new transformers should be determined taking into account the
expected demand growth of the area, however the smallest capacity that satisfies present
demand in the area is generally applied.
7.7.5 Location
Step-up transformers shall be located near the powerhouse. Step-down transformers
shall be located in or close to the load center of the area. In deciding the final location to
install transformer, the following conditions should also be examined:
(a) Easy to access and replacement works.
(b) To be separated from other buildings or trees with enough clearance.
(c) For pole mounted type, pole assembly shall not be complicate.
(d) Ground mounted type structures shall be constructed so as to avoid troubles with
public.

Manual for Micro-Hydro Power Development Chapter 7
- 7-16 -
7.8 House Connection (HC)
7.8.1 Application of House Connection
For HC, copper core or aluminum core twisted cable will be used.
The sizes of the copper core are: 4 mm2; 6 mm2; 10 mm2; 16 mm2; 25 mm2
The sizes of the aluminum core are: 10 mm2; 16 mm2; 25 mm2; 35 mm2
It is preferred not to use a roof pole with the customers entrance line placed as such that
it can be seen from the outside. The use of a roof pole is only to serve the connection
from house to house or a house that is not situated on the same side of the street with the
LVL, so that a roof pole is needed.
The minimum clearance is 3 m for compounds, 4 m for public road, if the height of the
house is less than 3 m, a roof pole will be used as such that requirement for clearance is
met.
However, if by using a roof pole it appears that the minimum clearance is not met, a
supporting pole should be used for such house connection.
The wires of the smallest sectional area shall be used from the following considerations:
(a) Capacity of the wire is sufficient to carry peak load current
(b) Voltage drop criterion is satisfied.
The Maximum voltage drop calculated for HC is as follows:
- For HC tapped from LV, the maximum voltage drop for HC is 2 %.
- For HC tapped directly from the transformer, the maximum voltage drop for HC is 12 %.
The house connection span is as following table. From roof pole to roof
pole From LVL pole to roof pole crossing the village road
From LVL pole directly to house crossing the village roadSection
(mm2) A (m) T (daN) S (m) a (m) T (daN) S (m) a (m) T (daN) S (m)
10 16 25
40 35 35
38 42 63
0.78 0.84 0.84
58 47 47
38 42 63
1.66 1.49 1.49
49 40 40
38 42 63
1.18 1.11 1.11
in which : a = span length (m)
S = sag (m)
T = pull/tension (daN)
Assumption: Wind intensity = 40 daN/m2
Strength of roof pole: 76 daN
Factor of cable shape with regard to wind = 0.6
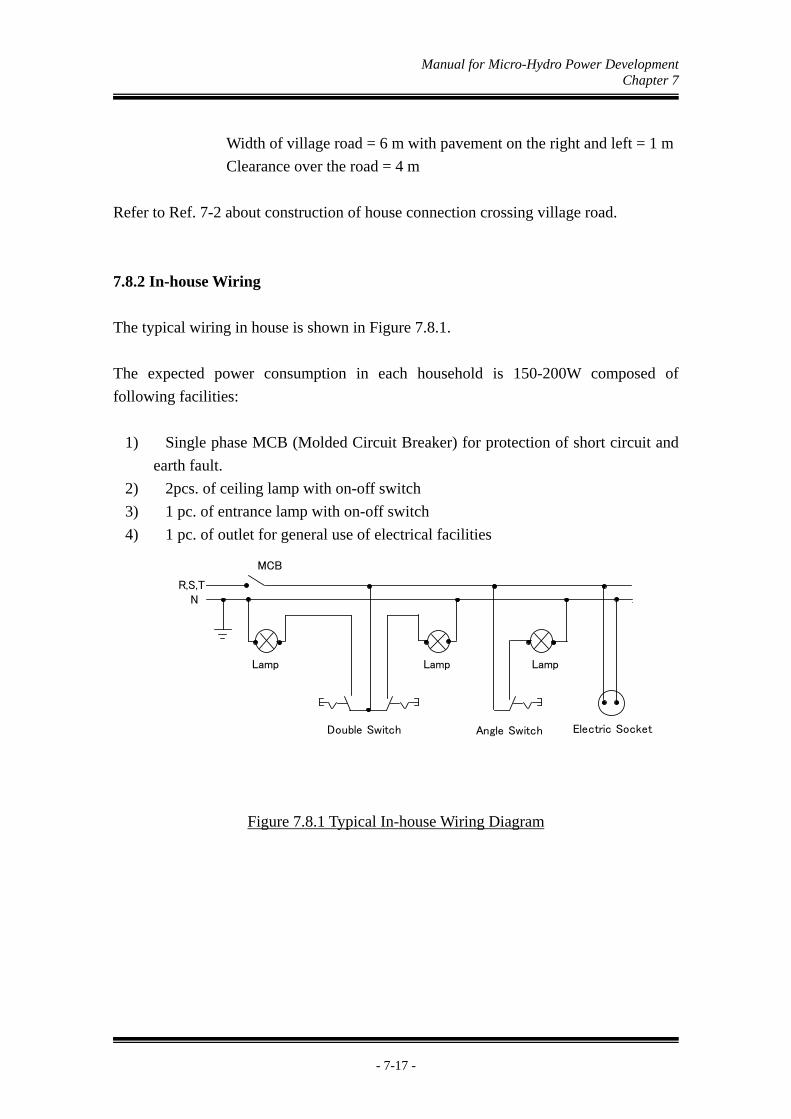
Manual for Micro-Hydro Power Development Chapter 7
- 7-17 -
Width of village road = 6 m with pavement on the right and left = 1 m
Clearance over the road = 4 m
Refer to Ref. 7-2 about construction of house connection crossing village road.
7.8.2 In-house Wiring
The typical wiring in house is shown in Figure 7.8.1.
The expected power consumption in each household is 150-200W composed of
following facilities:
1) Single phase MCB (Molded Circuit Breaker) for protection of short circuit and
earth fault.
2) 2pcs. of ceiling lamp with on-off switch
3) 1 pc. of entrance lamp with on-off switch
4) 1 pc. of outlet for general use of electrical facilities
Figure 7.8.1 Typical In-house Wiring Diagram
R,S,TN
MCB
Lamp
Double Switch Angle Switch Electric Socket
Lamp Lamp

Manual for Micro-Hydro Power Development Chapter 7 (Reference)
- 7-18 -
[Ref. 7-1 Standard of Steel Poles]
Work Load (daN) 100
A 89.1 B 114.3
Diameter of pole sections (mm)
C 139.8 A 3.2 B 3.5
Pipe thickness (mm)
C 4.5 Diffraction at work load (mm)
96
Cartridge thickness (mm) 5 Cartridge length (mm) 600
4,000
1,500
1,500 A
B
C
1,160
300
100
E : Welded part
F : Sock-pen
G : Holding plate
G
F
E

Manual for Micro-Hydro Power Development Chapter 7 (Reference)
- 7-19 -
[Ref. 7-2 Construction of house connection crossing village road]

Manual for Micro-Hydro Power Development Chapter 7 (Reference)
- 7-20 -
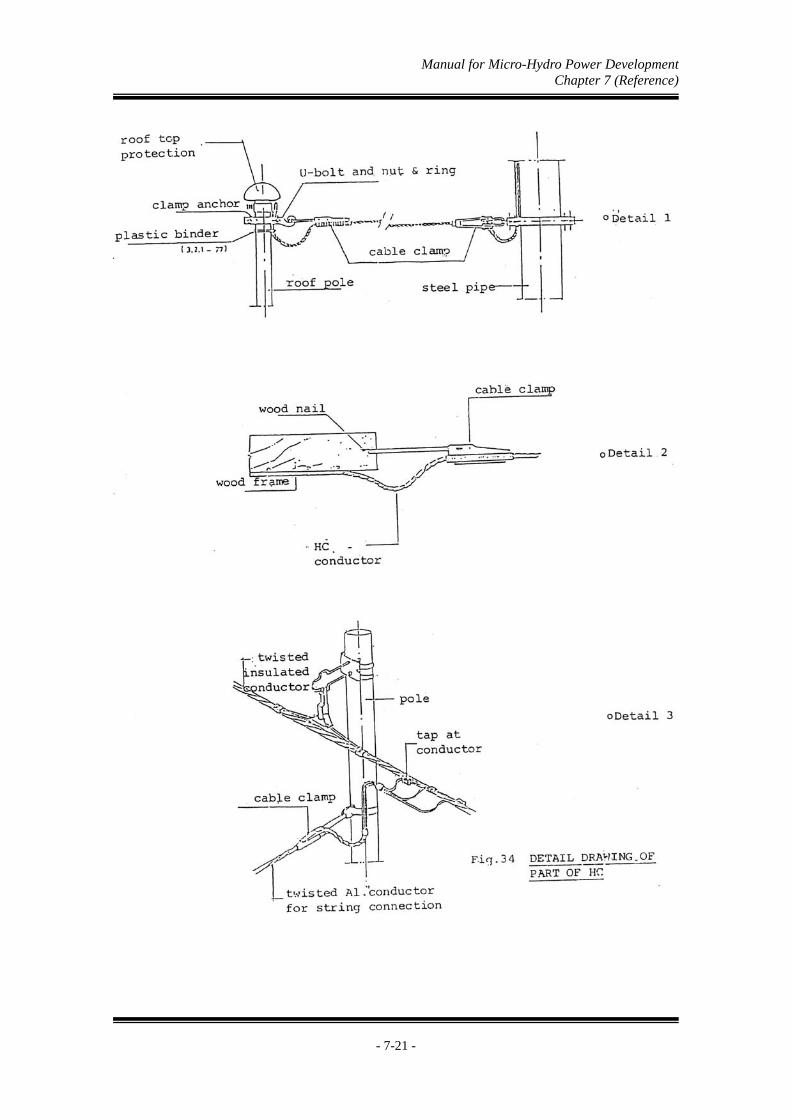
Manual for Micro-Hydro Power Development Chapter 7 (Reference)
- 7-21 -

Manual for Micro-Hydro Power Development Chapter 8
- 8-1 -
Chapter 8 PROJECT COST ESTIMATION
8.1 Rough Cost Estimation During Planning Stage
When you are going to make a trial calculation of construction cost in Planning Stage, it
can be calculated by the method shown in Table 8.1.2. However, before calculating, it is
necessary to carry out a field survey for confirmation and decide the item mentioned to Table
8.1.1.
Table8.1.1 Items to make a trial calculate of construction cost
Description Item Plan Maximum Out Put (kW) Turbine Discharge (m3/s) Effective Head (m) Intake Facilities Height of Dam (m) Length of Dam (m) Headrace Length of Headrace (m) Penstock Diameter of Penstock (m) Distribution Number of Households (kk) Distance to the most far house from P.S
In addition, indirect costs, such as Tax, Contractor Fee, Design Cost, and Supervisor, are
contained in the cost of construction calculated by Fig 8.1.2. When part of these indirect costs
can be omitted explanation is required separately.
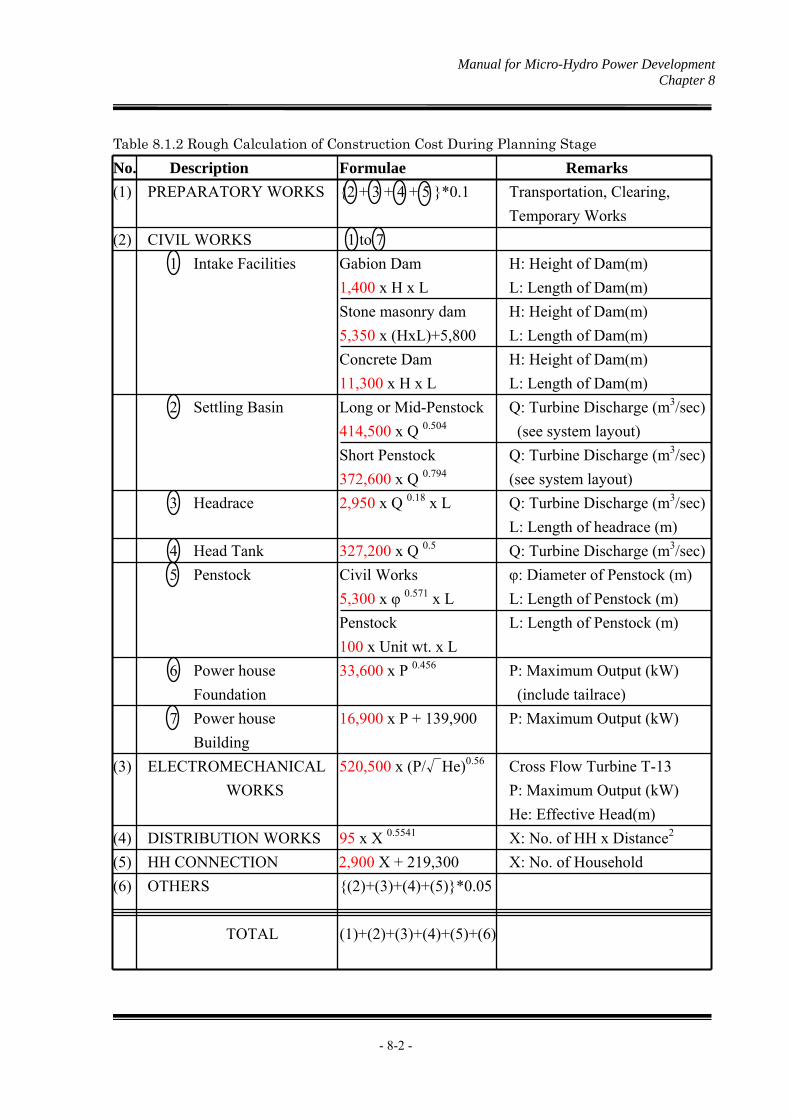
Manual for Micro-Hydro Power Development Chapter 8
- 8-2 -
Table 8.1.2 Rough Calculation of Construction Cost During Planning Stage
No. Description Formulae Remarks
(1) PREPARATORY WORKS {2 + 3 + 4 + 5 }*0.1 Transportation, Clearing,
Temporary Works
(2) CIVIL WORKS 1 to 7
1 Intake Facilities Gabion Dam H: Height of Dam(m)
1,400 x H x L L: Length of Dam(m)
Stone masonry dam H: Height of Dam(m)
5,350 x (HxL)+5,800 L: Length of Dam(m)
Concrete Dam H: Height of Dam(m)
11,300 x H x L L: Length of Dam(m)
2 Settling Basin Long or Mid-Penstock Q: Turbine Discharge (m3/sec)
414,500 x Q 0.504 (see system layout)
Short Penstock Q: Turbine Discharge (m3/sec)
372,600 x Q 0.794 (see system layout)
3 Headrace 2,950 x Q 0.18 x L Q: Turbine Discharge (m3/sec)
L: Length of headrace (m)
4 Head Tank 327,200 x Q 0.5 Q: Turbine Discharge (m3/sec)
5 Penstock Civil Works φ: Diameter of Penstock (m)
5,300 x φ 0.571 x L L: Length of Penstock (m)
Penstock L: Length of Penstock (m)
100 x Unit wt. x L
6 Power house 33,600 x P 0.456 P: Maximum Output (kW)
Foundation (include tailrace)
7 Power house 16,900 x P + 139,900 P: Maximum Output (kW)
Building
(3) ELECTROMECHANICAL 520,500 x (P/√He)0.56 Cross Flow Turbine T-13
WORKS P: Maximum Output (kW)
He: Effective Head(m)
(4) DISTRIBUTION WORKS 95 x X 0.5541 X: No. of HH x Distance2
(5) HH CONNECTION 2,900 X + 219,300 X: No. of Household
(6) OTHERS {(2)+(3)+(4)+(5)}*0.05
TOTAL (1)+(2)+(3)+(4)+(5)+(6)

Manual for Micro-Hydro Power Development Chapter 8
- 8-3 -
8.2 Cost Estimation During Detail Design Stage
Construction cost consists of items as shown in Table 8.2.1.
8.2.1 Items
Typical items of a direct cost are the following.
(1) Preparatory Works Preparatory Works consist of item as follows. - Location Setting Out - Filling and Measurement - Equipment & Materials Mobilization
(2) Civil Works
Civil Works consist of item as follows. - Intake facilities - Settling basin - Headrace - Head tank - Spillway - Penstock and Foundation - Powerhouse base - Tailrace - Power house building - Finishing
(3) Electro-Mechanical Works Electro-Mechanical Works consist of item as follows.
- Turbine - Controller - Dummy load - Generator - Accessories, Spare parts and Tools - Set up and Installation

Manual for Micro-Hydro Power Development Chapter 8
- 8-4 -
- Transportation and Packing - Testing - Pre commissioning Trial Run
(4) Distribution Works
Distribution Works consist of item as follows. - Transmission pole - Cable - Transformer - Accessories
(5) Consumer Connection
- Cable - Switch - Accessories
Table 8.2.1 Construction Cost
No. Item Cost
Direct cost of construction
1 PREPARATORY WORKS Addition item
2 CIVIL WORKS Addition item
3 ELECTRO-MECHANICAL WORKS Addition item
4 DISTRIBUTION WORKS Addition item
5 CONSUMER CONNECTION Addition item
SUB TOTAL(A)
Indirect cost
1 DESIGN FEE 5~10% of SUB TOTAL(A)
2 SUPERVISOR FEE 5~10% of SUB TOTAL(A)
3 MANAGEMENT FEE 5~10% of SUB TOTAL(A)
4 TAX 12.5% of SUB TOTAL(A)
SUB TOTAL(B)
TOTAL

Manual for Micro-Hydro Power Development Chapter 8
- 8-5 -
8.2.2 Quantity
In order to calculate the direct cost of construction, it is necessary to calculate the quantity for
every work or material based on the design. For example, in case of Headrace made of stone
masonry, quantities of excavation, foundation rubble stone, stone masonry, backfill, and
plastering, as illustrated in Figure 8.2.1 below, shall be estimated.
Fig 8.2.1 The example of works that should be estimated(Headrace)
Naturally, these items change according to the type and the quality of structure. For example,
in Intake, the items that should be calculated is in accordance with the type of Dam as shown
in Table 8.2.2. And in Headrace, the item which should calculate will be changed according to
the quality of the material of Headrace like Table 8.2.3.
Excavation
Foundation Rubble Stone
Stone Masonry Backfill Plaster

Manual for Micro-Hydro Power Development Chapter 8
- 8-6 -
Table 8.2.2 Quantity of Dam
Gabion Dam Masonry Dam Concrete Dam - Excavation (m3) - Backfill (m3) - Gabion (m3)
- Excavation (m3) - Backfill (m3) - Foundation Rubble
Stone (m3) - Stone Masonry (m3) - Plaster (m2) - Stoplog (m2) - Gabion (m3)
- Excavation (m3) - Backfill (m3) - Sand filling (m3) - Concrete (m3) - Plaster (m2) - Stoplog (m2) - Gabion (m3)
Table 8.2.3 Quantity of Headrace
Simple earth channel Masonry channel Concrete channel - Excavation (m3) - Excavation (m3)
- Backfill (m3) - Foundation Rubble
Stone (m3) - Stone Masonry (m3) - Plaster (m2)
- Excavation (m3) - Backfill (m3) - Sand filling (m3) - Concrete (m3) - Plaster (m2)
8.2.3 Unit Cost
Table 8.2.4 is the standard unit cost per work item of civil work of a project in certain area.
Since unit cost differs according to various regions in which the project is located, it is
advisable to leave the unit cost per work item blank to be filled up with the prevailing costs in
the area.

Manual for Micro-Hydro Power Development Chapter 8
- 8-7 -
Table 8.2.4 Unit Cost per work item
Unit 1 m3
Unskilled Labor man-day 0.625 0 0Foreman man-day 0.062 0 119Tools ls 1.000 4
Sub Total 123Tax for Labor 12 10% of Labor CostOthers 8
Total 143Unit Cost/m3 143
Unit 5.000 m2
Unskilled Labor man-day 1.125 0 0Skilled Labor man-day 0.563 0 0Foreman man-day 0.056 0 0Sand m3 0.400 100 40 Stone m3 1.200 100 120Tools ls 1.000 5
Sub Total 165Tax for Labor 0 10% of Labor CostOthers 4
Total 169
Unit Cost/m2 34 Total/5m3
Unit 1 m3
Unskilled Labor man-day 2.250 0 0Skilled Labor man-day 1.125 0 0Mason man-day 0.113 0 0Foreman man-day 0.017 0 0Rubbles m3 1.000 100 100Sand and Gravel (mix) m3 0.380 100 38Portland Cement bags 3.520 200 704Hauling ls 84 10% of Material CostTools ls 1.000 28
Sub Total 954Tax for Labor 0 10% of Labor CostOthers 34
Total 988Unit Cost/m3 988
Work Item Unit
(1) Excavation
Coefficient Price Unit Cost Remark
(2) Foundation Rubble Stone (T=20cm)
Work Item Unit Coefficient Price Unit Cost Remark
(3) Stone Masonry 1:2 (Intake Weir)
Work Item Unit Coefficient Price Unit Cost Remark
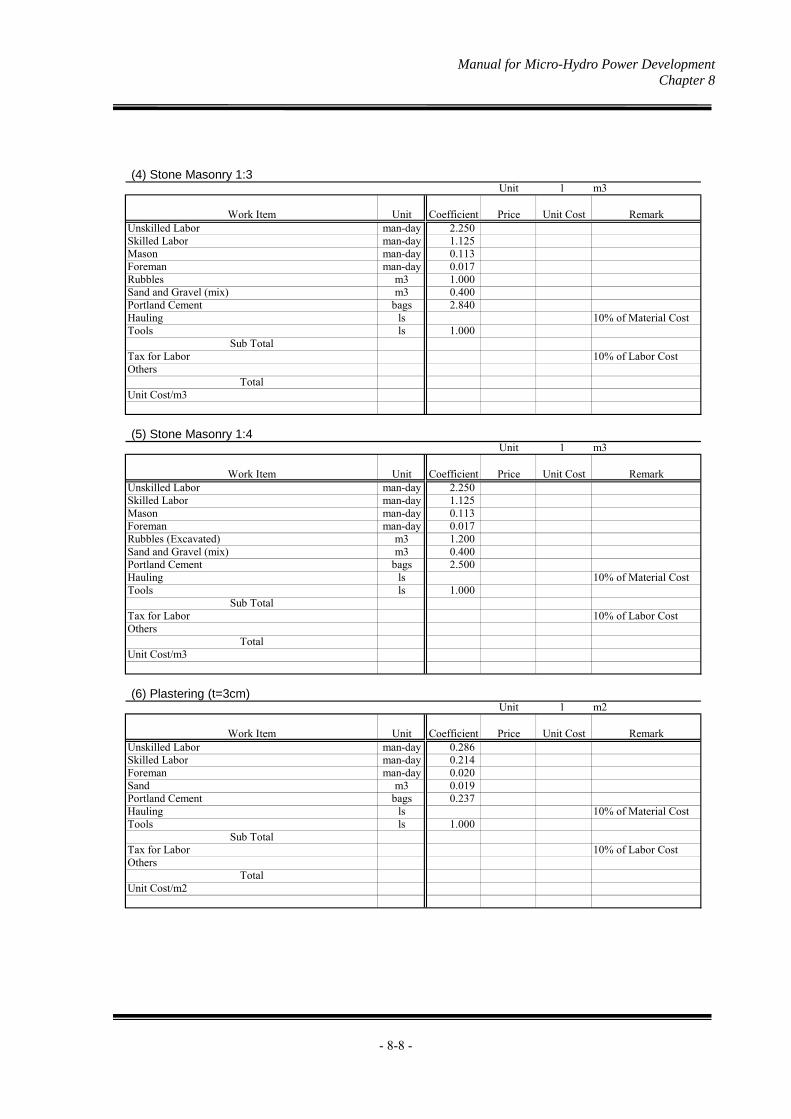
Manual for Micro-Hydro Power Development Chapter 8
- 8-8 -
Unit 1 m3
Unskilled Labor man-day 2.250 0 0Skilled Labor man-day 1.125 0 0Mason man-day 0.113 0 0Foreman man-day 0.017 0 0Rubbles m3 1.000 100 100Sand and Gravel (mix) m3 0.400 100 40Portland Cement bags 2.840 200 568Hauling ls 71 10% of Material CostTools ls 1.000 23
Sub Total 802Tax for Labor 0 10% of Labor CostOthers 16
Total 818Unit Cost/m3 818
Unit 1 m3
Unskilled Labor man-day 2.250 0 0Skilled Labor man-day 1.125 0 0Mason man-day 0.113 0 0Foreman man-day 0.017 0 0Rubbles (Excavated) m3 1.200 100 120Sand and Gravel (mix) m3 0.400 100 40Portland Cement bags 2.500 200 500Hauling ls 66 10% of Material CostTools ls 1.000 22
Sub Total 748Tax for Labor 0 10% of Labor CostOthers 20
Total 768Unit Cost/m3 768
Unit 1 m2
Unskilled Labor man-day 0.286 0 0Skilled Labor man-day 0.214 0 0Foreman man-day 0.020 0 0Sand m3 0.019 100 2Portland Cement bags 0.237 200 47Hauling ls 5 10% of Material CostTools ls 1.000 2
Sub Total 56Tax for Labor 0 10% of Labor CostOthers 13
Total 69Unit Cost/m2 69
(4) Stone Masonry 1:3
Work Item Unit Coefficient Price Unit Cost Remark
(5) Stone Masonry 1:4
Work Item Unit Coefficient Price Unit Cost Remark
(6) Plastering (t=3cm)
Work Item Unit Coefficient Price Unit Cost Remark

Manual for Micro-Hydro Power Development Chapter 8
- 8-9 -
Unit 1 m3
Unskilled Labor man-day 0.450 0 0Skilled Labor man-day 0.200 0 0Foreman man-day 0.020 0 0Rubbles m3 1.200 100 120Wire Cage kg 3.500 200 700Hauling ls 82 10% of Material CostTools ls 1.000 27
Sub Total 929Tax for Labor 0 10% of Labor CostOthers 18
Total 947Unit Cost/m3 947
Unit 10 m3
Unskilled Labor man-day 25.000 0 0Skilled Labor man-day 2.500 0 0Foreman man-day 1.110 0 0Portland Cement bags 75.000 200 15,000Sand m3 4.900 100 490Gravel m3 8.100 100 810Hauling ls 1,630 10% of Material CostTools ls 1.000 538
Sub Total 18,468Tax for Labor 0 10% of Labor CostOthers 83
Total 18,551Unit Cost/m3 1,855
Unit 1,000 kg
Labor Steel man man-day 12.000 0 0Foreman Steel man man-day 1.200 0 0Steel Bar kg 1000.000 47 47,000Tie Wire kg 20.000 60 1,200Hauling ls 4,820 10% of Material CostTools ls 1.000 1,591
Sub Total 54,611Tax for Labor 0 10% of Labor CostOthers 847
Total 55,458Unit Cost/kg 55
(7) Gabion
Work Item Unit Coefficient Price Unit Cost Remark
(8) Concrete
Work Item Unit Coefficient Price Unit Cost Remark
(9) Reinforce Bar
Work Item Unit Coefficient Price Unit Cost Remark
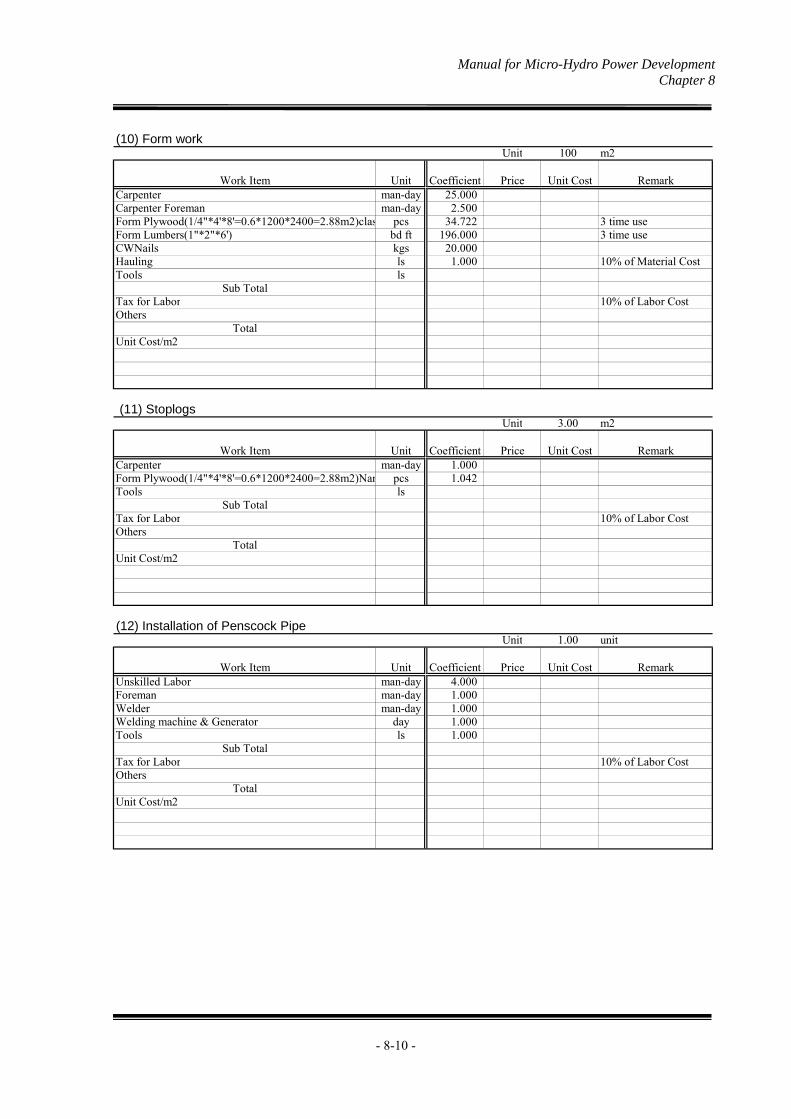
Manual for Micro-Hydro Power Development Chapter 8
- 8-10 -
Unit 100 m2
Carpenter man-day 25.000 0 0Carpenter Foreman man-day 2.500 0 0Form Plywood(1/4"*4'*8'=0.6*1200*2400=2.88m2)clas pcs 34.722 113 3,935 3 time useForm Lumbers(1"*2"*6') bd ft 196.000 12 2,287 3 time useCWNails kgs 20.000 60 200 Hauling ls 1.000 642 10% of Material CostTools ls 212
Sub Total 7,276Tax for Labor 0 10% of Labor CostOthers 79
Total 7,355Unit Cost/m2 74
Unit 3.00 m2
Carpenter man-day 1.000 0 0Form Plywood(1/4"*4'*8'=0.6*1200*2400=2.88m2)Nar pcs 1.042 540 563Tools ls 17
Sub Total 579Tax for Labor 70 10% of Labor CostOthers 26
Total 675Unit Cost/m2 225
Unit 1.00 unit
Unskilled Labor man-day 4.000 0 0Foreman man-day 1.000 0 0Welder man-day 1.000 0 0Welding machine & Generator day 1.000 1500 1,500Tools ls 1.000 45
Sub Total 1,545Tax for Labor 0 10% of Labor CostOthers 90
Total 1,635Unit Cost/m2 1,635
(12) Installation of Penscock Pipe
Work Item Unit Coefficient Price Unit Cost Remark
(11) Stoplogs
Work Item Unit Coefficient Price Unit Cost Remark
(10) Form work
Work Item Unit Coefficient Price Unit Cost Remark

Manual for Micro-Hydro Power Development Chapter 8 (Reference)
- 8-11-
[Ref. 8-1 Cross-sectional method to calculate quantity]
It is convenient if you use Cross-sectional method when calculating complicated quantity such a Headrace. When you want to calculate the quantity of excavation of Headrace as shown in the following figure, first, you draw a sectional view for every changing point of cross-sectional form, and the excavation area for every section is calculated using planimeter etc.

Manual for Micro-Hydro Power Development Chapter 8 (Reference)
- 8-12-
Next, you can make the next table from the relation between the area of each section, and distance.
This cross-sectional method is applicable not only excavation area but also in the calculation of quantity of Backfill or Masonry.
Section name Excavation Area Average Area Distance Volume
① ② ③ ②×③
Total 12.73m3
2.690m3
4.125m3
3.735m3
2.180m3
E - E
2.00m
3.00m
3.00m
2.00m
A - A
B - B
C - C
D - D
1.37m21.375m2
1.245m2
1.12m2
1.090m2
1.06m2
1.345m21.31 m2
1.38m2
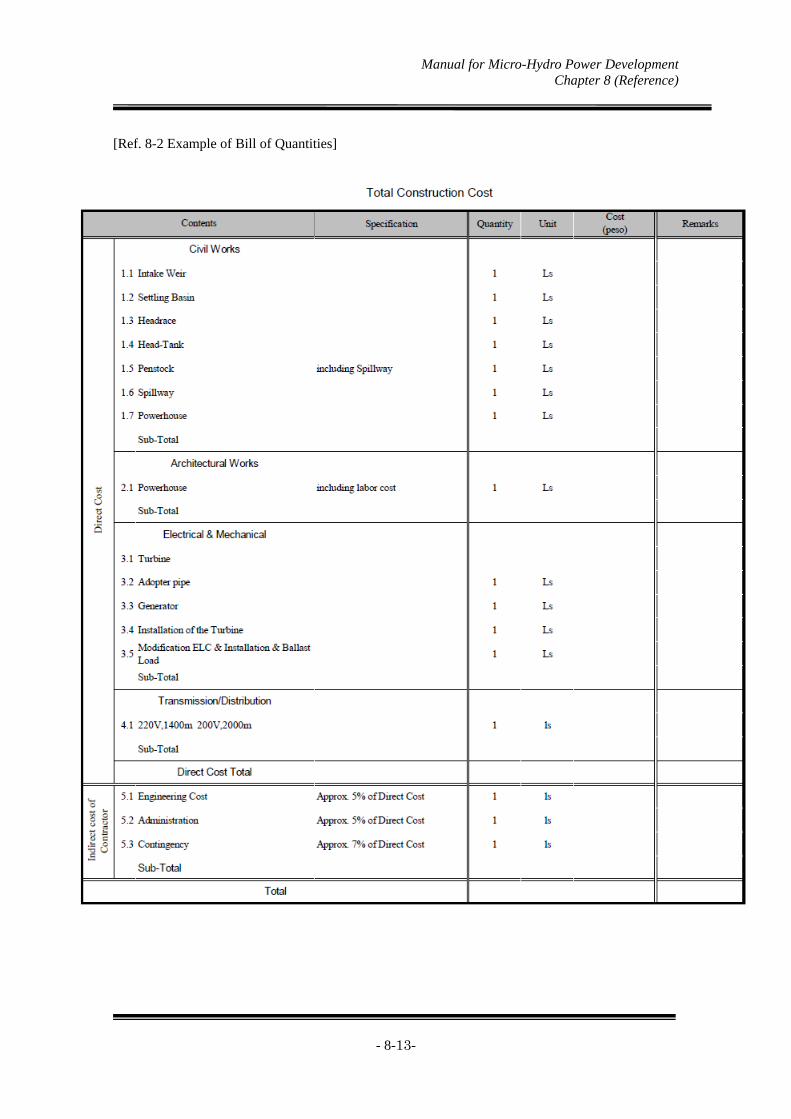
Manual for Micro-Hydro Power Development Chapter 8 (Reference)
- 8-13-
[Ref. 8-2 Example of Bill of Quantities]
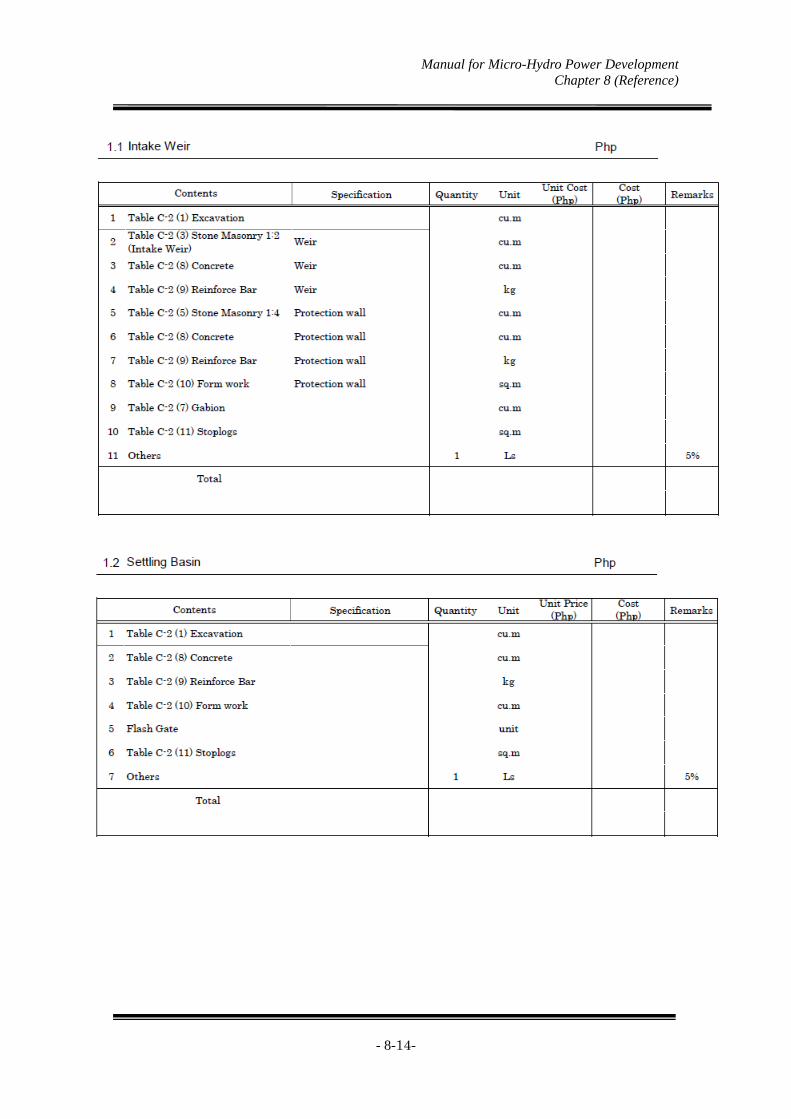
Manual for Micro-Hydro Power Development Chapter 8 (Reference)
- 8-14-
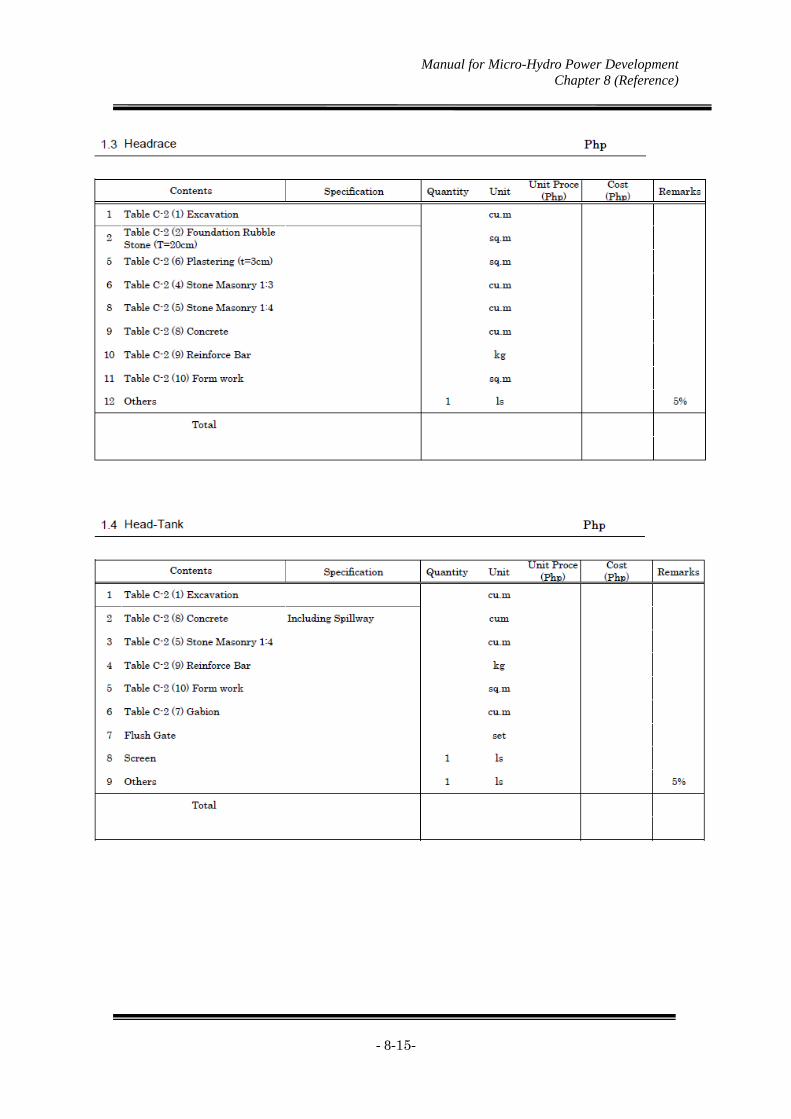
Manual for Micro-Hydro Power Development Chapter 8 (Reference)
- 8-15-
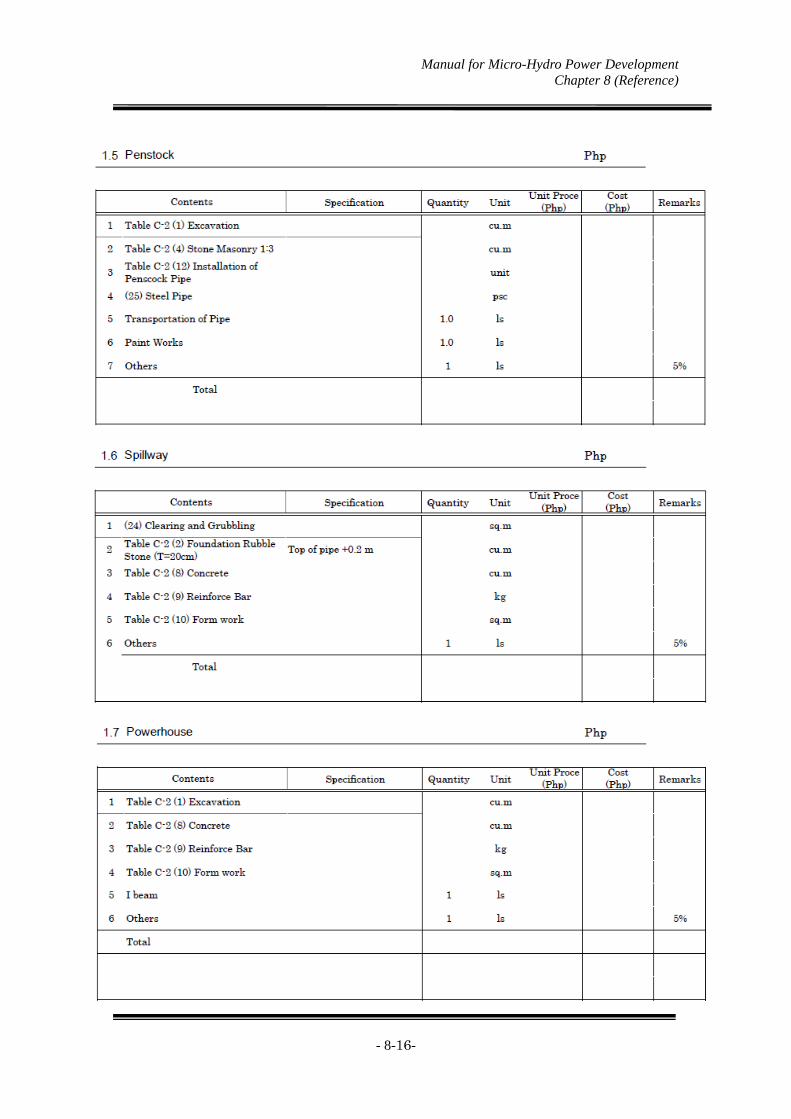
Manual for Micro-Hydro Power Development Chapter 8 (Reference)
- 8-16-

Manual for Micro-Hydro Power Development Chapter 8 (Reference)
- 8-17-

Manual for Micro-Hydro Power Development Chapter 9
- 9-1 -
CHAPTER 9 CONSTRUCTION MANAGEMENT
9.1 Construction Management for Civil Facilities
9.1.1 Purpose
Construction management is performed by the contractor to satisfy the standards and to
complete the construction works economically and safely within the construction period.
For assuring the quality and functions and for controlling the progress of work, the
contractor makes a construction plan, checks in the middle of work whether the work is
being carried out as scheduled, makes corrections if the work is delayed, examines
whether the predetermined quality and shape are being made and shows the results on
graphs and tables, corrects the items not meeting standards or the like, and records the
progress, quality and shape of the work in comparison to the specifications and
drawings.
Construction management includes progress control, dimension control and quality
control.
9.1.2 Progress Control
Progress control is the management of construction process for assuring the execution
of work efficiently and economically within construction period by effectively utilizing
the machines, labour and materials while maintaining sufficient quality and accuracy
instead of merely controlling a series of processes for observing the completion date. In
particular, in countries where a rainy season and a dry season can be clearly recognized,
the construction works are concentrated in dry season and this will impose extra
restrictions on time, and thus progress control must be given paramount importance.
This is important because it is unavoidable to rely mainly upon manpower in civil
works. On the other hand, hydropower station construction contains works for generator
installation and electric facility construction in addition to civil works, and so close
coordination between the works is required.
When using funds from international financial institutions for importing construction
equipment and materials, various procedures are necessary to obtain approvals from
relevant agencies for the import plan, to prepare documents necessary for international
bidding, to make documents for bidding and contracting by export/import agents and to
obtain approvals for export from the government of the country exporting the goods.
When preparing a time schedule for construction, it should be noted that a considerable
Manual for Micro-Hydro Power Development Chapter 9
- 9-2 -
period of time is necessary from the start of taking the above procedures to the actual
delivery of goods to the site.
(1) Procedure of progress control
Progress control is made for each of the planning, implementation, reviewing and
handling steps. Progress should be controlled to execute the works as close as possible
to the schedule by carrying out the work in accordance with the construction schedule,
and periodically recording the actual progress on schedule sheets every day, every week
or every month and constantly checking the progress by comparing the planned and
actual progress. If any large deviation is detected between the two, there may be a
problem in the plan or implementation system. Thus, the plan should be reexamined and
correcting measures taken. Then, implementation, reviewing and handling steps should
be taken on the basis of the revised construction schedule.
(2) Construction schedule chart
Various time schedules should be graphically prepared for progress control and then
used as standard for implementation, review and handling. The following forms are
normally used for the control chart.
(a) Horizontal line type schedule charts (Gantt chart, bar chart)
(b) Curve type schedule charts (graph type)
(c) Network type schedule charts (PERT, CPM)
Bar charts are normally used as schedule charts but the use of network type schedule
charts is more advantageous in power station projects where various types of works
overlap. For knowing the shape (dimensions, quantity, reference height, etc.) of an
object created by the works, the shape is directly measured
9.1.3 Dimension Control
It is necessary to ensure that the civil works have been built in conformity with the
contract requirements set forth and intended by the owner. If any items not meeting the
requirements are found, the causes should be pursued and corrective measures taken.
Dimension control can be roughly divided into direct-measurement and photo-graphic
records.
(1) Direct measurement
For knowing the shape (dimensions, quantity, reference height, etc.) of an object created
by the works, the shape is directly measured in accordance with the sequence of
construction works and the measured values are then compared to design values. The

Manual for Micro-Hydro Power Development Chapter 9
- 9-3 -
results are recorded, the accuracy of construction cheeked against standards, and the
degree of construction technology controlled.
(2) Photographic records
Photographic records are made as supplementary data for later confirmation of the
progress of the works including conditions before and after the works, the portions that
may not be seen upon completion of the structure, and the results of direct
measurement.
9.1.4 Quality control
Quality control is used to maintain the standards of quantity set forth in the design and
specifications.
(1) Procedure of quality control
For performing quality control, standardization must first of all be made. Standards or
criteria should be established for all the phases ranging from material purchasing to
work execution, and the works should be controlled in accordance with it.
(a) Standards for materials
Quality standards for materials to be used should be clarified and quantitatively defined.
(b) Quality standards
Control characteristics for the required quality should be clarified and quantitatively
defined.
(c) Work standards
Facility handling standards, inspection standards and standards for working methods
should be determined.
(d) Test and inspection methods
Standards for tests and inspections should be established.
As stated above, it is necessary to establish material standards, use the materials of
predetermined quality and perform the work, inspection and test in accordance with the
predetermined methods satisfying quality standards.
(2) Quality characteristics
Examples of quality characteristics and test items for the required quality control are
shown in Table 9-1

Manual for Micro-Hydro Power Development Chapter 9
- 9-4 -
Table 9.1.1 Examples of quality characteristics
Kind Quality characteristics Tests Concrete Slump
Air Content Compressive strength Bending strength
Slump test Air content test Compression test Bending test
Earth Grain size Degree of compactness Penetration index In-situ CBR value
Grain size analysis Dry density test Various penetration tests In-situ CBR test
Asphalt Density and voids Temperature at delivery to site Flatness of pavement surface
Marshall test Temperature test at delivery to site Flatness test
(3) Control method
Typical quality control methods are as explained below.
(a) Histogram
For finding the distributing conditions of certain characteristic values of products, the
measured values of required samples should be obtained and bar graphs prepared.
Histograms are convenient for judging whether the quality characteristics satisfy the
standards, whether the product distribution has certain allowance from the standards,
and whether the distribution of the overall quality is appropriate.
(b) Control chart
Control charts have a wide application range, are useful among quality control methods
and are therefore the most frequently utilized. Control charts show pairs of control
limits and, if any plotted points are located outside the limit, this means that there is a
critical quality fluctuation.
Control charts are classified as shown below depending on whether the items being
considered are continuous data such as length, strength and weight or discrete values
such as fraction defective ratio, number of defective portions and number of defects.
Control charts
for continuous data ......... X control chart, X control chart, X
control chart, R control chart,
process capability chart.
Control charts
for discrete values ......... P control chart, Pn control chart, C
control chart, U control chart
~ _
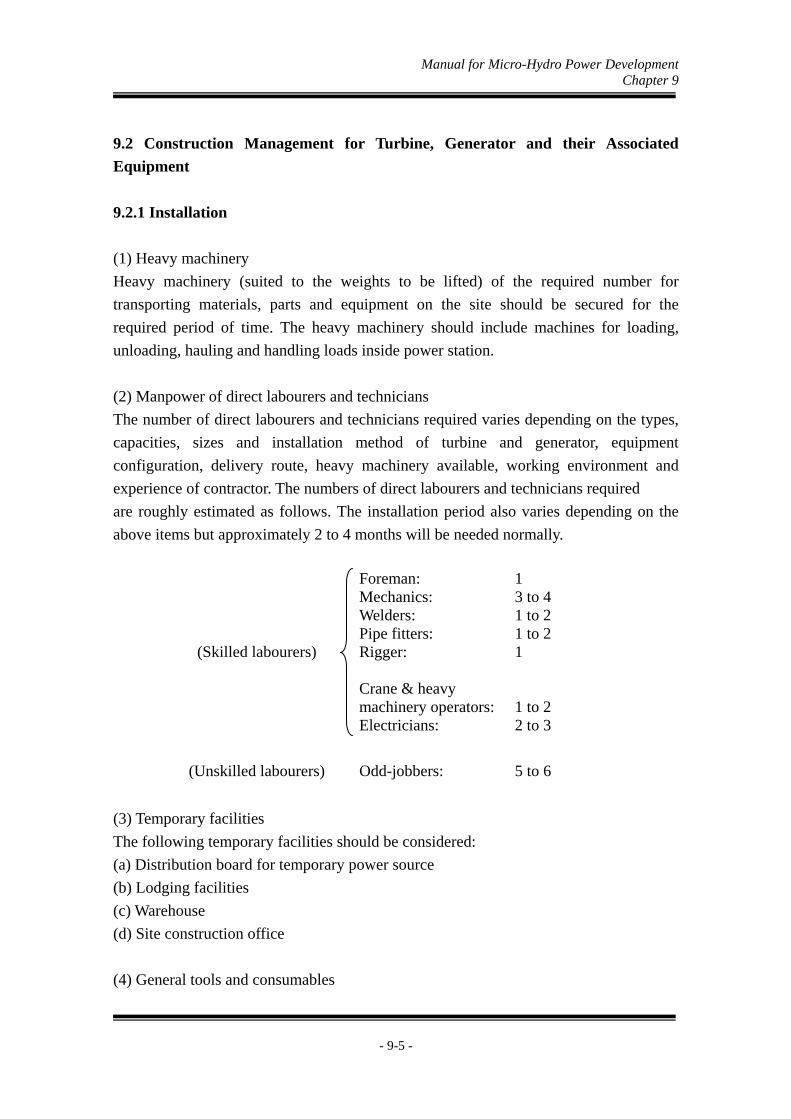
Manual for Micro-Hydro Power Development Chapter 9
- 9-5 -
9.2 Construction Management for Turbine, Generator and their Associated
Equipment
9.2.1 Installation
(1) Heavy machinery
Heavy machinery (suited to the weights to be lifted) of the required number for
transporting materials, parts and equipment on the site should be secured for the
required period of time. The heavy machinery should include machines for loading,
unloading, hauling and handling loads inside power station.
(2) Manpower of direct labourers and technicians
The number of direct labourers and technicians required varies depending on the types,
capacities, sizes and installation method of turbine and generator, equipment
configuration, delivery route, heavy machinery available, working environment and
experience of contractor. The numbers of direct labourers and technicians required
are roughly estimated as follows. The installation period also varies depending on the
above items but approximately 2 to 4 months will be needed normally.
(Skilled labourers)
Foreman: Mechanics: Welders: Pipe fitters: Rigger: Crane & heavy machinery operators: Electricians:
1 3 to 4 1 to 2 1 to 2 1 1 to 2 2 to 3
(Unskilled labourers) Odd-jobbers: 5 to 6
(3) Temporary facilities
The following temporary facilities should be considered:
(a) Distribution board for temporary power source
(b) Lodging facilities
(c) Warehouse
(d) Site construction office
(4) General tools and consumables

Manual for Micro-Hydro Power Development Chapter 9
- 9-6 -
(5) Classification of installation work
(a) Inspection of dimensions and level of concrete foundation
(b) Transport of materials, parts and equipment from warehouse to power station
(e) Unpacking
(d) Preparing scaffolds
(e) Assembly and installation
(f) Welding and gas cutting
(g) Wiring
(h) Piping work and flushing
(i) Hydraulic pressure test
(j) Non-destructive test
(k) Centering, leveling
(1) Shaft runout test
(m) Painting
(6) Inspection during installation
(a) Centering & leveling
(b) Shaft runout measurement
(c) Measurement of caps of rotating parts
(d) Confirmation of dimensions of each portion
(e) Dye Penetration Test or ultrasonic crack examination for field welds of stress
carrying parts
(f) Relation between guide vane opening and servomotor stroke
(g) Insulation resistance measurement
9.2.2 Adjustment during Test Run Operation
(1) Instruments, tools and materials
Prior to cdommencement of the tests, provision should be made for dummy load by
water rheostat or the like if an actual load for the tests can not be expected.
(2) Manpower schedule
Occupation Number of Personnel Test engineers (mechanical): Test engineers (electrical): Testing personnel:
1 to 2 1 to 2 10 to 12
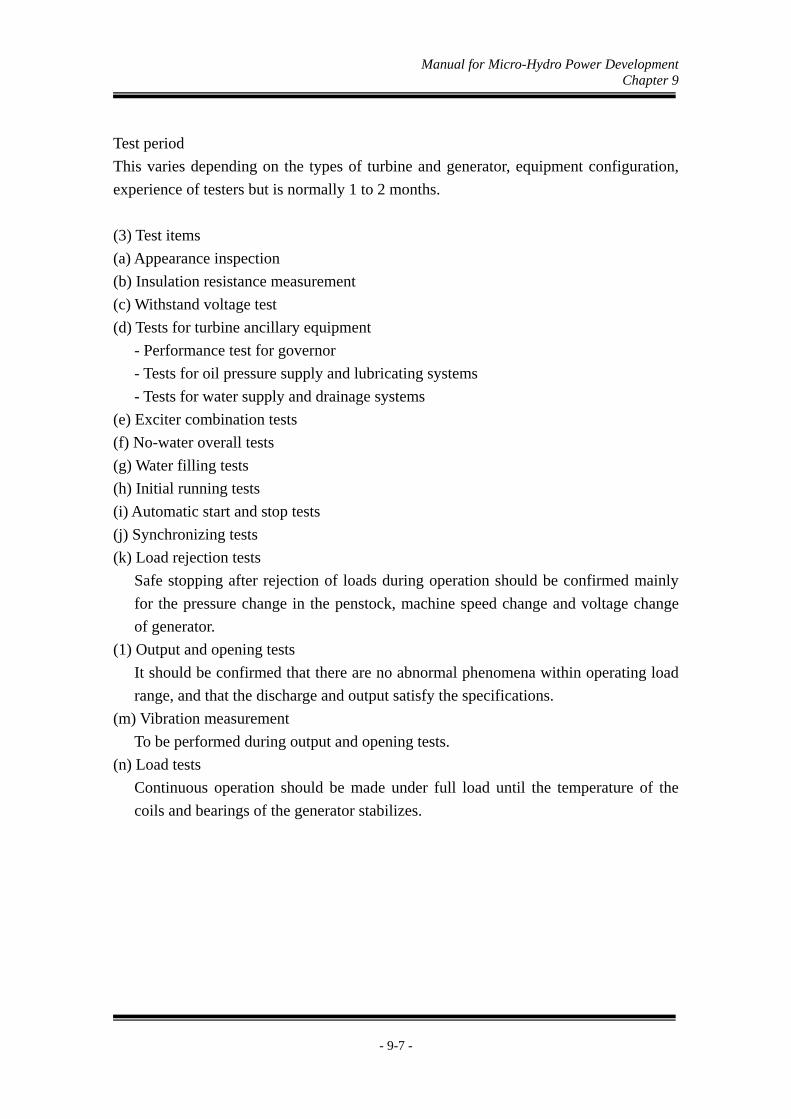
Manual for Micro-Hydro Power Development Chapter 9
- 9-7 -
Test period
This varies depending on the types of turbine and generator, equipment configuration,
experience of testers but is normally 1 to 2 months.
(3) Test items
(a) Appearance inspection
(b) Insulation resistance measurement
(c) Withstand voltage test
(d) Tests for turbine ancillary equipment
- Performance test for governor
- Tests for oil pressure supply and lubricating systems
- Tests for water supply and drainage systems
(e) Exciter combination tests
(f) No-water overall tests
(g) Water filling tests
(h) Initial running tests
(i) Automatic start and stop tests
(j) Synchronizing tests
(k) Load rejection tests
Safe stopping after rejection of loads during operation should be confirmed mainly
for the pressure change in the penstock, machine speed change and voltage change
of generator.
(1) Output and opening tests
It should be confirmed that there are no abnormal phenomena within operating load
range, and that the discharge and output satisfy the specifications.
(m) Vibration measurement
To be performed during output and opening tests.
(n) Load tests
Continuous operation should be made under full load until the temperature of the
coils and bearings of the generator stabilizes.

Manual for Micro-Hydro Development Chapter 10
- 10-1 -
Chapter 10 OPERATION AND MAINTENANCE 10.1 Introduction
A hydropower plant has an advantage that it does not need fuel for its operation as
compared with oil or thermal power plants. However, there are no differences between
both type of plants on that appropriate operation and maintenance (O&M) are essential
for their long-term operation. It can be operated for long period if its facilities are
properly operated and maintained. We should effectively utilize hydropower because
aside from being indigenous energy resource, it is also renewable.
We have to operate and maintain micro hydropower plants with strict compliance to the
operation and maintenance manuals. In general, operators of micro hydropower plants
should be trained to understand the following:
(1)Operators must efficiently conduct operation and maintenance of the
micro-hydropower plant with strict compliance with the O and M rules and
regulations.
(2)Operators must familiarize themselves with all the plant components and
their respective performance or functions. Furthermore, they should also be
familiar to measures against various accidents for prompt recovery.
(3)Operators must always check conditions of facilities and equipment. When
they find some troubles or accidents, they must inform the person in charge
and try to recover it.
(4)Operators must try to prevent any accidents. For the purpose, they should
repair or improve facilities preventively as necessary.
Operation and maintenance manual should basically be prepared for each plant
individually before the start of its operation. Following is the general manual of
operation and maintenance for micro hydropower plants.

Manual for Micro-Hydro Development Chapter 10
- 10-2 -
10.2 Operation
The operation of micro-hydropower plants is not only to generate electric power but
also to control generation equipment and to supply electricity of stable quantity and
quality to consumers and maintaining all facilities in good condition.
The micro-hydropower plant facilities and equipment were installed depending on site
conditions and budget, but there are various ways of proper operation for these plants.
For a plant that is equipped with an automatic load stabilizer, the operators do not
always have to control the equipment except in case of starting, stopping and during
emergency cases. And in case automatic stopping and recording systems are installed, it
is not necessary for operators to stay in the power plant most of the time.
However, most of micro-hydro plants for rural electrification are not provided with
automatic control system and protection equipment because of budget limitation. In this
case, it is necessary for operators to stay at or near the plant to monitor control
equipment and to undertake immediate measures in case of emergency, in the
observance of proper operation practice.
General ways of micro-hydro operations are as follows:
10.2.1 Basic operation
(1) Check points before starting operation
Before starting operation of the power plant, operators must check the
following facilities are in good condition for operation. Especially in the
case of after long term operation, they should be checked thoroughly.
① Transmission and distribution line
・ Damages of lines and poles
・ Approaching branches
・ Other obstacles
② Waterway facilities
・ Damages of structures
・ Sand sedimentation in front of the intake
・ Suspended trash at screens
・ Sand sedimentation in the settling basin and the forebay
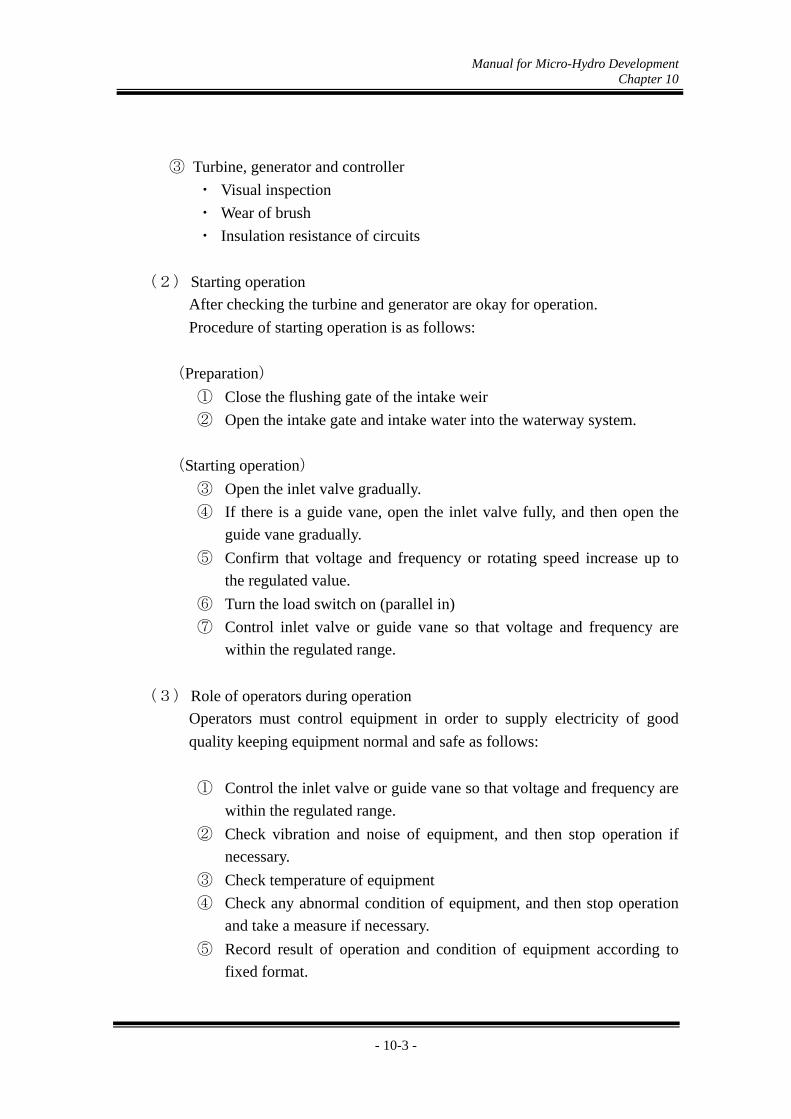
Manual for Micro-Hydro Development Chapter 10
- 10-3 -
③ Turbine, generator and controller
・ Visual inspection
・ Wear of brush
・ Insulation resistance of circuits
(2) Starting operation
After checking the turbine and generator are okay for operation.
Procedure of starting operation is as follows:
(Preparation)
① Close the flushing gate of the intake weir
② Open the intake gate and intake water into the waterway system.
(Starting operation)
③ Open the inlet valve gradually.
④ If there is a guide vane, open the inlet valve fully, and then open the
guide vane gradually.
⑤ Confirm that voltage and frequency or rotating speed increase up to
the regulated value.
⑥ Turn the load switch on (parallel in)
⑦ Control inlet valve or guide vane so that voltage and frequency are
within the regulated range.
(3) Role of operators during operation
Operators must control equipment in order to supply electricity of good
quality keeping equipment normal and safe as follows:
① Control the inlet valve or guide vane so that voltage and frequency are
within the regulated range.
② Check vibration and noise of equipment, and then stop operation if
necessary.
③ Check temperature of equipment
④ Check any abnormal condition of equipment, and then stop operation
and take a measure if necessary.
⑤ Record result of operation and condition of equipment according to
fixed format.

Manual for Micro-Hydro Development Chapter 10
- 10-4 -
(4) Stopping operation
In order to avoid longer runaway speed of the turbine and the generator, the
procedure of stopping operation is as follows:
① Close the inlet valve or the guide vane.
② Cut load switch off (load rejection)
③ Close the inlet valve and the guide vane completely.
④ Close the intake gate
When load is suddenly cut due to an accident, operator must close the inlet
valve or the guide vane immediately to avoid runaway speed of the turbine
and the generator for long time.
10.2.2 Operation in case of Emergency
(1)In case of flood
In general, micro hydropower plants can be operated even in the case of
flood, however, when the river becomes muddy and if there is possibility
that sand and soil will enter into the facilities, operation of the plant should
be stopped by closing the intake gate. After flood, operators must inspect all
facilities first prior to resumption of operation.
(2) In case of earthquake
Since an earthquake affects all facilities of plants, operators must inspect
facilities after a big earthquake as follows:
・ Check damages of structures
・ Misalignment of the shaft of the turbine and the generator
・ Damages of other electrical equipment
・ Others
(3) In case of shortage of water
There is an applicable range of water discharge for each turbine. Therefore,
a turbine should be operated within the range.
Micro hydropower plant should basically be designed along water discharge
in the dry season. However, in case of shortage of water that is beyond of
our expectations, operators must stop operation because continuous
operation under such condition will damage the turbine.

Manual for Micro-Hydro Development Chapter 10
- 10-5 -
(4)In case of accident
In case of accident, operators must stop operation, investigate the cause
and try to recover operation as soon as possible. Operator’s roles are as
follows:
① Immediately inform the accident to the person in charge.
② Investigate accident in detail.
③ Look into the causes of accident.
④ Recover operation as soon as possible if operators can prove the causes
and repair by themselves.
⑤ Contact makers or suppliers of equipment and request them to repair if
the operators cannot find the causes and cannot repair by themselves.
What operators should prepare in advance are as follows:
・ Discuss with maker or supplier of equipment on possible measures in
case of equipment trouble.
・ Present to the Barangay Alternative Power Association (BAPA)
management about expenditure on the recovery.
⑥ Inform the DOE and LGU regarding the accident.
10.2.3 Others
(1)Filling water in waterway system
Procedure of filling water into the waterway system is as follows:
① Confirm all flushing gates and valve of the water system are open.
② Open the intake gate partially, and intake small volume of water.
③ Close the flushing gate of the settling basin after cleaning the
settling basin.
④ Close the flushing gate of the forebay after cleaning the headrace
and the forebay.
⑤ Close the drain valve of the penstock after cleaning the penstock.
⑥ Fill the penstock with water gradually.
⑦ Open the intake gate fully after filling up the penstock.
( 2 ) Flushing sand in front of intake
If sand sedimentation reaches the intake level, sand will be carried into
Manual for Micro-Hydro Development Chapter 10
- 10-6 -
waterway system and it will affect the penstock and turbine blades.
Therefore, in order to prepare against outflow of sand and soil during
flooding, operators must keep the intake approach open. For the purpose,
operators should sometimes flush or remove sand that settled in front of
intake.
If flushing gate is installed at the intake weir, operators can flush sand
out by water flow opening the gate during flooding. However, incase of
having no flushing gate, operators must remove sand out of the weir
manually.
( 3 ) Control of intake water
Volume of intake water changes according to water level of river.
Normally excess water should be spilled out at spillway, which is
located at settling basin or headrace. If the excess water reaches the
spillway of the forebay for long time, it may possibly wash out the
structure due to lack of spillway capacity. Therefore, operators must
control the intake gate so as to avoid too much water spill.
10.3 Maintenance
In order to operate micro hydropower plants in good condition for long period,
waterway facilities, electric equipment, transmission and distribution line should be
maintained adequately. Operators must try to observe even a small trouble and
prevent accident of facilities. For the purpose, daily patrol and periodic inspection
are essential and recording and keeping of those data are also important.
Though items and frequency of patrol and inspection should be decided considering
condition of facilities and ways of use, general maintenance of micro hydropower
plants is as follows:
10.3.1 Daily patrol
In order to check if there is anything strange at waterway facilities, electric
equipment, transmission and distribution line, operators daily conduct patrol along
the course that has been fixed in advance. Operators must record result of patrol and
take a measure if necessary.

Manual for Micro-Hydro Development Chapter 10
- 10-7 -
Items of daily patrol are as follows:
Facilities and Equipment Checking Points Measures Suspended Trash at screen
To remove it at any time
Water leakage from weir and gate
To record it To repair it if necessary
Sand sedimentation To flush it out as necessary
Intake and Waterway
Deformation or Crack in structure
To record it To repair it if necessary
Sedimentation Basin Sand sedimentation To flush it out as necessary
Facilities and Equipment Checking Points Measures Suspended materials along canal
To remove it at any time
Sand sedimentation To flush it out as necessary
Leakage, deformation and Crack in structure
To record it To repair it if necessary
Headrace
Land slide along headrace
To remove sand and rocks after confirming safety
Suspended Trash at screen
To remove it at any time
Overflow from Spillway
To reduce water intaken if overlowing water is too much.
Water leakage To record it To repair it if necessary
Sand sedimentation To flush it out as necessary
Headtank (Forebay)
Deformation or Crack in structure
To record it To repair it if necessary
Penstock Leakage and deformation
To record it
Strange sound and vibration
To record it To check the causes of it
Turbine
Leakage from housing
To record it To repair it if necessary
Strange sound and vibration
To record it To check the causes of it
Temperature To record it
Generator
Damage of belt To replace if necessary Performance of load stabilizer
To check the performance Load stabilizer
Damage of heater To replace if necessary Transformer Leakage of oil To replace if necessary
Suspended material To remove after stopping the operation
Transmission and Distribution line
Approaching branch To cut it as necessary

Manual for Micro-Hydro Development Chapter 10
- 10-8 -
10.3.2 Periodic Inspection
Operators must conduct inspection periodically to check if there are any troubles in
facilities and equipment. Operators, preferably, should be able to perform repair
works in case there are troubles during inspection, if necessary.
Items and frequency of periodic inspection are as follows:
Facilities and Equipment Checking Points Frequency
Measures
Leakage, deformation and Crack in structure
6 months To record it To repair it if necessary
Intake ~ Penstock And Tailrace
Deformation or Crack in structure
6 months To record it To repair it if necessary
Supply grease to bearing
6 months
To replace bearing 3 years
Turbine
Bolt connection 1 year To fix them Supply grease to bearing
6 months
To replace bearing 3 years
Winding insulation resistance
6 months To replace generator
Bolt connection 1 year To fix them
Generator
Damage of belt 6 months To replace if necessaryPerformance of load stabilizer
6 months To repair it Load stabilizer
Damage of heaters 6 months To replace if necessaryInlet valve Leakage 1 year To Transformer Leakage of oil 1 month To replace if necessaryTransmission and Distribution line
Approaching branch 1 month To cut it as necessary
10.3.3 Special Inspection
In case of earthquake, flood, heavy rain and accident, operators must stop operation
and inspect facilities.

Manual for Micro-Hydro Development Chapter 10
- 10-9 -
10.4 Recording
Operators must keep a record of the operation and maintenance of the
micro-hydropower plant. Records will provide much help to operators in monitoring
the conduct of the regular or scheduled activities for the operation and maintenance.
It also provides good data in determining the causes of trouble in case of accident.
A sample of operation record and daily patrol check sheet is shown in the next page.
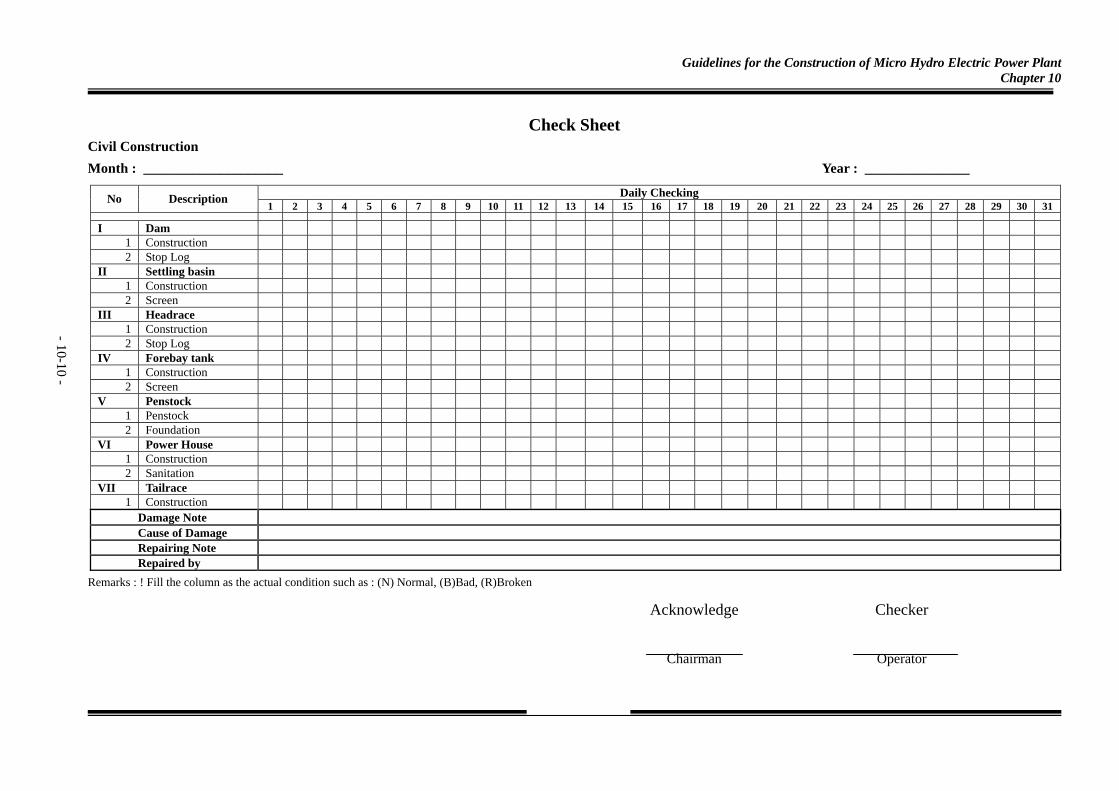
Guidelines for the Construction of Micro Hydro Electric Power Plant Chapter 10
- 10- -
- 10-10 -
Check Sheet Civil Construction
Month : ____________________ Year : _______________
Remarks : ! Fill the column as the actual condition such as : (N) Normal, (B)Bad, (R)Broken
Acknowledge Checker
Chairman Operator
Daily Checking No Description 1 2 3 4 5 6 7 8 9 10 11 12 13 14 15 16 17 18 19 20 21 22 23 24 25 26 27 28 29 30 31
I Dam 1 Construction 2 Stop Log
II Settling basin 1 Construction 2 Screen
III Headrace 1 Construction 2 Stop Log
IV Forebay tank 1 Construction 2 Screen
V Penstock 1 Penstock 2 Foundation
VI Power House 1 Construction 2 Sanitation
VII Tailrace 1 Construction
Damage Note Cause of Damage Repairing Note Repaired by

Guidelines for the Construction of Micro Hydro Electric Power Plant Chapter 10
- 10- -
- 10-11 -
Check Sheet Mechanical and electrical
Month : ____________________ Year : _______________
Remarks: : ! Fill the column as the actual condition such as : (N) Normal, (B)Bad, (R)Broken
!! If there is a fatal damage, repair immediately, or coordinated with IBEKA team Telp. 022-4202045
Acknowledge Checker
Chairman Operator
Daily Checking No Description 1 2 3 4 5 6 7 8 9 10 11 12 13 14 15 16 17 18 19 20 21 22 23 24 25 26 27 28 29 30 31
I Turbine 1 Runner 2 Bearing turbine
3 Plummer Block Bearing
4 Pull Turbine 5 Cover pulley 6 Coupling
II Panel control 1 Meter 2 Lightning rod 3 Ballast Load 4 Main Board
Damage note Cause of Damage Repairing Note Repaired by

Guidelines for the Construction of Micro Hydro Electric Power Plant Chapter 10
- 10- -
- 10-12 -
Check Sheet Distribution Line
Month : ____________________ Year : _______________
Remarks : ! Fill the column as the actual condition such as : (N) Normal, (B)Bad, (R)Broken
!! If there as problem with the distribution facility, repair immediately and fill the damage column
Acknowledge by Checker
Chairman Operator
Daily Checking No Uraian 1 2 3 4 5 6 7 8 9 10 11 12 13 14 15 16 17 18 19 20 21 22 23 24 25 26 27 28 29 30 31
I Transmission 1 Pole 2 Cable 3 Connector 4 Group MCB
II In house installation 1 MCB 2 Installation Cable
Damage Note Cause of Damage Repairing note Repaired by

Guidelines for the Construction of Micro Hydro Electric Power Plant Chapter 10
- 10- -
- 10-13 -
Lubricant & Spareparts
Year : _________________
Notet. : Fill the column with the lubrication date
LOG BOOK Year : __________________
Lubrication based on total operation hour
January February March April May June July August September October November December No
Description
720 1440 2160 2880 3600 4320 5040 5760 6480 7200 7920 8640
A LUBRICATION
1 Bearing Turbine
2 Plummer Block Turbine Bearing
3 Plummer Block Turbine Generator
B SPAREPARTS
1 Bearing
2 Seal
3 Coupling
4 Flat Belt
5 Others
Re-setting

Guidelines for the Construction of Micro Hydro Electric Power Plant Chapter 10
- 10- -
- 10-14 -
Recorder
___________ Operator
Time Operation
Volt Ampere Watt Output Total Date
Start Stop Hour/day
Opening of Guide vane %
Frequency meter (Hz)
R-N(V1) S-N(V2) T-N(V3) A1 A2 A3 V1xA1 V2xA2 V3xA3 Watt Remarks
1 2 3 4 5 6 7 8 9
10 11 12 13 14 15 16 17 18 19 20 21 22 23 24 25 26 27 28 29 30 31
Note: Fill the column after installation to the house Calculation of power output = (A1+A2+A3)x220 on condition ballast 0 (zero) volt

Manual for Micro-Hydro Development Chapter 11
- 11-1 -
Chapter 11 MANAGEMENT
11.1 Establishment of Organization
Micro-hydropower projects for rural electrification are different from private power
companies, in which all parties concerned that includes the consumers, O&M groups,
community organizations, and Barangay, Local and Central governments, have to
accomplish their roles and responsibilities to ensure sustainable operation.
A sample of organization chart for implementation of micro-hydropower projects is
shown in Attachment-1.
An O & M organization called the Barangay Alternative Power Association (BAPA)
should be established to take care of the operation and management prior to project
implementation. The BAPA should have its by-laws and elected officials duly
recognized by a General Assembly.
11.2 Management System
Background
More than a half of existing micro hydropower plants in rural areas are non-operational
due to various causes of troubles. Most operators do not have appropriate knowledge
and skill on operation and maintenance for micro hydro plants. Usually, budget for
operation and maintenance were not given due importance. As a result, operators
cannot work well for the plant without sufficient salary. Also, they cannot implement
preventive maintenance for the equipment without enough money. This will usually
result to curative maintenance which is more expensive or if not implemented will
result to operational stoppage. Therefore, the causes of problems of micro hydropower
plant are not only due to low quality of facilities and equipment but also insufficient
management practice of concerned organization.
In order to manage the BAPA, rules and regulation that provide objectives, member’s
role and responsibilities, scope of work, etc. should be established before
commissioning the plant. It should also be necessary to stipulate respective
responsibilities in the by-laws of the association, all pertinent rules and regulation that

Manual for Micro-Hydro Development Chapter 11
- 11-2 -
shall be binding and imposed up to the operational life of the power system.
Importantly, training on management should also be conducted.
Establishment and management of organization for the plant are necessary for
long-term operation of a micro hydropower plant. Moreover, it becomes possible to
maintain the organization substantially by monitoring from the outside.
11.3 Reporting and Monitoring
Operational data and maintenance results should be recorded and kept because it will
be used as basis of operators to find out the causes of trouble in the future. Likewise,
record of tariff collection and balance sheet of income and expenditure are essential for
BAPA to manage itself substantially.
If management of BAPA is controlled by few people, sometimes led to falsifying
records to appear that the operation of the organization is in good standing and
diversion of funds to other purpose. As a result, the trouble-shooting of the facilities
will be very difficult due to lack of records and funds. To prevent such situation or get
technical and managing advices, it is advisable to introduce reporting system that
BAPA will report results of operation and maintenance and financial management to
the DOE and the concerned LGU periodically.
On the other hand, the DOE and the concerned LGU should conduct monitoring that
they will visit sites periodically, and check the condition of operation and maintenance
and management of BAPA, and then give BAPA technical and administrative advices
if necessary.
Periodic report on operation and maintenance of the micro-hydro system is necessary
as basis for identification of future repairs.
11.4 Decision-Making System
The General Assembly is the final approval of all decisions made which are not
stipulated in the By-Laws of the organization. The proposal should be approved by the

Manual for Micro-Hydro Development Chapter 11
- 11-3 -
Board of Directors (BOD) before it will be presented to the General Assembly.
11.5 Accounting System
Accounting System consists of;
Tariff System,
Electricity Charge Collection System,
Expenditures
Procedures on Pay Out,
11.6 Roles and Responsibilities of BAPA
BAPA (Barangay (Village) Alternative Power Association) carries out following work
as an operation and maintenance organization, consulting with related agencies:
Formulate and implement rules and regulations of the organization.
Collect electricity tariff from consumers, and manage income and expenditure
Operate and maintain a power plant, and the supply electricity to consumers
efficiently and safely. Repair or replace facilities and equipment if necessary.
Instruct consumers on guideline of safe and efficient usage of electricity.
Report result of operation and maintenance of the plant and financial
management to DOE and related LGU periodically.
11.6.1 BAPA Officials
1) Chair Person:
Chair person is the Head of the BAPA Organization. His duties are:
Comprehensive management of generation facilities and users whether
they are using electricity according to the rules and/or the regulations.
2) Board of Directors:
Board of Directors may consist of several persons, and their duties are:
Giving the appropriate advice to the Head of the BAPA when requested
by the Head. In any time, they can investigate the status of the overall

Manual for Micro-Hydro Development Chapter 11
- 11-4 -
management, status of use of electricity by users, facilities’ status of the
Micro-Hydro Power Plant itself, and other necessary matters, if they
judge to need to do it.
3) Vice Chairperson:
Vice Chairperson assists the chair person and act as the Head of the
BAPA in the absence of the chair person.
4) Secretary:
On the smooth performance of the BAPA, several secretarial works may
be needed.
5) Accountant:
Duties of the Accountant are:
Collection of electricity charge based on the agreed tariff system
and book-keeping.
The electricity charge may be collected by means of the people
coming to the accountant periodically to pay their electricity
charges and then the accountant enters up their payments with
their names in an account book and keeps it carefully.
Cash management.
The cash as a revenue due to collection of electricity charge
should be managed by the accountant carefully. To use banking
system is one of ways.
6) Operators and Technicians:
At least, 3 operators may be needed.
Duties of the Operator(s) are:
Daily operation of micro-hydro power facilities.
Periodical check of all the facilities.
Uncomplicated maintenance for the facilities.
Judging required maintenance with cost to procure necessary
spare-parts and/or tools to be needed for maintenance.
Report the required maintenance with cost to procure necessary
spare-parts and/or tools for maintenance to the Chair Person.

Manual for Micro-Hydro Development Chapter 11
- 11-5 -
11.6.2 Consumers
Consumers must have the following responsibilities:
Pay electricity tariff
Use electricity safely and efficiently.
11.6.3 Local Government Unit (LGU)
Concerned LGU shall have the following responsibilities:
Implement a micro hydro project.
Supervise management of BAPA
Conduct training of BAPA staff
Propose appropriate livelihood projects that utilize electricity.
11.6.4 Department of Energy (DOE)
As a lead agency in rural electrification, the DOE shall have the following
responsibilities:
Coordinate with NEA thru RECs to organize BAPA
Conduct monitoring of micro hydropower plant periodically.
Advise on technical and management aspects to insure sustainability
of the system.
11.7 Training
BAPA staff including operators must have enough knowledge and skill on operation,
maintenance and management of BAPA. Therefore, they should receive training before
the operation of a power plant.
Training components are as follows:
Operation and maintenance of a micro hydropower plant
Maintenance of transmission and distribution line
House wiring installation and its maintenance
Organization management including documentation
Financial management
Concerned LGU or proponent should have a responsibility to conduct these training
Manual for Micro-Hydro Development Chapter 11
- 11-6 -
before commissioning of the plant. In case of change of staff, skilled staff of BAPA
should train new staff.
11.8 Collection of Electricity Charge and Financial Management
11.8.1 Tariff Setting
Income from electricity tariff is an important source of fund to operate and maintain
a micro hydro power plant. Therefore, tariff rate should be set considering not only
salary of BAPA staff but also expenses for purchasing spare parts, repair and
replacement of equipment in the future. However, most of residents in rural areas
electrified by micro hydro plants are categorized into under poverty line. Hence,
tariff rate should be set considering solvency of residents for them to cope up.
Taking into account current expenditure for energy (kerosene and battery), assumed
electricity consumption of local people and tariff rate of RECs, four to five pesos
per kilowatts is reasonable to set tariff rate for micro hydro at the moment, as of
2001.
BAPA should decide which way is adapted in the rules and regulations of the BAPA.
It is either the tariff rate is based on consumption, fixed rate per bulb-wattage
installed. For poorer barangays, they usually adapt fixed rate, but it should be
higher than the consumption based rate.
11.8.2 Tariff Collection
There are two ways of bill collection. One way is that bill collectors visit all houses
in the supply area and then collect money from them one by one. Another way is
that representative of a district collect money from consumers within each district
and then he/she pay collected money to BAPA.
Since tariff collection is important income for operation and maintenance of plants
as mentioned above, bill collection should be done accurately. In case of
non-payment of bill, they should sometimes stop supplying electricity to
non-paying consumers.

Manual for Micro-Hydro Development Chapter 11
- 11-7 -
It is necessary that operators sometimes carry out patrol along distribution lines in
order to avoid illegal tapping of electricity.
11.8.3 Financial Management
Since BAPA is required for a stable supply of electricity to consumers for long
period, BAPA has to operate and maintain a power plant in good condition.
Therefore, BAPA has to administer the collected money and put aside funds for
future maintenance. We have to understand that even if the equipment is of high
quality, troubles may set in during its long-term operation, and then replacement of
spare parts will certainly be required within the years of operation.
An accounting system should be developed including a tariff system, collection of
electricity charges according to the tariff system, book keeping, cash management
method. Training on this aspect should also be conducted.
BAPA has an obligation to make balance sheets of income and expenditure and then
to report periodically. BAPA has to avoid that collected money is used for other
purposes.

Department of Energy
Energy Complex Merritt Road, Fort Bonifacio, Taguig City, Metro Manila
TEL: 840-14-01 to 21 FAX: 840-18-17

1

Department of Energy
Energy Complex Merritt Road, Fort Bonifacio, Taguig City, Metro Manila
TEL: 479-2900 FAX: 840-1817