manuel ch draft 00 document à usage interne au ct … manual- en.pdf · nutritional status..... 27...
TRANSCRIPT

Page | 1
Version 1.0
COMITE PERMANENT INTER-ETATS DE LUTTE CONTRE LA SECHERESSE DANS LE SAHEL
PERMANENT INTERSTATE COMMITTEE FOR DROUGHT CONTROL IN THE SAHEL
Identification and Analysis of Areas at Risk
and Populations Affected by Food and Nutrition
Insecurity in the Sahel and West Africa
MANUAL
August 2014
Cadre Harmonisé MANUAL Version 1.0
Page | 2
Technical Partners
Financial Partners
Contact:
AGRHYMET Regional Centre 425 Boulevard de l’Université, Rive droite PO Box 11011, Niamey, Niger Tel.: +227 20 31 53 16 / 20 31 54 36 Fax: +227 20 31 54 35 E-mail: [email protected] Web Site: www.agrhymet.ne
Cadre Harmonisé MANUAL Version 1.0
Page | 3
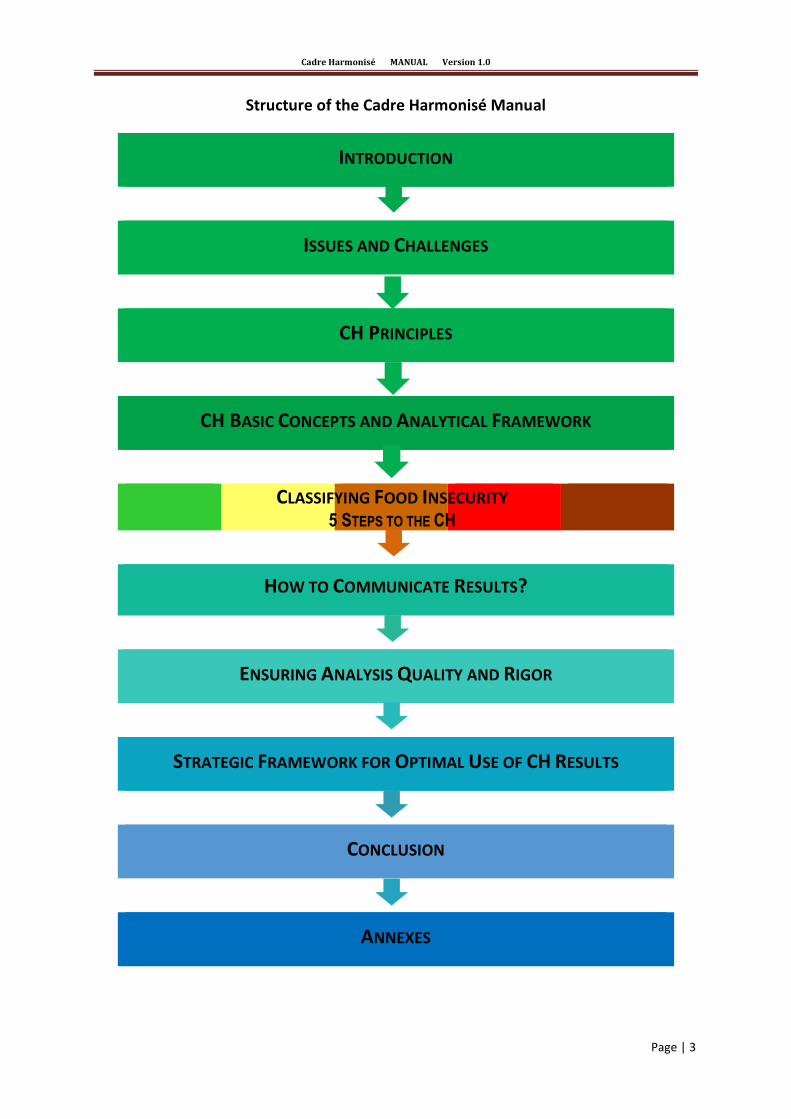
Structure of the Cadre Harmonisé Manual
INTRODUCTION
ISSUES AND CHALLENGES
CH PRINCIPLES
CH BASIC CONCEPTS AND ANALYTICAL FRAMEWORK
HOW TO COMMUNICATE RESULTS?
ENSURING ANALYSIS QUALITY AND RIGOR
STRATEGIC FRAMEWORK FOR OPTIMAL USE OF CH RESULTS
CONCLUSION
ANNEXES
CLASSIFYING FOOD INSECURITY 5 STEPS TO THE CH

Cadre Harmonisé MANUAL Version 1.0
Page | 4
FOREWORD
The present Manual is the result of dynamic partnership between FAO, WFP, UNICEF, FEWS NET,
JRC/EU, IPC/GSU and international NGOs Oxfam, Save the Children and ACF. The Cadre Harmonisé
(CH), which is funded by CILSS member countries, USAID, the European Union and AFD, has been
developed under an action-research approach involving actors from the national structures in CILSS
countries since 1999 and Gulf of Guinea countries (West Africa) since 2012. Carried out by a multi-
disciplinary team of experts from different partner institutions, the action-research has helped to: (1)
Identify systems that could provide information for analyzing household vulnerability to food and
nutrition insecurity; and (2) Develop a consensual analysis methodology.
Based on inclusive participation, consensus, transparency and synergetic coordination, the CH
approach enables analyzing countries’ food and nutrition security at the national level to the third
administrative level (department, county or district depending on the countries). The originality of the
CH lies in the fact that:
It makes countries’ analysis groups accountable for producing and analyzing reliable evidence
that help to classify the severity of food and nutrition insecurity;
It provides the opportunity to estimate affected populations according to the severity of food
and nutrition security; and
It makes it possible to map food and nutrition situations.
The CH is, to national and regional food crisis prevention and management systems, a comprehensive
analytical framework that takes into account various indicators of food and nutrition security
outcomes and the inference of Contributing Factors. In addition, the CH improves understanding of
concepts, enhances the process for estimating vulnerable populations and strengthens the framework
for synergy among local agents in different countries and at regional level for more effective food crisis
management.
Using the CH helps strengthen the technical skills of national officials and other actors in
multidimensional analysis of food and nutrition security.
Cadre Harmonisé MANUAL Version 1.0
Page | 5
ACKNOWLEDGEMENTS
CILSS wishes to convey its thanks to its technical partners - FAO, WFP, UNICEF, IPC/GSU, JRC/UE, FEWS
NET, Save the Children, Oxfam, ACF - and national systems of the ECOWAS-UEMOA-CILSS region as
well as many national, regional and international actors, for their technical and financial assistance
and for their constant support to the development of the CH.
CILSS also extends its warmest thanks to CH Steering Committee members and the CH Regional
Technical Committee for their constant availability and technical advice.
Lastly, CILSS thanks donors, namely the United States Agency for International Development (USAID),
French Agency for Development (AFD) and the European Union (EU), for their continued commitment
to the development of the CH analysis approach for the ECOWAS-UEMOA-CILSS region.

Cadre Harmonisé MANUAL Version 1.0
Page | 6
List of CH Technical Committee Members and Drafters of the Present Manual:
Abdallah SAMBA, CILSS/AGRHYMET
Amadou Mactar KONATE, PASANAO/ECOWAS
Barbara FRATTARUOLO, ACF Regional Office
Bernardin ZOUNGRANA, CILSS/AGRHYMET
Bernard DEMBELE, CILSS Executive Secretariat
Cédric CHARPENTIER, WFP Regional Office
Ibrahim LAOUALI, Regional FEWS NET
Issoufou BAOUA, CILSS/AGRHYMET
Madeleine Evrard DIAKITE, Oxfam
Maty BA DIAO, CILSS/AGRHYMET
Naouar LABIDI, WFP Regional Office
Paola CADONI, IPC/GSU, Rome
Papa Boubacar SOUMARE, FAO Dakar
Patricia HOORELBEKE, UNICEF
Patrick DAVID, FAO Dakar
Salif SOW, CTC/CILSS Executive Secretariat
Sébastien SUBSOL, CILSS/AGRHYMET
Sy Martial TRAORE, CILSS/AGRHYMET
Tharcisse NKUNZIMANA, JRC/EC
Abdou Karim OUEDRAGO, FEWS NET
Aïta Sarr CISSE, CILSS Executive Secretariat
Théodore KABORE, CILSS/INSAH

Cadre Harmonisé MANUAL Version 1.0
Page | 7
Table of Contents
I. EXECUTIVE SUMMARY .............................................................................................................. 12
II. INTRODUCTION .......................................................................................................................... 14
2.1. AGRHYMET Regional Centre’s Leadership on Food and Nutrition Security Analysis in the Sahel and West Africa ..................................................................................................................... 14
2.2. Early Warning Mechanisms and Systems ...................................................................................... 14 2.3. What Is the Cadre Harmonisé? ...................................................................................................... 15 2.4. How to Use the CH Manual? ................................................................................................. 16
III. ISSUES AND CHALLENGES FACED BY THE CH FOR CILSS/ECOWAS /UEMOA COUNTRIES .......................... 16
3.1. What is the Purpose of the Cadre Harmonisé? ..................................................................... 16 3.2. CH’s Added Value .................................................................................................................. 17 3.3. Compatibility with IPC 2.0 ..................................................................................................... 17 3.5. CH Sequence Calendar .......................................................................................................... 18 4.1. Guiding Principles .................................................................................................................. 19 4.1.1. Principle for CH Institutional Anchoring ................................................................................ 19 4.1.2. Principle of Neutrality in Analysis .......................................................................................... 19 4.1.3. Principle of Pro-Active communication of the CH Result s ................................................... 19 4.2. Alignment with the Charter for Food Crisis Prevention and Management in West Africa ... 19 4.3. National Analysis Cell ............................................................................................................ 20 4.4. Minimal Standards for CH Deployment ................................................................................. 20 4.5. CH’s Institutional Support ..................................................................................................... 21 4.5.1. Actors ..................................................................................................................................... 21 4.5.2. Roles and Responsibilities of Various Actors ......................................................................... 21 4.5.2.1. Government Structures .......................................................................................................... 21 4.5.2.2. Technical and Financial Partners ........................................................................................... 21 4.5.2.3. Sub-Regional Organizations (CILSS, ECOWAS, UEMOA) ........................................................ 22
V. BASIC CONCEPTS AND ANALYTICAL FRAMEWORK .............................................................................. 22
5.1. Definition of Terminologies and Key Concepts ..................................................................... 22 5.2. The CH Analytical Framework ............................................................................................... 23 5.2.1.1. Food Consumption ................................................................................................................. 25 5.2.1.2. Livelihood Change (assets and coping strategies) ................................................................. 26 5.2.1.3. Nutritional Status .................................................................................................................. 27 5.2.1.4. Mortality ................................................................................................................................ 28 5.2.2. Overview of Direct and Indirect Evidence of Food Security Outcomes ................................ 29 5.2.3. Contributing Factors of Food and Nutrition Security ............................................................ 31 5.2.3.1. Causal Factors ........................................................................................................................ 31 5.2.3.2. Impact on Food and Nutrition Security Dimensions .............................................................. 32 5.2.4. Impacts of Contributing Factors and Other Indirect Evidence .............................................. 32
VI. CLASSIFYING ACUTE FOOD INSECURITY ......................................................................................... 33
6.1. Classification Procedures ....................................................................................................... 34 6.2. Step 1: Evidence Inventory .................................................................................................... 34 6.3. Step 2: Evidence Analysis ...................................................................................................... 38 6.4. Step 3: Consolidation and Area Classification ....................................................................... 42 6.4.1. Sub-Step 3.1: Synthesis and Classification of Current Situation ........................................... 42 6.4.2. Sub-Step 3.2: Synthesis and Classification of Projected Situation ........................................ 44 6.4.3. Step 4: Estimation of Populations Affected by Food and Nutrition Insecurity ..................... 45
Cadre Harmonisé MANUAL Version 1.0
Page | 8
6.4.3.1. Sub-Step 4.1: Shock Inventory ............................................................................................... 45 6.4.3.2. Sub-Step 4.2: Impact Assessment and Identification of Most Affected Groups ................... 45 6.5. Mapping the Food Security Situation .................................................................................... 49
VII. COMMUNICATING CH RESULTS.................................................................................................... 49
7.1. Validating Analysis Results .................................................................................................... 49 7.2. Completing the Communication Template ........................................................................... 50 7.3. Communicating to Decision Makers ...................................................................................... 52 7.4. Communicating to All Partners ............................................................................................. 53
VIII. ENSURING ANALYSIS QUALITY AND RIGOR .................................................................................... 53
8.1. The CH Technical Committee ................................................................................................ 53 8.2. The CH Steering Committee .................................................................................................. 53
IX. STRATEGIC FRAMEWORK FOR OPTIMAL USE OF CH ........................................................................... 54
X. CONCLUSION ......................................................................................................................... 55
LIST OF ANNEXES
Annex 1: Elements of IPC 2.0 58
Annex 2: Guidelines CH National Cell 62
Annex 3: Consensus and Convergence of Evidence 63
Annex 4: FCS-WFP-CH 65
Annex 5: HEA Elements 66
Annex 6: CH Caloric Proxies 68
Annex 7: Elements of Nutrition 69
Annex 8: Indirect Evidence/Contributing Factors 73
Annex 9: Inventory of Evidence Table 74
Annex 10: Analysis of Key Evidence Table 78
Annex 11: The 20% Rule 82
Annex 12: Synthesis and Classification Table 83
Annex 13: Estimation of Populations 85
Annex 14 : Communication Template 86
Additive Notice No 1 94
Annex 15: CH Reference table 97

Cadre Harmonisé MANUAL Version 1.0
Page | 9
LIST OF FIGURES
Figure 1: Relational Chain Between National Early Warning Systems and the PREGEC 14
Figure 2: Main Stages of the Analysis-Intervention Continuum 15
Figure 3: Main Steps of CH Implementation 16
Figure 4: Analytical Framework for FNS Severity Classification 24
Figure 5: The 5 steps of CH Analysis 33
Figure 6: Strategic Framework for Optimal Use of CH Results 53
LIST OF TABLES
Table 1: Calendar of Analysis Cycles and Meetings 18
Table 2: Food Consumption Outcome Indicators 25
Table 3: Indirect Evidence of Food Consumption 26
Table 4: Livelihood Change Outcome Indicators 26
Table 5: Nutritional Status Outcome Indicators 28
Table 6: Indirect Evidence of Nutritional Status 28
Table 7: Mortality Outcome Indicators 28
Table 8: Description of Food Insecurity Severity Classification Phases 29
Table 9: Food Security Outcome Indicators’ Classification Scale Used for Phasing (Direct Evidence) 29
Table 10: CH Acute Food Insecurity Reference Table for Area Classification: Indirect Evidence with
Thresholds 30
Table 11: Acute Food Insecurity Reference Table – Indicative Classification of the Impacts of Indirect
Evidence and Contributing Factors on the Overall Phase of a Zone
32
Table 12: Inventory of Evidence about FNS Outcomes (Step 1, Table 1) 35
Table 13: Inventory of Evidence about Contributing Factors (Step 1, Table 1) 36
Table 14: CH Criteria for Assigning Evidence Reliability Score 37
Table 15: Analysis of FNS Outcome Indicators (Step 2, Table 2) 39
Table 16: Analysis of Contributing Factors’ Impacts on FNS Outcomes (Step 2, Table 2) 40
Table 17: Criteria for Corroborating Evidence for Confidence Levels 41
Table 18: Synthesis and Classification of Current Situation (Step 3, Table 3) 42
Table 19: Synthesis and Classification of Projected Situation (Step 3, Table 3) 43
Table 20: Classification of Household Groups in Descending Order 45
Table 21: Estimation of Populations Affected by Food and Nutrition Insecurity in Current Situation
(Step 4, Table 4) 46
Table 22: Estimation of Populations Affected by Food and Nutrition Insecurity in Projected Situation
(Step 4, Table 4) 47
Table 23: Recommended Color Code for Mapping Results of Area Classification 48
Table 24: Summary of Results from Analysis of Areas at Risk of Food and Nutrition Insecurity
and Populations Affected (Part A) 50
Table 25: Summary of Results from Analysis of Areas at Risk of Food and Nutrition Insecurity and
Populations Affected (Part B) 51

Cadre Harmonisé MANUAL Version 1.0
Page | 10
ACRONYMS & ABBREVIATIONS
ACF Action contre la Faim / Action against Hunger
AFD Agence française de développement / French Agency for Development
AfDB African Development Bank
AGRHYMET Agriculture, Hydrology, Meteorology
ARC AGRHYMET Regional Centre
BMI Body Mass Index
BOAD Banque ouest-africaine de développement / West African Development Bank
CH Cadre Harmonisé (Harmonized Framework)
CILSS Comité permanent Inter-États de lutte contre la sécheresse dans le Sahel / Permanent
Interstate Committee for Drought Control in the Sahel
cm Centimeter
CMR Crude Mortality Rate
CNA Cellule nationale d’analyse (National Analysis Cell)
CP Convergence des preuves / Convergence of Evidence
CRENAM Centre de récupération nutritionnelle ambulatoire modérée (Outpatient Intensive Nutritional
Rehabilitation Center for Moderate Malnutrition)
CRENAS Centre de récupération nutritionnelle ambulatoire sévère (Outpatient Intensive Nutritional
Rehabilitation Center for Severe Malnutrition)
CRENI Centre de récupération nutritionnelle intensive (Intensive Nutritional Rehabilitation Center)
CSI Coping Strategy Index
CSO Civil Society Organization
DFID Department for International Development (UK)
ECOWAS Economic Community of West African States
EC European Commission
EU European Union
EWS Early Warning System
FANTA Food And Nutrition Technical Assistance
FAO Food and Agriculture Organization (of the United Nations)
FCS Food Consumption Score
FEWS NET Famine Early Warning Systems Network
FI Food Insecurity
FNS Food and Nutrition Security
FSC Food Security Cluster
GAM Global Acute Malnutrition
gFSC Global Food Security Cluster
GIEWS Global Information and Early Warning System
HDDS Household Dietary Diversity Score
HEA Household Economy Approach
HHS Household Hunger Scale
IBIMET Institute of Biometeorology
IDB Islamic Development Bank
IFPRI International Food Policy Research Institute
IGO Inter-Governmental Organization
INSAH Institut du Sahel (Sahel Institute)
IPC/GSU Integrated Food Security Phase Classification/Global Support Unit
IYCF Infant and Young Child Feeding
JRC/EC Joint Research Centre/European Commission
LMIS Livestock Market Information System
Cadre Harmonisé MANUAL Version 1.0
Page | 11
LPD Livelihoods Protection Deficit
LHZ Livelihood Zone
MIFRAC Mission française au CILSS (French Mission to CILSS)
MIS Market Information System
MUAC Mid-Upper Arm Circumference
MWG Multidisciplinary Working Group
N/A Not Applicable
NDVI Normalized Difference Vegetation Index
NGI Normalized Growth Index
NGO Non-Governmental Organization
OA Outcome Analysis
OCHA Office for the Coordination of Humanitarian Affairs (UN)
PAS Permanent Agricultural Survey
PASANAO Programme d’appui à la sécurité alimentaire et nutritionnelle en Afrique de l’Ouest (Food and
Nutrition Security Support Programme in West Africa)
PREGEC Prévention et gestion des crises (Crisis Prevention and Management)
PRESANCA Programa Regional de Seguridad Alimentaria y Nutricional para Centroamérica (Regional Food
Security and Nutrition Programme for Central America)
R Reliability
RAAF Regional Agency for Agriculture and Food
RPCA Réseau de prévention des crises alimentaires (Food Crisis Prevention Network)
SCF Save the Children Fund
SD Survival Deficit
SINCA Sistema de la Integración Centroamericana (Central American Integration System)
SMART Standardized Monitoring and Assessment of Relief and Transitions
sNDVI Standardized Normalized Difference Vegetation Index
SNU Système des Nations Unies (United Nations System)
TC-CH Technical Committee of the Cadre Harmonisé
TFP Technical and Financial Partner
U5MR Under 5 Mortality Rate
UEMOA Union économique et monétaire ouest-africaine / West African Economic and Monetary Union
UNDP United Nations Development Programme
UNICEF United Nations Children’s Fund
USAID United States Agency for International Development
VCI Vegetation Condition Index
W Wealthy
WFP World Food Programme

Cadre Harmonisé MANUAL Version 1.0
Page | 12
I. EXECUTIVE SUMMARY
Facing recurrent food and nutrition insecurity affecting Sahelian and West African populations, governments and their development partners have set up mechanisms to monitor food situation. However, these mechanisms do not use the same methodological approaches, which often lead to results that are difficult to compare and which at times are even contradictory.
Aware of this situation and the need to find a suitable solution, CILSS member states and partners have initiated the development of a Cadre harmonisé d’identification et d’analyse des zones à risque et des populations en insécurité alimentaire et nutritionnelle au Sahel et en Afrique de l’Ouest (Harmonized Framework for Identification and Analysis of Areas at Risk of and Populations Affected by Food and Nutrition Insecurity in the Sahel and West Africa). This tool, known as “Cadre Harmonisé” (CH), is expected to serve as a framework for countries to assess food and nutrition insecurity on an objective and consensual basis.
The purpose of the Cadre Harmonisé is to help countries prevent food crises better and, where appropriate, quickly identify affected populations and appropriate measures to improve their food and nutrition security. The related method has been developed by a group of food and nutrition security experts from CILSS, FAO, WFP, FEWS NET, AFD, IPC/GSU, JRC/EC and UNICEF, and from international NGOs Oxfam International, Save the Children and ACF1.
It is worth recalling that starting from 2008, various meetings held by the CH Technical Committee agreed for the CH to include some elements of the Integrated Food Security Phase classification version 1 (IPC 1.0). The IPC is a set of tools and procedures for classifying food and nutrition insecurity severity for decision making. Since the development of a manual for IPC 2.0, discussions have been under way to bring the CH closer to the IPC to incorporate lessons learned that improve comparability of results from the two tools.
Similar to the IPC, the Cadre Harmonisé seeks to make best use of a set of tools and procedures for classifying the nature and severity of current and projected food and nutrition insecurity situations on the basis of a consensual analytical framework and classification scale. The CH is based on the following four conceptual models commonly used by national, regional and global mechanisms:
Risk = f (Hazard, Vulnerability)
Sustainable Livelihoods Framework
The UNICEF Nutrition Conceptual Framework
The four dimensions of food security (availability, access, utilization, and stability)
The CH therefore is an integrated analytical framework built on a technical consensus that seeks to make best use of data from all systems or methods, namely food consumption surveys, nutrition surveys, the Household Economy Approach (HEA) or other information provided by agricultural surveys and market monitoring. The CH assesses food and nutrition insecurity, based on convergence of evidence from several indicators.
The CH uses a food insecurity severity scale with five phases. Such a severity scale, which is an international one, makes it possible to make comparisons between countries of the sub-region and also at global level.
CILSS was mandated to develop and implement the CH as a common tool for Sahelian and West African countries. Its analysis cycles will from now on help develop regional mapping of current food and nutrition situations and analyze projected situations.
1 Other institutions such as MIFRAC, IBIMET and CARE International initially contributed to the development of the present
analytical framework.

Cadre Harmonisé MANUAL Version 1.0
Page | 13
The CH also seeks to strengthen the regional integration framework in the CILSS-ECOWAS-UEMOA region so that collaborative and harmonized analyses of food and nutrition situations are conducted through the best possible use of other tools and analysis methods developed by national mechanisms and partners.
Given the importance of the process of harmonizing the analytical framework for food and nutrition situations in West Africa, it is necessary that all food and nutrition security stakeholders take ownership of it and make it their decision-making tool. Furthermore, efforts are needed to strengthen the partnership framework within countries and to support the operations of early warning systems in order to improve the collection of reliable data.
CH implementation relies on existing data collection mechanisms. Efforts should be made by countries and partners to provide financial support to these mechanisms - as CH implementation will from now on be the baseline reference for activating regional food reserves and mobilizing technical and financial partners (TFPs).
Cadre Harmonisé MANUAL Version 1.0
Page | 14
II. INTRODUCTION
2.1. AGRHYMET Regional Centre’s Leadership on Food and Nutrition Security Analysis in the Sahel and West Africa
Since it was established in 1973, CILSS, through the AGRHYMET Regional Centre (ARC), has strengthened the capacity of national structures to collect, transmit, process and centralize data and disseminate information on food and nutrition security and natural resources management. It has set up and promoted, in collaboration with its partners (FAO/GIEWS, FEWS NET, WFP, etc.), both at national and regional level, mechanisms for early warning, prevention, food crisis management and household vulnerability monitoring.
2.2. Early Warning Mechanisms and Systems
Spurred on by CILSS/ARC, multidisciplinary working groups (MWGs) have been established since the 1980s through inter-ministerial decrees in the nine Sahelian countries. The groups are responsible for conducting agro-hydro-meteorological monitoring and assessing agro-pastoral seasons and agricultural markets. Information bulletins on agro-pastoral seasons are published regularly every 10 days, distributed by the MWGs. This contributes to advisory support from and decision-aiding process by governments and partners at local and national level.
The MWGs are the core groups of Early Warning Systems (EWS) in the Sahel, as a result of their drive over the last 30 years. They play a big part in regular dissemination of early warning information and the operations of national EWS.
At the regional level, monthly agro-hydro-meteorological information bulletins on agro-pastoral seasons are published regularly and distributed by ARC to users. FEWS NET and FAO/GIEWS on their part produce and distribute early warning bulletins. Similarly, briefing meetings open to partners based in Niamey (FEWS NET, WFP, etc.) are held regularly every 10 days at the ARC to detect anomalies through cartographic monitoring of biophysical and socioeconomic variables. Special warning bulletins are published when needed.
In September and October each year, joint missions of CILSS-FAO-WFP-FEWS NET-Governments are conducted in the 17 CILSS and ECOWAS countries to assess crops.
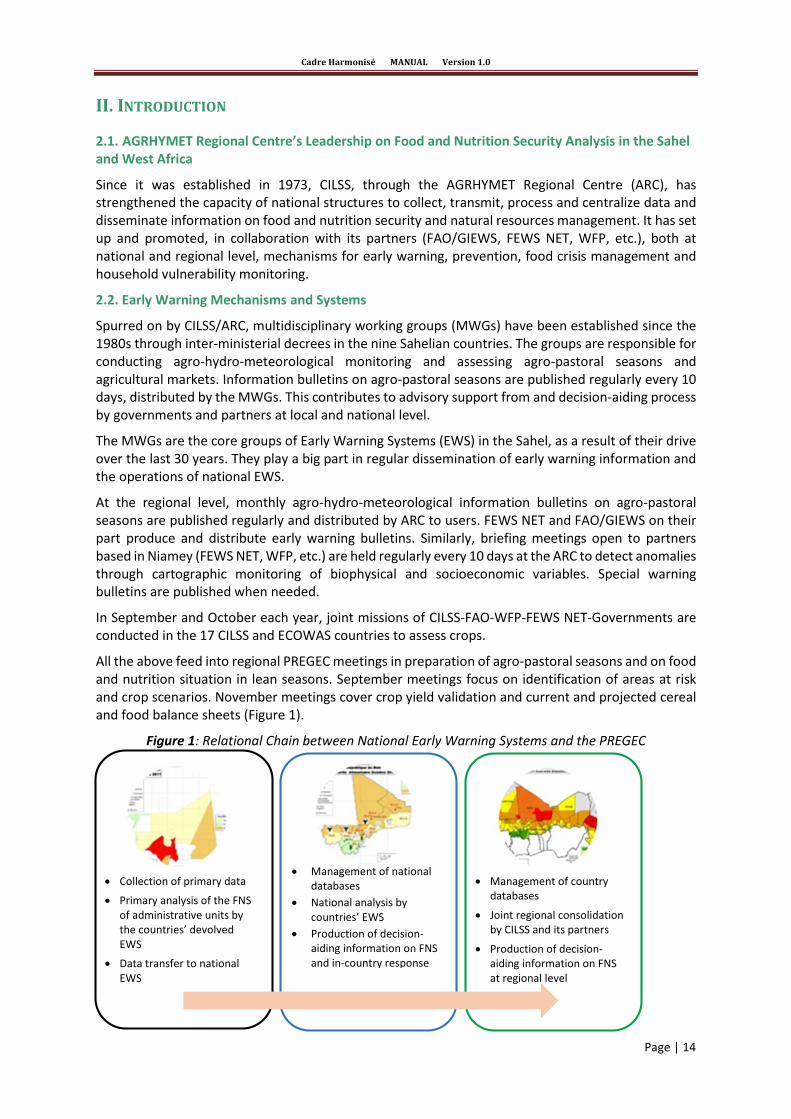
All the above feed into regional PREGEC meetings in preparation of agro-pastoral seasons and on food and nutrition situation in lean seasons. September meetings focus on identification of areas at risk and crop scenarios. November meetings cover crop yield validation and current and projected cereal and food balance sheets (Figure 1).
Figure 1: Relational Chain between National Early Warning Systems and the PREGEC
Collection of primary data
Primary analysis of the FNS of administrative units by the countries’ devolved EWS
Data transfer to national EWS
Management of national databases
National analysis by countries’ EWS
Production of decision-aiding information on FNS and in-country response
Management of country databases
Joint regional consolidation by CILSS and its partners
Production of decision-aiding information on FNS at regional level

Cadre Harmonisé MANUAL Version 1.0
Page | 15
By the late 1990s, however, these various tools proved insufficient to handle food crises, due to factors causing them. It was in that context that the CH was thought of and developed - to address such limitation.
2.3. What Is the Cadre Harmonisé?
The CH is a unifying tool that enables to classifing the nature and severity of acute food insecurity during assessments of current and projected food and nutrition security situations. It is a process that permits achieving technical consensus and which makes best use of information generated by existing information systems, surveys on vulnerability to food and nutrition insecurity, findings from household economy analysis, market monitoring, other rapid surveys and assessments, expert knowledge, etc.
The CH also enables a coherent analysis and communication of situational analysis of food and nutrition insecurity. It provides protocols that are crucial to situational analysis. It also constitutes a platform that enables response (which is beyond the scope of the CH) conforming to the following steps: Intervention analysis; Intervention planning; Intervention implementation; and Surveillance/evaluation (Figure 2).
Figure 2: Main Stages of the Analysis-Intervention Continuum
The general process for using the CH is made up of six main stages, which go hand in hand with the present manual (Figure 3). Conforming to these phases fosters analysis based on convergence of evidence, technical consensus and correlation between information and intervention, each of these point strengthening the CH’s technical integrity.
Situational Analysis
Intervention Analysis
Intervention Planning
Intervention Implementat
ion
Surveillance/Evaluation

Cadre Harmonisé MANUAL Version 1.0
Page | 16
Figure 3: Main Steps of CH Implementation
The CH has been developed to take into account a large variety of information systems and analytical approaches. Most countries experiencing food insecurity problems or recurrent humanitarian crises have specific information systems ranging from informal or minimal systems to very rigorous and comprehensive ones. The CH was conceived to rely on such information systems that exist in the countries to pull them all together and facilitate data usage and integrated analysis in a rigorous and coherent manner.
2.4. How to Use the CH Manual?
The present manual is intended for professionals who wish to further enhance their knowledge and also for those who use the CH during assessments and analysis of the food and nutrition security of a region or country. Future CH Manual users should first be trained on the CH process.
The Manual is composed of nine chapters that can be grouped into four main parts: Analytical framework; Classification methods; Communication; Quality assurance. Chapters I, II and III provide an overview of the objectives and basic principles necessary for understanding the dynamics of the CH in Sahelian and West African countries. Chapters IV, V and VI define the analytical framework and classification techniques for food and nutrition insecurity. Chapter VII provides some guidance on how to communicate CH results to various partners. Chapter VIII provides basic elements for ensuring that the analysis results are of good quality. Lastly, Chapter IX offers the strategic framework for making best use of CH results.
The present version 1.0 of the CH Manual will be updated regularly through users’ comments during CH implementation and through any methodological progress achieved regarding the indicators used. The updating mechanism falls under the responsibility of the TC-CH.
III. ISSUES AND CHALLENGES FACED BY THE CH FOR CILSS/ECOWAS /UEMOA COUNTRIES
3.1. What is the Purpose of the Cadre Harmonisé?
The CH has been developed to consolidate complex analyses of food and nutritional security to better assist decision making. It seeks to provide answers to key questions asked by decision makers during food and/or nutrition crises: Where to allocate resources? Whom to intervene for? How many people to assist?
1
Setting up a National Analysis
Cell
2
Training national officials
3
Data collection and compilation
4
CH situation analysis at country
level
5
Regional-level consolidation and validation by CH
Technical Committee (TC)
6
Communicating CH analysis

Cadre Harmonisé MANUAL Version 1.0
Page | 17
3.2. CH’s Added Value
The CH has been developed to enable greater comparability of results over space (among countries) and over time (for different periods) due to analytic rigor, transparency, and data quality and reliability.
The main advantage of the CH lies in the fact that it relies on convergence of evidence: Using food and nutrition security outcome indicators corroborated by relevant and objective Contributing Factors. It is considered to be a relatively impartial tool to define analysis conditions that are applicable to administrative units (levels 2 and 3) and to get to population estimation per food and nutrition insecurity severity rating. Indicators used are defined for CH analysis and their reliability is determined by the National Analysis Cell (CNA in French).
All analysts have easier access to information on areas and populations concerned. This enables them to gain shared understanding of the main problems occurring within the administrative units being analyzed. Participants generally have clear and advanced knowledge of local conditions and risks of misjudgment - based on social and cultural perceptions that can influence analysts’ conclusions and decisions.
3.3. Compatibility with IPC 2.0
The IPC is an international initiative by 11 organizations (ACF, CARE, CILSS, FEWS NET, FAO, JRC/EU, Oxfam, WFP, Save the Children, Global Food Security Cluster, SICA/PRESANCA) aimed at classifying food and nutrition insecurity severity through a set of protocols (tools and procedure). The CH and IPC have a similar objective, which helped to bring them closer to one another. Today they share the following features:
Analytical framework2
Classification scale
Mapping protocol
The CH and IPC also share other conceptual frameworks commonly recognized in the areas of food security analysis, nutrition and livelihoods, and used by national, regional and international mechanisms:
Risk = f (Hazard, Vulnerability)3
Sustainable Livelihoods Framework4
The four dimensions of food security: Availability, Access, Utilization, and Stability (FAO 2006)
The UNICEF Nutrition Conceptual Framework (UNICEF, 1996)
In their analysis and classification, both tools use indicators by area and household group. They all value convergence of evidence. However, CH uses additional indicators developed from optimal use of gains from information mechanisms in the region. For further details on the compatibility between the CH and IPC, please refer to Annex 1 (see Annex 1).
3.4. Partnership
Issues related to technical and financial partnerships are: (1) Ensuring sustainable funding of the implementation; (2) Ensuring ownership by the various states; (3) Ensuring inclusive participation of the different partners; (4) Making the CH a consensual reference tool for food and nutrition insecurity analysis.
2 The analytical framework proposed recently as guide to CH analysis is the one developed under IPC 2.0 (IPC Manual version
2.0, September 2012). http://www.ipcinfo.org/fileadmin/user_upload/ipcinfo/docs/IPC-Manual-2-Interactive.pdf 3 White, 1975: Turner et al. 2003 4 Sen, 1981; Frankenberg, 1992; Save the Children (SCF)-United Kingdom, 2000; DFID, 2001

Cadre Harmonisé MANUAL Version 1.0
Page | 18
CH stakeholders are:
At national Level: Policy makres, the civil society, professional bodies, national technical services (EWS, MIS, PAS, LMIS, FNS, etc.), technical and financial partners and non-state actors (local and international NGOs, farmers organizations, the private sector, etc.). In-country actors will be involved in all stages of CH implementation and will be benefit from capacity-building activities.
At regional level: CILSS, ECOWAS, UEMOA and international NGOs - to support CH implementation.
At international level: USAID, EU, AFD, FAO, WFP, UNICEF, FEWS NET, IPC/GSU, JRC/EU and international NGOs – due to their leadership of initiatives to prevent and manage food crises through emergency-rehabilitation interventions and building resilience among vulnerable populations.
3.5. CH Sequence Calendar
The CH calendar meshes with the technical consultation cycles of the PREGEC and RPCA. Timelines agreed in a concerted manner are established based on stakeholder requirements. The timelines are as follows:
Validating yield estimates and providing cereal and food balance sheets in November;
Validating actual yields and cereal and food balance sheets and analyze food and nutrition security at the onset of the lean season in March;
Holding a restricted meeting of the Food Crisis Prevention Network (RPCA in French) in April;
Preparing the agro-pastoral season and analyzing food and nutrition security during the lean season in June;
Establishing crop scenarios, early identification of areas at risk and food and nutrition security analysis at the end of the lean season in September; and
Organizing the international RPCA meeting in December.
The CH is implemented twice a year so that analysis results can be shared at the PREGEC meetings of November and March. The outcomes of these two meetings - held in November and March – also feed into the RPCA meetings of December and April. The two analysis cycles must therefore take place in November (after publication of yield estimates and results of nutrition and market surveys) and March (after publication of actual yields and new nutrition surveys). If necessary, a third updating phase of the CH analysis could be organized in June depending on the availability of new data (Table 1).
Each CH analysis cycle consists of the following four phases:
Training-retraining national analysts;
Data Collection and compilation by the CH National Analysis Cell;
National analysis in which data are analyzed and a vulnerability map established for the country; and
Regional consolidation to help compile and analyze national results and develop a regional map.

Cadre Harmonisé MANUAL Version 1.0
Page | 19
Table 1: Calendar of Analysis Cycles and Meetings
Jan. Feb. Mar. Apr. May Jun. Jul. Aug. Sept. Oct. Nov. Dec.
Data collection
National Analysis
Regional Consolidation
PREGEC
RPCA CH Technical Committee Ad hoc
CH Steering Committee Ad hoc
IV. CH PRINCIPLES
4.1. Guiding Principles
The CH Technical Committee has defined a set of guiding principle to ensure on the fact that implementation falls within the context of a common inter-institutional approach. These principles aim to ensure that: (1) The process is sustainable; (2) National governments own it in synergy with their partners; and (3) The process respects existing mechanisms and other ongoing initiatives in the same domain.
4.1.1. Principle for CH Institutional Anchoring
Leadership of the CH process is provided by the national service that coordinates the information system on food and nutrition security.
All efforts should be made to involve governments and strengthen their capacity, encourage ownership and strengthen the institutional process.
The CH process must provide for a mechanism that strengthens governments’ institutional commitment through the formal establishment of a legal national analysis cell (see 4.3.).
4.1.2. Principle of Neutrality in Analysis
CH analysis must be subject to technical consensus among all experts (analysts) and be performed technically in a neutral way.
CH thrives off of contributions from as many maximum stakeholders as possible.
4.1.3. Principle of Pro-Active communication of the CH Result s
Three key principles to ensure better communication:
Analysis results must be communicated effectively to political decision -makers to help in terms of decision making.
Analysis results are the reference used for raising donors’ awareness, conducting advocacy work and mobilizing resources that match identified needs.
Analysis results must be widely disseminated, including to the public.
4.2. Alignment with the Charter for Food Crisis Prevention and Management in West Africa
The provisions of the Charter aim to improve the effectiveness and efficiency of food crisis prevention and management mechanisms in ECOWAS, UEMOA and CILSS member countries. The parties concerned abide by the nine established principles, including the civil society which must be involved in food and nutrition assessments and definition of actions and their implementation and assessment. Relying on these principles, they recognize that any action taken to prevent and manage food crises must revolve around the following main pillars:
Cadre Harmonisé MANUAL Version 1.0
Page | 20
Pillar 1: Information and analysis of the food and nutrition situation.
Pillar 2: Consultation and coordination.
Pillar 3: Consensual analysis for choosing food and nutrition crisis prevention and management tools.
The CH has been developed to meet these demands for information production and consensual analysis of food and nutrition situation (Pillar 1) in the CILSS-ECOWAS-UEMOA region. This constitutes a prerequisite to good analysis for selecting tools (Pillar 3).
4.3. National Analysis Cell
In each country, a National Analysis Cell (CNA in French) must be created to handle the implementation of the CH. The CNA is the body responsible for collecting thematic data (evidence) on various sectors and components of food and nutrition security in a given country, and organizing such data into structured databases. The CNA also analyzes the data during national CH cycles with the view to publishing consensual information and maps on areas and populations affected by food and nutrition insecurity. The CNA is the only body that can produce, validate, disseminate and share consensual maps and results from national CH analysis cycles. General guidelines for establishing CNAs are provided in Annex 2.
The composition of the CNA is left to the discretion of each country, but it must be, as a general rule, made up of a maximum of 30 persons from services and organizations working in the field of food and nutrition security:
Departments in charge of early warning systems, agricultural statistics, horticulture statistics, livestock statistics, external trade statistics, customs, meteorology, nutrition, animal health, cereal and livestock market information systems, plant protection, water resources; the Directorate in charge of poverty monitoring; the National Directorate of Statistics;
National and international NGOs; and
Country offices of UN System (WFP, FAO, UNICEF, OCHA, etc.).
The National Analysis Cell is coordinated by the national department in charge of food and nutrition security information. The said department ensures that all actors/stakeholders are represented adequately.
4.4. Minimal Standards for CH Deployment
Analysts have the duty to observe neutrality and be independent-minded in the quest for consensus. Standards are intended to be general and applicable to all cases where CH analyzes are conducted.
The following standards are required for smooth running of the CH analysis process:
The analysis unit includes all technical experts working in areas related to food and nutrition security;
Members of the analysis unit must share in full transparency the body of evidence that enables current and projected situation analysis;
Analysts have to work together as a team to produce reliable information that reflect to the maximum extent possible the reality of food and nutrition situation, based on reliable evidence and using a participatory, inclusive and consensual approach.
In some countries, local specific factors (lack of reliable or updated data, etc.) can prevent the application of all required standards. In such a case, there is a need to ensure that the food and nutrition situation analysis conforms to the guidelines on consensus provided in the present manual (see Annex 3).

Cadre Harmonisé MANUAL Version 1.0
Page | 21
4.5. CH’s Institutional Support
4.5.1. Actors
In many countries, there are several government technical services, NGOs and other specialized institutions that provide information on food situation (food availability, price and flow of food items on the markets, access to food, groups affected by food insecurity, and the effects of past crises) and nutrition (access to food, health systems, clean environment and care practices).
Making appropriate use of secondary information, when analyzing a food and nutrition situation, allows for focus on what is essential in the new situation. Decisions taken after the results of the CH are based on a demonstrated understanding of the quality and hence the reliability of information sources provided to the teams of analysts.
To effectively conduct a meaningful analysis, close coordination and collaboration among all partners are needed. In the same vein, coordination with authorities and other organizations and institutions involved in the analysis is a necessary condition for achieving satisfactory results, avoiding duplication of efforts, and optimizing the quality of data on food security and nutrition, even on humanitarian assistance.
Public sector actors, UN agencies, NGOs and associations, specialized Institutions, TPFs and other FNS actors therefore have responsibilities related to the implementation of CH cycles.
4.5.2. Roles and Responsibilities of Various Actors
To ensure that data collected enable conducting a meaningful analysis of the food and nutrition situation, the government structure in charge of CH coordination (lead structure) manages the current database (evidence) provided by other government structures and partners, whether or not such partners are members of the network of the national early warning system. The above-mentioned lead structure coordinates the activities of the CH national analysis cell.
4.5.2.1. Government Structures
Other government structures (national technical directorates within ministries and other specialized government services) are required, whenever necessary, to provide the lead structure with updated data that can be fed into the CH analyzes. As such, the CH national analysis cell collects existing data, conducts analysis following the approach described in the present manual, and is accountable for the quality of results.
Ultimately the onus is on all members of the national analysis cell to adopt good practices of data collection, updating, analysis and archiving. All participating government services shall endeavor to encourage good practices of information sharing and ensure that available data are of good quality, in a format required for the approach, and accessible to facilitate analysis.
4.5.2.2. Technical and Financial Partners
Technical and financial partners (TFPs) are essentially the founding members of the CH Steering Committee (SC) which is responsible for guiding the whole CH process and mobilizing the funds necessary for its implementation. They include USAID, the European Union, French Development Aid, Canadian Development Assistance, etc. Currently, other donors such as BOAD, UNDP, the World Bank, IDB and AfDB have started funding CH activities.
Furthermore, regional and international partners (UNICEF, WFP, FAO, FEWS NET, IPC/GSU, JRC/EC, etc.) and major international NGOs such as Oxfam, Save the Children and ACF are contributing by bearing the costs arising from their experts’ participation in the activities of the CH Technical Committee and in CH training and analysis cycles in different countries.
Cadre Harmonisé MANUAL Version 1.0
Page | 22
It is expected that all these actors provide technical and financial support to CH implementation (collecting data, organizing analyzes at country and regional level, sharing, conducting advocacy work, communicating results, etc.).
4.5.2.3. Sub-Regional Organizations (CILSS, ECOWAS, UEMOA)
Sub-regional organizations (CILSS, ECOWAS, and UEMOA), which serve the countries, are important channels in all advocacy and awareness-raising processes aiming to secure national authorities’ ownership of the CH which is the tool for activating regional food reserves.
V. BASIC CONCEPTS AND ANALYTICAL FRAMEWORK
5.1. Definition of Terminologies and Key Concepts
The analytical approach of the CH has been developed on the basis of the IPC 2.0 model and uses some basic concepts for conducting situation analysis.
Meta-analysis: The CH relies on a set of protocols that enables a “big picture analysis” of food and nutrition security. Called “meta-analysis”, it draws from different types of information which are gathered from a wide range of contexts and which provide essential and comparable information in a coherent manner.
Convergence of evidence: It is a complex process that must lead to technical consensus among analysts and which requires that all evidence available for the analysis are reviewed by each participant in the most objective manner possible. With convergence of evidence, analysts should be able to explain food and nutrition insecurity outcomes and severity on the basis of consensus-based substantiated arguments, without questioning final conclusions reached by consensus. To reach these conclusions based on convergence of evidence, it is highly recommended to remember the rules for analysis and review of evidence to be observed at the start of any CH cycle (see Annex 3).
The CH is not a mathematical exercise; it is the translation of conclusions drawn from convergence of evidence from available data; convergence of evidence meaning that a majority of evidence converges on a specific conclusion even though some indicators may differ.
Technical consensus: It is about agreeing on common goals and progressively developing proposals that rely on objective analysis based on reliable evidence. The desired consensus is not about agreeing on everything, nor is it intended to avoid conflicts of ideas or abuse of power. To achieve it, good faith is required from each analyst, as well as inclusive participation and intellectual efforts to listen to and try to understand arguments developed by other participants. The more diversified the partnership is, the more acceptable the consensus is; diversified partnership understood as diversified composition of national analysis cells reflecting various stakeholder groups (see Annex 3).
Acute and chronic food security: As part of CH implementation, the concepts of acute food insecurity and chronic food insecurity are defined as follows:
Acute food insecurity: A snapshot of the current or projected severity of the situation, regardless of the causes, the context or duration;
Chronic food insecurity: The prevalence of persistent food insecurity - even in the absence of risks/shocks and high frequency of years with acute food insecurity.
CH analysis seeks to assess acute food insecurity. However, it is important to note that acute and chronic food insecurity are not mutually exclusive: a household may, in a specific area, experience both situations simultaneously. It is up to the analyst to carefully examine the nature of links between the occurrences and develop appropriate strategies for action.

Cadre Harmonisé MANUAL Version 1.0
Page | 23
Outcome indicators: These are basic indicators on which the assessment and classification of acute food insecurity are based. They are four in number, namely food consumption, livelihood change, nutritional status and mortality.
Direct evidence: These are elements that enable acquiring information accurately and directly on the status of a food and nutrition security outcome. They measure directly the reference table indicators for the four food security outcomes.
Indirect evidence: These are elements that enable to approach the level of direct evidence of food and nutrition security outcomes. They do not measure directly but provide "indicative" evidence of such outcomes and can be used to infer outcomes.
Contributing factors: These are Causal Factors and impacts on dimensions of food and nutrition security that generate negative or positive changes in food security outcomes.
5.2. The CH Analytical Framework
The CH Analytical Framework is identical to that of IPC 2.0 which is already used by food and nutrition security stakeholders at the global level and in many countries (ref. IPC Manual version 2.0, September 20125).
The Analytical Framework (Figure 4) allows analysts to agree on links between various and complex components of and interactions among food security elements. The framework primarily serves as the basis for classification by food insecurity level or phase.
The Analytical Framework basically consists of four indicators described as "outcome” indicators (food consumption, livelihood change, nutritional status, and mortality) that directly characterize the food security status of a given household or area. The four outcome indicators are complemented by a series of Contributing Factors. The distinction between an outcome indicator and a contributing factor is critical because the two are used differently in the classification process for food and nutrition insecurity.
In general, the Analytical Framework:
Draws together key aspects recognized in the conceptual frameworks for analyzing food security, nutrition and livelihoods;
Enables comparability in the analysis by making the classification with direct reference to actual or inferred outcomes; and
Uses two groups of indicators (outcomes and Contributing Factors) and makes a distinction between primary outcomes (food consumption and livelihood change) and secondary outcomes (nutritional status and mortality rates).
Of the four indicators, only food consumption is exclusively unique to food security. The others can be influenced by Contributing Factors unrelated to food and nutrition security.
5 http://www.ipcinfo.org/fileadmin/user_upload/ipcinfo/docs/IPC-Manual-2-Interactive.pdf

Page | 24
Figure 4: Analytical Framework for FNS Severity Classification

Page | 25
5.2.1. Food and Nutrition Security Outcome Indicators
The Analytical Framework uses four indicators: (1) Food consumption; (2) Livelihood change; (3) Nutritional status; (4) Mortality.
For each indicator, most IPC 2.0 variables (also called “evidence”) are also used in the CH. However, some variables, which are specific to the CH being used in West Africa, have been added (e.g. caloric proxies, percentage of households with borderline or poor food consumption score). It is important to remember that the thresholds adopted result from discussions among regional experts and that they will be subject to review if necessary, as the CH is a dynamic tool. Factors are informed by direct and indirect evidence.
5.2.1.1. Food Consumption
Direct evidence
Household Food Consumption Score (FCS) or percentage of households with borderline and poor scores: This is a method developed by WFP to assess the quantity and quality of food consumption for a specified period (see Annex 4);
Household Dietary Diversity Score (HDDS) - a frequently used method to indicate the quality of food consumption and, to a lesser degree, food quantity;
Household Hunger Scale (HHS) - a method developed by Food And Nutrition Technical Assistance (FANTA) based on perceptions of food insecurity at household levels;
Coping Strategies Index (CSI) relates solely to food consumption. It is a method developed by Maxwell et al. (2008) to monitor household behaviors and indicate degrees of food insecurity when compared over time or with a baseline (a table needs to be developed, to that effect, to display reference thresholds per geographic unit in each country);
Survival Deficit (SD) is the income gap in food and cash necessary to cover 100% of minimum food energy requirements (2,100 kcal/day/person) and meet costs associated with food preparation and consumption (salt, water, soap, etc.);
Livelihood Protection Deficit (LPD) represents the gap in total income required to protect and manage livelihoods (to ensure the basic survival threshold, access basic social services, protect livelihoods in the long term, and achieve an acceptable standard of living).
These two indicators (SD and LPD) are provided by HEA outcome analysis (see Annex 5).
Tables 2 and 3 indicate the classification thresholds for food consumption outcome indicators.
Indirect evidence
The caloric proxy available at administrative levels 1 or 2 estimates the available calories per capita from an area’s food production (see Annex 6). This proxy considers three food groups (cereals, legumes, tubers), which represent a more significant part of energy intake;
Expenditure patterns’ shift towards more economical and less nutritious food;
Number of meals per day;
Number of food groups consumed.

Cadre Harmonisé MANUAL Version 1.0
Page | 26
Table 2: Food Consumption Outcome Indicators
Phase 1 Minimal
Phase 2 Stressed
Phase 3 Crisis
Phase 4 Emergency
Phase 5 Famine
Foo
d C
on
sum
pti
on
HDDS: ≥ 4 food groups and no deterioration for the 12 food groups
HDDS: Deterioration of the index (loss of 1 food group out of 12)
HDDS: Severe deterioration of the index (loss of 2 food groups out of 12)
HDDS: < 4 food groups out 12
HDDS: 1-2 food groups out of 12
FCS: Acceptable consumption; stable
(Poor: < 5%; or Poor + Borderline: < 15%)
FCS: Acceptable consumption (but deteriorating)
(Poor: 05-10%; or Poor + Borderline: 15-30%)
FCS: Borderline consumption
(Poor: 10-20%; or Poor + Borderline: 30% and above)
FCS: Poor consumption
(Poor: > 20%)
FCS: Below Poor consumption
(N/A)
HHS: “None” (score 0)
HHS: “Slight” (score 1)
HHS: “Moderate” (score 2-3)
HHS: “Severe” (score 4-6)
HHS: “Severe” (score 6)
CSI: Reference threshold; stable
CSI: Reference threshold reached but unstable
CSI: > reference and increasing
CSI: Significantly > reference
CSI: Far > reference
HEA: No livelihood protection deficit (LPD) and no survival deficit (SD)
HEA: LPD and no SD
HEA: LPD and SD 1–20%
HEA: LPD and SD 20-50%
HEA: LPD and SD > 50 %
Table 3: Indirect Evidence of Food Consumption
INDIRECT EVIDENCE Phase 1 Phase 2 Phase 3 Phase 4 Phase 5
Caloric proxies (cereals, tubers, legumes)
Caloric proxies: > or = to 2,400 kcal/person/day
Caloric proxies: Between 2,100 and 2,400 kcal/ person/day
Caloric proxies: 1,680 to 2,100 kcal/person/day
Caloric proxies: < to 1,680 kcal/ person/day
Caloric proxies: NA
5.2.1.2. Livelihood Change (assets and coping strategies)
Livelihood change concerns both livelihood assets and coping strategies.
Livelihood assets, which fall within the scope of the sustainable livelihoods approach, are generally grouped into six types of capital:
1. Physical capital (agricultural productive assets, agro-pastoral infrastructure, etc.); 2. Natural capital (livestock water supply, water for irrigation, pasture, etc.); 3. Financial capital (livestock capital, credit, debt, etc.); 4. Human capital (health and education, technical knowledge); 5. Social capital (solidarity networks, cultural networks, etc.); and 6. Political capital (institutions, citizenry, access to political leaders, legal systems, etc.).
Direct evidence
Coping strategies Analyzing coping strategies is about looking into the behavioral aspects of households (type, amount and sources of food, income sources and expenditure patterns of households classified into homogeneous wealth groups).
Indirect evidence
• Asset stripping; • Departure of households; • Availability of pasture; • Access to pasture; • Forage balance sheet;

Cadre Harmonisé MANUAL Version 1.0
Page | 27
Ownership of productive assets (such as bicycles and farming tools, and recent changes of ownership);
Livestock ownership and recent changes in ownership (sale of reproducing female livestock on markets, loss due to disasters and/or epidemics, etc.);
Growth of makeshift housing in unplanned suburban areas; Internally displaced persons / refugee concentrations; Prevalence of extreme behaviors, e.g. begging, prostitution; Change in NGI, NDVI, VCI, sNDVI, availability of pasture; Livestock water points (accessibility, remoteness, availability, etc.).
N.B.: Conditions of use of the HEA are defined in Annex 5 of this manual.
Table 4: Livelihood Change Outcome Indicators
Phase 1 Minimal
Phase 2 Stressed
Phase 3 Crisis
Phase 4 Emergency
Phase 5 Famine
Live
liho
od
Ch
an
ge
Livelihoods: Sustainable livelihood strategies and assets
Livelihoods: Stressed strategies and assets; reduced ability to invest in livelihoods
Livelihoods: Accelerated depletion/erosion of strategies and assets, that will lead to high food consumption deficits
Livelihoods: Irreversible depletion/erosion of strategies and assets, that will lead to very high food consumption deficits
Livelihoods: Near complete collapse of strategies and assets
5.2.1.3. Nutritional Status
Nutritional status is analyzed on the basis of the following indicators (Tables 5 and 6 on page 33) categorized into direct evidence and indirect evidence.
Direct evidence
Global Acute Malnutrition (GAM)
Acute malnutrition is the state of a person affected by recent and significant deterioration of his/her diet and/or health condition, characterized by weight loss (wasting) or bilateral edema (kwashiorkor). In contrast to chronic malnutrition which is characterized by stunting and which take its toll over a long period of time, acute malnutrition usually occurs suddenly after a shock affecting the individual.
Acute malnutrition is measured by weight/height ratio, taking into account age, gender and the presence of edema. With these data, a z-score6 index is developed. Data used in the CH are GAM prevalence in children aged between 6 to 59 months, expressed as z-score according to the WHO 2006 standards.
A faster way to detect acute malnutrition is measuring the mid-upper arm circumference (MUAC). More information about this particular anthropometric measure is provided in the manual’s section on mortality.
Body Mass Index (BMI) for non-pregnant women of 15 to 49 years of age
The Body Mass Index (BMI) is used to measure the nutritional status of adults (excluding pregnant and lactating women whose child is less than six months - as physiological conditions do affect results). It is calculated by dividing weight in kilograms into height in meters squared. In a given population, a proportion of lean adults (percentage of adults with BMI < 18.5 kg/m²)
6 For acute malnutrition, the z-score is the standard weight of the child, compared with the median of the distribution of the weight of children with the same size, age and sex. Its value is expressed as a multiple of standard deviation [SD] also called "standard deviation". On this basis, it is assumed that acute malnutrition is severe when the weight/size ratio is 3 and below the reference median (-3 z-score). Between -3 z-score and -2 z-score, we speak of moderate acute malnutrition. Above -2 z-score, the nutritional status is considered normal.

Cadre Harmonisé MANUAL Version 1.0
Page | 28
may indicate food insecurity or the presence of common infectious diseases (WHO, 1995 and WHO, 1997).
However, unlike acute malnutrition which is influenced by the individual child’s nutrition and health as well as the care provided to him/her, BMI (in adults) is much more dependent on the prevailing food situation.
Indirect evidence
Admissions to nutrition programs (CRENI, CRENAS, CRENAM);
Prevalence of low birth weight (underweight at birth);
Infant and young child feeding (IYCF) practices;
Mid-upper arm circumference (MUAC): MUAC, as a proxy for global acute malnutrition7, reflects the possible impacts of a current situation if no action is taken. Two possibilities exist to assess acute malnutrition from the MUAC. The first approach is to consider the gross value of the measure. Acute malnutrition is severe if the MUAC is less than 115 mm. Acute malnutrition is described as ”moderate” if the MUAC is between 115 mm and 125 mm, and “at risk of malnutrition” if the value is between 125 mm and 135 mm. Beyond 135 mm, the nutritional status is good. The second approach is based on the determination of the z-score as previously described. The z-score is the number of standard deviations between the measurement for a child and the median of the reference population with the same age and sex;
Prevalence of severe acute malnutrition (SAM).
Table 5: Nutritional Status Outcome Indicators
Table 6: Indirect Evidence for Nutritional Status
5.2.1.4. Mortality Two key indicators - as direct evidence – and six indirect evidence have been selected for classifying this indicator of mortality (see Table 7).
Direct evidence
Crude Death Rate (CDR): The mortality rate for all causes of a population. It is measured by the number of deaths per 10,000 inhabitants per day.
7 Explanations provided in Annex 7.
Phase 1 Minimal
Phase 2 Stressed
Phase 3 Crisis
Phase 4 Emergency
Phase 5 Famine
Nu
trit
ion
al S
tatu
s
Global Acute Malnutrition: < 5%
Global Acute Malnutrition: 5-10%
Global Acute Malnutrition: 10-15% or > ordinary and increasing
Global Acute Malnutrition: 15-30% or > ordinary and in progress
Global Acute Malnutrition: > 30%
Prevalence of BMI < 18.5 kg/m²: < 10%
Prevalence of BMI < 18.5 kg/m²: 10-20%
Prevalence of BMI < 18.5 kg/m²: 20-40%, 1.5 times higher than reference
Prevalence of BMI < 18.5 kg/m²: > 40%
Prevalence of BMI < 18.5 kg/m²: Far > 40%
INDIRECT EVIDENCE Phase 1 Phase 2 Phase 3 Phase 4 Phase 5
Nutritional status MUAC: < 5% MUAC: 5%-10% MUAC: 10%-15% MUAC: 15%-30% MUAC: 30% and
above

Cadre Harmonisé MANUAL Version 1.0
Page | 29
Under 5 Death Rate (U5DR): This is the rate of mortality in the population of children under five years of age. It is measured by the number of deaths per 10,000 children under 5 five years of age per day.
Indirect evidence
Infant mortality rate (IMR, under 1 year of age);
Neonatal mortality (under 1 month of age);
Case fatality rate (malaria, measles, diarrhea, acute respiratory infections);
Under 5 death probability;
Severe acute malnutrition;
Body mass index in adults (BMI).
Table 7: Mortality Outcome Indicators
Phase 1 Phase 2 Phase 3 Phase 4 Phase 5 Minimal Stressed Crisis Emergency Famine
Mo
rtal
ity
CDR: < 0.5/10,000/day
CDR: < 0.5/10,000/day
CDR: 0.5-1/10,000/day
CDR: 1-2/10,000/day OR 2 times the reference
CDR: > 2/10,000/day
U5DR: ≤ 1/10,000/day
U5DR: ≤ 1/10,000/day
U5DR: 1-2/10,000/day
U5DR: 2-4/10,000/day
U5DR: > 4/10,000/day
5.2.2. Overview of Direct and Indirect Evidence of Food Security Outcomes
Table 8 below shows the five classification phases of outcome indicators based on the severity of the food and nutrition situation. The description of the classification scales, by phase of food insecurity class, for direct and indirect evidence of food and nutrition security are provided in Tables 8 and 9 respectively.
Table 8: Description of Food Insecurity Severity Classification Phases
Phase Description Priority Response
Objectives
Phase 1: Minimal At least four in five households are able to meet their food and non-food needs without engaging in atypical coping strategies or relying on humanitarian assistance
Action required to build resilience and reduce disaster risk.
Phase 2: Stressed
Even with humanitarian assistance, at least one in five households in the area have the following or worse: reduced and minimally adequate food consumption but unable to afford some essential non-food expenditures without engaging in irreversible coping strategies.
Action required to reduce disaster risk and protect livelihoods.
Phase 3: Crisis
Even with humanitarian assistance, at least one in five households in the area have the following or worse: large food shortages and acute malnutrition at high or higher-than-normal rates; OR are marginally able to meet minimum food needs by depleting livelihood assets, which will lead to food consumption gaps.
Protect livelihoods, prevent malnutrition, and prevent deaths.
Phase 4: Emergency
Even with humanitarian assistance, at least one in five households in the area have the following or worse: extreme food consumption gaps resulting in very high acute malnutrition or excess mortality; OR extreme loss of livelihood assets that will lead to food consumption gaps in the short term.
Save lives and livelihoods.
Phase 5: Famine
Even with humanitarian assistance, at least one in five households in the area have total lack food and/or other basic needs and are clearly exposed to starvation, death and deprivation. (Note: Evidence for all three criteria of food consumption, wasting and CBR are required to classify Famine).
Prevent large-scale deaths and avoid total collapse of livelihoods.

Cadre Harmonisé MANUAL Version 1.0
Page | 30
Table 9: Food and Nutrition Security Outcome Indicators’ Classification Scale Used for Phasing (Direct Evidence)
PHASE DESCRIPTIO
N
Phase 1 Minimal
Phase 2 Stressed
Phase 3 Crisis
Phase 4 Emergency
Phase 5 Famine
Foo
d C
on
sum
pti
on
HDDS: ≥ 4 food groups and no deterioration for the 12 food groups
HDDS: Deterioration of the index (loss of 1 food group out of 12)
HDDS: Severe deterioration of the index (loss of 2 food groups out of 12)
HDDS: < 4 food groups out 12
HDDS: 1-2 food groups out of 12
FCS: Acceptable consumption; stable
(Poor: < 5%; or Poor + Borderline: < 15%)
FCS: Acceptable consumption (but deteriorating)
(Poor: 05-10%; or Poor + Borderline: 15-30%)
FCS: Borderline consumption
(Poor: 10-20%; or
Poor + Borderline: 30% and above)
FCS: Poor consumption
(Poor: > 20%)
FCS: Below Poor consumption
(N/A)
HHS: “None”
(score 0)
HHS: “Slight”
(score 1) HHS: “Moderate” (score 2-3)
HHS: “Severe” (score 4-6)
HHS: “Severe” (score 6)
CSI:
Reference threshold; stable
CSI:
Reference threshold reached but unstable
CSI:
> reference and increasing
CSI: Significantly > reference
CSI:
Far > reference
HEA: No livelihood protection deficit (LPD) and no survival deficit (SD)
HEA: LPD and no SD
HEA: LPD and SD 1–20%
HEA: LPD and SD 20-50%
HEA: LPD and SD > 50 %
Live
liho
od
Ch
ange
Livelihoods: Sustainable livelihood strategies and assets
Livelihoods: Stressed strategies and assets; reduced ability to invest in livelihoods
Livelihoods: Accelerated depletion/erosion of strategies and assets, that will lead to high food consumption deficits
Livelihoods: Irreversible depletion/erosion of strategies and assets, that will lead to very high food consumption deficits
Livelihoods: Near complete collapse of strategies and assets
Nu
trit
ion
al S
tatu
s
Global Acute Malnutrition: < 5%
Global Acute Malnutrition: 5-10%
Global Acute Malnutrition: 10-15% or > ordinary and increasing
Global Acute Malnutrition: 15-30% or > ordinary and in progress
Global Acute Malnutrition: > 30%
Prevalence of BMI < 18.5 kg/m²: < 10%
Prevalence of BMI < 18.5 kg/m²: 10-20%
Prevalence of BMI < 18.5 kg/m²: 20-40%, 1.5 times higher than reference
Prevalence of BMI < 18.5 kg/m²: > 40%
Prevalence of BMI < 18.5 kg/m²: Far > 40%
Mo
rtal
ity
CDR: < 0.5/10,000/day
CDR: < 0.5/10,000/day
CDR:
0.5-1/10,000/day
CDR: 1-2/10,000/day OR 2 times the reference
CDR: > 2/10,000/day
U5DR:
≤ 1/10,000/day
U5DR:
≤ 1/10,000/day
U5DR:
1-2/10,000/day
U5DR:
2-4/10,000/day U5DR: > 4/10,000/day
Regarding data from the Household Economy Approach (HEA), the conditions of use of protection deficit as reference value (which is also valid for the survival deficit) are defined in Annex 5.

Cadre Harmonisé MANUAL Version 1.0
Page | 31
Table 10: CH Acute Food Insecurity Reference Table for Area Classification: Indirect Evidence with Thresholds
OUTCOMES Phase 1 Phase 2 Phase 3 Phase 4 Phase 5
Food Consumption
Caloric proxies: > or = 2,400 kcal/person/day
Caloric proxies: Between 2,100 to 2,400 kcal/person/day
Caloric proxies: s: 1,680 to 2,100 kcal/person/day
Caloric proxies: < 1,680 kcal/person/day
Caloric proxies: N/A
Nutrition MUAC: < 5%
MUAC: 5%-10%
MUAC: 10%-15%
MUAC: 15%-30%
MUAC: 30% and above
5.2.3. Contributing Factors of Food and Nutrition Security
Contributing Factors of food and nutrition security fall within two areas: (1) Causal factors; (2) Impact on the food security dimensions.
5.2.3.1. Causal Factors
Causal Factors include elements of vulnerability and elements related to risk. In this context, vulnerability is defined conceptually in relation to: exposure (does the hazard affect a population and to what extent?), susceptibility (how does the hazard affect livelihoods of a population and to what extent?), and resilience (what is the coping capacity of the population?).
Consistent with the sustainable livelihoods approach, vulnerability can be analytically understood in terms of:
Livelihoods strategy: A behavioral analysis of the type and amounts of food sources, income sources and expenditure patterns of households;
Livelihood assets: A structural analysis of the six types of capital - physical, natural, financial, human, social and political – which are required for sustaining household livelihoods;
Policies, institutions and processes: A social, political and economic analysis of how these aspects impact the food security dimensions.
The other element of Causal Factors consists of acute events or ongoing conditions, such as natural disasters (drought, flood, tsunami, etc.), socio-economic conditions (sharp fluctuation or increase in prices), conflicts (war, social unrest, etc.), diseases (malaria, measles, diarrhea, acute respiratory infections, etc.) and other events/conditions that impact the food security dimensions.
Hazards and vulnerability:
Exceptional occurrences;
Civil security;
Population displacement;
Incidence of poverty;
Market dysfunctions;
Malaria, measles, diarrhea, acute respiratory infections.

Cadre Harmonisé MANUAL Version 1.0
Page | 32
5.2.3.2. Impact on Food and Nutrition Security Dimensions
Interactions between Causal Factors (including acute/chronic events and vulnerability) have direct impacts on the four food security dimensions: availability, access, utilization and stability. These dimensions interact in a sequential manner: food must be available, then households must have access to it, then they must utilize it properly, and then the whole system must be stable (Barrett, 2010).
Availability - Under this dimension, the issue is whether or not food is actually or potentially physically present. It includes aspects of agricultural production, wild foods, food reserves, markets and transportation.
Access - If food is actually or potentially physically present, the next question is whether or not households have adequate access (e.g. entitlement) to that food, including physical (distance, infrastructure, etc.), financial (purchasing power) and socio-politically.
Utilization - If food is available and households have adequate access to it, the next question is whether or not households utilize food appropriately, in terms of food preferences, preparation, feeding practices, storage and access to improved water quality. The term "utilization" may be open to various understandings but the CH Analytical Framework uses this term to explicitly refer to the physical utilization of food at the household level, not including the biological utilization of food at the individual level. Biological utilization of food at the individual level is an important factor in understanding nutritional outcomes overall.
Stability - If the dimensions of availability, access and utilization are met and households have adequate quality and quantity of food, the next question is whether or not the whole system is stable, thus ensuring that the households are food-secure at all times. Stability can refer to short-term instability (which can lead to acute food insecurity) or medium/long-term instability (which can lead to chronic food insecurity). Climatic, economic, social and political factors may also cause instability.
5.2.4. Impacts of Contributing Factors and Other Indirect Evidence
The interaction among Contributing Factors (including Causal Factors and impact on food security dimensions) generates either a risk of further deterioration or a positive change in food and nutrition security outcome. The Analytical Framework explicitly includes a feedback mechanism that often help turn changes in food and nutrition security outcomes into subsequent changes in factors contributing to food security, such as a worsening or improvement of vulnerability and/or acute or chronic events, which in turn lead to changes in impact on food security dimensions.
To take into account Contributing Factors or some indirect evidence of food security outcomes, three groups of impact have been defined in the CH:
• Light impact;
• Medium impact; and
• Strong impact.
Different methods to assess the impact of Contributing Factors and other indirect evidence are provided in Table 11 below.

Cadre Harmonisé MANUAL Version 1.0
Page | 33
Table 11: Acute Food Insecurity Reference Table – Indicative Classification of the Impacts of Indirect Evidence and Contributing Factors on the Overall Phase of a Zone
Purpose: To determine the impacts of each contributing factor and indirect evidence on the overall phasing of the analyzed zone. Use: Impact severity is based on convergence of evidence about current and projected situations as well as on experts’ consensus.
IMPACT DESCRIPTION Light Impact Medium Impact Strong Impact
Ind
irec
t Ev
iden
ce o
f O
utc
om
es
Livelihood Change
Asset stripping: Growth of 20-30 % compared with the normal
Asset stripping: N/A
Asset stripping: N/A
Departure of households: < 10%
Departure of assets: 10 to 30%
Departure of assets: > 30%
Availability of pastures: 90%-80% compared with the average of the 5 previous years
Availability of pastures: 80% to 50% compared with the average of the 5 previous years
Availability of pastures: < 50% compared with the average of the 5 previous years
In rangeland area NGI: > 60%
NGI: 40-60%
NGI: 20-40 %
Accessibility to pastures: Accessible
Accessibility to pastures: +/- accessible
Accessibility to pastures: Non accessible
Forage balance sheet: > 70 % of needs
Forage balance sheet: 30% to 70% of needs
Forage balance sheet: < 30% of needs
Co
ntr
ibu
tin
g Fa
cto
rs
Hazards and Vulnerability
Level barely adequate to meet food consumption needs
Level inadequate to meet food consumption needs
Level highly inadequate to meet food consumption needs
Price changes (over 5 years): 25% to 50%
Price changes (over 5 years): 50% to 75%
Price changes (over 5 years): > 75%
Cases of malaria, measles, diarrhea, acute respiratory infections
Utilization
Safe clean water: minimal ≥15 liters per person and per day
Safe clean water: 7.5 to 15 liters per person and per day
Safe clean water: 4 to 7.5 liters per person and per day
Access rate to safe clean water: 61 to 80%
Access rate to safe clean water: 41 to 60%
Access rate to safe clean water: below 40%
Note: Depending on its context and available data, each country can select the Contributing Factors that are most critical and on which information is available. The above list is indicative and not exhaustive (Annex 8).
VI. CLASSIFYING ACUTE FOOD INSECURITY
Key classification parameters are outcome indicators, indirect evidence and Contributing Factors of food and nutrition security. Convergence of evidence is the basic principle of the analysis process.
During the analysis, analysts should make their decisions using direct and indirect evidence and assessing the impacts of Contributing Factors on different food and nutrition security outcomes. For this, analysts should note that:
Indirect evidence of outcome indicators may impact the classification of each outcome indicator;
In the absence of direct evidence of outcome indicators, indirect evidence alone do not allow one to carry out the classification of the indicators, except those with thresholds (caloric proxy, MUAC);
Contributing Factors may impact the overall classification of an area but do not allow one to carry out the classification of outcome indicators.
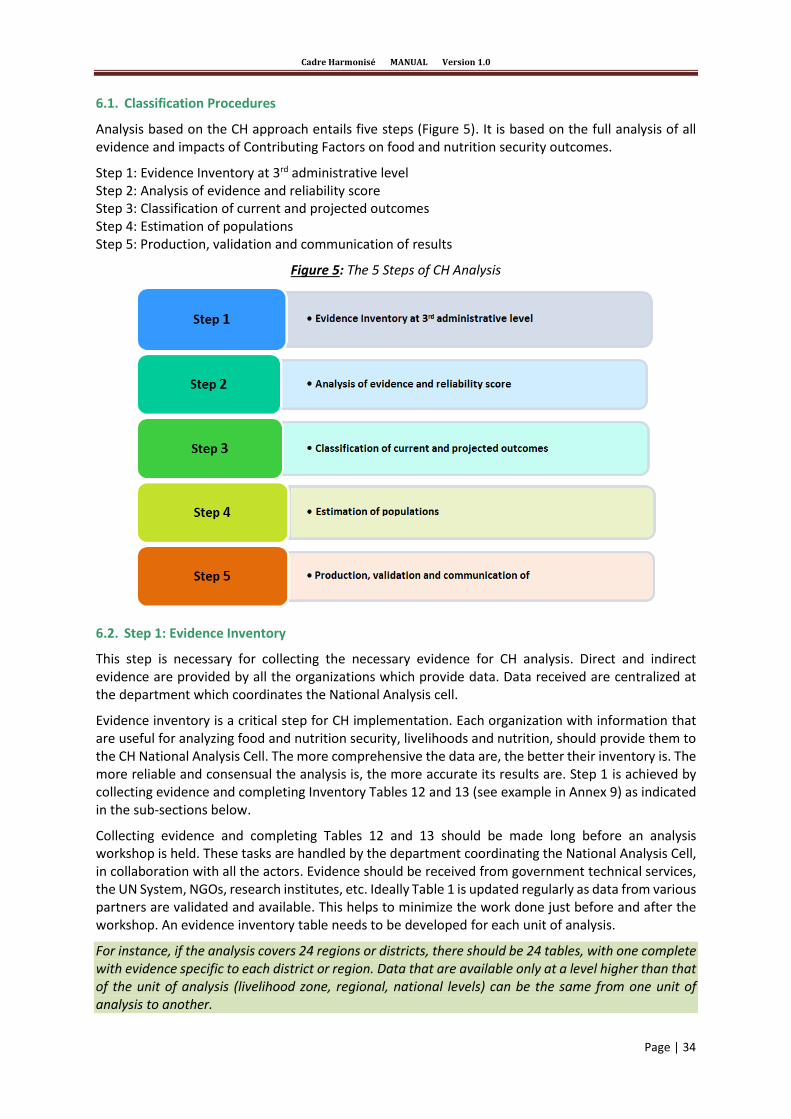
Cadre Harmonisé MANUAL Version 1.0
Page | 34
6.1. Classification Procedures
Analysis based on the CH approach entails five steps (Figure 5). It is based on the full analysis of all evidence and impacts of Contributing Factors on food and nutrition security outcomes.
Step 1: Evidence Inventory at 3rd administrative level Step 2: Analysis of evidence and reliability score Step 3: Classification of current and projected outcomes Step 4: Estimation of populations Step 5: Production, validation and communication of results
Figure 5: The 5 Steps of CH Analysis
6.2. Step 1: Evidence Inventory
This step is necessary for collecting the necessary evidence for CH analysis. Direct and indirect evidence are provided by all the organizations which provide data. Data received are centralized at the department which coordinates the National Analysis cell.
Evidence inventory is a critical step for CH implementation. Each organization with information that are useful for analyzing food and nutrition security, livelihoods and nutrition, should provide them to the CH National Analysis Cell. The more comprehensive the data are, the better their inventory is. The more reliable and consensual the analysis is, the more accurate its results are. Step 1 is achieved by collecting evidence and completing Inventory Tables 12 and 13 (see example in Annex 9) as indicated in the sub-sections below.
Collecting evidence and completing Tables 12 and 13 should be made long before an analysis workshop is held. These tasks are handled by the department coordinating the National Analysis Cell, in collaboration with all the actors. Evidence should be received from government technical services, the UN System, NGOs, research institutes, etc. Ideally Table 1 is updated regularly as data from various partners are validated and available. This helps to minimize the work done just before and after the workshop. An evidence inventory table needs to be developed for each unit of analysis.
For instance, if the analysis covers 24 regions or districts, there should be 24 tables, with one complete with evidence specific to each district or region. Data that are available only at a level higher than that of the unit of analysis (livelihood zone, regional, national levels) can be the same from one unit of analysis to another.

Cadre Harmonisé MANUAL Version 1.0
Page | 35
For each piece of evidence inventoried, the analysis should clearly indicate the title of the report, the source(s) (if drafted by several people, please indicate), the information collection date (not its publication or validation date) and a short description of the methodology applied.
Then, for each piece of evidence, there is a need to specify at which administrative level it is available: First administrative level = 0; 2nd administrative level = 1; 3rd administrative level = 2. For example, the prices at the provincial market have increased by 200% compared with the same period in the previous year (L = 2). If the evidence comes with population figures, those figures must be entered. For example, 200,000 persons were affected by floods.
Tables 12 and 13 are divided into several parts. Regarding Contributing Factors, seven distinct sections need to be completed. Each section covers a specific element of food and nutrition security and is as follows:
For each of Tables 12 and 13, the header on general information on the analysis and the unit analyzed should be filled out (country name, date of the analysis cycle, names of administrative entities covered by the data, population figures for the analyzed unit). A brief description of livelihoods in the area should be provided. As mentioned above, these pieces of information may come from various partners (Government, NGOs, FEWS NET, the HEA program, WFP baseline studies, etc.)
An inventory of information should be conducted for each group of indicators (which are linked to different parts of the Analytical Framework of the CH - Section IV). At this stage, the analyst should ensure that he/she does know the difference between information to be classified under “Contributing Factors” in tables highlighted in green (hazards and vulnerability, food availability, livelihood assets, food access, food utilization, including water and stability) and information relevant to outcome indicators in tables highlighted in purple (food consumption, livelihood change, nutritional status, and mortality).
At this stage of the analysis, all information must be inventoried. In the next step, analysts will decide, by consensus, what would be the most reliable and relevant data for the analysis. Similar to the other analytical tables, Tables 12 and 13 (Evidence Inventory) are only proposals made to the user who is then free to adapt them to his/her needs as long as he/she ensures the continuity of the analysis’ mandatory steps and allows for the most comprehensive and transparent analysis possible (see example in Annex 9).

Page | 36
Table 12: Inventory of Evidence on FNS Outcomes (see example in Annex 9)
STEP 1, TABLE 1 - EVIDENCE INVENTORY Country:________________________
Inventory of available evidence on OUTCOME INDICATORS
1. Based on available data on all factors that may impact food and nutrition security, complete the table by classifying each element of CH Analytical Framework at the THIRD ADMINISTRATIVE UNIT. The list should be as exhaustive as possible. Some evidence can be qualitative or from non-scientific sources (e.g. media, discussions)
2. In the first section of the table, insert the name of the analyzed area, the name of the Administrative Unit Level 2 and the period analyzed. This period can range from one day to several months, depending on the data and the experts’ consensus. Then enter the current population (the most recent data at the time of the analysis) of the Administrative Unit Level 2. Enter a brief description of livelihood zones, which may include a description of population groups, wealth groups, etc.
3. Then specify, for each piece of evidence, at which Administrative Unit level the evidence is available: First administrative level = 0; 2nd level = 1; or 3rd level = 2. For instance, the prices at
the provincial market increased by 2% compared with the same period of the previous year (L = 2). If the evidence comes with population figures, enter these figures. For example, 200,000 people were affected by floods.
4. In the section “Source of Each Piece of Evidence”, indicate where the evidence is from and provide a brief description of the methodology used as well as the publication date. If several authors have been involved, mention them all. In case an evidence is in a non-finalized format (draft), specify that it is so. The publication date of the source too needs to be entered.
5. For each piece of evidence, indicate the data collection date or analysis date (e.g. caloric proxy). Indicating the final report’s publication date only is not sufficient.
2nd administrative level:
3rd administrative level:
CH cycle date:
Current population ______________________ (at the level analyzed)
Brief description of livelihood zones:
OUTCOME INDICATORS Evidence + FIGURES (Numbers) Source of Each Piece
of Evidence (publication date)
Data Collection Date
Foo
d C
on
sum
pti
on
Caloric proxy
Food Consumption Score (FCS)
Household Dietary Diversity Score (HDDS)
Coping Strategies Index (CSI)
HEA, % survival deficit
Household Hunger Scale (HHS)
Note: The same procedure can be used for the other three food and nutrition security outcomes: Livelihood change Nutritional status Mortality
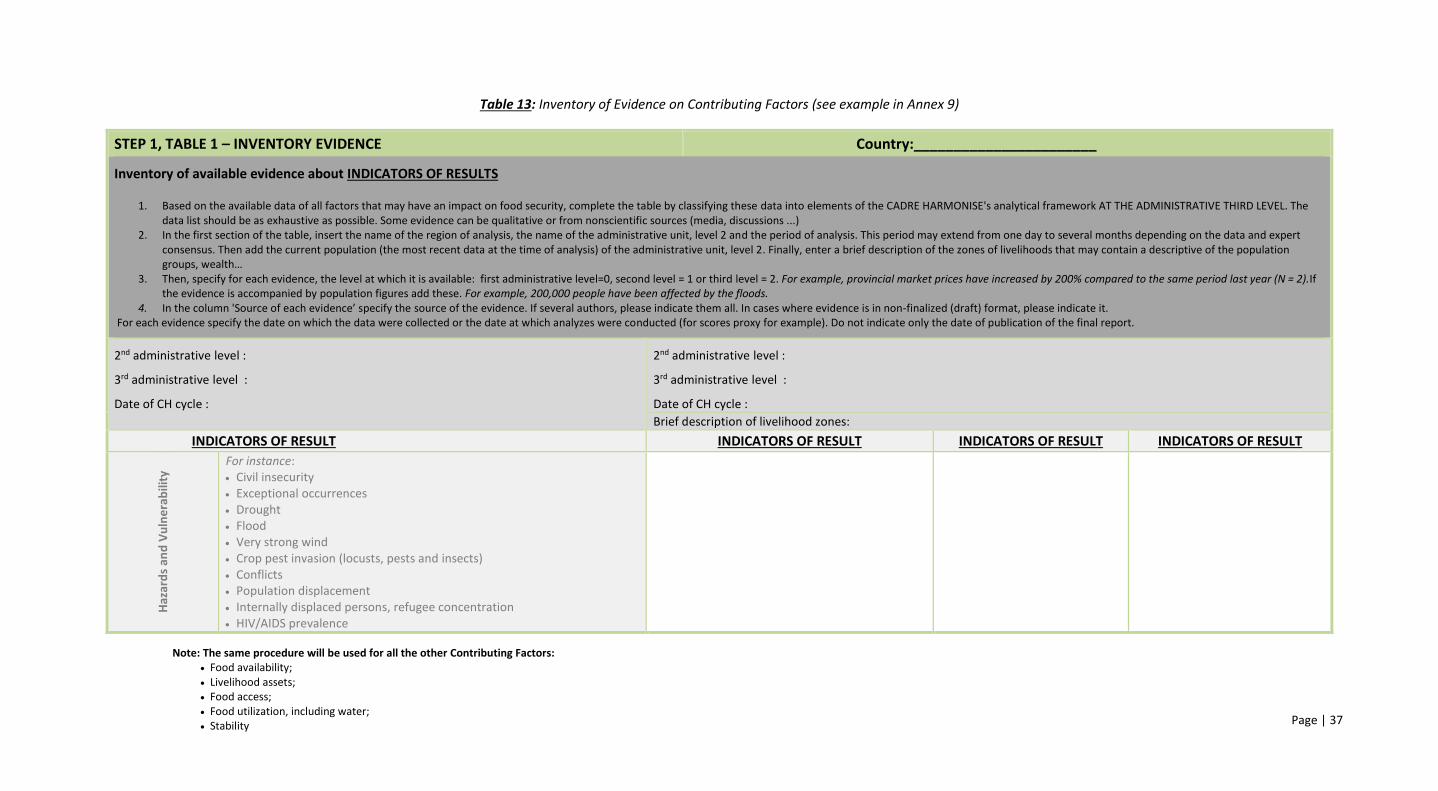
Page | 37
Table 13: Inventory of Evidence on Contributing Factors (see example in Annex 9)
STEP 1, TABLE 1 – INVENTORY EVIDENCE Country:_______________________
Inventory of available evidence about INDICATORS OF RESULTS
1. Based on the available data of all factors that may have an impact on food security, complete the table by classifying these data into elements of the CADRE HARMONISE's analytical framework AT THE ADMINISTRATIVE THIRD LEVEL. The data list should be as exhaustive as possible. Some evidence can be qualitative or from nonscientific sources (media, discussions ...)
2. In the first section of the table, insert the name of the region of analysis, the name of the administrative unit, level 2 and the period of analysis. This period may extend from one day to several months depending on the data and expert consensus. Then add the current population (the most recent data at the time of analysis) of the administrative unit, level 2. Finally, enter a brief description of the zones of livelihoods that may contain a descriptive of the population groups, wealth…
3. Then, specify for each evidence, the level at which it is available: first administrative level=0, second level = 1 or third level = 2. For example, provincial market prices have increased by 200% compared to the same period last year (N = 2).If the evidence is accompanied by population figures add these. For example, 200,000 people have been affected by the floods.
4. In the column 'Source of each evidence’ specify the source of the evidence. If several authors, please indicate them all. In cases where evidence is in non-finalized (draft) format, please indicate it. For each evidence specify the date on which the data were collected or the date at which analyzes were conducted (for scores proxy for example). Do not indicate only the date of publication of the final report.
2nd administrative level :
3rd administrative level :
Date of CH cycle :
2nd administrative level :
3rd administrative level :
Date of CH cycle :
Brief description of livelihood zones:
INDICATORS OF RESULT INDICATORS OF RESULT INDICATORS OF RESULT INDICATORS OF RESULT
Haz
ard
s an
d V
uln
era
bili
ty For instance:
Civil insecurity Exceptional occurrences Drought Flood Very strong wind Crop pest invasion (locusts, pests and insects) Conflicts Population displacement Internally displaced persons, refugee concentration HIV/AIDS prevalence
Note: The same procedure will be used for all the other Contributing Factors: Food availability; Livelihood assets; Food access; Food utilization, including water; Stability

Page | 38
6.3. Step 2: Evidence Analysis
The second step of the CH analysis aims to review the entire available data recorded in the evidence inventory in Step 1. Analysts would together decide on the most relevant data to consider for the analysis.
Like in Step 1, a table would be helpful to guide analysts in evidence analysis. Tables 15 and 16 (Evidence Analysis) work in the same way as Tables 12 and 13 (Evidence Inventory). Contributing Factors and outcome indicators are divided following the same color scheme (grey and purple). Their headers are the same. Here too, a table is dedicated to each analyzed zone.
A number “sub-steps” should be followed in Step 2. First of all, analysts review data entered in Tables 12 and 13 (Evidence Inventory) and decide objectively what the most pertinent data for the current analysis are. To do so, analysts should take into account the objective of the analysis, which is to submit a proposed classification of food and nutrition situation for a given zone and a specific period.
The reliability of the selected data must then be assessed by analysts. To this end, the CH provides specific criteria for assessing data reliability and adequacy; “reliability” meaning data quality at the time of analysis and/or according to the data’s age – as data lose value over time. The analysis focuses on the status of both the study period (current period) and the projected period (in the following months of the same year).
Assessing the level of reliability of the information used is conducting during a plenary meeting on the basis of information provided in Table 14 below:
Table 14: CH Criteria for Assigning Evidence Reliability Score
SCORE CRITERIA
1. Unconfirmed reliability
Evidence from expert judgment, evaluations and internal reports whose sources, methods or time relevance are questionable
2. Somewhat reliable
Preliminary results validated, or evidence from surveys, censuses, field assessments of reliable sources, or expert judgments using an acceptable method.
3. Reliable Evidence from surveys, recent censuses whose sources, scientific methods and time relevance of data are unquestionable and validated.
Analysts must provide a brief record of key evidence chosen for each element of food and nutrition security. Relying on the criteria above, the analysts assign, in a consensual manner, a reliability score for the evidence, which will be used, later in the process, to secure total confidence in the analysis.

Cadre Harmonisé MANUAL Version 1.0
Page | 39
Some examples:
An evidence of Global Acute Malnutrition (GAM) from a SMART survey whose data was collected less than three months earlier and with a technically validated report, is reliable (R = 3). If the GAM evidence was from preliminary results, technically validated, not older than three months counting from the date of data collection, and no draft report was available yet, it would still be reliable (R = 2).
Analyses of prices provided by MIS for the current month – that of the analysis – or the previous month (monthly variation, annual variation or variation compared with the five-year average), are considered reliable (R = 3).
Analyses of HEA results carried out during the month of or one month before the analysis and which are validated at national level, are considered reliable (R = 3).
Evidence from a study conducted by a structure whose methodology and results are not shared nor validated at national level, are of unconfirmed reliability (R = 1).
A MIS analysis of prices which is conducted in October (on current prices and variations compared with the previous month, with the same period in the previous year, and with the five-year average) is not reliable for an analysis carried out in March (R = 1).
Once data are entered in Tables 15 and 16, a reliability score must be assigned to each piece of evidence and analysts should review all the data selected for the current situation. It is on the basis of these information that analysts should draw consensually a brief conclusion that covers the main results suggested by the data.
That conclusion enables one to qualify the possible impact that elements of Contributing Factors may have on food and nutrition security outcomes.
For instance, analysts may consider that a 50% price increase compared to the five-year average will have a negative impact on food consumption. Using the reference table for Contributing Factors (Table 11), one can determine the severity of the impact (from light to strong) for each outcome indicator. One single element can impact more than one outcome indicator. For one single outcome indicator, some impacts can be positive or negative.
The following graph summarizes the main steps to be followed to complete Tables 15 and 16 below which are dedicated to evidence analysis for food and nutrition security outcomes (Table 15) and Contributing Factors (Table 16).

Cadre Harmonisé MANUAL Version 1.0
Page | 40
Table 15: Analysis of FNS Outcome Indicators (See example in Annex 10)
STEP 2, TABLE 2 – ANALYSIS OF KEY EVIDENCE Country:______________________
Conclusions on evidence and impact of CONTRIBUTING FACTORS 1. Based on TABLE 1, write a brief statement of key evidence for each element of food security. 2. Based on the criteria defined in the CADRE HARMONISE technical note (see also last page), specify on a consensual basis the reliability score for each of the evidence: 1 =
Reliability unconfirmed, 2 = Fairly reliable, 3 = Reliable. For example, market prices have increased by 200% compared to the same period last year (F = 2). 3. Write recapitulative conclusions for each element (short paragraph) based on key evidence taking into account the reliability of each of the evidence. 4. For the projected situation, include evidence already available (already established scenarios) or produce a consensus scenario based on evidence (and their reliability) of the
current situation.
1. For elements CONTRIBUTING FACTORS, define, when possible and on a consensual basis, the impact of the conclusion of convergence of evidence on the results indicators. First, specify whether the impact is positive or negative, then, if it is "light", "medium" or "strong" and, what indicator(s) of result, it affects? This must be done for the current situation and the projected situation. For example, the conclusion of the «Food Availability» judges the situation as, bad because of insufficient rainfall. Impact (s) on indicator(s) of result: average negative for food consumption and for the evolution of livelihoods.
2nd administrative level : Current analysis period:
3rd administrative level : Projected analysis period:
Elements of Contributing Factors
CURRENT SITUATION PROJECTED SITUATION
Foo
d
con
sum
pti
on
Brief summary of key evidence Conclusions about the element for the area:
Main assumption on food consumption Conclusions about the element for the area:
Classification of the element – Phase_______________
Classification of the element – Phase____________
Live
liho
od
Ch
ange
Brief summary of key evidence: Conclusions about the element for the area:
Main assumption on livelihood change: Conclusions about the element for the area:
SELECT Classification of the element – Phase_________________
SELECT Classification of the element – Phase________________
Z1: Z2: Z3: Z4: Z5: Z1: Z2: Z3: Z4: Z5:
Note: The same procedure will be used for the two other food security and nutrition
outcomes: Nutritional status Mortality
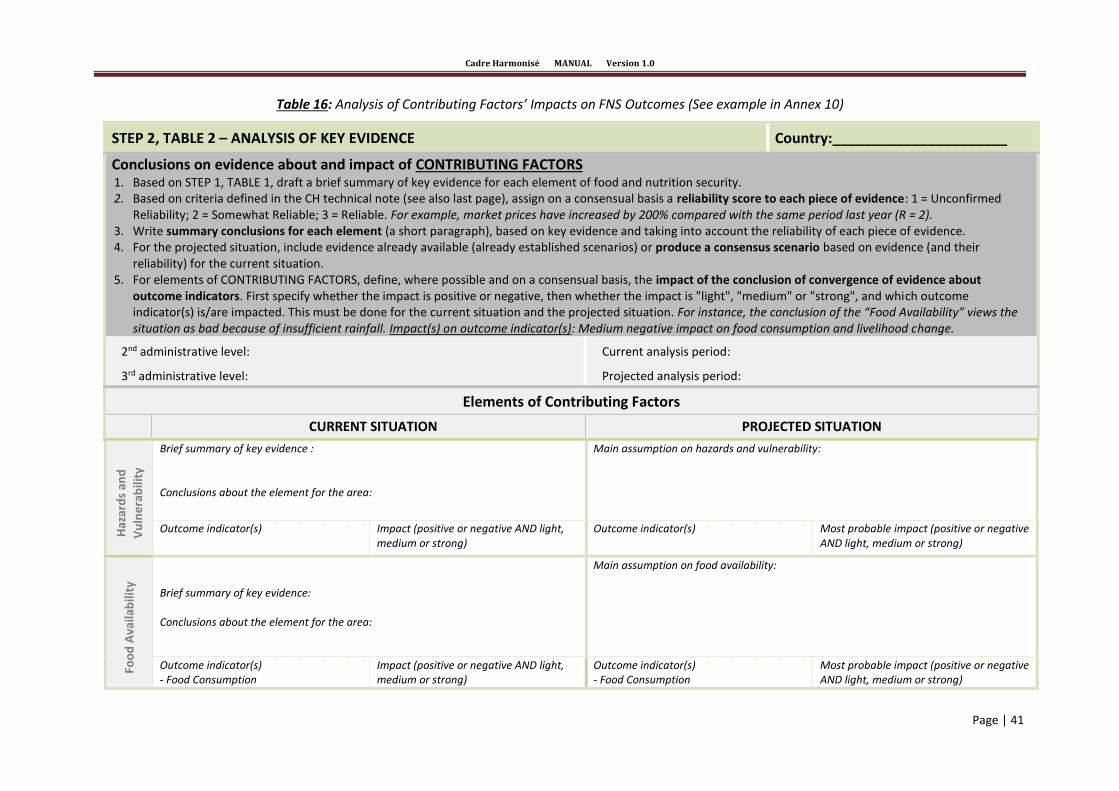
Cadre Harmonisé MANUAL Version 1.0
Page | 41
Table 16: Analysis of Contributing Factors’ Impacts on FNS Outcomes (See example in Annex 10)
STEP 2, TABLE 2 – ANALYSIS OF KEY EVIDENCE Country:______________________
Conclusions on evidence about and impact of CONTRIBUTING FACTORS 1. Based on STEP 1, TABLE 1, draft a brief summary of key evidence for each element of food and nutrition security. 2. Based on criteria defined in the CH technical note (see also last page), assign on a consensual basis a reliability score to each piece of evidence: 1 = Unconfirmed
Reliability; 2 = Somewhat Reliable; 3 = Reliable. For example, market prices have increased by 200% compared with the same period last year (R = 2). 3. Write summary conclusions for each element (a short paragraph), based on key evidence and taking into account the reliability of each piece of evidence. 4. For the projected situation, include evidence already available (already established scenarios) or produce a consensus scenario based on evidence (and their
reliability) for the current situation. 5. For elements of CONTRIBUTING FACTORS, define, where possible and on a consensual basis, the impact of the conclusion of convergence of evidence about
outcome indicators. First specify whether the impact is positive or negative, then whether the impact is "light", "medium" or "strong", and which outcome indicator(s) is/are impacted. This must be done for the current situation and the projected situation. For instance, the conclusion of the “Food Availability” views the situation as bad because of insufficient rainfall. Impact(s) on outcome indicator(s): Medium negative impact on food consumption and livelihood change.
2nd administrative level: Current analysis period:
3rd administrative level: Projected analysis period:
Elements of Contributing Factors
CURRENT SITUATION PROJECTED SITUATION
Haz
ard
s an
d
Vu
lne
rab
ility
Brief summary of key evidence : Conclusions about the element for the area:
Main assumption on hazards and vulnerability:
Outcome indicator(s) Impact (positive or negative AND light, medium or strong)
Outcome indicator(s) Most probable impact (positive or negative AND light, medium or strong)
Foo
d A
vaila
bili
ty
Brief summary of key evidence: Conclusions about the element for the area:
Main assumption on food availability:
Outcome indicator(s) - Food Consumption
Impact (positive or negative AND light, medium or strong)
Outcome indicator(s) - Food Consumption
Most probable impact (positive or negative AND light, medium or strong)

Page | 42
6.4. Step 3: Consolidation and Area Classification
6.4.1. Sub-Step 3.1: Synthesis and Classification of Current Situation
Step 3 – Synthesis and Area Classification is the step where analysts will re-enter some of the information in Tables 15 and 16 in Tables 18 and 19 (Evidence Analysis) and which involves building consensus on the final phase for the current and projected situations. This analysis is conducted on the basis of the notes highlighted in a box at the beginning of Section VI.
Throughout this step, analysts should refer to the CH Analytical Framework, the 20% rule8 and the CH “Acute Food Insecurity Reference Table for Area Classification” to help them reach consensus. The CH Analytical Framework enables analysts to ensure the interaction of Contributing Factors and outcome indicators, which is essential for the final classification of areas.
The CH is based on analysis by administrative unit or area only, not by household group or socio-economic group. General classification of all administrative units and/or their livelihood zones will be carried out in accordance with the analysis performed. The process is conducted in two main sub-steps for synthetizing the analysis of impacts of Contributing Factors on outcome indicators and phase classification for each administrative unit or area.
1. As with the other tables, indicate the administrative levels. The first part of Table 19 is only on conclusions related to the CURRENT situation. The second part covers only conclusions related to the PROJECTED situation.
2. Based on the results of the convergence of evidence in Table 20, information are reported for both OUTCOME INDICATORS and CONTRIBUTING FACTORS.
Table 17: Criteria for Corroborating Evidence for Confidence Levels
Confidence Level Criteria for Corroborating Evidence for Confidence Levels
Current Situation Projected Situation
Acceptable
*
At least 1 piece of reliable evidence (direct or indirect) for any of the food and nutrition security outcomes
+ At least 4 pieces of reliable evidence for different contributing factors or other outcome elements
At least 4 pieces of reliable evidence for different contributing
factors or outcome elements.
Medium
* *
At least 1 piece of reliable evidence for any of the food and nutrition security outcomes
+ At least 5 pieces of reliable evidence for different contributing factors or other outcome elements
At least 6 pieces of reliable evidence for different contributing
factors or outcome elements
High
* * *
At least 2 pieces of reliable evidence for any of the food and nutrition security outcomes
+ At least 6 pieces of reliable evidence for different contributing factors or other outcome elements
+ No reliable contradictory evidence
At least 8 pieces of reliable evidence for different contributing
factors or outcome elements
8 See Annex 11.
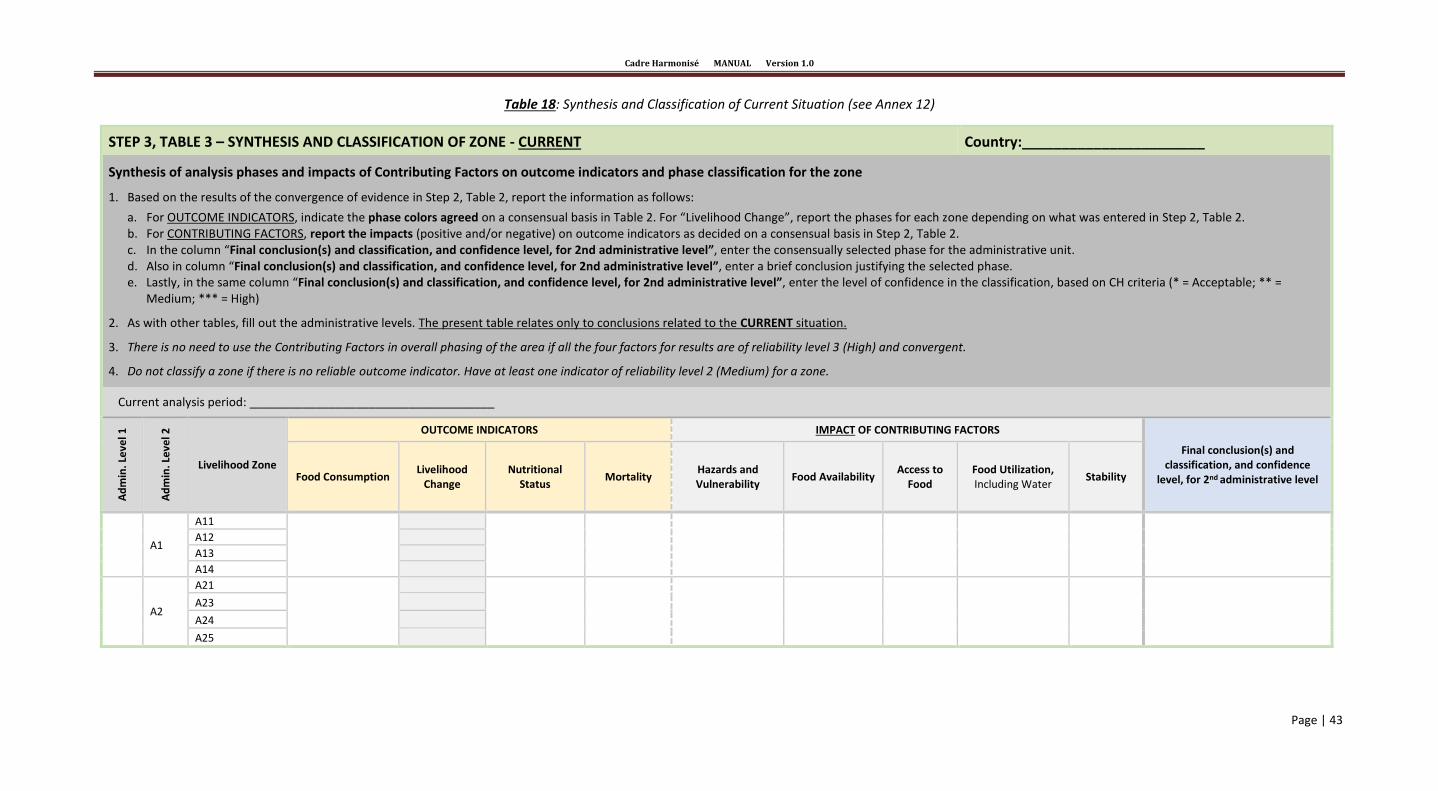
Cadre Harmonisé MANUAL Version 1.0
Page | 43
Table 18: Synthesis and Classification of Current Situation (see Annex 12)
STEP 3, TABLE 3 – SYNTHESIS AND CLASSIFICATION OF ZONE - CURRENT Country:_______________________
Synthesis of analysis phases and impacts of Contributing Factors on outcome indicators and phase classification for the zone
1. Based on the results of the convergence of evidence in Step 2, Table 2, report the information as follows:
a. For OUTCOME INDICATORS, indicate the phase colors agreed on a consensual basis in Table 2. For “Livelihood Change”, report the phases for each zone depending on what was entered in Step 2, Table 2. b. For CONTRIBUTING FACTORS, report the impacts (positive and/or negative) on outcome indicators as decided on a consensual basis in Step 2, Table 2. c. In the column “Final conclusion(s) and classification, and confidence level, for 2nd administrative level”, enter the consensually selected phase for the administrative unit. d. Also in column “Final conclusion(s) and classification, and confidence level, for 2nd administrative level”, enter a brief conclusion justifying the selected phase. e. Lastly, in the same column “Final conclusion(s) and classification, and confidence level, for 2nd administrative level”, enter the level of confidence in the classification, based on CH criteria (* = Acceptable; ** =
Medium; *** = High)
2. As with other tables, fill out the administrative levels. The present table relates only to conclusions related to the CURRENT situation.
3. There is no need to use the Contributing Factors in overall phasing of the area if all the four factors for results are of reliability level 3 (High) and convergent.
4. Do not classify a zone if there is no reliable outcome indicator. Have at least one indicator of reliability level 2 (Medium) for a zone.
Current analysis period: _____________________________________
Ad
min
. Le
vel 1
Ad
min
. Le
vel 2
Livelihood Zone
OUTCOME INDICATORS IMPACT OF CONTRIBUTING FACTORS
Final conclusion(s) and classification, and confidence
level, for 2nd administrative level Food Consumption Livelihood
Change Nutritional
Status Mortality
Hazards and Vulnerability
Food Availability Access to
Food Food Utilization, Including Water
Stability
A1
A11
A12
A13
A14
A2
A21
A23
A24
A25

Cadre Harmonisé MANUAL Version 1.0
Page | 44
6.4.2. Sub-Step 3.2: Synthesis and Classification of Projected Situation
Table 19: Synthesis and Classification of Projected Situation (see Annex 12)
STEP 3, TABLE 4 – SYNTHESIS AND CLASSIFICATION OF ZONE - PROJECTED Country:______________________
Synthesis of analysis phases and impacts of Contributing Factors on outcome indicators and phase classification for the zone
5. Based on the results of the convergence of evidence in Step 2, Table 2, report the information as follows:
a. For OUTCOME INDICATORS, indicate the phase colors agreed on a consensual basis in Table 2. For “Livelihood Change”, report the phases for each zone depending on what was entered in Step 2, Table 2. b. For CONTRIBUTING FACTORS, report the impacts (positive and/or negative) on outcome indicators as decided on a consensual basis in Step 2, Table 2. c. In the column “Final conclusion(s) and classification, and confidence level, for 2nd administrative level”, enter the consensually selected phase for the administrative unit. d. Also in column “Final conclusion(s) and classification, and confidence level, for 2nd administrative level”, enter a brief conclusion justifying the selected phase. e. Lastly, in the same column “Final conclusion(s) and classification, and confidence level, for 2nd administrative level”, enter the level of confidence in the classification, based on CH criteria (* = Acceptable; ** =
Medium; *** = High)
6. As with other tables, fill out the administrative levels. The present table relates only to conclusions related to the PROJECTED situation.
7. There is no need to use the Contributing Factors in overall phasing of the area if all the four factors for results are of reliability level 3 (High) and convergent.
8. Do not classify a zone if there is no reliable outcome indicator. Have at least one indicator of reliability level 2 (Medium) for a zone.
Projected analysis period: _____________________________________
Ad
min
. Le
vel 1
Ad
min
. Le
vel 2
Livelihood Zone
OUTCOME INDICATORS IMPACT OF CONTRIBUTING FACTORS
Final conclusion(s) and classification, and confidence
level, for 2nd administrative level Food Consumption Livelihood
Change Nutritional
Status Mortality
Hazards and Vulnerability
Food Availability Access to
Food Food Utilization, Including Water
Stability
A1
A11
A12
A13
A14
A2
A21
A23
A24
A25
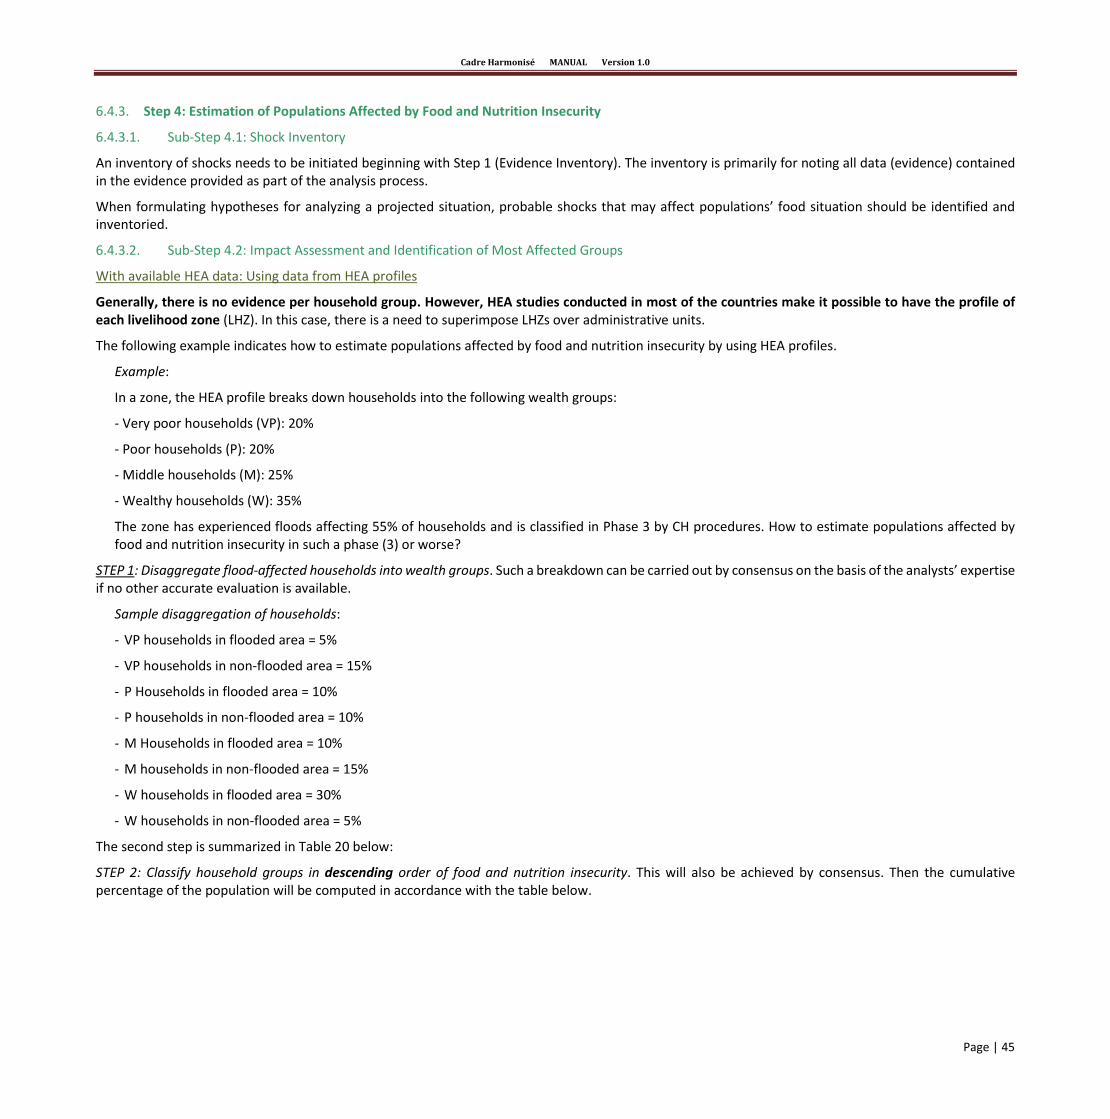
Cadre Harmonisé MANUAL Version 1.0
Page | 45
6.4.3. Step 4: Estimation of Populations Affected by Food and Nutrition Insecurity
6.4.3.1. Sub-Step 4.1: Shock Inventory
An inventory of shocks needs to be initiated beginning with Step 1 (Evidence Inventory). The inventory is primarily for noting all data (evidence) contained in the evidence provided as part of the analysis process.
When formulating hypotheses for analyzing a projected situation, probable shocks that may affect populations’ food situation should be identified and inventoried.
6.4.3.2. Sub-Step 4.2: Impact Assessment and Identification of Most Affected Groups
With available HEA data: Using data from HEA profiles
Generally, there is no evidence per household group. However, HEA studies conducted in most of the countries make it possible to have the profile of each livelihood zone (LHZ). In this case, there is a need to superimpose LHZs over administrative units.
The following example indicates how to estimate populations affected by food and nutrition insecurity by using HEA profiles.
Example:
In a zone, the HEA profile breaks down households into the following wealth groups:
- Very poor households (VP): 20%
- Poor households (P): 20%
- Middle households (M): 25%
- Wealthy households (W): 35%
The zone has experienced floods affecting 55% of households and is classified in Phase 3 by CH procedures. How to estimate populations affected by food and nutrition insecurity in such a phase (3) or worse?
STEP 1: Disaggregate flood-affected households into wealth groups. Such a breakdown can be carried out by consensus on the basis of the analysts’ expertise if no other accurate evaluation is available.
Sample disaggregation of households:
- VP households in flooded area = 5%
- VP households in non-flooded area = 15%
- P Households in flooded area = 10%
- P households in non-flooded area = 10%
- M Households in flooded area = 10%
- M households in non-flooded area = 15%
- W households in flooded area = 30%
- W households in non-flooded area = 5%
The second step is summarized in Table 20 below:
STEP 2: Classify household groups in descending order of food and nutrition insecurity. This will also be achieved by consensus. Then the cumulative percentage of the population will be computed in accordance with the table below.

Cadre Harmonisé MANUAL Version 1.0
Page | 46
Table 20: Classification of HOUSEHOLD GROUPS (HHs) in Descending Order
Group Name/Description Classification of HHs in Descending
Order of Food and Nutrition Insecurity % of
Population
Cumulative % of
population
VP households in flooded area Worse Cases
Best Cases
5% 5%
P households in flooded area 10% 15%
M households in flooded area 10% 25%
W households in flooded area 30% 55%
VP households in non-flooded area 15% 70%
P households in non-flooded area 10% 80%
M households in non-flooded area 15% 95%
W households in non-flooded area 5% 100%
STEP 3: Estimate populations affected by food and nutrition insecurity. Applying the 20% rule leads us to identify the group that best corresponds to the characteristics of Phase 3. The group identified as such is the group "middle households living in the flooded area”. The cumulative percentage of this group is 25%, which means that at least 20% of households in the area are in Phase 3 or worse.
The population affected by food and nutrition insecurity AP = 25% x TP (TP = total population of the area). The proportion of population affected by food and nutrition insecurity should be disaggregated in Table 21 by food and nutrition insecurity class, based on the phase assigned to the area at the end of the analysis. Such a disaggregation must observe the 20% rule by consensus, based on reasoned argument.
In the absence of HEA data: Using country poverty profiles’ data
To estimate populations, analysts must decide how to distribute the percentages for each CH phase in the following manner: by consensus and based on data (evidence) provided in country poverty profiles and their knowledge of livelihoods. Then the percentage of affected households is distributed for each phase by consensus, starting with the estimated percentage of households in Phase 5 (Famine), followed by Phase 4 (Emergency), and so on and so forth up to Phase 1.
The 20% rule remains the benchmark for estimating populations affected by food and nutrition insecurity per phase. Consensus is essential and should be based on reasoned argument.

Cadre Harmonisé MANUAL Version 1.0
Page | 47
Table 21: Estimation of Populations Affected by Food and Nutrition Insecurity in Current Situation (see example in Annex 13)
STEP 4, TABLE 5: ESTIMATION OF POPULATIONS Country:_______________________
Synthesis of Analysis Phase and Impacts of contributing factors on indicators of result and the classification of the phase for the zone 1. Based on the results of the convergence of evidence from Table 2, report the information as follows:
a. For RESULTS INDICATORS, indicate the colors of Phases decided on a consensual basis in Table 2. For the “evolution of livelihoods”, report the Phases for each zone depending on what was entered in Table 2.
b. . For CONTRIBUTING FACTORS, report the impacts (positive and / or negative) on result indicators as decided on a consensual basis in Table 2. c. In the column ‘Final conclusion (s) and classification for the 2nd administrative level‘, enter the consensual phase for the administrative unit. d. Also in column 'Final conclusion (s) and classification for the 2nd administrative level', enter a brief conclusion justifying the Phase. e. Finally, in the same column ‘final conclusion (s) and classification for the 2nd administrative level', enter the classification confidence level based on CH criteria
(* = Acceptable, ** = good, *** = High) 2. As with other tables, fill administrative levels. This table relates only to the conclusions related to the CURRENT situation. 3. .No need to use the contributing factors in global phasing of the area if, all the four factors for results are of reliability level 3 and convergent
Do not classify a zone if there is no reliable indicator of result; have at least one indicator of reliability level 2 for a zone
Period of current analysis :
2nd admin. level
3rd admin. level
Total population
CURRENT SITUATION
Classification of the zone
Percentage of households affected by each phase Total population in Phase 3
Total population in Phase 4
Total population in Phase 5
Total Population
in Phase 3 to 5 Period:____________
Ph1 Ph2 Ph3 Ph4 Ph5
0 0 0 0
0 0 0 0
0 0 0 0
0 0 0 0
0 0 0 0
0 0 0 0
Total 0 0 0 0 0
Cadre Harmonisé MANUAL Version 1.0
Page | 48
Table 22: Estimation of Populations Affected by Food and Nutrition Insecurity in Projected Situation
STEP 4, TABLE 6: ESTIMATION OF POPULATIONS Country:_______________________
Estimation of populations affected by acute food insecurity by analyzed zone
1. Report, in the "Total population" column, the most recent population figures for the level-3 administrative unit. These figures should be found in Step 1, Table 1. Do the same for all zones analyzed.
2. For PROJECTED SITUATION:
a. For each level-3 administrative unit, fill out the general classification decided in “Step 3, Table 3 - Synthesis and Classification of Zone”.
b. Then define, on a consensual basis, the percentage of households affected by each phase, starting with the estimated percentage of Phase 5 (Famine) households, then those in Phase 4 (Emergency) and so on and so forth until Phase 1.
c. Lastly, using the estimated percentages of Phases 3, 4 and 5 households, estimate the total population affected by food and nutrition insecurity for each level-3 administrative unit.
3. Repeat the same steps for the projected situation.
4. In the last line "Total", enter the country's total population, the total population in Phases 3, 4 and 5 for the country's projected situation, and the total population in Phases 3, 4 and 5 for the country's projected situation. Do not write in other lines.
2nd admin. level
3rd admin. level
Total population
PROJECTED SITUATION
Classification of the zone
Percentage of households affected by each phase Total population in Phase 3
Total population in Phase 4
Total population in Phase 5
Total Population
in Phase 3 to 5 Period:____________
Ph1 Ph2 Ph3 Ph4 Ph5
0 0 0 0
0 0 0 0
0 0 0 0
0 0 0 0
0 0 0 0
Total 0 0 0 0 0

Cadre Harmonisé MANUAL Version 1.0
Page | 49
6.5. Mapping the Food Security Situation
After classifying the third administrative level into the different phases, a map needs to be developed to summarize and visualize results. Furthermore, this map can feature some causes (drought, flood) and consequences of populations’ vulnerability (high malnutrition rates, for instance) for some areas (generally those classified as Phase 3 and higher).
To create the map legend, it is recommended to use the following color codes representing the different phases (Table 23).
Table 23: Recommended Color Code for Mapping Results of Area Classification
VII. COMMUNICATING CH RESULTS
Sahelian and West African countries, TPFs and IGOs as well as CSOs have expressed their commitment to the following fundamental pillars enshrined in the Charter for Food Crisis Prevention and Management:
1. Information and analysis of the food and nutrition situation; 2. Consultation and co-ordination; 3. Consensual analysis for choosing food/nutrition crisis prevention and management tools.
The stakeholders do thus demonstrate their determination to enforce quality standards that help them uphold together all their commitments so that each party understands its own obligations.
As specified in the Charter for Food Crisis Prevention and Management, sharing food and nutrition security information among stakeholders is one general principle for understanding better the issue and deliver coordinated assistance in the whole region. The results of consensual assessments of countries’ food and nutrition situations should therefore be actively communicated to all stakeholders. The communication process proposed in this manual is based on a communication template developed for this purpose, which serves as a medium for presenting analysis results to decision makers and partners.
Pictograms are used to indicate:
The level of confidence in the analysis: the pictograms are compulsory; The recurrence of Phase 3 and worse - for three consecutive years in the same period in the
same area; Areas that would be in a worse phase without receiving humanitarian assistance.
7.1. Validating Analysis Results
This is not about creating a validation framework nor adding an extra step to the CH process. It should be noted that the ability of the National Analysis Cell and partner organizations to meet quality standards depend on a number of factors. Some of these factors are within their control. Other factors, such as political issues and/or partners’ need to support emergency response in some contexts, can be a source of conflict of interests, deadlock or misunderstanding among CH stakeholders.
At the end of the work at the national level, once the consensus is established without any objection and other reservations on the quality and rigor of the process implemented, the results achieved are
Phase R G B
Phase 1 205 250 205
Phase 2 250 230 30
Phase 3 230 120 0
Phase 4 200 0 0
Phase 5 100 0 0

Cadre Harmonisé MANUAL Version 1.0
Page | 50
considered final and are validated for the analysis period. The CILSS representative and National Analysis Cell Focal Point are in charge of a debriefing session/meeting for national authorities on products emerging from the analysis. Should some incoherence be detected during the regional consolidation session, CILSS will, in agreement with members of the Regional Analysis Cell, inform the countries concerned of possible corrections to be made to their products.
7.2. Completing the Communication Template
The communication template is completed and validated by the National Analysis Cell at the end of the analysis cycle. The canvass provides guidance on how to present salient results obtained from the analysis cycle. The template is filled out using prescriptions provided in Tables 24 and 25 (see Annex 14). The synoptic summary of conclusions drawn from the analysis should be drafted in clear, simple and fairly explicit language. The communication template is submitted for regional consolidation and to PREGEC.

Cadre Harmonisé MANUAL Version 1.0
Page | 51
Table 24: Summary of Results from Analysis of Areas at Risk of Food and Nutrition Insecurity and Populations Affected (Part A)
Country: ……............. Analysis results for current and projected acute food insecurity
Valid from: …../….. /…… To: …../……/…… Initiated on: …. /…. . /…….
Main results for areas affected by food insecurity
Food consumption:
Livelihood change:
Nutrition:
Mortality:
Narrative summary of causes, context and main issues (for information purposes only)
• Food availability levels as elements impacting household food consumption
(production, stock levels, etc.);
• Impacts of factors that can disrupt production, such as rainfall, drought/water stress, flood, etc.;
• Prices as elements that provide information on access to major food products (household shopping basket: millet, sorghum, maize, rice, etc.);
• Data on trade flows that can inform on the dynamics of agricultural products from production areas to consumption zones (access);
Elements that impact populations’ livelihoods/categories (conflict, etc.)
CURRENT SITUATION - NOVEMBER 2013 PROJECTED SITUATION - FEBRUARY 2014
Map Legend Pictograms
1
Minimal Analysis Reliability Level
2 Stressed Acceptable
3 Crisis Medium
4 Emergency High
5 Famine An area that has reached at least Phase 3 over more than three consecutive years
Area with insufficient evidence
Not analyzed
! The situation would be worse without the effects of humanitarian assistance
Disclaimer: Boundaries, names and designations used on the maps above do not imply official endorsement or acceptance by organizations partnering in and supporting the CH.
CH identification of areas at risk and populations affected by food and nutrition security in the Sahel and West Africa
Current situation November 2013
Projected situation February 2014

Cadre Harmonisé MANUAL Version 1.0
Page | 52
Table 25: Summary of Results from Analysis of Areas at Risk of Food and Nutrition Insecurity and Populations Affected (Part A)
Main Results and Issues
a) First say something about Contributing Factors in some detail (availability, access, utilization and stability, etc.);
b) Provide a detailed description of areas classified into different food insecurity phases as outputs resulting from the factors detailed in a);
c) Identify prospects (expected price trends resulting from market conditions, expected trends in production given the climate factors/expected rainfall, etc.).
Methodology of and Challenges Faced by the Analysis
a) Describe the approach adopted by the National Analysis Cell, its composition, its tasks prior to conducting analyses, etc.;
b) Describe the methodological approach briefly;
c) Provide reasons for the selected analysis level (3rd administrative level);
d) Mention the source/origin of data mobilized for the analysis;
e) Highlight constraints linked to institutional issues, methodology/indicators, data/disaggregation, etc.
Seasonal Calendar and Monitoring of Indicators
a) Enter the seasonal/cropping calendar (in tabular form with the 12 months of the year);
b) Enter the appointments for collecting data on key indicators and Contributing Factors (WFP surveys, SMART nutrition survey, missions on market issues, post-harvest missions, etc.).
Recommendations for Next Analysis
a) Considering the results, what are the main recommendations to be made? To who?
b) Are there elements to monitor in such or such area?
c) Etc.
Contacts
* Full name of the chairperson of the multidisciplinary analysis group and her/his country, organization, e-mail address and telephone contact;
* Full name of the CH2 focal point and her/his contact (organization, e-mail, telephone).
Partners Involved Insert the logos of organizations participating in the analysis.
Estimated Populations Per Food Insecurity Phase
ANALYSIS AREA
DISTRICT/ REGION
Total of People
Phase 1 Phase 2 Phase 3 Phase 3 or >
Number of people %
Number of people %
Number of people %
Number of people %
7.3. Communicating to Decision Makers
Communicating CH results has the advantage of creating and enhancing the necessary synergy among stakeholders for carrying out interventions based on such a shared analysis, while making optimal use of the diversity of information sources and analyses national, regional and international actors.
Communication, in such a context, enables to disseminate the results of food and nutrition situation analyses through regular information and in-depth consensual analyses. The goal is to help facilitate decision-making by Governments, IGOs, NGOs and TPFs effectively.
The government service leading the coordination of the CH National Analysis Cell is, in consultation with participating actors, in charge of organizing a work session to provide feedback to relevant authorities in charge of food and nutrition security issues.
Cadre Harmonisé MANUAL Version 1.0
Page | 53
Conclusions drawn from the consensual analysis conducted during the analysis meeting held by the National Analysis Cell shall not be subject to any modification whatsoever by stakeholders, except where a proposal to that effect has been made by the Regional Analysis Cell, in agreement with the National Analysis Cell.
7.4. Communicating to All Partners
It emerges from the above that communicating to decision makers paves the way for the dissemination of products from the CH analysis conducted by the National Analysis Cell. These joint results should be used for planning interventions to assist populations at risk of food and nutrition insecurity. The results will also be used to better organize and guide close and joint monitoring of vulnerability related to food insecurity in areas at risk, or set up monitoring sites for malnutrition surveillance based on the needs and realities of each country.
The full report and synoptic summary are to be shared to all partners in printed format or downloadable files available on reliable web sites, according to the wishes of the country concerned. To ensure wider use of all products generated by CH analysis cycles, the AGRHYMET Regional Centre will make them available online.
VIII. ENSURING ANALYSIS QUALITY AND RIGOR
The success of the CH cycle depends on the proper functioning of the National Analysis Cell in charge of data collection and analysis and on its performance in mobilizing various food and nutrition security stakeholders. The aim is: (1) Ensuring that the process of reflecting on how to enhance mobilization of key FNS actors, is geared toward full consensus on CH implementation; (2) Identifying ways to improve quality and rigor in CH cycles.
At regional level, quality and rigor in CH cycles are monitored and guided by the CH Technical Committee and CH Steering Committee. These two bodies seek to ensure that all participants, relevant civil society organizations, and government partners:
Are involved in the evidence gathering and analysis phase, mapping process and summarization of results;
Receive reports on results achieved from the various CH cycles completed;
Provide objective feedback on how the National Analysis Cell operates and how it collaborates with its partners, in order to improve the quality of work;
Join those mechanisms that have been put in place for receiving and communicating formally to the National Analysis Cell all suggestions for improvements;
Are trained as part of their technical capacity-building and to be accountable to other stakeholders (other civil society organizations and partners); and
Make information on CH cycles available to the larger public in a convenient format.
8.1. The CH Technical Committee
The CH Technical Committee (TC) was established in 2000, charged with the responsibility of implementing the CH tool at both regional and national level, and assessing and improving the CH tool’s performance in methodological terms. Its meetings are held quarterly or on request, moderated by its chairperson. Its technical secretariat is run by the AGRHYMET Regional Centre.
The CH Technical committee is composed of representatives of the following bodies: CILSS, FEWS NET, FAO, WFP, JRC/EC, IPC/GSU, UNICEF, RAAF and NGOs (Oxfam, ACF, Save the Children, etc.).
8.2. The CH Steering Committee
The CH Steering Committee was established in 2000, charged with the responsibility of guiding TC activities, evaluating them and making proposals on adequate funding for implementing the CH tool at both regional and national level. It is chaired by the CILSS Executive Secretariat. Its technical
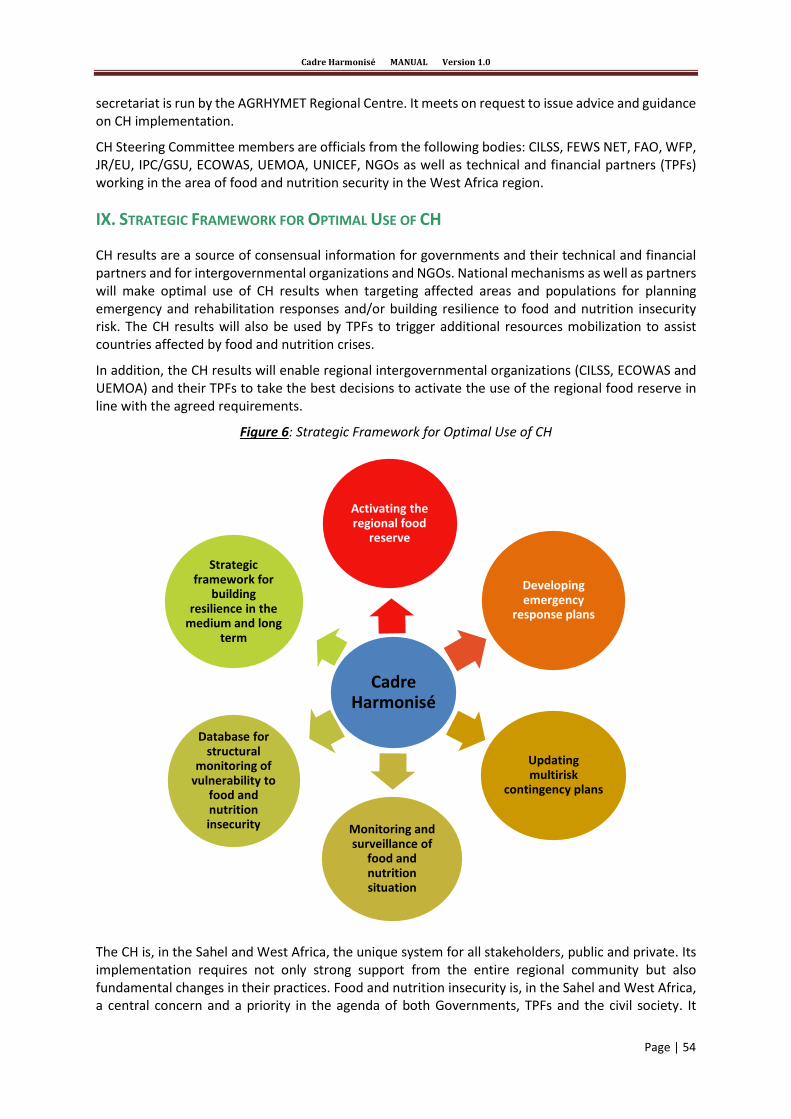
Cadre Harmonisé MANUAL Version 1.0
Page | 54
secretariat is run by the AGRHYMET Regional Centre. It meets on request to issue advice and guidance on CH implementation.
CH Steering Committee members are officials from the following bodies: CILSS, FEWS NET, FAO, WFP, JR/EU, IPC/GSU, ECOWAS, UEMOA, UNICEF, NGOs as well as technical and financial partners (TPFs) working in the area of food and nutrition security in the West Africa region.
IX. STRATEGIC FRAMEWORK FOR OPTIMAL USE OF CH
CH results are a source of consensual information for governments and their technical and financial partners and for intergovernmental organizations and NGOs. National mechanisms as well as partners will make optimal use of CH results when targeting affected areas and populations for planning emergency and rehabilitation responses and/or building resilience to food and nutrition insecurity risk. The CH results will also be used by TPFs to trigger additional resources mobilization to assist countries affected by food and nutrition crises.
In addition, the CH results will enable regional intergovernmental organizations (CILSS, ECOWAS and UEMOA) and their TPFs to take the best decisions to activate the use of the regional food reserve in line with the agreed requirements.
Figure 6: Strategic Framework for Optimal Use of CH
The CH is, in the Sahel and West Africa, the unique system for all stakeholders, public and private. Its implementation requires not only strong support from the entire regional community but also fundamental changes in their practices. Food and nutrition insecurity is, in the Sahel and West Africa, a central concern and a priority in the agenda of both Governments, TPFs and the civil society. It
Cadre Harmonisé
Activating the regional food
reserve
Developing emergency
response plans
Updating multirisk
contingency plans
Monitoring and surveillance of
food and nutrition situation
Database for structural
monitoring of vulnerability to
food and nutrition insecurity
Strategic framework for
building resilience in the
medium and long term

Cadre Harmonisé MANUAL Version 1.0
Page | 55
appears as one of the main causes of endemic poverty and also, simultaneously, as the main consequence of that poverty. Therefore, acquiring the means for addressing it in a sustainable manner is today regarded as one of the conditions and resources to fulfil most of the stakeholders’ ambitions.
To make the best possible use of the CH - and promote it by doing so, it is necessary for all partners to consider the tool as reference for food and nutrition security analysis. The CH should meet the actors’ growing information needs. This is why the CH is defined as a strategic communication tool for food and nutrition security, and is a dialogue and stimulation/facilitation tool of both the regional mechanism known as PREGEC and RPCA.
X. CONCLUSION
Being aligned with the Charter for Food Crisis Prevention and Management and adopting an inclusive approach to mobilizing partners and making best use of gains from other analysis methodologies, the Cadre Harmonisé is a unifying tool. Its current approach helps generate results that are comparable over space and time. The CH uses the same analytical framework as IPC 2.0 which enables to conduct a multidimensional analysis of the food situation on the basis of reliable evidence.
The CH enhances the value of data from all government mechanisms, UN organizations, NGOs, etc. These mechanisms form the essential part of CILSS countries’, ECOWAS’ and UEMOA’s potential to take charge of the CH. They are in need of enhanced technical and financial capacity. Some national mechanisms, for their part, need to be reorganized so that they can regularly produce reliable information that improve decision making at both country and regional level.

Cadre Harmonisé MANUAL Version 1.0
Page | 56
Bibliography
Barrett C. B. and Lentz, E. , 2010
"Food Insecurity.” In Robert Denemark et al. eds. The International Studies Compendium Project. Oxford: Wiley-Blackwell
Barrett, Christopher B. , 2004
“Mixing Qualitative and Quantitative Methods of Analyzing Poverty Dynamics” (Combiner les méthodes qualitatives et quantitatives d’analyse de la dynamique de la pauvreté); document présenté lors de l’atelier KIPPRA-Cornell SAGA sur « Méthodes qualitatives et quantitatives de l’analyse de la pauvreté », Nairobi, mars 2004
CILSS, 1990 Charte pour la prévention et la gestion des crises alimentaires au Sahel et en Afrique de l'Ouest, RPCA, 10 février 1990
CILSS, 2011 Charte pour la prévention et la gestion des crises alimentaires au Sahel et en Afrique de l'Ouest, RPCA, Conakry, novembre 2011
CILSS et al, 2012 Cadre Harmonisé d’analyse permanente de la vulnérabilité courante au Sahel et en Afrique de l’Ouest. Manuel d'utilisation, version 1
CILSS et al, 2013 Cadre Harmonisé d’analyse permanente de la vulnérabilité courante au Sahel et en Afrique de l’Ouest. Note méthodologique, version 3
CILSS, et al, 2012 Cadre Harmonisé d’analyse permanente de la vulnérabilité courante au Sahel et en Afrique de l’Ouest. Note méthodologique, version 2
FAO, 2006 Le Cadre des moyens d’existence durables - Les quatre dimensions de la sécurité alimentaire : la disponibilité, l’accès, l’utilisation et la stabilité.
FAO, 2012 Cadre intégré de classification de la sécurité alimentaire. Manuel technique Version 2
FEG (no date) Approche de l'économie des ménages, Guide du Praticien. Regional Hunger and Vulnerability Program - Save the Children.
FSAU, 2006 Integrated Food Security and Humanitarian Phase Classification: Technical Manual Version I
Maxwell D, et Caldwell R., 2008
The Coping Strategies Index: Field Methods Manual, second edition, CARE. First edition 2003 on ftp://ftp.fao.org/docrep/fao/meeting/009/ae513e.pdf
Partenaires globaux IPC 2012
PAM (WFP), 2000
Cadre intégré de classification de la sécurité alimentaire : Manuel technique version 2.0. Preuves et normes pour une meilleure prise de décision en sécurité alimentaire. FAO. ROME
Manuel d’alimentation et de nutrition. Rome : PAM, Service Nutrition
Robert M, 1999 Food and Nutrition Assistance, Guide d'échantillonnage (USAID)
UNICEF, 1996 Le Cadre conceptuel de l’Unicef en matière de nutrition
WHO, 1995 The World Health Report 1995, Bridging the Gaps
WHO, 1997 The World Health Report 1997, Conquering Suffering, Enriching Humanity
Cadre Harmonisé MANUAL Version 1.0
Page | 57
Cadre Harmonisé MANUAL Version 1.0
Page | 58
ANNEX 1: WHAT IS THE IPC? (IN BRIEF)
The Integrated Food Security Phase Classification (IPC) is a set of protocols (tools and procedures)
used for classifying the severity of food insecurity. The IPC aims to consolidate complex food security
analyses to help make evidence-based decisions through a situational analysis based on four core
functions:
1. Promotion of technical consensus
2. Classification of the severity of a food security situation and its causes
3. Communication for action
4. Quality control assurance
The IPC provides a common language used to classify the severity of food insecurity. Using a common
classification of the severity of food insecurity makes it easier to compare results over time and space.
The IPC also meets the need for providing more rigorous, transparent and relevant data to facilitate
strategic decision-making.
Since it was launched in 2004, the IPC has been used in over 30 countries in five different regions of
the globe. Ideally, an "IPC product" should respect specific protocols described in the IPC Manual
Version 2.0. There are five minimum criteria for defining an "IPC product" and guaranteeing the
comparability of results, mapping protocols, and population estimates:
1. The analysis must reflect a functional consensus among technicians who represent the main
stakeholder organizations and have relevant expertise in the sector.
2. IPC reference tables must be used to determine the classification of phases.
3. The analysis must respect the key parameters of units of analysis and take humanitarian
assistance into account.
4. The evidence used to determine the classification must be clearly documented and readily
available.
5. The analysis must be mapped with the colors and standard phases used by the IPC.
Integration of IPC and CH tools
The integration of IPC and Cadre Harmonisé (CH) tools was born out of the 2005 food crisis in Niger,
which showed the importance of measuring the severity of food insecurity and of having a monitoring
system that could factor in different indicators in order to triangulate regional food security
information.
At the Cadre Harmonisé Steering Committee meeting held in Nouakchott in March 2008, participants
highlighted the need to establish a consensus around an improved version of the CH which could serve
as a single frame of reference for all sub-regional partners in evaluating food security in the Sahel. At
the Cadre Harmonisé Technical Committee meeting held in July 2008 in Niamey, it was agreed that
certain aspects of IPC Version 1 (IPC 1.0), including certain indicators, the severity scale, and mapping
protocols, would be integrated into that frame of reference.

Cadre Harmonisé MANUAL Version 1.0
Page | 59
Since the development of IPC Manual Version 2 (IPC 2.0), discussions have been under way to
integrate the Cadre Harmonisé and the IPC in order to improve the comparability of results from both
tools. A team of technical experts representing CILSS, the WFP, the FAO, FEWS NET, Oxfam, ACF, Save
the Children, and the JRC, with the participation of the IPC Global Support Unit (GSU), has been holding
technical consultations for several years in order to integrate the two tools.
Comparison between the IPC and the CH
The integration of certain components of the Integrated Food Security Phase Classification (IPC) has
been identified as a necessary step for enhancing the CH. It was agreed that IPC 2.0 should be
integrated into the CH in the best way possible in order to improve it, particularly through the
following activities:
Updating of the list of CH indicators
Finalization of the CH classification
Finalization of the mapping protocol
Integration of certain aspects of the IPC into the CH.
IPC Analysis Framework
The Analysis Framework recently proposed as an analysis guide for the Cadre Harmonisé is the
framework that was developed for IPC 2.0 (see IPC Manual Version 2.0, September 2012).9
The Analysis Framework is based on four commonly recognized conceptual framework models used
by national, regional and international mechanisms to analyze food security, nutrition, and livelihoods:
The risk = f (danger, vulnerability)10
The Sustainable Livelihoods Framework11
The four dimensions of food security: availability, access, use, and stability (FAO, 2006)
The UNICEF Conceptual Framework on the Causes of Malnutrition (UNICEF, 1996).
The Framework is above all a tool for classifying food insecurity based on four outcome indicators:
food consumption, livelihood changes, nutrition, and mortality. In addition to outcome indicators, a
series of contributing factors (hazards and vulnerability, availability, access, food use, and stability) is
used to make inferences about the classification. The Analysis Framework therefore allows
practitioners to establish links between different aspects of food security.
The IPC takes into account two units of analysis:
1. an analysis based on geographic area (for example, the total population in a given area)
2. an analysis based on Household Groups: considering relatively homogenous Household
Groups together in terms of food security outcomes, and in terms of factors such as income
groups, social groups, and location.
9 http://www.ipcinfo.org/fileadmin/user_upload/ipcinfo/docs/IPC_Manual2_FR_Oct12.pdf 10 White 1975, Turner et al. 2003 11 Sen, 191; Frankenberg, 1992; SCF-UK, 2000; DFID, 2001

Cadre Harmonisé MANUAL Version 1.0
Page | 60
IPC phases are classified based on the use of two reference tables (shown below), by area and
Household Group. Areas and Household Groups are classified by outcome indicators. Contributing
factors are used as evidence to inform and support the classification based on outcome indicators in
order to provide contextual and causal analysis information and strengthen the convergence of
evidence, which is the cornerstone of the IPC Analysis Framework. Through the convergence of
evidence, analysts compile and interpret evidence according to the two Reference Tables in which
food insecurity is classified into Phases. Under the IPC's convergence of evidence approach, analysts
can critically evaluate evidence and assess the situation using the IPC Reference Tables. It is
understood that food security cannot be measured mathematically or modeled, which is why the
convergence of evidence and consensus are necessary.
Figure 1: IPC Acute Food Insecurity Reference Table for the classification of areas
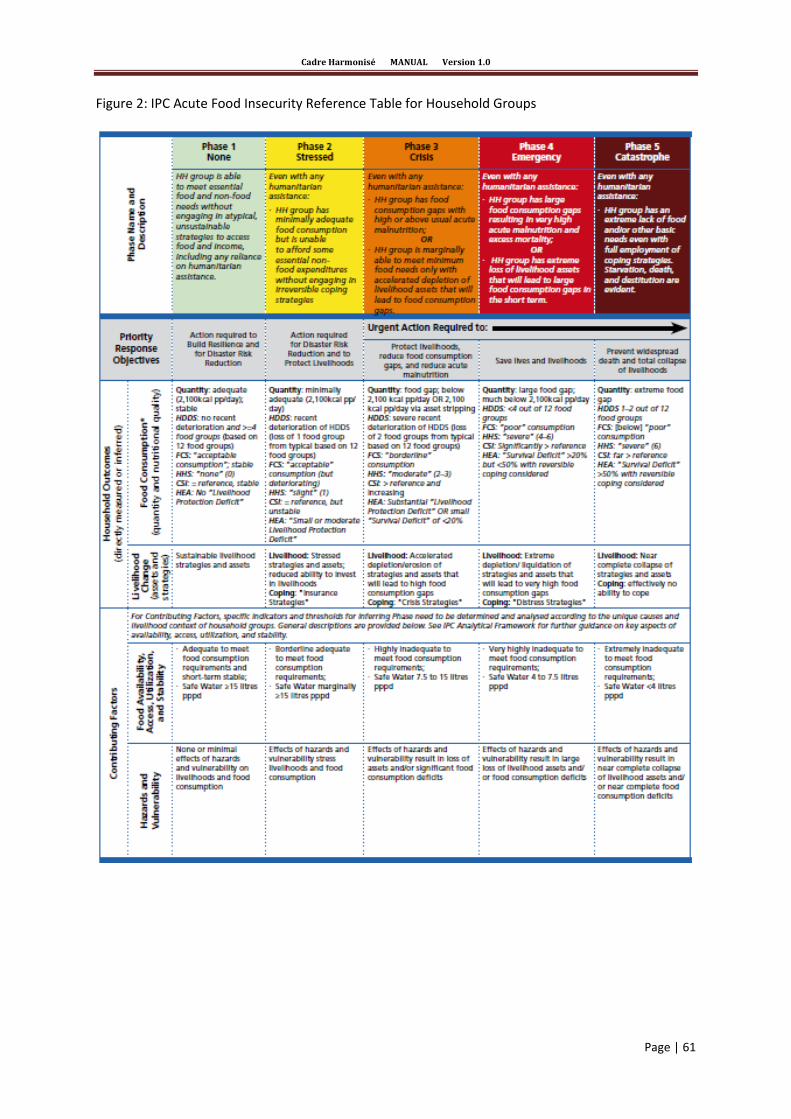
Cadre Harmonisé MANUAL Version 1.0
Page | 61
Figure 2: IPC Acute Food Insecurity Reference Table for Household Groups

Cadre Harmonisé MANUAL Version 1.0
Page | 62
ANNEX 2: GUIDELINES FOR THE CADRE HARMONISE (CH) COUNTRY ANALYSIS UNIT
The head of the CH Country Analysis Unit should be a technical manager with the national government
office or agency in charge of the CH process (involved in organizing and sending out invitations to the
analysis session and coordinating the country’s CH mechanism). He (or she) should have a good
technical knowledge of food security and nutrition-related issues and the overall CH process and
should be a high-level official and decision-maker in the country’s food security and nutrition analysis
structure. As chairperson for the workshop, he (or she) will preside over all plenary sessions and
provide country leadership throughout the week-long analysis. More specifically, he (or she) will
ensure the following:
the presence and representation of all invited actors/structures;
optimal consideration of all available information;
the regular attendance/punctuality of all participants;
compliance with the principle of consensus, mutual respect, and the orderly conduct of debates;
the existence of a reporting system (designated rapporteurs);
participation in group work;
feedback on and the approval of corresponding findings by the plenary meeting;
thorough reporting;
distribution of the report to participants at the country level;
reporting to national government officials (at the policy level). A general (or head) rapporteur or team of rapporteurs will be appointed to work under the supervision of the workshop chairperson to ensure thorough reporting throughout the week-long analysis. The rapporteur will be in charge of drawing up a summary report on the conduct of the workshop to serve as an « administrative » report. The general rapporteur and/or team of rapporteurs will coordinate efforts to put together a general report on the findings from the country analysis. This report should also include a discussion of the context, the conduct of the workshop, the analytical process, the lessons learned, and relevant consensus-based recommendations and conclusions. It should be shared with the facilitators and chairperson for the workshop prior to its distribution bearing the logos of all interested partners.
ORGANIZATIONAL TEMPLATE FOR THE COUNTRY ANALYSIS UNIT
Chairperson and host organization
Representation of relevant specialized agencies and stakeholder organizations (the goal is to include at least one (1) representative of all relevant groups)
Government offices (at all applicable levels)
Local NGOs, civil society, private
sector
Interna-tional NGOs
U.N. agencies
Specialized agencies
Are
a o
f e
xpe
rtis
e
(in
clu
de
as
app
licab
le f
or
the
anal
ysis
)
Food security/ livelihoods
Nutrition
Markets
Agriculture
Livestock
Climate
Health
WASH
Gender
Statistics
Others
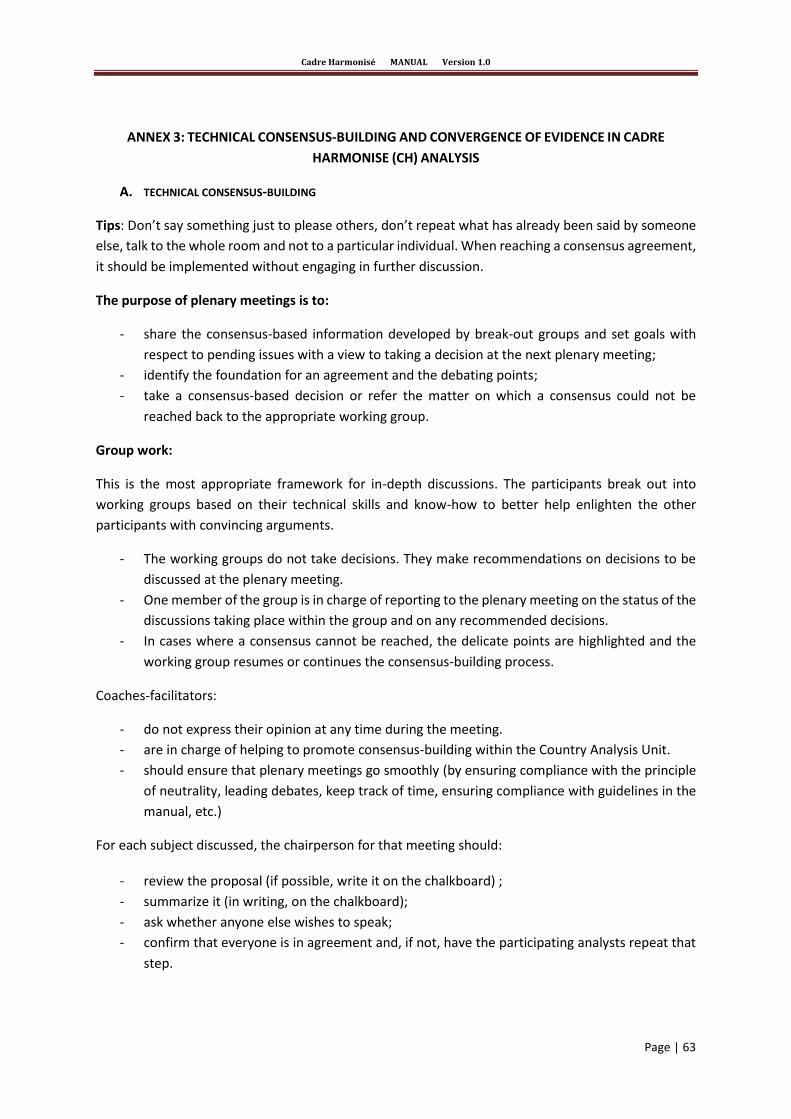
Cadre Harmonisé MANUAL Version 1.0
Page | 63
ANNEX 3: TECHNICAL CONSENSUS-BUILDING AND CONVERGENCE OF EVIDENCE IN CADRE
HARMONISE (CH) ANALYSIS
A. TECHNICAL CONSENSUS-BUILDING
Tips: Don’t say something just to please others, don’t repeat what has already been said by someone
else, talk to the whole room and not to a particular individual. When reaching a consensus agreement,
it should be implemented without engaging in further discussion.
The purpose of plenary meetings is to:
- share the consensus-based information developed by break-out groups and set goals with
respect to pending issues with a view to taking a decision at the next plenary meeting;
- identify the foundation for an agreement and the debating points;
- take a consensus-based decision or refer the matter on which a consensus could not be
reached back to the appropriate working group.
Group work:
This is the most appropriate framework for in-depth discussions. The participants break out into
working groups based on their technical skills and know-how to better help enlighten the other
participants with convincing arguments.
- The working groups do not take decisions. They make recommendations on decisions to be
discussed at the plenary meeting.
- One member of the group is in charge of reporting to the plenary meeting on the status of the
discussions taking place within the group and on any recommended decisions.
- In cases where a consensus cannot be reached, the delicate points are highlighted and the
working group resumes or continues the consensus-building process.
Coaches-facilitators:
- do not express their opinion at any time during the meeting.
- are in charge of helping to promote consensus-building within the Country Analysis Unit.
- should ensure that plenary meetings go smoothly (by ensuring compliance with the principle
of neutrality, leading debates, keep track of time, ensuring compliance with guidelines in the
manual, etc.)
For each subject discussed, the chairperson for that meeting should:
- review the proposal (if possible, write it on the chalkboard) ;
- summarize it (in writing, on the chalkboard);
- ask whether anyone else wishes to speak;
- confirm that everyone is in agreement and, if not, have the participating analysts repeat that
step.

Cadre Harmonisé MANUAL Version 1.0
Page | 64
Rapporteurs are in charge of keeping written records of the decisions taken and clearly documenting
all suggestions, concerns, and consensus-based decisions.
B. CONVERGENCE OF EVIDENCE
Like the IPC, the CADRE HARMONISE uses a convergence of evidence-based approach rather than
mathematical modeling. The idea is to gather reliable available evidence (data) and interpret it based
on reference tables (see annex 13) classifying food insecurity in five phases. This ensures that the
analysis is not based on a single indicator and that the different types of reference data (evidence) are
not given specific weights in the analysis process. Food security analysis is so complex that it can be
accomplished only by a convergence of evidence on all dimensions of food security. Moreover, the
inherent limitations on data quality and availability preclude the use of such data otherwise than in a
convergence of evidence-based, contextualized analysis
To facilitate comparability, CH Reference Tables (inspired by IPC Reference Tables) are based on food
security outcomes (which are generally comparable across different population groups) and
contributing factors (which can vary and must be interpreted within their local context). As part of the
convergence of evidence approach, analysts must critically evaluate the entire body of evidence and,
after due consideration, give their best estimate of the severity of the situation based on the CADRE
HARMONISE Reference Table. This process is similar to what is known as the « Delphi Decision-Making
Process » commonly used in the field of medicine when the phenomenon to be studied is complex
and the available data/information is incomplete and inconclusive.
This process requires accurate documentation of the evidence and an assessment of its reliability. As
tempting as it may be from a modeling standpoint, the IPC approach does not weight evidence a priori.
A universal weighting system is precluded by the unique context of each situation in terms of
livelihoods and historical and other factors affecting how the indicators are interpreted

Cadre Harmonisé MANUAL Version 1.0
Page | 65
ANNEX 4: CONSTRUCTION OF THE WFP FOOD CONSUMPTION SCORE
The food consumption score is a composite indicator used by the WFP as a proxy indicator for food
security. It takes into account food diversity, how frequently different food groups are consumed, and
their relative nutritional value12. The recall period covers the 7 days preceding the survey, and the
indicator is calculated at the household level. The score is calculated as follows:
with: ai = Weight attributed to the food group; xi = Number of days each food group is consumed
(≤ 7 days).
The table below shows the types of foods taken into account, their corresponding food groups, and
the weight attributed to each group.
Types of foods Food group Weight
Maize, millet, sorghum, rice, bread/doughnuts, pasta Cereals and tubers
2 Cassava, yams, plantains, other tubers
Groundnuts/legumes (beans, cowpeas, peas, lentils, etc.) Legumes 3
Vegetables (+ leaves) Vegetables and leaves 1
Fruits (mangoes, oranges, bananas, etc.) Fruits 1
Meat, fish, seafood, snails, eggs Animal proteins 4
Milk/dairy products Dairy products 4
Sugar, honey, other sweets Sugar 0.5
Oils and fats Oils 0.5
Condiments, spices Condiments (*) 0
Case studies in several countries have helped to establish standard thresholds to identify different
consumption levels:
Food consumption score (FCS) Consumption profile
<=21 Poor
>21 and <=35 Borderline
>35 Acceptable
However, exceptionally, these thresholds can be adjusted to reflect specific dietary habits.
The methodology described above is the result of research action and is therefore evolving.
Partnerships have been developed with research institutions like the IFPRI and universities such as
Tufts to continuously improve the methodology.
12 Refer to the WFP food consumption score user's guide (Food consumption analysis Calculation and use
of the food consumption score in food security analysis, WFP-February 2008)
Score = acerealexcereale+ alegmnsexlegmnse+ alegxleg+ afruitxfruit
+ aanimalxanimal+ asucrexsucre + alaitxlait+ ahuilexhuile
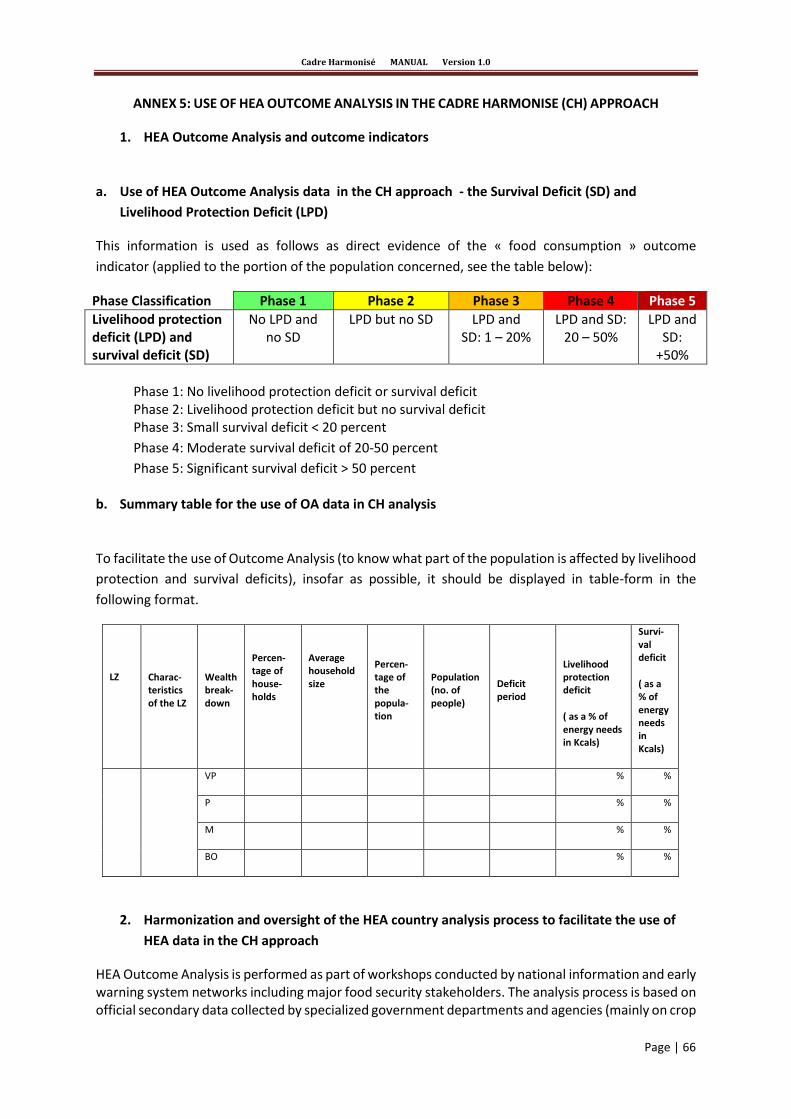
Cadre Harmonisé MANUAL Version 1.0
Page | 66
ANNEX 5: USE OF HEA OUTCOME ANALYSIS IN THE CADRE HARMONISE (CH) APPROACH
1. HEA Outcome Analysis and outcome indicators
a. Use of HEA Outcome Analysis data in the CH approach - the Survival Deficit (SD) and
Livelihood Protection Deficit (LPD)
This information is used as follows as direct evidence of the « food consumption » outcome
indicator (applied to the portion of the population concerned, see the table below):
Phase Classification Phase 1 Phase 2 Phase 3 Phase 4 Phase 5
Livelihood protection deficit (LPD) and survival deficit (SD)
No LPD and no SD
LPD but no SD LPD and SD: 1 – 20%
LPD and SD: 20 – 50%
LPD and SD:
+50%
Phase 1: No livelihood protection deficit or survival deficit Phase 2: Livelihood protection deficit but no survival deficit Phase 3: Small survival deficit < 20 percent
Phase 4: Moderate survival deficit of 20-50 percent
Phase 5: Significant survival deficit > 50 percent b. Summary table for the use of OA data in CH analysis
To facilitate the use of Outcome Analysis (to know what part of the population is affected by livelihood
protection and survival deficits), insofar as possible, it should be displayed in table-form in the
following format.
LZ
Charac-teristics of the LZ
Wealth break-down
Percen-tage of house-holds
Average household size
Percen-tage of the popula-tion
Population (no. of people)
Deficit period
Livelihood protection deficit
( as a % of energy needs in Kcals)
Survi-val deficit
( as a % of energy needs in Kcals)
VP % %
P % %
M % %
BO % %
2. Harmonization and oversight of the HEA country analysis process to facilitate the use of
HEA data in the CH approach
HEA Outcome Analysis is performed as part of workshops conducted by national information and early warning system networks including major food security stakeholders. The analysis process is based on official secondary data collected by specialized government departments and agencies (mainly on crop

Cadre Harmonisé MANUAL Version 1.0
Page | 67
production and prices for crops and livestock) and primary data collected at the field level during joint missions organized by specialized government departments and agencies and NGOs. However, in the absence of such data, analysts will make their own assumptions. Where applicable, these assumptions will be clearly defined and subject to monitoring. HEA Outcome Analysis data covers a full « consumption year, » which generally runs from October through September in farming areas and farming-oriented agropastoral areas and from July through June in pastoral areas of the Sahel. HEA analysis helps pinpoint difficult times of year when there may be a need for outside assistance. These periods should be taken into account in using HEA in analyses of the current and projected situation. The data and assumptions used in HEA analysis need to be consensus-based in order for corresponding findings to be used in CH analyses. In general, the following conditions must be met in order for HEA Outcome Analysis data to be used in CH analysis:
1. All data and assumptions used must be consensus-based; 2. All major food security actors at the country level must be involved in the HEA analysis
process; 3. The limitations of the analysis must be specified and clearly communicated; and 4. The findings must be validated by the country’s HEA Working Group and the HEA Regional
Technical Team.
3. Miscellaneous remarks designed to further optimize the use of HEA Outcome Analysis data
in CH analysis
The analysis should be limited to areas representing a single livelihood zone insofar as possible.
Otherwise, each livelihood zone will need to be differentiated in an analysis of the country’s
different administrative subdivisions because the HEA outcomes and contributing factors to be
taken into account will not be the same, particularly in the case of mixed pastoral and nonpastoral
administrative units (i.e. Agadez Region: market gardening Aïr vs pastoral zone; Gao Region:
riverine rice-growing vs transhumant pastoral zone …).
Certain crucial data for the analysis of certain livelihood zones may not be available in all cases or
their collection method or level of precision may be inadequate (estimates of trends in livestock
production, yields of certain crops, etc.) This can limit the accuracy of the analysis and, thus, will
require data triangulation and simultaneous advocacy efforts with the offices furnishing such data.
The use of HEA OA data helps focus the analysis on the situation of very poor and poor households,
which oftentimes account for 20 to 50 percent of the population, and, in this way, effectively takes
into account the 20 percent rule in the IPC approach.

Cadre Harmonisé MANUAL Version 1.0
Page | 68
ANNEX 6: CALORIC PROXY
Administrative level 1 or 2 caloric proxy calculates available calories per capita based on food
production in a geographic area. This proxy takes into account the three main food groups that make
up over 90% of a population's energy intake. The three groups are often "cereals/legumes/tubers."
Calculation method
The calculation is simple. It is based on the net production of different foods in the three food groups,
expressed in calories, and on the population of the geographic area in year n. Net production is
determined by using the most relevant loss and seed use rates and processing rates. Each country can
use the rates that apply to it. This method takes into account local production systems (which are very
important in the case of tubers due to the diversity of techniques used) and local processing methods.
However, the table below shows the rates most often cited in the literature (for information purposes
only):
Food Loss and seed use rate in %
Processing rate in %
Millet, sorghum, maize
15 0 if calories are calculated based on whole grains
Rice 15 60-70 (depending on the quality of rice, parboiled or not)
Cassava 45 0 if calories are calculated based on fresh tubers
Yams 50 0 if calories are calculated based on fresh tubers
Other tubers 50 0 if calories are calculated based on fresh tubers
Groundnuts 25 70 (for shelled groundnuts)
Cowpeas 20 0
Example of the calculation for an area producing millet, rice, cassava, and groundnuts: + Gross millet production in metric tons *1000*85%*3400 kcal/kg + Rice paddy production in metric tons *1000*85% *70%*3600 kcal/kg + + Gross cassava production in metric tons *1000*50%*1090 kcal/kg + + Gross groundnut production in metric tons *1000*75%*70%*5670 kcal/kg Divide by the population of the area in question.

Cadre Harmonisé MANUAL Version 1.0
Page | 69
ANNEX 7: NUTRITION INFORMATION
1. Direct evidence of nutritional status
1.1. Use of nutritional data
The procedures used are based mainly on the data most commonly available at Cadre Harmonisé
sessions. We determine the approach to use according to the possibilities available once the evidence
is gathered. We identify all possible cases using SMART surveys (time since data was collected and
annual survey frequency) and then determine situations in which other nutritional data could be
available (with or without SMART surveys). The tables below summarize these situations.
Table: Scenarios for using SMART surveys
Time since data was collected
Historical data Reliability Evidence used
Survey conducted less than three months ago
Not necessary Reliability level 3 Survey results
Survey conducted three to six months ago
No historical data for the same period/season
Reliability level 1 Survey results
One visit a year for at least 1 to 2 years and during the same period/season
Reliability level 2 Survey results
Two visits a year for at least 1 to 2 years and during the same period/season
Reliability level 2 Extrapolation results (See below)
Survey conducted more than six months ago*
No historical data for the same period/season
Reliability level 1 Survey results
One visit a year for at least 2 years and during the same period/season
Reliability level 2 Survey results
* Note that with an interval of more than 6 months, it is highly unlikely that there would be two visits in the year.
The table below presents different scenarios when data other than SMART survey results are available either at the national or local level, taking into account the characteristics of the new data source.
Table: Scenarios for using other nutritional data
Scenario Reliability and use Contributing factors
SMART and other administrative level 1 or 2 data
Apply the same approach mentioned above, and Use the most recent data and/or the largest/most representative sample
Contributing factors cannot be used to infer, smooth, exaggerate, transform, or influence the results indicator phase, but can be used for the
Non-representative SMART and other data
Only consider SMART data

Cadre Harmonisé MANUAL Version 1.0
Page | 70
Just localized, representative data (sentinel sites, program surveys, multi-purpose surveys, PDM, etc.)
Same approach mentioned above; Validated methodology Minimal representativity
convergence of evidence for overall phasing; Use of complementary data for contributing factors, particularly consumption and use, collected locally
Just localized, non-representative data (sentinel sites, program surveys, multi-purpose surveys, PDM, etc.)
This information could only be used as a contributing factor and not for phasing
No data, or only reliability level 1 data on results factors
No phasing of results factors Resort to a phasing approach with contributing factors
Data from other nutritional surveys, particularly those conducted by NGOs, should only be used once
their reliability has been verified. They should also be validated by national agencies before being
used.
1.2. Extrapolation of nutritional data
After the three-month validity of GAM (global acute malnutrition) data, an extrapolation methodology
must be defined to obtain information corresponding to successive periods of CH application. The
most regularly conducted SMART nutritional surveys cover the lean season (generally June to August)
and the post-harvest period (October to December), while the three CH analysis sessions are
scheduled for March, June, and November. Given the time lapse between the collection and
publication of results, it is rare that we could have up-to-date results corresponding to the analysis
period. In March and June, the available data is generally that from the previous November, and in
November, we only have the data from the previous June-August.
An estimation of results for required periods will result in an analysis of confidence interval trends
during the period between the two most recent survey visits during the same year. The objective is
not to determine an exact value at any given time but rather to determine the GAM rate according to
severity thresholds in the population, as defined by the reference table (5%-10%-15%-30%). For
illustrative purposes, below is an example using results from Mauritania in 2011.
Figure 1: Analysis of GAM confidence interval trends in Mauritania from 2011
By connecting the maximum and minimum values for the two visits in question, we can define a
probable outline of the changes in prevalence over time. We can estimate the GAM value at around
0
2,5
5
7,5
10
12,5
juillet août septembre octobre novembre Décembre

Cadre Harmonisé MANUAL Version 1.0
Page | 71
10% in August and at between 5% and 10% from September to November. This gives us a good
indication of the GAM situation at the time of the analysis.
1.3. Evaluation of data quality
The quality of anthropometric data is evaluated using both basic variables (weight, height, age,
gender, and the presence of edema) and Zscores. To evaluate the quality of weight and height
measurements, we look at the number of decimal places at the end of the results. When
measurements are taken correctly, all of the numbers should be expressed to one decimal place (0.0
to 0.9). When results are far from this value, there is likely a bias in the data collection. The quality of
age data is evaluated by the frequency of ages in multiples of 6 months. Gender data quality is
analyzed using the balance of girls and boys in the sample by five-year age groups. Weight-height
Zscores are evaluated using outliers, with a standard deviation that should be between [1.08–1.50].
Due to budgetary constraints and methodological rigor (given their seasonal nature), nutrition-specific
surveys are generally representative at the national and regional levels. When the analysis is done at
the sub-regional level, the difficulty lies in the inference or disaggregation of higher-level data at a
lower level. In many cases, national entities' knowledge of their country can help prioritize sub-entities
according to the difficulty of socio-economic conditions and the cultural context. Unfortunately, this
cannot be used to determine the GAM levels of sub-entities. In the absence of a consistent
methodology, the prevalence in the region is applied to the sub-entities within it. When the region is
homogenous, the bias related to this application is limited; however, this cannot always be
guaranteed.
1.4. Standardization of anthropometric measurements and equipment
- Standardization of anthropometric measurements: The standardization of anthropometric measurements and equipment is generally tested before nutritional data is collected. The aim is to correct any misunderstandings or errors in techniques for taking anthropometric measurements during training. The test consists of taking two series of measurements of the same sample of 10 children aged 6 to 59 months. The two series of measurements are compared to one another and then to those of an experienced tester. The differences between these repeated measurements are calculated in order to determine each measurer's accuracy (ability to take a series of measurements with an average value close to the trainer's measurements) and precision (variations observed in a surveyor who takes the same measurement several times). The test helps guarantee the quality of the anthropometric measurements collected. - Standardization of equipment: Consists of checking data collection tools before data is collected:
Each measuring stick is tested against a stick cut to 110 cm. Each scale is tested with a standard weight of 5 kg.
2. Indirect evidence of nutritional status
2.1. MUAC: Indirect evidence of nutritional status
Mid upper arm circumference (MUAC): global acute malnutrition13 proxy that indicates the possible
impacts of a current situation if nothing is done. There are two possibilities for evaluating acute
malnutrition using mid upper arm circumference; the first uses the gross value of the measurement.
13Explained in Annex 7.

Cadre Harmonisé MANUAL Version 1.0
Page | 72
Acute malnutrition is severe if the MUAC is below 115 mm. Acute malnutrition is considered
moderate if the MUAC is between 115 mm and 125 mm and at risk of malnutrition if the value is
between 125 mm and 135 mm. A measurement above 135 mm indicates a good nutritional status.
The second approach uses the determination of the Zscore as described above. The Zscore value
represents the standard deviation between the measurement for a child and the median for the
reference population with the same age and gender.
2.2. Treatment program admission data
No data on admission rate thresholding: − Use the comparison with the five-year average to avoid fluctuation effects. − Only use this data if there is a historical series. − How to use this indirect evidence: Use this number to specify the phase (phase maintained,
deteriorating, or improving). Vary the rate by + or -1%. Only change the class in extreme cases {5; 10; 15; 30}.
− Admission data in countries with a weak system: Completeness (85% of the total number of centers send data by a given date).

Cadre Harmonisé MANUAL Version 1.0
Page | 73
ANNEX 8: POTENTIAL INDIRECT EVIDENCE FOR CH ANALYSIS
Table: Other contributing factors
Food security
outcomes Contributing factors
Foo
d
con
sum
pti
on
Changes in spending habits in favor of less expensive and less nutritional foods
Number of meals a day
Number of food groups consumed
Ch
ange
s in
live
liho
od
s
Productive asset holdings (such as bicycles and farm equipment) and recent changes in property ownership
Livestock holdings and recent changes in property ownership (breeding animals sold on the markets, losses following natural disasters and/or epidemics, etc.)
Expansion of informal housing in undeveloped, peri-urban areas
Internally displaced persons / concentration of refugees
Prevalence of extreme behaviors, for example, begging, prostitution, etc.
Changes in ICN, NDVI, VCI, SNDVI, pasture availability
Changes in livestock numbers (breeding animals)
Animal watering holes (accessibility, distance, availability, etc.)
Nu
trit
ion
al
stat
us
Admissions to food assistance programs
Prevalence of low birth weight babies
Infant and young child feeding practices
Mo
rtal
ity Infant mortality rate (under 1 year)
Neonatal mortality (under 1 month)
Fatality rate (malaria, measles, diarrhea, acute respiratory infections)
Under 5 death rate (U5dR)

Cadre Harmonisé MANUAL Version 1.0
Page | 74
Annex 9: STEP 1, TABLE 1 – INVENTORY OF evidence COUNTRY : Inventory of available evidence about INDICATORS OF RESULTS
5. Based on the available data of all factors that may have an impact on food security, complete the table by classifying these data into elements of the Harmonized Framework's analytical framework AT THE ADMINISTRATIVE THIRD LEVEL. The data list should be as exhaustive as possible. Some evidence can be qualitative or from nonscientific sources (media, discussions ...)
6. In the first section of the table, insert the name of the region of analysis, the name of the administrative unit, level 2 and the period of analysis. This period may extend from one day to several months depending on the data and expert consensus. Then add the current population (the most recent data at the time of analysis) of the administrative unit, level 2. Finally, enter a brief description of the zones of livelihoods that may contain a descriptive of the population groups, wealth…
7. Then, specify for each evidence, the level at which it is available: first administrative level=0, second level = 1 or third level = 2. For example, provincial market prices have increased by 200% compared to the same period last year (N = 2).If the evidence is accompanied by population figures add these. For example, 200,000 people have been affected by the floods.
8. In the column 'Source of each evidence’ specify the source of the evidence. If several authors, please indicate them all. In cases where evidence is in non-finalized (draft) format, please indicate it. For each evidence specify the date on which the data were collected or the date at which analyzes were conducted (for scores proxy for example). Do not indicate only the date of publication of the final report.
2nd administrative level : 3rd administrative level : Date of HF cycle :
Current population:
Brief description of zones of livelihoods:
INDICATORS OF RESULT Evidence(s) + FIGURES Source of each
evidence Data date
Foo
d
Co
nsu
mp
tio
n Caloric proxy
Food Consumption Score
Household Dietary Diversity Index(HDDS)
Coping Strategies Index (CSI)
HEA, % of survival deficit
Households Hunger Scale (HHS)
Evo
luti
on
o
f liv
elih
oo
ds
Evolution of effective of livestock (reproductive)
Ownership of productive assets, such as bicycles and agricultural

Cadre Harmonisé MANUAL Version 1.0
Page | 75
tools, and recent changes in ownership
HEA ,protection of livelihoods
Other
Nu
trit
ion
al
sta
tus GAM
Prevalence of BMI (<18,5)
Mo
rtal
ity
CMR
U5MR
MUAZ (<-2 Zscore) MUAC (<11,5 cm)
STEP 1, TABLE 1 – INVENTORY OF EVIDENCE COUNTRY : ________________ Inventory of available evidence about contributive indicators
4. Based on the available data of all factors that may have an impact on food security, complete the table by classifying these data into elements of the Harmonized Framework's analytical framework AT THE ADMINISTRATIVE THIRD LEVEL. The data list should be as exhaustive as possible. Some evidence can be qualitative or from nonscientific sources (media, discussions ...)
5. In the first section of the table, insert the name of the region of analysis, the name of the administrative unit, level 2 and the period of analysis. This period may extend from one day to several months depending on the data and expert consensus. Then add the current population (the most recent data at the time of analysis) of the administrative unit, level 2. Finally, enter a brief description of the zones of livelihoods that may contain a descriptive of the population groups, wealth…
6. Then, specify for each evidence, the level at which it is available: first administrative level=0, second level = 1 or third level = 2. For example, provincial market prices have increased by 200% compared to the same period last year (N = 2).If the evidence is accompanied by population figures add these. For example, 200,000 people have been affected by the floods.
7. In the column 'Source of each evidence’ specify the source of the evidence. If several authors, please indicate them all. In cases where evidence is in non-finalized (draft) format, please indicate it.
8. For each evidence specify the date on which the data were collected or the date at which analyzes were conducted (for scores proxy for example). Do not indicate only the date of publication of the final report.
2nd administrative level : __ 3rd administrative level : ____________________________ Date of HF cycle :
Current population
Brief description of zones of livelihoods :.

Cadre Harmonisé MANUAL Version 1.0
Page | 76
CONTRIBUTIVE INDICATORS Evidence(s) + FIGURES Source of each
evidence Data date
Haz
ard
s an
d V
uln
era
bili
ty For example:
Civil security Exceptional phenomena Drought floods Very strong winds Pest Invasion (locusts, pests and insects) Conflicts Population displacements Internally displaced persons, refugees concentrations Prevalence of HIV/AIDS
Li
velih
oo
ds
For example: - Evolution of the ICN - Pastures availability - Pastures accessibility - Fodder balance from biomass and
resident livestock - Water for livestock - Humanitarian aid (distribution report)
*
Acc
ess
to
fo
od
For example: Monthly price changes 3 main food / average of 5 years Monthly price changes 3 main cash crops / average of 5 years Evolution of terms of trade / purchasing power Changes transfers from migration or migration / average 5 years Prevalence of extreme behavior, such as begging Distance of markets / density markets Percentage of population belonging to quintile of wealth / the lowest wealth index
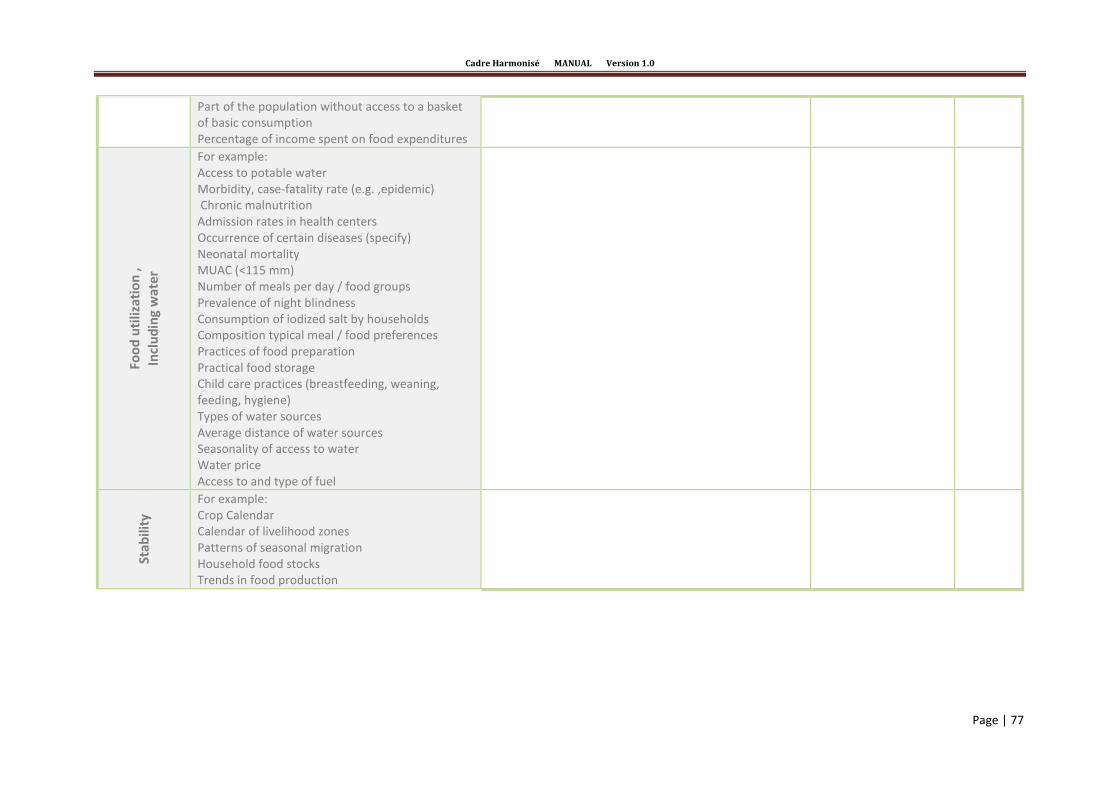
Cadre Harmonisé MANUAL Version 1.0
Page | 77
Part of the population without access to a basket of basic consumption Percentage of income spent on food expenditures
Foo
d u
tili
zati
on
,
Incl
ud
ing
wat
er
For example: Access to potable water Morbidity, case-fatality rate (e.g. ,epidemic) Chronic malnutrition Admission rates in health centers Occurrence of certain diseases (specify) Neonatal mortality MUAC (<115 mm) Number of meals per day / food groups Prevalence of night blindness Consumption of iodized salt by households Composition typical meal / food preferences Practices of food preparation Practical food storage Child care practices (breastfeeding, weaning, feeding, hygiene) Types of water sources Average distance of water sources Seasonality of access to water Water price Access to and type of fuel
St
abili
ty
For example: Crop Calendar Calendar of livelihood zones Patterns of seasonal migration Household food stocks Trends in food production
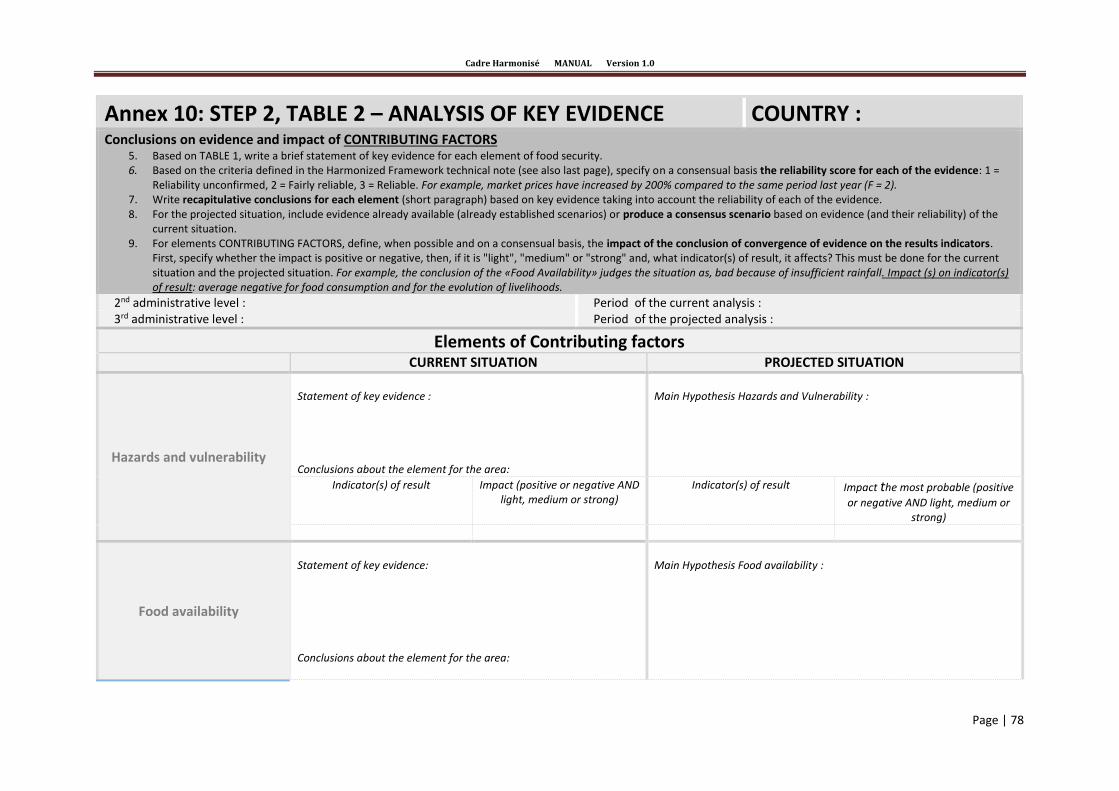
Cadre Harmonisé MANUAL Version 1.0
Page | 78
Annex 10: STEP 2, TABLE 2 – ANALYSIS OF KEY EVIDENCE COUNTRY : Conclusions on evidence and impact of CONTRIBUTING FACTORS
5. Based on TABLE 1, write a brief statement of key evidence for each element of food security. 6. Based on the criteria defined in the Harmonized Framework technical note (see also last page), specify on a consensual basis the reliability score for each of the evidence: 1 =
Reliability unconfirmed, 2 = Fairly reliable, 3 = Reliable. For example, market prices have increased by 200% compared to the same period last year (F = 2). 7. Write recapitulative conclusions for each element (short paragraph) based on key evidence taking into account the reliability of each of the evidence. 8. For the projected situation, include evidence already available (already established scenarios) or produce a consensus scenario based on evidence (and their reliability) of the
current situation. 9. For elements CONTRIBUTING FACTORS, define, when possible and on a consensual basis, the impact of the conclusion of convergence of evidence on the results indicators.
First, specify whether the impact is positive or negative, then, if it is "light", "medium" or "strong" and, what indicator(s) of result, it affects? This must be done for the current situation and the projected situation. For example, the conclusion of the «Food Availability» judges the situation as, bad because of insufficient rainfall. Impact (s) on indicator(s) of result: average negative for food consumption and for the evolution of livelihoods.
2nd administrative level : Period of the current analysis : 3rd administrative level : Period of the projected analysis :
Elements of Contributing factors
CURRENT SITUATION PROJECTED SITUATION
Hazards and vulnerability
Statement of key evidence : Conclusions about the element for the area:
Main Hypothesis Hazards and Vulnerability :
Indicator(s) of result Impact (positive or negative AND light, medium or strong)
Indicator(s) of result Impact the most probable (positive
or negative AND light, medium or strong)
Food availability
Statement of key evidence:
Conclusions about the element for the area:
Main Hypothesis Food availability :

Cadre Harmonisé MANUAL Version 1.0
Page | 79
Indicator(s) of result Food consumption
Impact (positive or negative AND light, medium or strong)
Indicator(s) of result Food consumption
Impact the most probable (positive
or negative AND light, medium or strong)
Access to food
Statement of key evidence:
Conclusions about the element for the area:
Main Hypothesis Access to food: Conclusions about the element for the area:
Indicator(s) of result Food consumption
Impact (positive or negative AND light, medium or strong)
Indicator(s) of result Impact the most probable (positive
or negative AND light, medium or strong)
Livelihoods
Statement of key evidence: Conclusions about the element for the area:
Main Hypothesis Livelihoods :
Indicator(s) of result Evolution of livelihood
Impact (positive or negative AND light, medium or strong)
Indicator(s) of result Evolution of livelihood
Impact the most probable (positive
or negative AND light, medium or strong)
Food utilization, including water
Statement of key evidence:
Main Hypothesis Food utilization, including water :

Cadre Harmonisé MANUAL Version 1.0
Page | 80
Conclusions about the element for the area:
Indicator(s) of result Impact (positive or negative AND light, medium or strong)
Indicator(s) of result Impact the most probable (positive
or negative AND light, medium or strong)
Stability
Statement of key evidence: Conclusions about the element for the area:
Main Hypothesis Stability :
Indicator(s) of result Impact (positive or negative AND light, medium or strong)
Indicator(s) of result Impact the most probable (positive
or negative AND light, medium or strong)

Cadre Harmonisé MANUAL Version 1.0
Page | 81
STEP 2, TABLE 2 – ANALYSIS OF KEY EVIDENCE COUNTRY: Conclusions on evidence and impact of CONTRIBUTING FACTORS
2. Based on TABLE 1, write a brief statement of key evidence for each element of food security. 3. Based on the criteria defined in the Harmonized Framework technical note (see also last page), specify on a consensual basis the reliability score for each of the evidence: 1 = Reliability
unconfirmed, 2 = Fairly reliable, 3 = Reliable. For example, market prices have increased by 200% compared to the same period last year (F = 2). 4. Write recapitulative conclusions for each element (short paragraph) based on key evidence taking into account the reliability of each of the evidence. 5. For the projected situation, include evidence already available (already established scenarios) or produce a consensus scenario based on evidence (and their reliability) of the current situation.
For elements CONTRIBUTING FACTORS, define, when possible and on a consensual basis, the impact of the conclusion of convergence of evidence on the results indicators. First, specify whether the impact is positive or negative, then, if it is "light", "medium" or "strong" and, what indicator(s) of result, it affects? This must be done for the current situation and the projected situation. For example, the conclusion of the «Food Availability» judges the situation as, bad because of insufficient rainfall. Impact (s) on indicator(s) of result: average negative for food consumption and for the evolution of livelihoods.
2nd administrative level Period of the current analysis : 3rd administrative level : Period of the projected analysis :
Elements of indicators of results
CURRENT SITUATION PROJECTED SITUATION
Foo
d
Co
nsu
mp
tio
n
Statement of key evidence: Conclusions about the element for the area:
Main hypothesisFood Consumption: Conclusions about the element for the area:
Classification of the element – Classification of the element –
Evo
luti
on
of
livel
iho
od
s
Statement of key evidence: Conclusions about the element for the area:
Main hypothesisEvolution of livelihoods: Conclusions about the element for the area:
CHOOSE Classification of the element – Phase
CHOOSE Classification of the element – Phase
Z1 : 9 Z2 : 10 Z3 : 11 Z4 : 12 Z5 : Z1 : 9 Z2 : 10 Z3 : 11 Z4 : 12
Nu
trit
ion
al
stat
us
Statement of key evidence: Conclusions about the element for the area:
Main hypothesis Nutritional status : Conclusions about the element for the area:
Classification of the element – Classification of the element –
Mo
rtal
ity Statement of key evidence: Conclusions about the element for the area:
Main hypothesis Mortality : Conclusions about the element for the area:
Classification of the element – Classification of the element –
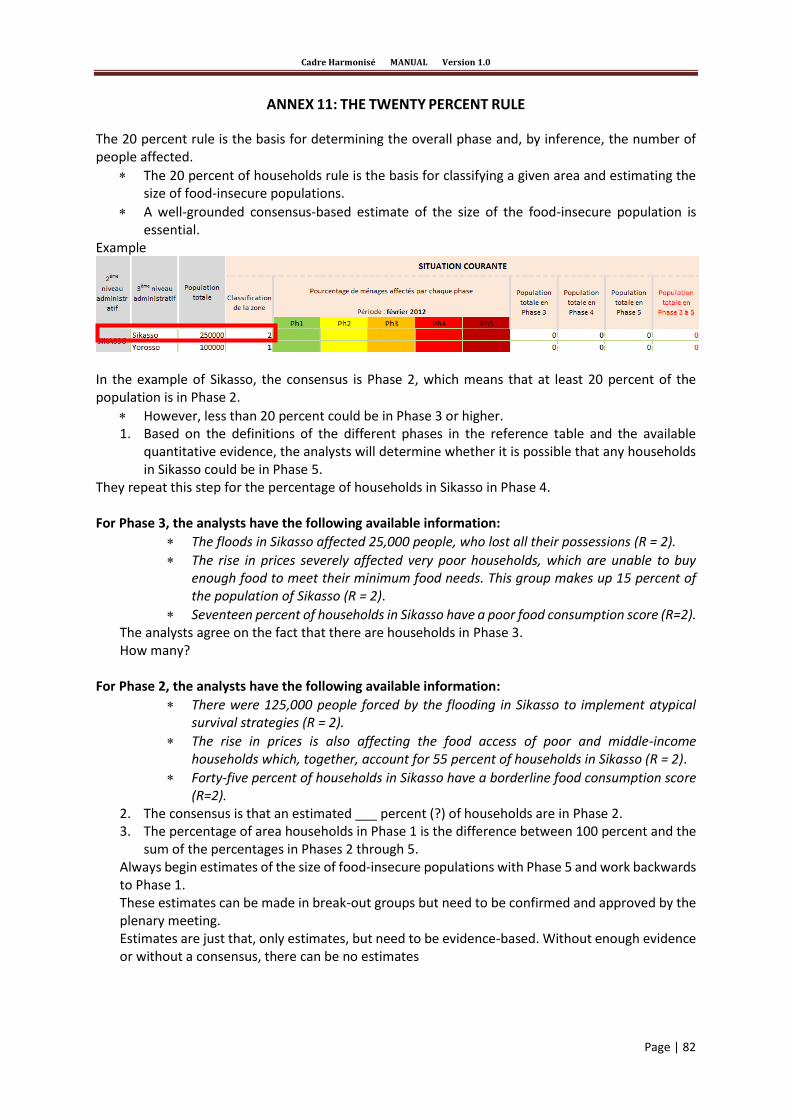
Cadre Harmonisé MANUAL Version 1.0
Page | 82
ANNEX 11: THE TWENTY PERCENT RULE
The 20 percent rule is the basis for determining the overall phase and, by inference, the number of people affected.
The 20 percent of households rule is the basis for classifying a given area and estimating the size of food-insecure populations.
A well-grounded consensus-based estimate of the size of the food-insecure population is essential.
Example
In the example of Sikasso, the consensus is Phase 2, which means that at least 20 percent of the population is in Phase 2.
However, less than 20 percent could be in Phase 3 or higher. 1. Based on the definitions of the different phases in the reference table and the available
quantitative evidence, the analysts will determine whether it is possible that any households in Sikasso could be in Phase 5.
They repeat this step for the percentage of households in Sikasso in Phase 4. For Phase 3, the analysts have the following available information:
The floods in Sikasso affected 25,000 people, who lost all their possessions (R = 2).
The rise in prices severely affected very poor households, which are unable to buy enough food to meet their minimum food needs. This group makes up 15 percent of the population of Sikasso (R = 2).
Seventeen percent of households in Sikasso have a poor food consumption score (R=2). The analysts agree on the fact that there are households in Phase 3. How many?
For Phase 2, the analysts have the following available information:
There were 125,000 people forced by the flooding in Sikasso to implement atypical survival strategies (R = 2).
The rise in prices is also affecting the food access of poor and middle-income households which, together, account for 55 percent of households in Sikasso (R = 2).
Forty-five percent of households in Sikasso have a borderline food consumption score (R=2).
2. The consensus is that an estimated ___ percent (?) of households are in Phase 2. 3. The percentage of area households in Phase 1 is the difference between 100 percent and the
sum of the percentages in Phases 2 through 5. Always begin estimates of the size of food-insecure populations with Phase 5 and work backwards to Phase 1. These estimates can be made in break-out groups but need to be confirmed and approved by the plenary meeting. Estimates are just that, only estimates, but need to be evidence-based. Without enough evidence or without a consensus, there can be no estimates
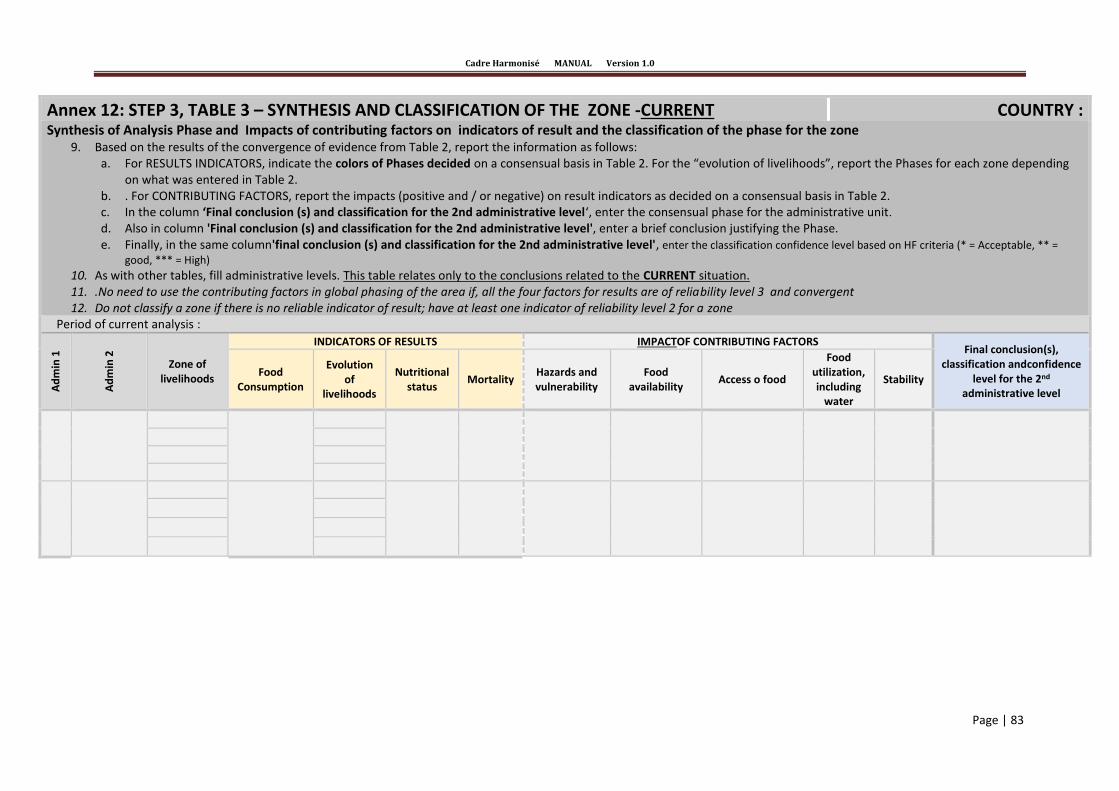
Cadre Harmonisé MANUAL Version 1.0
Page | 83
Annex 12: STEP 3, TABLE 3 – SYNTHESIS AND CLASSIFICATION OF THE ZONE -CURRENT COUNTRY : Synthesis of Analysis Phase and Impacts of contributing factors on indicators of result and the classification of the phase for the zone
9. Based on the results of the convergence of evidence from Table 2, report the information as follows: a. For RESULTS INDICATORS, indicate the colors of Phases decided on a consensual basis in Table 2. For the “evolution of livelihoods”, report the Phases for each zone depending
on what was entered in Table 2. b. . For CONTRIBUTING FACTORS, report the impacts (positive and / or negative) on result indicators as decided on a consensual basis in Table 2. c. In the column ‘Final conclusion (s) and classification for the 2nd administrative level‘, enter the consensual phase for the administrative unit. d. Also in column 'Final conclusion (s) and classification for the 2nd administrative level', enter a brief conclusion justifying the Phase. e. Finally, in the same column'final conclusion (s) and classification for the 2nd administrative level', enter the classification confidence level based on HF criteria (* = Acceptable, ** =
good, *** = High) 10. As with other tables, fill administrative levels. This table relates only to the conclusions related to the CURRENT situation. 11. .No need to use the contributing factors in global phasing of the area if, all the four factors for results are of reliability level 3 and convergent 12. Do not classify a zone if there is no reliable indicator of result; have at least one indicator of reliability level 2 for a zone
Period of current analysis :
Ad
min
1
Ad
min
2
Zone of livelihoods
INDICATORS OF RESULTS IMPACTOF CONTRIBUTING FACTORS Final conclusion(s),
classification andconfidence level for the 2nd
administrative level
Food Consumption
Evolution of
livelihoods
Nutritional status
Mortality Hazards and vulnerability
Food availability
Access o food
Food utilization, including
water
Stability

Cadre Harmonisé MANUAL Version 1.0
Page | 84
STEP 3, TABLE 4 – SYNTHESIS AND CLASSIFICATION OF THE ZONE - PROJECTED COUNTRY : Synthesis of Analysis Phase and Impacts of contributing factors on indicators of result and the classification of the phase for the zone
1. Based on the results of the convergence of evidence from Table 2, report the information as follows: a. For RESULTS INDICATORS, indicate the colors of Phases decided on a consensual basis in Table 2. For the “evolution of livelihoods”, report the Phases for each zone
depending on what was entered in Table 2. b. . For CONTRIBUTING FACTORS, report the impacts (positive and / or negative) on result indicators as decided on a consensual basis in Table 2. c. In the column ‘Final conclusion (s) and classification for the 2nd administrative level‘, enter the consensual phase for the administrative unit. d. Also in column 'Final conclusion (s) and classification for the 2nd administrative level', enter a brief conclusion justifying the Phase. e. Finally, in the same column 'Final conclusion (s) and classification for the 2nd administrative level', enter the classification confidence level based on HF criteria (* = Acceptable,
** = good, *** = High) 2. As with other tables, fill administrative levels. This table relates only to the conclusions related to the PROJECTED situation. 3. .No need to use the contributing factors in global phasing of the area if, all the four factors for results are of reliability level 3 and convergent
Do not classify a zone if there is no reliable indicator of result; have at least one indicator of reliability level 2 for a zone Period of analysisprojected : ____________________________________________
Ad
min
1
Ad
min
2
Zone of livelihoods
INDICATORS OF RESULTS IMPACTOF CONTRIBUTING FACTORS Final Conclusion(s) and classification
for the 2nd administrative
level
Food Consumption
Evolution of
livelihoods
Nutritional status
Mortality Hazards and vulnerability
Food availability
Access to food
Food utilization,including
water Stability
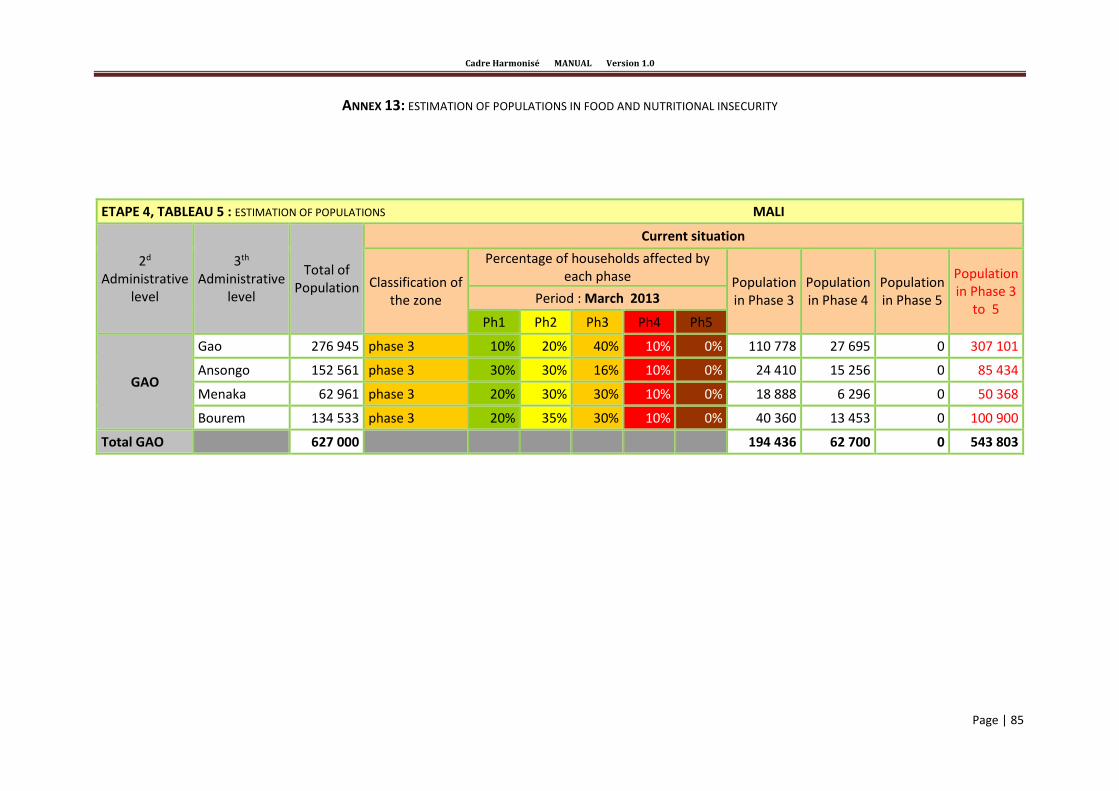
Cadre Harmonisé MANUAL Version 1.0
Page | 85
ANNEX 13: ESTIMATION OF POPULATIONS IN FOOD AND NUTRITIONAL INSECURITY
ETAPE 4, TABLEAU 5 : ESTIMATION OF POPULATIONS MALI
2d
Administrative level
3th Administrative
level
Total of Population
Current situation
Classification of the zone
Percentage of households affected by each phase Population
in Phase 3 Population in Phase 4
Population in Phase 5
Population in Phase 3
to 5 Period : March 2013
Ph1 Ph2 Ph3 Ph4 Ph5
GAO
Gao 276 945 phase 3 10% 20% 40% 10% 0% 110 778 27 695 0 307 101
Ansongo 152 561 phase 3 30% 30% 16% 10% 0% 24 410 15 256 0 85 434
Menaka 62 961 phase 3 20% 30% 30% 10% 0% 18 888 6 296 0 50 368
Bourem 134 533 phase 3 20% 35% 30% 10% 0% 40 360 13 453 0 100 900
Total GAO 627 000 194 436 62 700 0 543 803
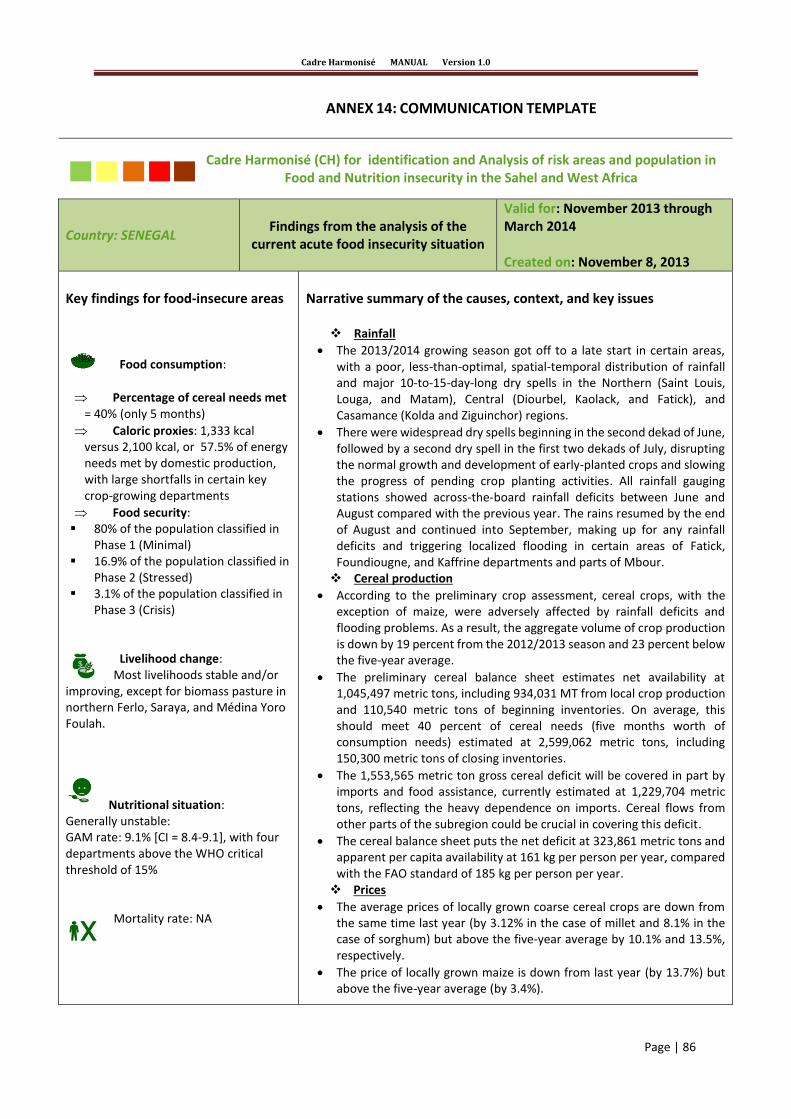
Cadre Harmonisé MANUAL Version 1.0
Page | 86
ANNEX 14: COMMUNICATION TEMPLATE
Cadre Harmonisé (CH) for identification and Analysis of risk areas and population in Food and Nutrition insecurity in the Sahel and West Africa
Country: SENEGAL Findings from the analysis of the
current acute food insecurity situation
Valid for: November 2013 through March 2014 Created on: November 8, 2013
Key findings for food-insecure areas
Food consumption:
Percentage of cereal needs met = 40% (only 5 months)
Caloric proxies: 1,333 kcal versus 2,100 kcal, or 57.5% of energy needs met by domestic production, with large shortfalls in certain key crop-growing departments
Food security: 80% of the population classified in
Phase 1 (Minimal) 16.9% of the population classified in
Phase 2 (Stressed) 3.1% of the population classified in
Phase 3 (Crisis) Livelihood change:
Most livelihoods stable and/or improving, except for biomass pasture in northern Ferlo, Saraya, and Médina Yoro Foulah.
Nutritional situation:
Generally unstable: GAM rate: 9.1% [CI = 8.4-9.1], with four departments above the WHO critical threshold of 15%
Mortality rate: NA
Narrative summary of the causes, context, and key issues
Rainfall
The 2013/2014 growing season got off to a late start in certain areas, with a poor, less-than-optimal, spatial-temporal distribution of rainfall and major 10-to-15-day-long dry spells in the Northern (Saint Louis, Louga, and Matam), Central (Diourbel, Kaolack, and Fatick), and Casamance (Kolda and Ziguinchor) regions.
There were widespread dry spells beginning in the second dekad of June, followed by a second dry spell in the first two dekads of July, disrupting the normal growth and development of early-planted crops and slowing the progress of pending crop planting activities. All rainfall gauging stations showed across-the-board rainfall deficits between June and August compared with the previous year. The rains resumed by the end of August and continued into September, making up for any rainfall deficits and triggering localized flooding in certain areas of Fatick, Foundiougne, and Kaffrine departments and parts of Mbour. Cereal production
According to the preliminary crop assessment, cereal crops, with the exception of maize, were adversely affected by rainfall deficits and flooding problems. As a result, the aggregate volume of crop production is down by 19 percent from the 2012/2013 season and 23 percent below the five-year average.
The preliminary cereal balance sheet estimates net availability at 1,045,497 metric tons, including 934,031 MT from local crop production and 110,540 metric tons of beginning inventories. On average, this should meet 40 percent of cereal needs (five months worth of consumption needs) estimated at 2,599,062 metric tons, including 150,300 metric tons of closing inventories.
The 1,553,565 metric ton gross cereal deficit will be covered in part by imports and food assistance, currently estimated at 1,229,704 metric tons, reflecting the heavy dependence on imports. Cereal flows from other parts of the subregion could be crucial in covering this deficit.
The cereal balance sheet puts the net deficit at 323,861 metric tons and apparent per capita availability at 161 kg per person per year, compared with the FAO standard of 185 kg per person per year. Prices
The average prices of locally grown coarse cereal crops are down from the same time last year (by 3.12% in the case of millet and 8.1% in the case of sorghum) but above the five-year average by 10.1% and 13.5%, respectively.
The price of locally grown maize is down from last year (by 13.7%) but above the five-year average (by 3.4%).
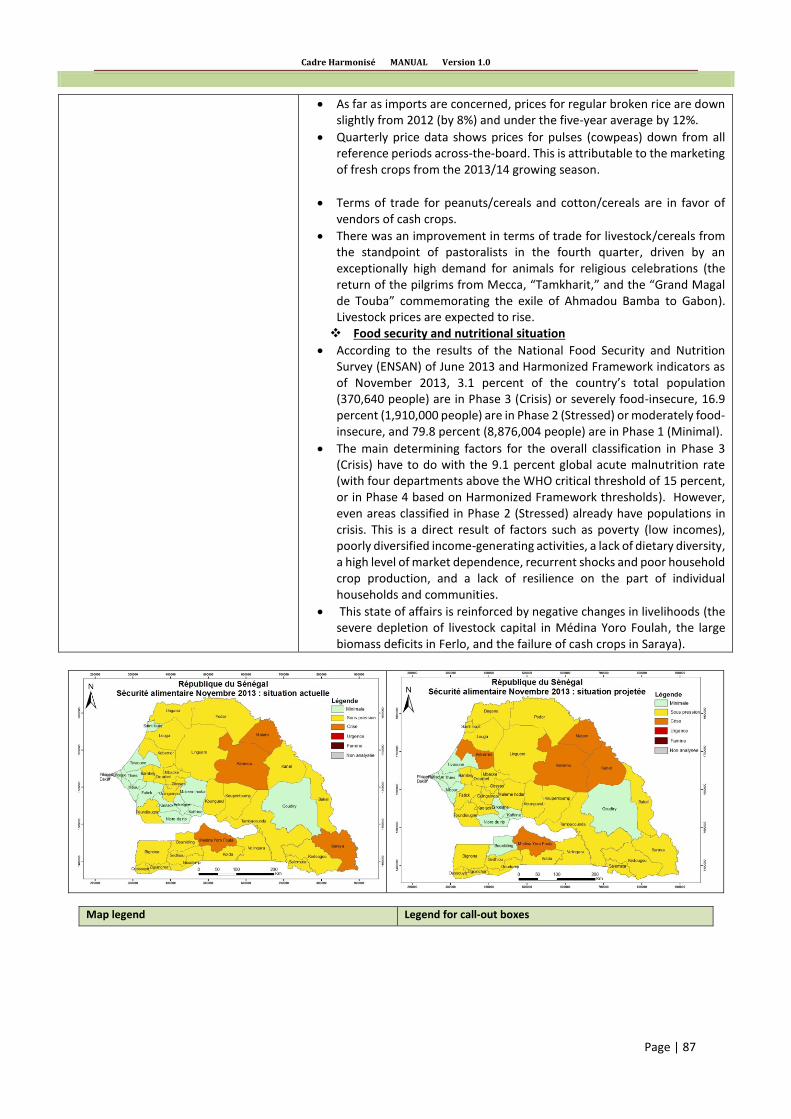
Cadre Harmonisé MANUAL Version 1.0
Page | 87
Map legend Legend for call-out boxes
As far as imports are concerned, prices for regular broken rice are down slightly from 2012 (by 8%) and under the five-year average by 12%.
Quarterly price data shows prices for pulses (cowpeas) down from all reference periods across-the-board. This is attributable to the marketing of fresh crops from the 2013/14 growing season.
Terms of trade for peanuts/cereals and cotton/cereals are in favor of vendors of cash crops.
There was an improvement in terms of trade for livestock/cereals from the standpoint of pastoralists in the fourth quarter, driven by an exceptionally high demand for animals for religious celebrations (the return of the pilgrims from Mecca, “Tamkharit,” and the “Grand Magal de Touba” commemorating the exile of Ahmadou Bamba to Gabon). Livestock prices are expected to rise. Food security and nutritional situation
According to the results of the National Food Security and Nutrition Survey (ENSAN) of June 2013 and Harmonized Framework indicators as of November 2013, 3.1 percent of the country’s total population (370,640 people) are in Phase 3 (Crisis) or severely food-insecure, 16.9 percent (1,910,000 people) are in Phase 2 (Stressed) or moderately food-insecure, and 79.8 percent (8,876,004 people) are in Phase 1 (Minimal).
The main determining factors for the overall classification in Phase 3 (Crisis) have to do with the 9.1 percent global acute malnutrition rate (with four departments above the WHO critical threshold of 15 percent, or in Phase 4 based on Harmonized Framework thresholds). However, even areas classified in Phase 2 (Stressed) already have populations in crisis. This is a direct result of factors such as poverty (low incomes), poorly diversified income-generating activities, a lack of dietary diversity, a high level of market dependence, recurrent shocks and poor household crop production, and a lack of resilience on the part of individual households and communities.
This state of affairs is reinforced by negative changes in livelihoods (the severe depletion of livestock capital in Médina Yoro Foulah, the large biomass deficits in Ferlo, and the failure of cash crops in Saraya).
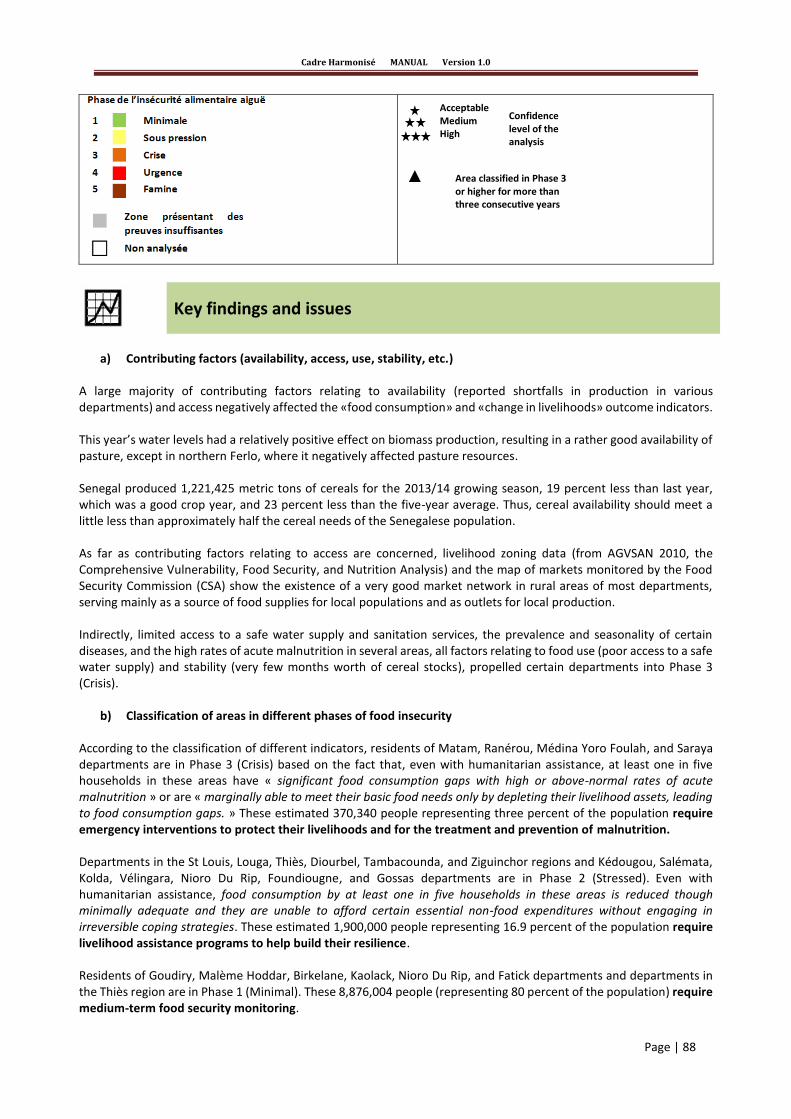
Cadre Harmonisé MANUAL Version 1.0
Page | 88
Key findings and issues
a) Contributing factors (availability, access, use, stability, etc.)
A large majority of contributing factors relating to availability (reported shortfalls in production in various departments) and access negatively affected the «food consumption» and «change in livelihoods» outcome indicators. This year’s water levels had a relatively positive effect on biomass production, resulting in a rather good availability of pasture, except in northern Ferlo, where it negatively affected pasture resources. Senegal produced 1,221,425 metric tons of cereals for the 2013/14 growing season, 19 percent less than last year, which was a good crop year, and 23 percent less than the five-year average. Thus, cereal availability should meet a little less than approximately half the cereal needs of the Senegalese population.
As far as contributing factors relating to access are concerned, livelihood zoning data (from AGVSAN 2010, the Comprehensive Vulnerability, Food Security, and Nutrition Analysis) and the map of markets monitored by the Food Security Commission (CSA) show the existence of a very good market network in rural areas of most departments, serving mainly as a source of food supplies for local populations and as outlets for local production. Indirectly, limited access to a safe water supply and sanitation services, the prevalence and seasonality of certain diseases, and the high rates of acute malnutrition in several areas, all factors relating to food use (poor access to a safe water supply) and stability (very few months worth of cereal stocks), propelled certain departments into Phase 3 (Crisis).
b) Classification of areas in different phases of food insecurity According to the classification of different indicators, residents of Matam, Ranérou, Médina Yoro Foulah, and Saraya departments are in Phase 3 (Crisis) based on the fact that, even with humanitarian assistance, at least one in five households in these areas have « significant food consumption gaps with high or above-normal rates of acute malnutrition » or are « marginally able to meet their basic food needs only by depleting their livelihood assets, leading to food consumption gaps. » These estimated 370,340 people representing three percent of the population require emergency interventions to protect their livelihoods and for the treatment and prevention of malnutrition. Departments in the St Louis, Louga, Thiès, Diourbel, Tambacounda, and Ziguinchor regions and Kédougou, Salémata, Kolda, Vélingara, Nioro Du Rip, Foundiougne, and Gossas departments are in Phase 2 (Stressed). Even with humanitarian assistance, food consumption by at least one in five households in these areas is reduced though minimally adequate and they are unable to afford certain essential non-food expenditures without engaging in irreversible coping strategies. These estimated 1,900,000 people representing 16.9 percent of the population require livelihood assistance programs to help build their resilience. Residents of Goudiry, Malème Hoddar, Birkelane, Kaolack, Nioro Du Rip, and Fatick departments and departments in the Thiès region are in Phase 1 (Minimal). These 8,876,004 people (representing 80 percent of the population) require medium-term food security monitoring.
Confidence level of the analysis
Acceptable Medium High
Area classified in Phase 3 or higher for more than three consecutive years

Cadre Harmonisé MANUAL Version 1.0
Page | 89
c) Outlook (expected trends in prices based on market conditions and in production based on projected climatic factors/rainfall, etc.)
With the beginning of the marketing season for peanuts and the threshing of coarse cereal crops in rural crop-producing areas, there will be a sizeable increase in the marketable volume of agricultural commodities from rural areas. Resulting shipments of commodities to retail markets will swell market inventories. Prices will quickly start to inch downwards or, at worst, level off. The steady hulling of paddy rice in rice mills will help ensure plentiful supplies of locally produced hulled rice on markets in the northern part of the country (the Matam, St-Louis, and Louga regions).
The large trader inventories and steady influx of imports with the large stocks and affordable prices on Asian export markets should ensure a good availability of this staple cereal consumed by households across the country.
The combined effects of these internal and external factors should at least stabilize, if not bring down cereal prices slightly. Movements in prices should stay in line with normal seasonal trends through the month of June, inching upwards as local cereal stocks dwindle with the approach of the lean season. However, the large production deficits in certain rural communities and/or departments could cause conditions to deteriorate with the depressed levels of on-farm food stocks and shortfalls in farm income.
Methodology and issues in the HF analysis
a) Approach and composition of the Multidisciplinary Analysis Group, upstream tasks performed prior
to the analysis, etc. Upon the announcement of the date of the Harmonized Framework (HF) workshop, the Executive Secretariat of the National Food Security Council (SECNSA) contacted the Early Warning System (SAP) members forming the Country Analysis Unit, namely the DA, CSA, ANACIM, DAPSA, SIM, etc., and interested technical partners (the WFP, FAO, UNICEF, WHO) and NGOs (ACF, Save the Children, OXFAM, etc.) for the collection of necessary data for the analysis process.
The SECNSA assembled the incoming data, which was used to complete the template for Step 1. Invitations to the workshop were extended to all structures involved in the Country Analysis Unit and interested partner organizations (the WFP, FAO, ACF, Save the Children, OXFAM, etc.) and NGOs (the Senegalese Red Cross and CARITAS). A total of 22 country experts took part in the training session conducted on November 4th and the analysis performed over the period from November 4th through 8th facilitated by Mr. Sébatien SUBSOL, Regional Technical Advisor to the CILSS, assisted by co-facilitators Papa Soumaré (FAO), Mrs. Barbara Frattaruolo (ACF), Nasser (Fews Net), Malick NDIAYE (WFP region), and Paola Cadoni (IPC 2) (see the attached list of participants).
b) Methodology
Following a half-day plenary training session and hands-on exercise for the completion of Template 1 and the Analysis Worksheets and Reporting Templates (F2 and F3) for Bignona department, the participants broke up into three working groups headed by a chairperson, assisted by a rapporteur and facilitator. The group work beginning in the afternoon of the first day went smoothly. Based on the availability of departmental (level 3) data, the original HF method was used to inventory the evidence, perform the analysis, and classify outcome indicators in relevant phases of food insecurity. Contrary to the approach taken in the March 2013 HF analysis, the evidence on contributing factors was inventoried by department notwithstanding the similarity of departments within the same region. Thus, the groups were able to draw information from the evidence sheets, analyze the data, and draw conclusions serving as the basis for classifying each department in a phase of food insecurity.

Cadre Harmonisé MANUAL Version 1.0
Page | 90
The facilitators proposed a method of calculating the size of affected populations, which was discussed at the plenary session held in the afternoon of the fourth day and approved first thing in the morning on the last day, thereby allowing the teams to proceed with these calculations. It involved drawing inferences from the departmental food consumption scores (FCS) for June 2013 based on major contributing factors such as the number of months of cereal stocks from projected crop production, the terms of trade for peanuts/rice and livestock/rice, the NDVI, and seasonal trends in fish catches in coastal areas and the twenty percent rule. The afternoon of the fifth day was devoted to discussing the general findings by the three groups (the phase classification, maps, and population estimates) in a plenary session and completing a draft of the Communication Template. The workshop ended with the approval of the Communication Template by all participants.
c) Level of analysis The analysis was conducted at administrative level 3, based on the country’s territorial division into departments, using available data broken down by department (farm survey data and monitoring data for the growing season and rainfall activity, on nutrition, markets, etc.) The inventory templates were not completed prior to the workshop but could be filled out quickly without slowing down the analysis due, mainly, to the quality of the training received by the participants during the March 2013 exercise, reinforced by the November 2013 exercise, and to the prior collection of all necessary information. No problems were encountered in completing Template 1, since the necessary data was available in a usable format. On the other hand, the method of calculating the size of affected populations could stand to be improved.
d) Source of the data used in the analysis The data used in the analysis was supplied by the annual reports of different specialized agencies (DA, CSE, DAPSA, ANACIM, DHORT, ANA, SNIS, DANSE, DIREL, CSA, etc.), the reports on ENSAN 2013 (the National Food Security and Nutrition Survey) and EDS 3 (the Population and Health Survey), and monitoring activities for the current growing season.
e) Institutional issues and issues with the methodology/indicators and data/level of disaggregation
There were no institutional issues, given the massive response by all interested stakeholders to the invitation extended by the SECNSA. Nor were there any issues with the methodology/indicators, except for the lack of a method of calculating the size of the food-insecure (vulnerable) population.
Seasonal calendar and monitoring of indicators
a) Calendar of major seasonal activities and examination of available indicators in November
CALENDAR OF SEASONAL ACTIVITIES
Sources of income/activities
Jan.
Feb.
Mar.
Apr.
May
June
July
Aug.
Sept.
Oct.
Nov.
Dec.
Growing season (for millet, cowpeas, watermelon, bissap)
Land prep-
aration
Planting – Crop maintenance
Har-vest
Growing of peanuts and sorghum
Growing of maize
Sale of livestock/poultry
Picking of monkey bread fruit
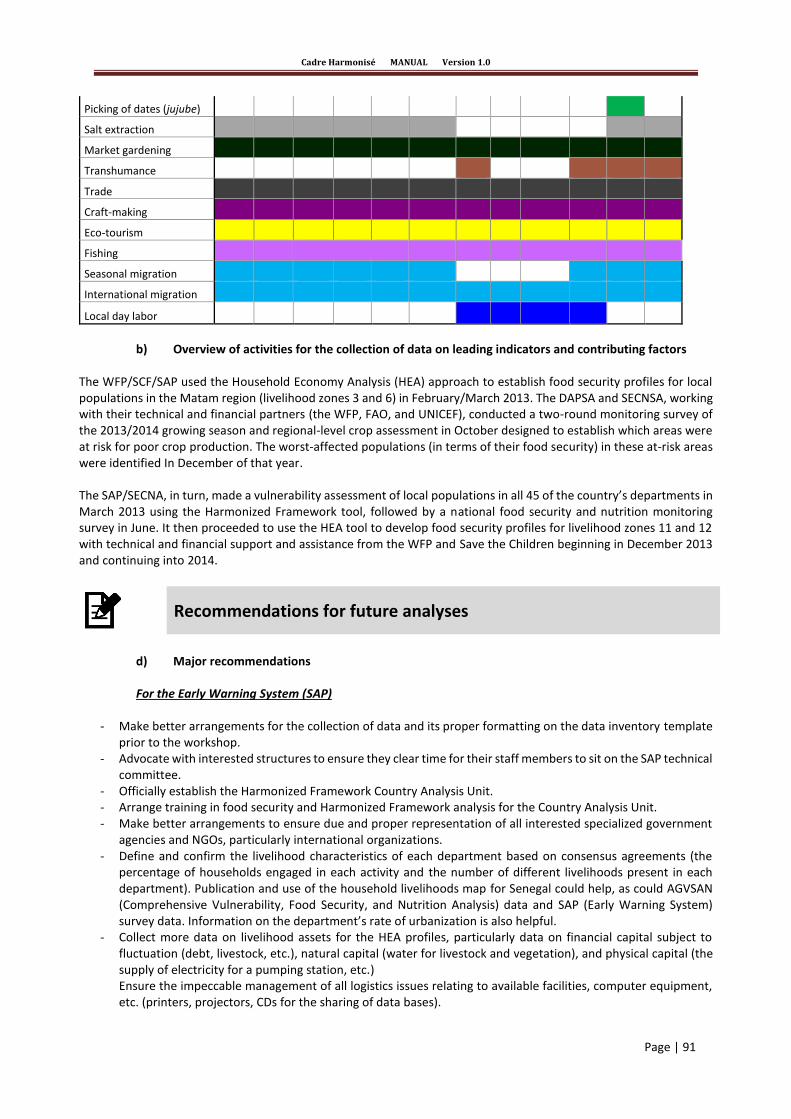
Cadre Harmonisé MANUAL Version 1.0
Page | 91
Picking of dates (jujube)
Salt extraction
Market gardening
Transhumance
Trade
Craft-making
Eco-tourism
Fishing
Seasonal migration
International migration
Local day labor
b) Overview of activities for the collection of data on leading indicators and contributing factors
The WFP/SCF/SAP used the Household Economy Analysis (HEA) approach to establish food security profiles for local populations in the Matam region (livelihood zones 3 and 6) in February/March 2013. The DAPSA and SECNSA, working with their technical and financial partners (the WFP, FAO, and UNICEF), conducted a two-round monitoring survey of the 2013/2014 growing season and regional-level crop assessment in October designed to establish which areas were at risk for poor crop production. The worst-affected populations (in terms of their food security) in these at-risk areas were identified In December of that year. The SAP/SECNA, in turn, made a vulnerability assessment of local populations in all 45 of the country’s departments in March 2013 using the Harmonized Framework tool, followed by a national food security and nutrition monitoring survey in June. It then proceeded to use the HEA tool to develop food security profiles for livelihood zones 11 and 12 with technical and financial support and assistance from the WFP and Save the Children beginning in December 2013 and continuing into 2014.
Recommendations for future analyses
d) Major recommendations For the Early Warning System (SAP)
- Make better arrangements for the collection of data and its proper formatting on the data inventory template prior to the workshop.
- Advocate with interested structures to ensure they clear time for their staff members to sit on the SAP technical committee.
- Officially establish the Harmonized Framework Country Analysis Unit. - Arrange training in food security and Harmonized Framework analysis for the Country Analysis Unit. - Make better arrangements to ensure due and proper representation of all interested specialized government
agencies and NGOs, particularly international organizations. - Define and confirm the livelihood characteristics of each department based on consensus agreements (the
percentage of households engaged in each activity and the number of different livelihoods present in each department). Publication and use of the household livelihoods map for Senegal could help, as could AGVSAN (Comprehensive Vulnerability, Food Security, and Nutrition Analysis) data and SAP (Early Warning System) survey data. Information on the department’s rate of urbanization is also helpful.
- Collect more data on livelihood assets for the HEA profiles, particularly data on financial capital subject to fluctuation (debt, livestock, etc.), natural capital (water for livestock and vegetation), and physical capital (the supply of electricity for a pumping station, etc.) Ensure the impeccable management of all logistics issues relating to available facilities, computer equipment, etc. (printers, projectors, CDs for the sharing of data bases).

Cadre Harmonisé MANUAL Version 1.0
Page | 92
- Formulate a response plan for providing emergency assistance to populations already in crisis and develop a contingency plan for departments affected by the projected production deficit for the 2013/14 growing season.
e) Things to monitor at the local level
- Provide emergency assistance to residents of each department classified in the Crisis phase of food insecurity to protect local livelihoods and prevent malnutrition and fatalities.
- Oversee and mount resilience-building activities in departments classified in the Stressed phase of food insecurity through March 2014, after which certain households in these departments could be propelled into Phase 3 (Crisis) without the adoption of appropriate preventive measures.
- The main determining factors for classifying areas as Stressed have to do with the state of nutrition, the level of food security, the improper use of food, and the projected production deficit for the 2013/14 growing season. It would be advisable to strengthen nutritional assistance programs, particularly information programs designed to promote changes in behavior.
- Promote fish farming in rural areas with poor access to sources of animal protein to improve the food security situation in these areas, since it is an activity that can be engaged in wherever there is a year-round water source (a river, lake, stream, borehole, or well). The use of water from fish farming operations in market gardening or rice-farming activities can help improve productivity due to its nitrogen content and help protect the environment by reducing the use of chemical fertilizer.
Contacts
*Last name-first name of the country’s Multidisciplinary Analysis Group (GMA) chairman / Organization name, email address, and telephone number:
Abdoulaye KA SE CNSA – [email protected] – (221) 77 569 53 03 + 221 33 869 01 99
*Last name-first name of the HF2 focal point / Organization name, email address, and telephone number:
Ibrahima NDIAYE Chef du bureau (Bureau Chief) SAP /SE CNSA – [email protected] – 221 77 722 31 31 + 221 33 889 75 50
Analysis partners
Logos of the organizations participating in the analysis Regional organizations
National government structures
SAP/SE CNSA
DA
CSA
ANSD
DANSE
DPMA
CSE
ANACIM
DEFCCS
ANA
DADL
DAPSA
SP-
CONACILSS
DIREL
DHORT

Cadre Harmonisé MANUAL Version 1.0
Page | 93
CSE
ANACIM
DEFCCS
ANA
DEEC
DAPSA
NGOs
Red Cross
CARITAS
Estimated size of the population in each phase of food insecurity
ANALYSIS AREA
DISTRICTS/ REGIONS
Total number of people
Phase 1 Phase 2 Phase 3 Phase 3 or higher
Number of people %
Number of people %
Number of people %
Number of people %
TOTAL 11 147 462 8 876 004 79.8 1 900 818 16.8 370 640 3.3
Recap of selected concepts
1. Food insecurity
This is the situation of populations below the required threshold for feeding themselves through household production and/or with their annual income forced to deplete their savings and, in some cases, sell their productive assets or ask for community assistance. A distinction is made between structural or chronic food insecurity due to a permanent inability to meet the food needs of household members and current or acute food insecurity due to unforeseen events.
2. Food crisis The concept of food crisis is defined in relation to a broad notion of food security whose ultimate goal is to « ensure universal year-round physical and economic access to needed dietary staples. » A crisis arises when populations are atypically unable to feed themselves, either due to inadequate food availability to meet their needs or to restrictions imposed on their food access (by war, hikes in prices, shortages, etc.)
3. Vulnerable population These are the populations most exposed to food crises. They can be anywhere from slightly vulnerable (when affected populations are able to maintain their preferred production strategies and preserve existing or accumulate more assets) to extremely vulnerable (when affected populations are forced to liquidate even their productive assets in order to eat or are forced to leave their homes in order to survive).
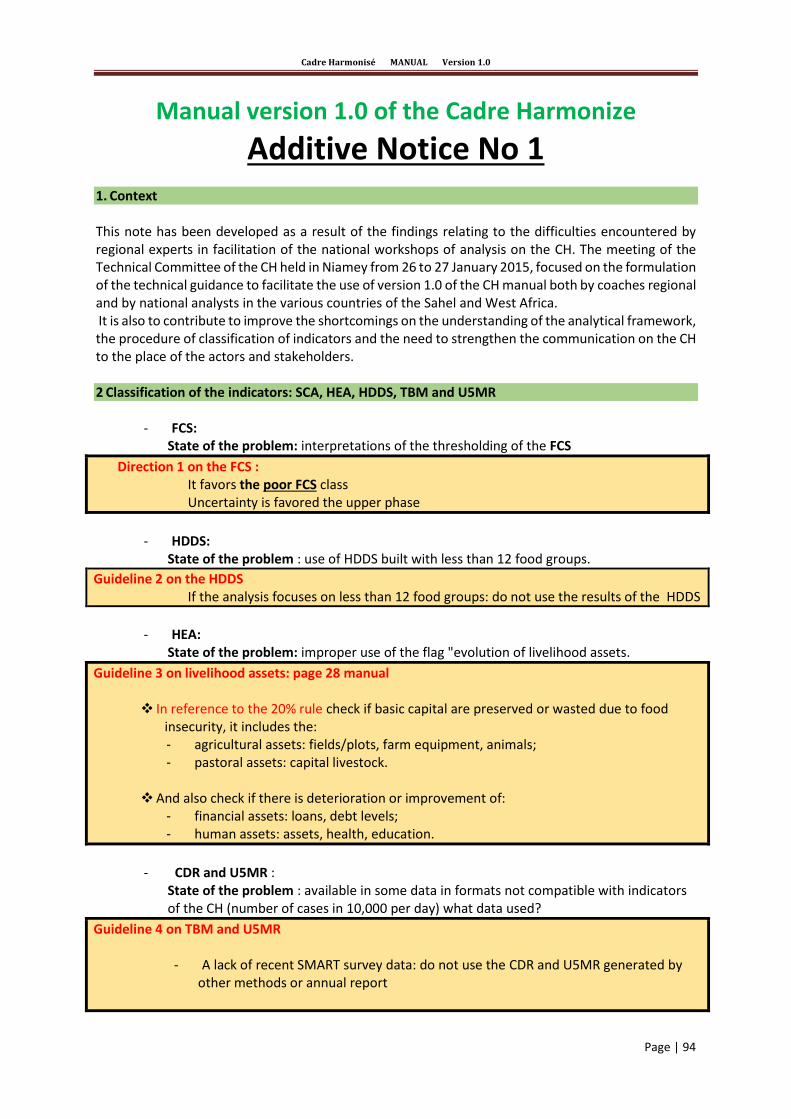
Cadre Harmonisé MANUAL Version 1.0
Page | 94
Manual version 1.0 of the Cadre Harmonize
Additive Notice No 1
1. Context
This note has been developed as a result of the findings relating to the difficulties encountered by regional experts in facilitation of the national workshops of analysis on the CH. The meeting of the Technical Committee of the CH held in Niamey from 26 to 27 January 2015, focused on the formulation of the technical guidance to facilitate the use of version 1.0 of the CH manual both by coaches regional and by national analysts in the various countries of the Sahel and West Africa. It is also to contribute to improve the shortcomings on the understanding of the analytical framework, the procedure of classification of indicators and the need to strengthen the communication on the CH to the place of the actors and stakeholders. 2 Classification of the indicators: SCA, HEA, HDDS, TBM and U5MR
- FCS:
State of the problem: interpretations of the thresholding of the FCS
Direction 1 on the FCS : It favors the poor FCS class Uncertainty is favored the upper phase
- HDDS:
State of the problem : use of HDDS built with less than 12 food groups.
Guideline 2 on the HDDS If the analysis focuses on less than 12 food groups: do not use the results of the HDDS
- HEA:
State of the problem: improper use of the flag "evolution of livelihood assets.
Guideline 3 on livelihood assets: page 28 manual
In reference to the 20% rule check if basic capital are preserved or wasted due to food insecurity, it includes the: - agricultural assets: fields/plots, farm equipment, animals; - pastoral assets: capital livestock.
And also check if there is deterioration or improvement of:
- financial assets: loans, debt levels; - human assets: assets, health, education.
- CDR and U5MR :
State of the problem : available in some data in formats not compatible with indicators of the CH (number of cases in 10,000 per day) what data used?
Guideline 4 on TBM and U5MR
- A lack of recent SMART survey data: do not use the CDR and U5MR generated by other methods or annual report
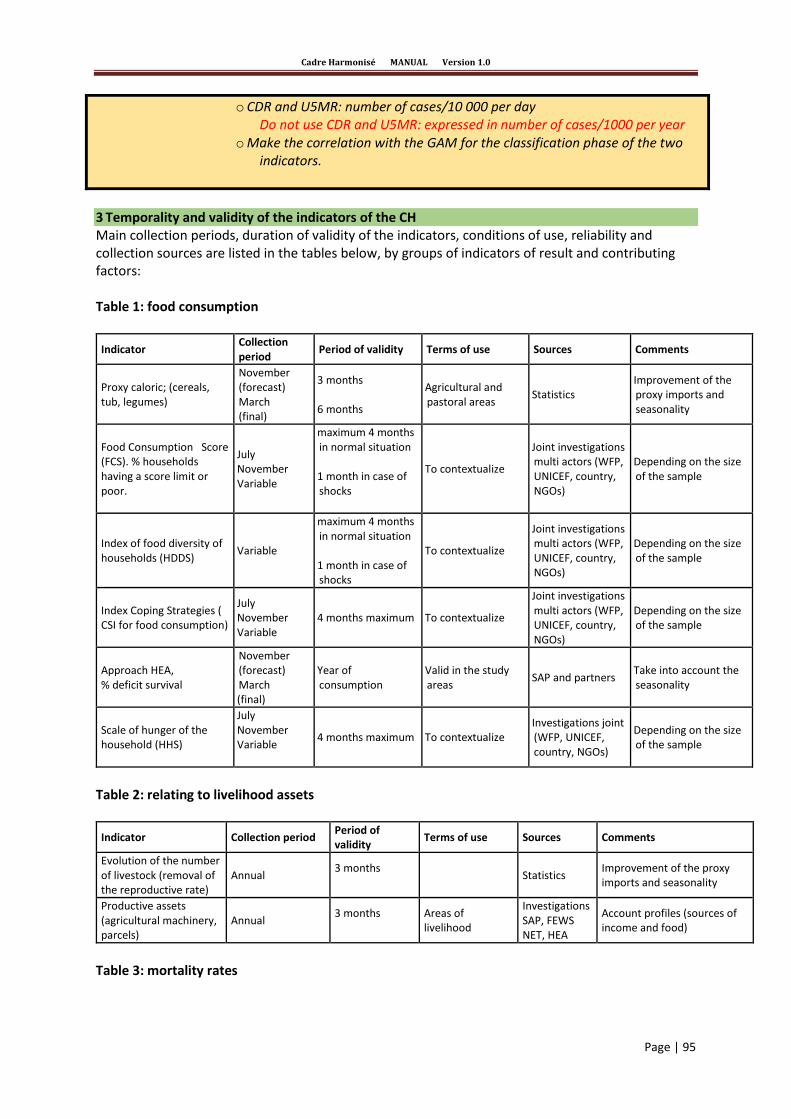
Cadre Harmonisé MANUAL Version 1.0
Page | 95
o CDR and U5MR: number of cases/10 000 per day Do not use CDR and U5MR: expressed in number of cases/1000 per year
o Make the correlation with the GAM for the classification phase of the two indicators.
3 Temporality and validity of the indicators of the CH Main collection periods, duration of validity of the indicators, conditions of use, reliability and collection sources are listed in the tables below, by groups of indicators of result and contributing factors: Table 1: food consumption
Table 2: relating to livelihood assets
Table 3: mortality rates
Indicator Collection period
Period of validity Terms of use Sources Comments
Proxy caloric; (cereals, tub, legumes)
November (forecast) March (final)
3 months 6 months
Agricultural and pastoral areas
Statistics Improvement of the proxy imports and seasonality
Food Consumption Score (FCS). % households having a score limit or poor.
July November Variable
maximum 4 months in normal situation 1 month in case of shocks
To contextualize
Joint investigations multi actors (WFP, UNICEF, country, NGOs)
Depending on the size of the sample
Index of food diversity of households (HDDS)
Variable
maximum 4 months in normal situation 1 month in case of shocks
To contextualize
Joint investigations multi actors (WFP, UNICEF, country, NGOs)
Depending on the size of the sample
Index Coping Strategies ( CSI for food consumption)
July November Variable
4 months maximum To contextualize
Joint investigations multi actors (WFP, UNICEF, country, NGOs)
Depending on the size of the sample
Approach HEA, % deficit survival
November (forecast) March (final)
Year of consumption
Valid in the study areas SAP and partners
Take into account the seasonality
Scale of hunger of the household (HHS)
July November Variable
4 months maximum To contextualize Investigations joint (WFP, UNICEF, country, NGOs)
Depending on the size of the sample
Indicator Collection period Period of validity Terms of use Sources Comments
Evolution of the number of livestock (removal of the reproductive rate)
Annual 3 months Statistics Improvement of the proxy
imports and seasonality
Productive assets (agricultural machinery, parcels)
Annual 3 months
Areas of livelihood
Investigations SAP, FEWS NET, HEA
Account profiles (sources of income and food)
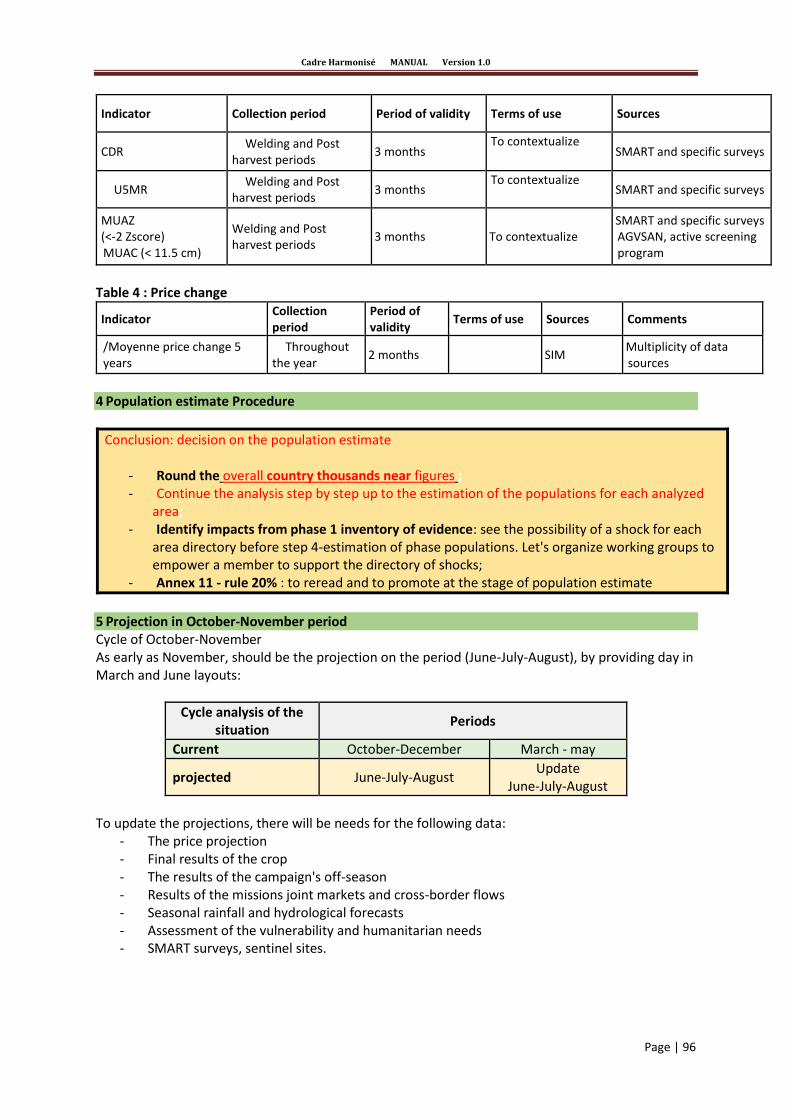
Cadre Harmonisé MANUAL Version 1.0
Page | 96
Table 4 : Price change
4 Population estimate Procedure
Conclusion: decision on the population estimate
- Round the overall country thousands near figures ; - Continue the analysis step by step up to the estimation of the populations for each analyzed
area; - Identify impacts from phase 1 inventory of evidence: see the possibility of a shock for each
area directory before step 4-estimation of phase populations. Let's organize working groups to empower a member to support the directory of shocks;
- Annex 11 - rule 20% : to reread and to promote at the stage of population estimate
5 Projection in October-November period Cycle of October-November As early as November, should be the projection on the period (June-July-August), by providing day in March and June layouts:
Cycle analysis of the situation
Periods
Current October-December March - may
projected June-July-August Update
June-July-August
To update the projections, there will be needs for the following data:
- The price projection - Final results of the crop - The results of the campaign's off-season - Results of the missions joint markets and cross-border flows - Seasonal rainfall and hydrological forecasts - Assessment of the vulnerability and humanitarian needs - SMART surveys, sentinel sites.
Indicator Collection period Period of validity Terms of use Sources
CDR Welding and Post
harvest periods 3 months
To contextualize SMART and specific surveys
U5MR Welding and Post
harvest periods 3 months
To contextualize SMART and specific surveys
MUAZ (<-2 Zscore) MUAC (< 11.5 cm)
Welding and Post harvest periods
3 months To contextualize SMART and specific surveys AGVSAN, active screening program
Indicator Collection period
Period of validity
Terms of use Sources Comments
/Moyenne price change 5 years
Throughout the year
2 months SIM Multiplicity of data sources

Cadre Harmonisé MANUAL Version 1.0
Page | 97
CH Reference Table of acute food insecurity for zones classification (Directs evidences)
Purpose: guide strategic short-term goals related to objectives in the medium and long-term focus on the underlying causes and chronic food insecurity. Use: the classification is based on the convergence of evidence of current conditions.
Name and phase
description
Phase 1 Minimum
Phase 2 Under pressure
Phase 3 Crisis
Phase 4 Emergency
Phase 5 Famine
At least four out of five households are able to meet their dietary and non-dietary needs without resorting to unusual coping strategies, nor depend on humanitarian aid.
Even with humanitarian aid, at least one out of five households in the area is in the following situation or worse: A reduced food consumption and minimal adequacy but inability to afford to certain essential non-food expenditure without engaging in irreversible coping strategies
Even with humanitarian aid, at least one out of five households in the area is in the following situation or worse: considerable food deficits and acute malnutrition at high or higher rates than the normal ; OR Marginally able to meet the minimum food needs by depleting assets related to livelihoods, leading to deficits in food consumption.
Even with humanitarian aid, at least one out of five households in the area is in the following situation or worse: extreme food deficits, which results in a very high acute malnutrition or an excessive mortality, OR an extreme loss of assets relating to livelihoods, resulting to deficits in food consumption in the short term.
Even with humanitarian aid, at least one out of five households in the area has a complete deficit in food and / or other basic needs and is clearly exposed to inanition, to death and to destitution. (Note, the evidences for the three criteria of food consumption, emaciation, and CMR are required for classifying into famine)
Priority intervention objectives
Action required for building resilience
and reducing disaster risks.
Action required for reducing disaster risks
and protecting livelihoods.
Urgent action is required to :
Protect livelihoods, prevent malnutrition, and prevent
deaths. Save lives and livelihoods.
Prevent large-scale deaths and avoid the total collapse
of livelihoods.
Re
sult
s fo
r th
e a
rea
(dir
ectl
y m
eas
ure
d o
r in
ferr
ed)
Foo
d c
on
sum
pti
on
*
(qu
anti
ty a
nd
nu
trit
ion
al q
ual
ity)
HDDS: ≥ 4 food groups and no deterioration on the 12 food groups
HDDS: deterioration of the index (loss of a food group on 12)
HDDS: serious deterioration of the index (loss of two food groups on 12)
HDDS: <4 food groups on 12
HDDS: 1-2 food groups on 12
FCS: Acceptable consumption; stable
(Poor: < 5%; or Poor + Borderline: < 15%)
FCS: Acceptable consumption (but deteriorating)
(Poor: 05-10%; or Poor + Borderline: 15-30%)
FCS: Borderline consumption
(Poor: 10-20%; or Poor + Borderline: 30% and above)
FCS: Poor consumption
(Poor: > 20%)
FCS: Below Poor consumption
(N/A)
EFM: "null" (0)) EFM: "low" (1) EFM: moderate (score 2-3 EFM: severe (score 4-6) EFM: "severe" (6)
CSI: reference threshold, stable
CSI: reference threshold reached, but unstable
CSI: > reference and in increase CSI: considerably> than reference
CSI: Widely> than reference
HEA : no deficit in livelihoods protection
HEA: deficit in livelihoods protection and no survival deficit
HEA : deficit in livelihoods protection and survival deficit 1-20%
HEA: " deficit in livelihoods protection and survival deficit 20-50%
HEA: deficit in livelihoods protection and survival deficit > 50%
Evo
luti
on
of
live
liho
od
(ass
ets
and
st
rate
gies
)
Livelihood: strategies and sustainable assets.
Livelihood: Strategies and assets under pressure
Livelihood: dilapidation / accelerated erosion of assets and strategies that will lead to profound deficits in food consumption
Livelihood: dilapidation / irreversible erosion of assets and strategies that will lead to very serious deficits in food consumption
Livelihood: almost total collapse of strategies and assets
Nu
trit
ion
al
stat
us
GAM: Acute malnutrition: <5%
GAM: Acute malnutrition: 5-10%
GAM: Acute malnutrition: 10-15 % or > to the ordinary and increasing
GAM: Acute malnutrition: 15-30% or > to the ordinary and increasing
GAM: Acute Malnutrition : > 30%
Prevalence BMI <18.5 kg/m² <10% : < 10%
Prevalence BMI <18,5 kg/m²: 10-20%
Prevalence BMI <18.5 kg/m² : 20-40%,1.5 x highest than the reference
Prevalence BMI <18.5 kg/m²: > 40%
Prevalence BMI <18.5 kg/m² : widely > 40%
Mo
rtal
ity
CMR: <0,5 /10,000/day
CMR :< 0,5/10,000/day CMR : 0,5-1/10, 000/day CMR : 1-2/10, 000/day OR 2 × the reference
CMR :> 2/10, 000/day
U5MR: ≤ 1/10, 000/day
U5MR : ≤1/10,000/day
U5MR : 1-2/10,000/day
U5MR : 2-4/10, 000/day
U5MR :> 4/10 000/day
The caloric proxies calculate calories available per capita from food production of the area. This proxy may consider the three major food groups constituting more than 90% of energy intake. This will often be tryptic "grains / legumes / tubers"
Household Diet Diversity index (HDDS): methodology frequently used to indicate the quality of consumption and, to a lesser extent, the quantity of food Food consumption Score (FCS or SCA) or percentage of households with limit or poor score: method developed by WFP to assess the quantity and quality of food consumption
The hunger scale of households (EFM) method for food and nutrition based on the household perceptions of food insecurity
Coping Strategies Index (CSI) related to food consumption only: method to monitor the evolution of the household’s behavior and indicate the degree of food insecurity compared over time or from a reference threshold

Cadre Harmonisé MANUAL Version 1.0
Page | 98
Household Economy Approach (HEA): percentage of households below the survival threshold: method for a global analysis of the strategies of livelihoods and the impact of shocks on food consumption and, other subsistence needs.
CH Reference Table of acute food insecurity for zones classification (Indirects evidences)
Name and phase
description
Phase 1 Minimum
Phase 2 Under pressure
Phase 3 Crisis
Phase 4 Emergency
Phase 5 Famine
Food consumption
Caloric proxies: more than 2100 kcal per person and per day; stable
Proxies calories: Adequate: at minimum (2100 kcal per person and per day)
Caloric proxies: food deficit, between 1000-1499 kcal, or 2100 kcal per person and per day, in dilapidating assets
Caloric proxies: Deep food deficit; consumption largely lower to 2100 kcal (<1000 kcal) per person and per day
Caloric proxies: extreme food deficit
Nutritional status and Mortality
MUAC <5% MUAC : 5%-10% MUAC : 10%-15% MUAC : 15%-30% MUAC : 30% et +
Reference Table of acute food insecurity: indicative classification of the impact of contributing factors on global phase of a zone
Purpose: To determine the impacts of each contributing factor on the overall phasing of the analyzed area. Use: the severity of the impact is based on the convergence of evidence of current and projected conditions and consensus among experts.
Contributing factors For contributing factors, indicators and impact thresholds for West African Conditions are proposed (but are not exhaustive to be added in Step 2, Table 2) to infer the impact of these variables on the global phasing of a zone (Step 3, Table 3). These impacts may influence the global fixed phase in light of the unique causes and context of the households livelihoods. A general description is presented below. For more information on key aspects of availability, access, utilization and stability, see Analytical Framework HF and technical notes.
Slight impact
At least one in five households in the area is affected positively or negatively by the impact of this shock
Medium impact
At least one in five households in the area is affected positively or negatively by the
impact of this shock
Strong impact
At least one in five households in the area is affected positively or negatively by the impact of this shock
Ind
ire
ct e
vid
en
ces
of
resu
lts
Livelihoods
. Departure of actives : 20-30%
Departure of households : <20%
Pastures availability : 90%-80%
Pastures accessibility: Accessible
Fodder balance sheet: > 50% à 50% of needs
Poverty Incidence: 21 à 40%
Departure of actives : Na
Departure of households : 20 à 33%
Pastures availability : 80% à 20%
Pastures accessibility: +/- accessible
Fodder balance sheet: 50% à 20% of needs
Poverty Incidence: 41 à 60 %
Departure of active: Na
Departure of households : >33%
Pastures availability : < 20%
Pastures accessibility : Non accessible
Fodder balance sheet : <20% of needs
Poverty Incidence: 61 à 81%
Co
ntr
ibu
tin
g fa
cto
rs Hazards and
vulnerability
Level barely adequate to meet the needs of food consumption Civil
Effects of hazards and vulnerability putting pressure on livelihoods and consumption
Price change (5 years): 25% to 50%
Security: Unstable, disturbing tensions.
Drought, strong winds, floods, locust invasion, refugees: Recurrent with strong impacts
Inadequate level to meet the needs of food consumption.
Effects of hazards and vulnerability resulting in loss of assets and / or in important food consumption deficits.
Price change (5 years): 50% to 75%
Drought, strong winds, floods, locust invasion, refugees : Generalized
Civil Security: Conflict with limited scope, low intensity
Level highly inadequate to meet the needs of food consumption.
Effects of hazards and vulnerability resulting in a considerable loss of assets relating to livelihoods and / or through deficits in food consumption.
Price Change (5 years): > 75%
Civil Security: Conflict, generalized and intensive
Drought, strong winds, floods, locust invasion, refugees: Generalized and extended.
Utilization
Drinking water: barely ≥ 15 liters per person per day.
Potable water access rates: 61 à 80%
Drinking water: 7.5 to 15 liters per person per day.
Potable water access rates : 41 à 60%
Drinking Water: 4 to 7.5 liters per person per day.
Potable water access rates: 21 à 40%

Cadre Harmonisé MANUAL Version 1.0
Page | 99
Table: Other Indirect evidence as contributing factors
Elements Potential indirect evidences for the CH analysis
Potential sources
Food consumption
(nutrition quantity and
quality )
Availability of strengthen staple food ( such as flour of maize and wheat )
Negotiators in Cereal, distributors
Changing in expenses profiles for the benefit of more economic and less nutritive food
Monitoring of Food Security
Number of meal per day CFSVA (Analyse Global Analysis of Food Security and Vulnerability), Surveys on Food Security
Number of food group consumed HDDS (Indice of the diversity of food household regime ), CFSVA, Survey on Food Security
Changing Livelihood
( goods and strategies)
Own production facilities such as bicycle and agricultural tools , current changes in terms of property
Survey on household budget , Inventory of the population , Survey on households Food Security
Own livestock and current changes in terms of property
Survey on Food Security
Migration, for example from rural areas to urban zones or seeking occasional job
Survey on Food Security, authorities
Extension of informal Establishments Authorities , UNO- Habitat
Part of the rural population living in the “reduced placed”
UNO- housing, Authorities
People displaced interiorly / concentrations of refugees
Authorities, HCR ( United Nation Agency for Refugees ), OCHA (Humanitarian affaire coordination bureau ), OIM ( International Organisation for Migrations)
.Prevalence of extreme behaviour ,for example begging
Survey on Food Security
Changing of the ICN
Ministry of Livestock, AGRHYMET, Fews Net…
Availability of pasturages
Accessibility of pasturages
Forage balance sheet from the Biomass and the resident livestock
Changing in the number of livestock (reproductive )
HEA protection of livelihoods
Water for livestock
Nutrition Status
Pondered insufficiency Measure of Brachial perimeter (<115 mm) (MUAC) Severe Acute Malnutrition (SAM) Global Acute Malnutrition (GAM) Body Mass Index for the Adult (IMC)
MICS (Survey by multiple indicator bunch ) , EDS ( Demographic and Health Survey Nutrition Survey ( for example , the data base CRED CEDAT – Research Centre on disaster outbreak ,data base of complex emergencies )
Admissions to food programs Data of health Information System
Data of the sentinel site
Prevalence of pondered insufficiency at birth
MICS
Malaria Case, measles (malnutrition and mortality), Diarrhoea , Acute breathing infection
Infant Mortality rate (TMI) MICS, EDS

Cadre Harmonisé MANUAL Version 1.0
Page | 100
Elements Potential indirect evidences for the CH analysis
Potential sources
Mortality /mortality rate
Neonatal Mortality EDS, Birth Certificates
Brut Mortality rate Under 5 years Death Rate (U5DR)
MICS, EDS
Mother Mortality Rate Lethality rate (epidemics for example )
EDS (Women Health Watch Bulletin, consulting toward religious leaders , Counting of tombs
Availability
Food balance sheet ,Cereal Balance sheet
AGRHYMET, SAP, Crop Statistic Service ,
FAO ( United Nation Food and Agriculture Organisation )
production figures AGRHYMET, SAP, Crop Statistics Services
Variation of main food and cash crops of the current cropping season compared to the five years average
FAO (United Nation Food and Agriculture Organisation )
FAO, CFSAM (Mission of harvest and food provision assessment ), National crop surveys
Average Cereal yield (kg per ha) National crop surveys
Land properties /Land access CFSVA, Surveys on food security
Variation of main food and cash crops of the current cropping season compared to the five years average
Crop statistics Service
Number of months of coverage or the coverage rate of cereal or food needs (if available at the administrative level 2 )
Crop statistics Service
Household food source CFSVA, Surveys on food security
Remote sensing data (Rainfall ,vegetation)
AGRHYMET, FEWSNET (Early Warning System on famine risks ), Data diffusion service on Africa , JCR ( Joint Research Centre of the European Commission )
Accès
Price (Staple food , price tendency ) Government data , NGOs , United Nation Agencies
Markets distance /Market density (Number of market air unit )
FAO
Purchase power/ trade terms ( livestock/cereal ;Work/cereal )
CFSVA, Surveys on food security
Variation of Trade terms (livestock/ food products; food/Cash crop; Salary work /cereals; non qualified daily work / food products) compared to the past year and the five years average.
SIM, FEWS NET,PAM
Percentage of the population belonging to the wealthier quintile / lowest wealthier indice
EDS, CFSVA
Part of the population that doesn’t have access to staple food basket during the analysed period (poverty or food poverty threshold )
Survey on household budget ,EDS, inventory of population
Variation of the food monthly price ( the main 3 ) of detail compared to the five years average
SIM , FEWS NET,PAM
Variation of the food monthly price ( the main 3 ) of detail compared to the five years average
SIM , FEWS NET,PAM
Transfer amount variation coming from the migration or exodus compared to
SIM , FEWS NET,PAM

Cadre Harmonisé MANUAL Version 1.0
Page | 101
Elements Potential indirect evidences for the CH analysis
Potential sources
the five years average (if available and tendencies )
Percentage of the income dedicated to food expense ( for the poorest quintile )
CFSVA
Use
Composition of the type of meal /preference
(Surveys on food security)
Food preparation Practice (Surveys on food security)
Food stocking practice. (Surveys on food security)
Care practice to children (breastfeeding , stop breastfeeding, food, hygiene )
MICS, EDS
Type of Water source CFSVAs, MICS
Average Distance of Water sources (CFSVA, Monitoring of food security , government)
Character of Water access (CFSVA, Monitoring of food security , government )
Water Price (CFSVA, Monitoring of food security , government )
.Access to better sanitary installation MICS, Surveys on food security, government
Access and cooking combustible type use for households
Survey on Food Security
Stability
Crop Agenda (Survey on Food Security)
Scheme of seasonal migration (Survey on Food Security)
Household food stocks CFSVA, Surveys on Food Security
Tendency of food production CSFAM, Monitoring of Food Security , government
Dangers and vulnerability
Sickness outbreak (human and animal )
WHO (World Health Organisation ), FAO, OCHA
Morbidity profile Annual Reports of the Ministry of Health
Vaccination coverage of measles EDS, MICS
households expenses , expenses in health
Data referential of World health observatory of the WHO
Anti retroviral Therapeutic coverage (ART)
UNAIDS (Joint United Nation Programme on HIV/AIDS (National estimation reports ), Ministry of health
Fecundity rate EDS
Birth giving Assisted by qualified the nurses
EDS
Natural Dangers : Drought ,floods ,Earth quake ,etc
Authorities , United Nations , NGOs
Dangers caused by human : Conflicts ,deforestation ,erosion ,etc
Authorities , United Nations , NGOs
Number of displaced people OCHA, UNHCR
Population percentage living under poverty threshold
Survey on household budget, report of the inventories.