manufacturing competitive benchmark report
TRANSCRIPT
The European SME Benchmarking NetworkBEST PRACTICE SERVICES
Competitive benchmark reportMANUFACTURING
James Bolton and Sons LtdCreated: 09:02:06 on 14.06.13Reference: 51202Accounting year: 2012/13
2
James Bolton and Sons LtdCreated: 09:02:06 on 14.06.13 © Winning Moves Limited 2013.
Contents page
Benchmark information ...................................................................................................................................3
Introduction .........................................................................................................................................................5
Balanced scorecard ....................................................................................................................................6
Ratio graphs ...............................................................................................................................................7
Additional comments .......................................................................................................................................8
Results and definitions ..................................................................................................................................10
Financial perspective ................................................................................................................................10
Customer perspective ..............................................................................................................................18
Process perspective ..................................................................................................................................20
Learning & growth perspective .................................................................................................................30
Appendix: Input data ......................................................................................................................................34
Your report
3
James Bolton and Sons LtdCreated: 09:02:06 on 14.06.13 © Winning Moves Limited 2013.
Benchmark information
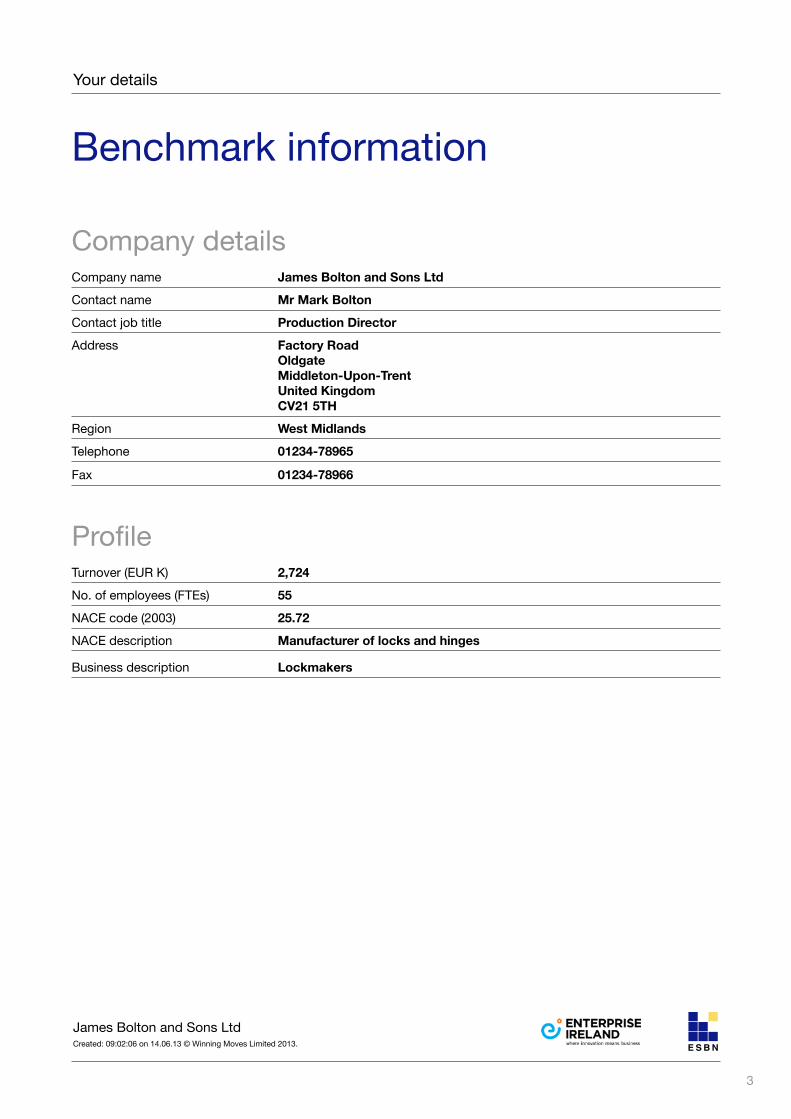
Company detailsCompany name James Bolton and Sons Ltd
Contact name Mr Mark Bolton
Contact job title Production Director
Address Factory Road Oldgate Middleton-Upon-Trent United Kingdom CV21 5TH
Region West Midlands
Telephone 01234-78965
Fax 01234-78966
ProfileTurnover (EUR K) 2,724
No. of employees (FTEs) 55
NACE code (2003) 25.72
NACE description Manufacturer of locks and hinges
Business description Lockmakers
Your details
4
James Bolton and Sons LtdCreated: 09:02:06 on 14.06.13 © Winning Moves Limited 2013.
Benchmark information
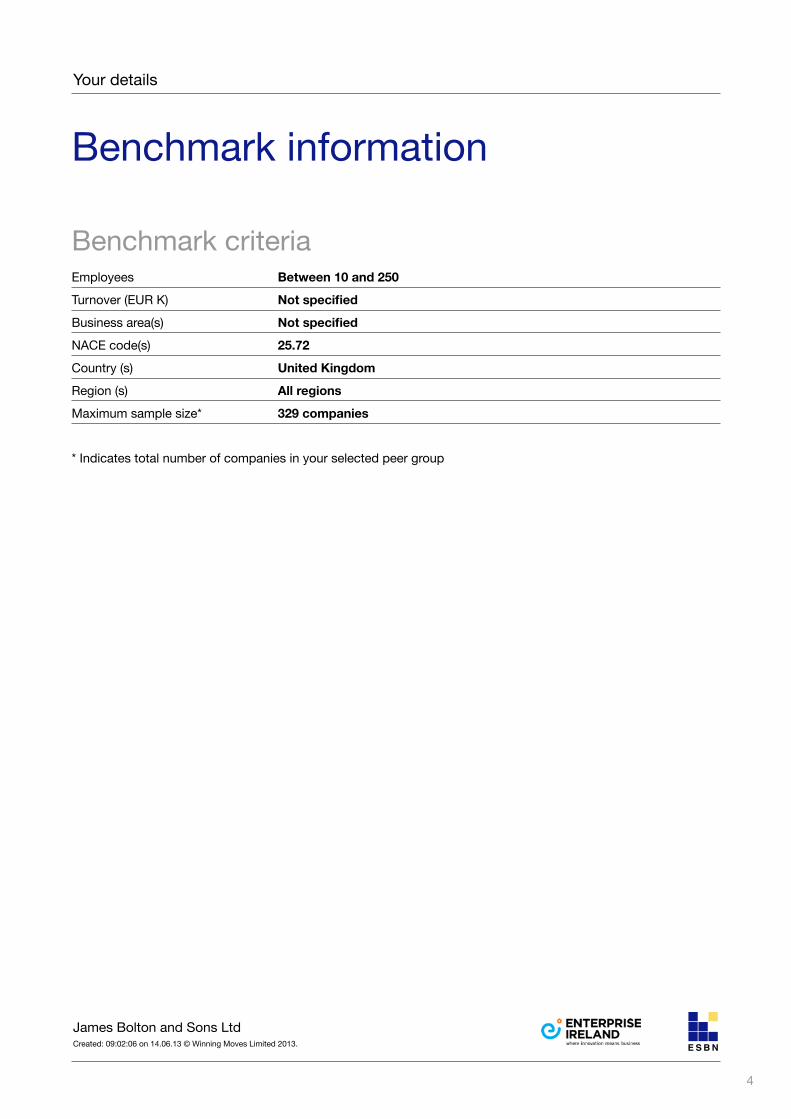
Benchmark criteriaEmployees Between 10 and 250
Turnover (EUR K) Not specified
Business area(s) Not specified
NACE code(s) 25.72
Country (s) United Kingdom
Region (s) All regions
Maximum sample size* 329 companies
* Indicates total number of companies in your selected peer group
Your details
5
James Bolton and Sons LtdCreated: 09:02:06 on 14.06.13 © Winning Moves Limited 2013.
Introduction
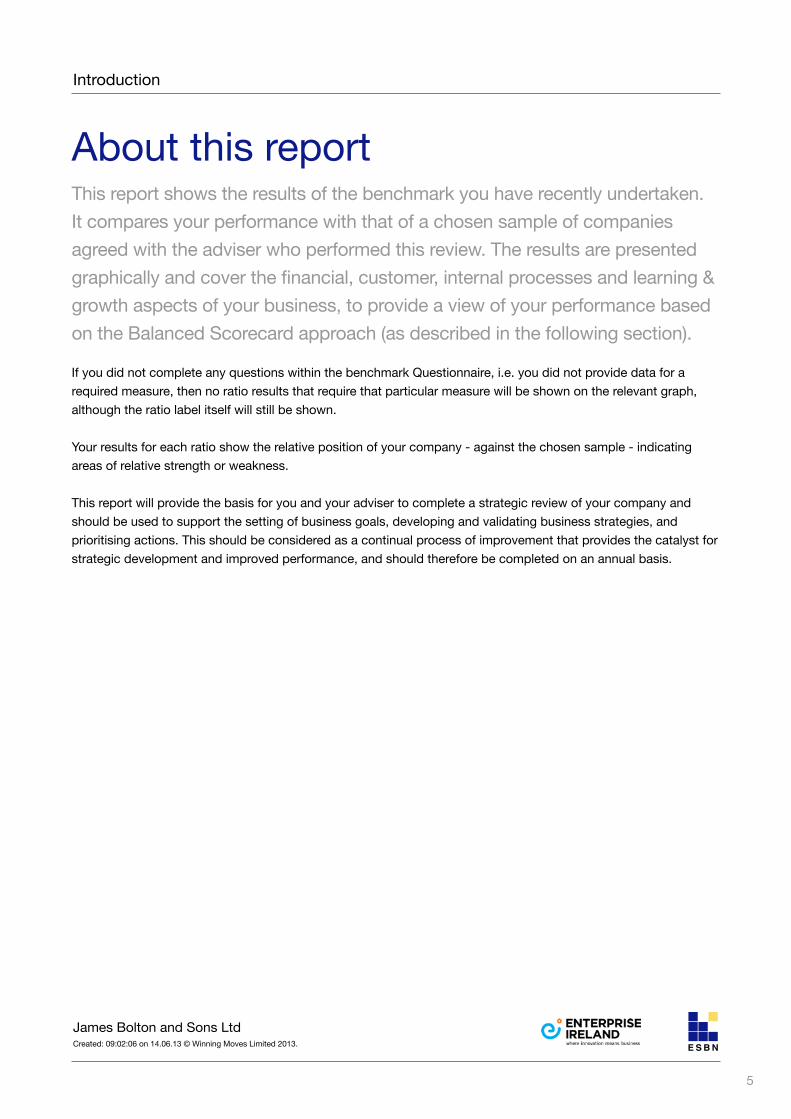
About this reportThis report shows the results of the benchmark you have recently undertaken. It compares your performance with that of a chosen sample of companies agreed with the adviser who performed this review. The results are presented graphically and cover the financial, customer, internal processes and learning & growth aspects of your business, to provide a view of your performance based on the Balanced Scorecard approach (as described in the following section).
If you did not complete any questions within the benchmark Questionnaire, i.e. you did not provide data for a required measure, then no ratio results that require that particular measure will be shown on the relevant graph, although the ratio label itself will still be shown.
Your results for each ratio show the relative position of your company - against the chosen sample - indicating areas of relative strength or weakness.
This report will provide the basis for you and your adviser to complete a strategic review of your company and should be used to support the setting of business goals, developing and validating business strategies, and prioritising actions. This should be considered as a continual process of improvement that provides the catalyst for strategic development and improved performance, and should therefore be completed on an annual basis.
6
James Bolton and Sons LtdCreated: 09:02:06 on 14.06.13 © Winning Moves Limited 2013.
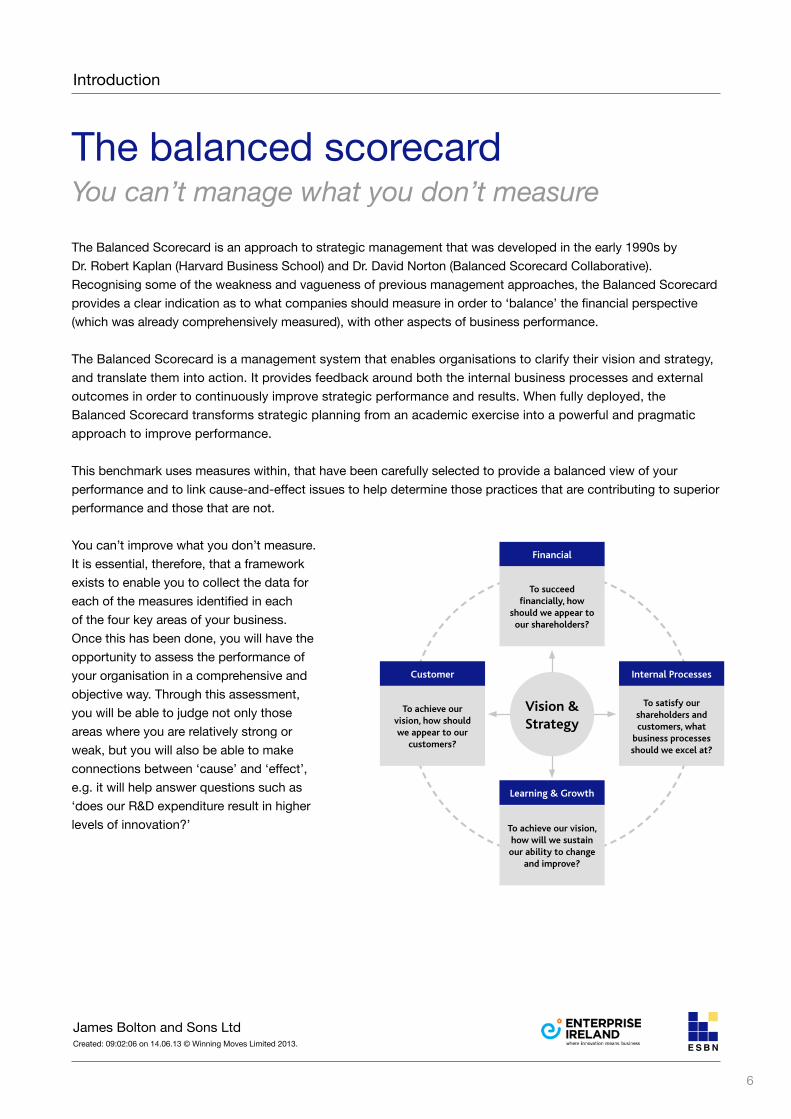
The balanced scorecardYou can’t manage what you don’t measure
The Balanced Scorecard is an approach to strategic management that was developed in the early 1990s by Dr. Robert Kaplan (Harvard Business School) and Dr. David Norton (Balanced Scorecard Collaborative). Recognising some of the weakness and vagueness of previous management approaches, the Balanced Scorecard provides a clear indication as to what companies should measure in order to ‘balance’ the financial perspective (which was already comprehensively measured), with other aspects of business performance.
The Balanced Scorecard is a management system that enables organisations to clarify their vision and strategy, and translate them into action. It provides feedback around both the internal business processes and external outcomes in order to continuously improve strategic performance and results. When fully deployed, the Balanced Scorecard transforms strategic planning from an academic exercise into a powerful and pragmatic approach to improve performance.
This benchmark uses measures within, that have been carefully selected to provide a balanced view of your performance and to link cause-and-effect issues to help determine those practices that are contributing to superior performance and those that are not.
You can’t improve what you don’t measure. It is essential, therefore, that a framework exists to enable you to collect the data for each of the measures identified in each of the four key areas of your business. Once this has been done, you will have the opportunity to assess the performance of your organisation in a comprehensive and objective way. Through this assessment, you will be able to judge not only those areas where you are relatively strong or weak, but you will also be able to make connections between ‘cause’ and ‘effect’, e.g. it will help answer questions such as ‘does our R&D expenditure result in higher levels of innovation?’
Financial
Learning & Growth
To achieve our vision, how will we sustain our ability to change
and improve?
To succeed financially, how
should we appear to our shareholders?
Internal ProcessesCustomer
To achieve our vision, how should we appear to our
customers?
To satisfy our shareholders and customers, what
business processes should we excel at?
Vision & Strategy
Introduction
7
James Bolton and Sons LtdCreated: 09:02:06 on 14.06.13 © Winning Moves Limited 2013.
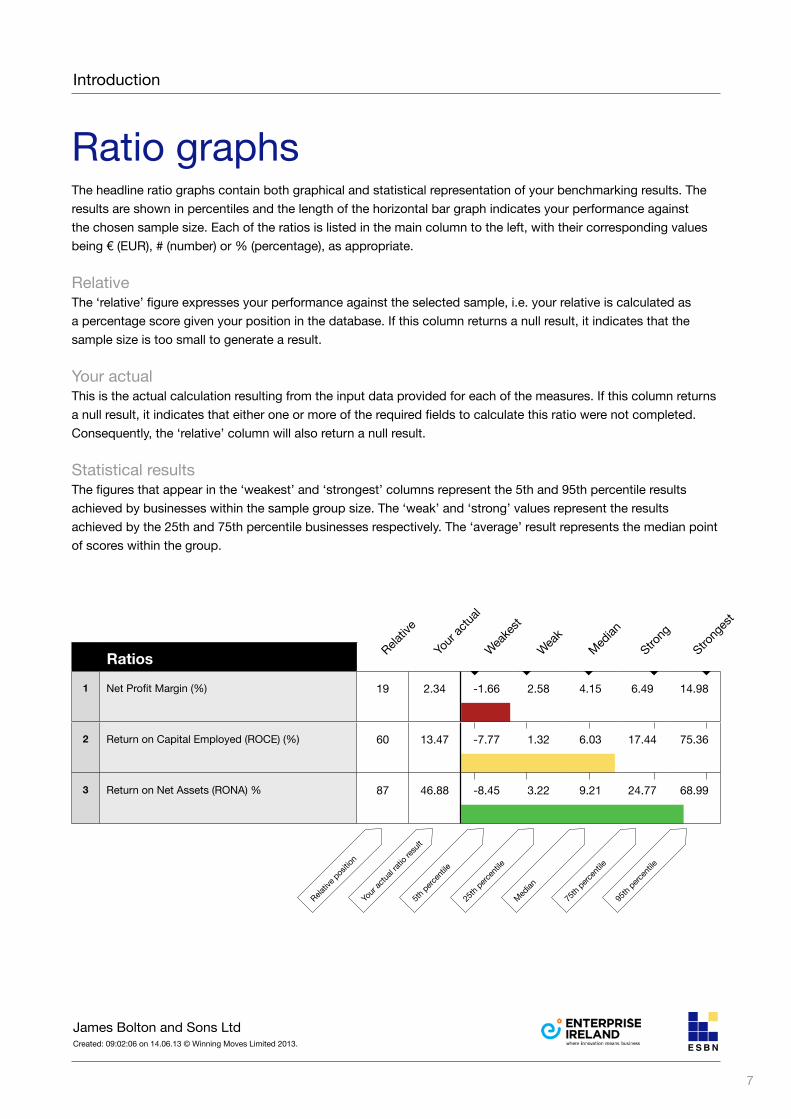
Ratios
1 Net Profit Margin (%) 19 2.34 -1.66 2.58 4.15 6.49 14.98
2 Return on Capital Employed (ROCE) (%) 60 13.47 -7.77 1.32 6.03 17.44 75.36
3 Return on Net Assets (RONA) % 87 46.88 -8.45 3.22 9.21 24.77 68.99
Ratio graphsThe headline ratio graphs contain both graphical and statistical representation of your benchmarking results. The results are shown in percentiles and the length of the horizontal bar graph indicates your performance against the chosen sample size. Each of the ratios is listed in the main column to the left, with their corresponding values being € (EUR), # (number) or % (percentage), as appropriate.
RelativeThe ‘relative’ figure expresses your performance against the selected sample, i.e. your relative is calculated as a percentage score given your position in the database. If this column returns a null result, it indicates that the sample size is too small to generate a result.
Your actualThis is the actual calculation resulting from the input data provided for each of the measures. If this column returns a null result, it indicates that either one or more of the required fields to calculate this ratio were not completed. Consequently, the ‘relative’ column will also return a null result.
Statistical resultsThe figures that appear in the ‘weakest’ and ‘strongest’ columns represent the 5th and 95th percentile results achieved by businesses within the sample group size. The ‘weak’ and ‘strong’ values represent the results achieved by the 25th and 75th percentile businesses respectively. The ‘average’ result represents the median point of scores within the group.
Relativ
e
Your
actua
l
Weake
st
Weak
Median
Strong
Strong
est
Introduction
95th
percen
tile
75th
percen
tile
Median
25th
percen
tile
5th perc
entile
Your
actua
l ratio
resu
lt
Relativ
e pos
ition

8
James Bolton and Sons LtdCreated: 09:02:06 on 14.06.13 © Winning Moves Limited 2013.
Additional comments
Results & definitions
9
James Bolton and Sons LtdCreated: 09:02:06 on 14.06.13 © Winning Moves Limited 2013.
10
James Bolton and Sons LtdCreated: 09:02:06 on 14.06.13 © Winning Moves Limited 2013.
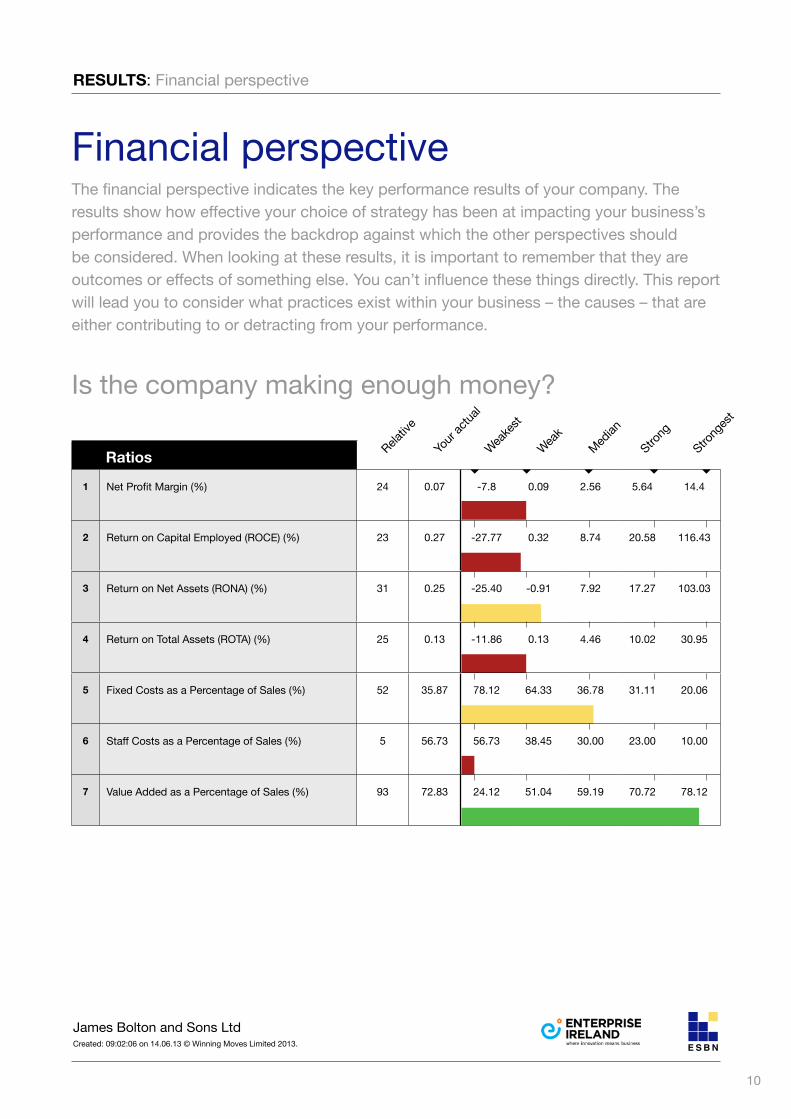
Ratios
1 Net Profit Margin (%) 24 0.07 -7.8 0.09 2.56 5.64 14.4
2 Return on Capital Employed (ROCE) (%) 23 0.27 -27.77 0.32 8.74 20.58 116.43
3 Return on Net Assets (RONA) (%) 31 0.25 -25.40 -0.91 7.92 17.27 103.03
4 Return on Total Assets (ROTA) (%) 25 0.13 -11.86 0.13 4.46 10.02 30.95
5 Fixed Costs as a Percentage of Sales (%) 52 35.87 78.12 64.33 36.78 31.11 20.06
6 Staff Costs as a Percentage of Sales (%) 5 56.73 56.73 38.45 30.00 23.00 10.00
7 Value Added as a Percentage of Sales (%) 93 72.83 24.12 51.04 59.19 70.72 78.12
Financial perspectiveThe financial perspective indicates the key performance results of your company. The results show how effective your choice of strategy has been at impacting your business’s performance and provides the backdrop against which the other perspectives should be considered. When looking at these results, it is important to remember that they are outcomes or effects of something else. You can’t influence these things directly. This report will lead you to consider what practices exist within your business – the causes – that are either contributing to or detracting from your performance.
Is the company making enough money?
Relativ
e
Your
actua
l
Weake
st
Weak
Median
Strong
Strong
est
RESULTS: Financial perspective
11
James Bolton and Sons LtdCreated: 09:02:06 on 14.06.13 © Winning Moves Limited 2013.
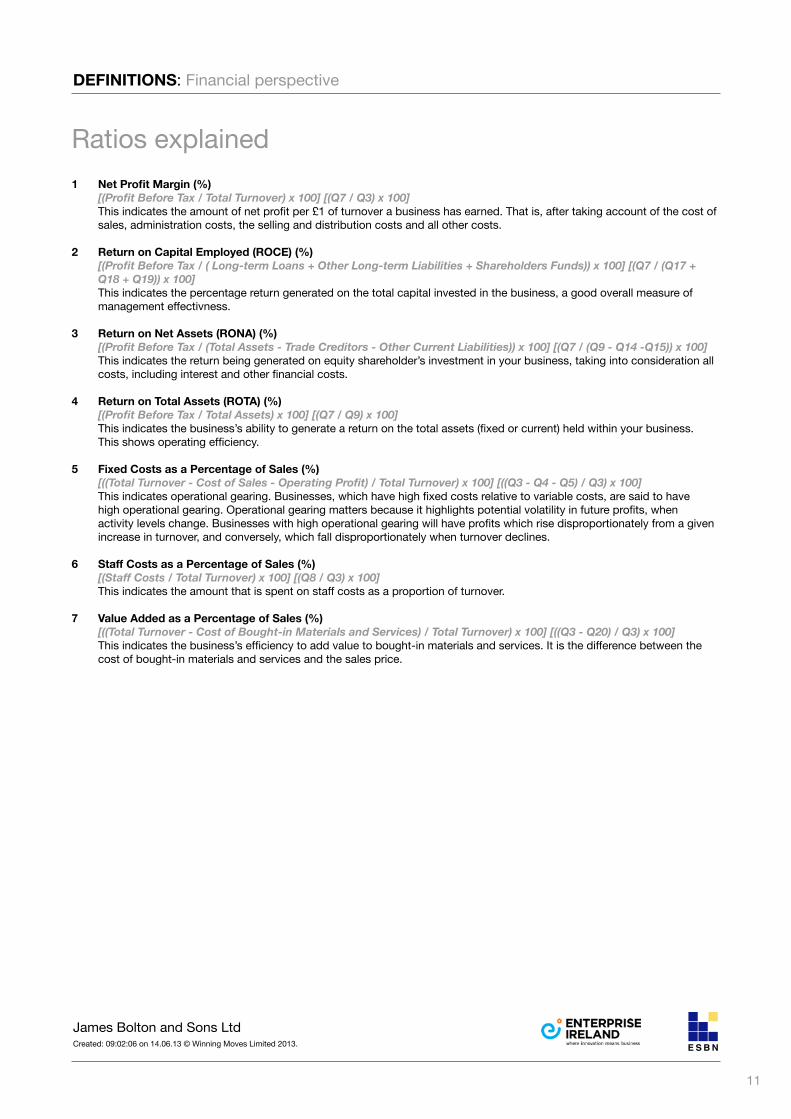
Ratios explained1 Net Profit Margin (%)
[(Profit Before Tax / Total Turnover) x 100] [(Q7 / Q3) x 100] This indicates the amount of net profit per £1 of turnover a business has earned. That is, after taking account of the cost of
sales, administration costs, the selling and distribution costs and all other costs.
2 Return on Capital Employed (ROCE) (%) [(Profit Before Tax / ( Long-term Loans + Other Long-term Liabilities + Shareholders Funds)) x 100] [(Q7 / (Q17 + Q18 + Q19)) x 100]
This indicates the percentage return generated on the total capital invested in the business, a good overall measure of management effectivness.
3 Return on Net Assets (RONA) (%) [(Profit Before Tax / (Total Assets - Trade Creditors - Other Current Liabilities)) x 100] [(Q7 / (Q9 - Q14 -Q15)) x 100]
This indicates the return being generated on equity shareholder’s investment in your business, taking into consideration all costs, including interest and other financial costs.
4 Return on Total Assets (ROTA) (%) [(Profit Before Tax / Total Assets) x 100] [(Q7 / Q9) x 100]
This indicates the business’s ability to generate a return on the total assets (fixed or current) held within your business. This shows operating efficiency.
5 Fixed Costs as a Percentage of Sales (%) [((Total Turnover - Cost of Sales - Operating Profit) / Total Turnover) x 100] [((Q3 - Q4 - Q5) / Q3) x 100]
This indicates operational gearing. Businesses, which have high fixed costs relative to variable costs, are said to have high operational gearing. Operational gearing matters because it highlights potential volatility in future profits, when activity levels change. Businesses with high operational gearing will have profits which rise disproportionately from a given increase in turnover, and conversely, which fall disproportionately when turnover declines.
6 Staff Costs as a Percentage of Sales (%) [(Staff Costs / Total Turnover) x 100] [(Q8 / Q3) x 100]
This indicates the amount that is spent on staff costs as a proportion of turnover.
7 Value Added as a Percentage of Sales (%) [((Total Turnover - Cost of Bought-in Materials and Services) / Total Turnover) x 100] [((Q3 - Q20) / Q3) x 100]
This indicates the business’s efficiency to add value to bought-in materials and services. It is the difference between the cost of bought-in materials and services and the sales price.
DEFINITIONS: Financial perspective
12
James Bolton and Sons LtdCreated: 09:02:06 on 14.06.13 © Winning Moves Limited 2013.
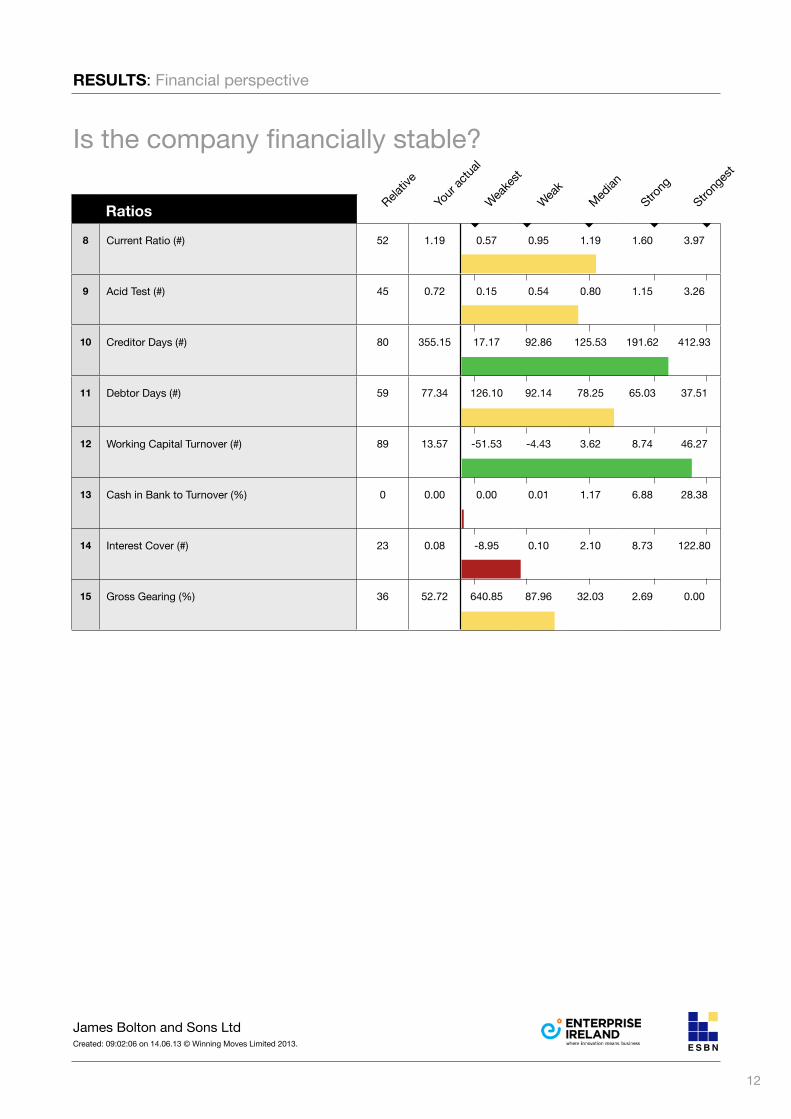
Is the company financially stable?
Relativ
e
Your
actua
l
Weake
st
Weak
Median
Strong
Strong
est
RESULTS: Financial perspective
Ratios
8 Current Ratio (#) 52 1.19 0.57 0.95 1.19 1.60 3.97
9 Acid Test (#) 45 0.72 0.15 0.54 0.80 1.15 3.26
10 Creditor Days (#) 80 355.15 17.17 92.86 125.53 191.62 412.93
11 Debtor Days (#) 59 77.34 126.10 92.14 78.25 65.03 37.51
12 Working Capital Turnover (#) 89 13.57 -51.53 -4.43 3.62 8.74 46.27
13 Cash in Bank to Turnover (%) 0 0.00 0.00 0.01 1.17 6.88 28.38
14 Interest Cover (#) 23 0.08 -8.95 0.10 2.10 8.73 122.80
15 Gross Gearing (%) 36 52.72 640.85 87.96 32.03 2.69 0.00
13
James Bolton and Sons LtdCreated: 09:02:06 on 14.06.13 © Winning Moves Limited 2013.
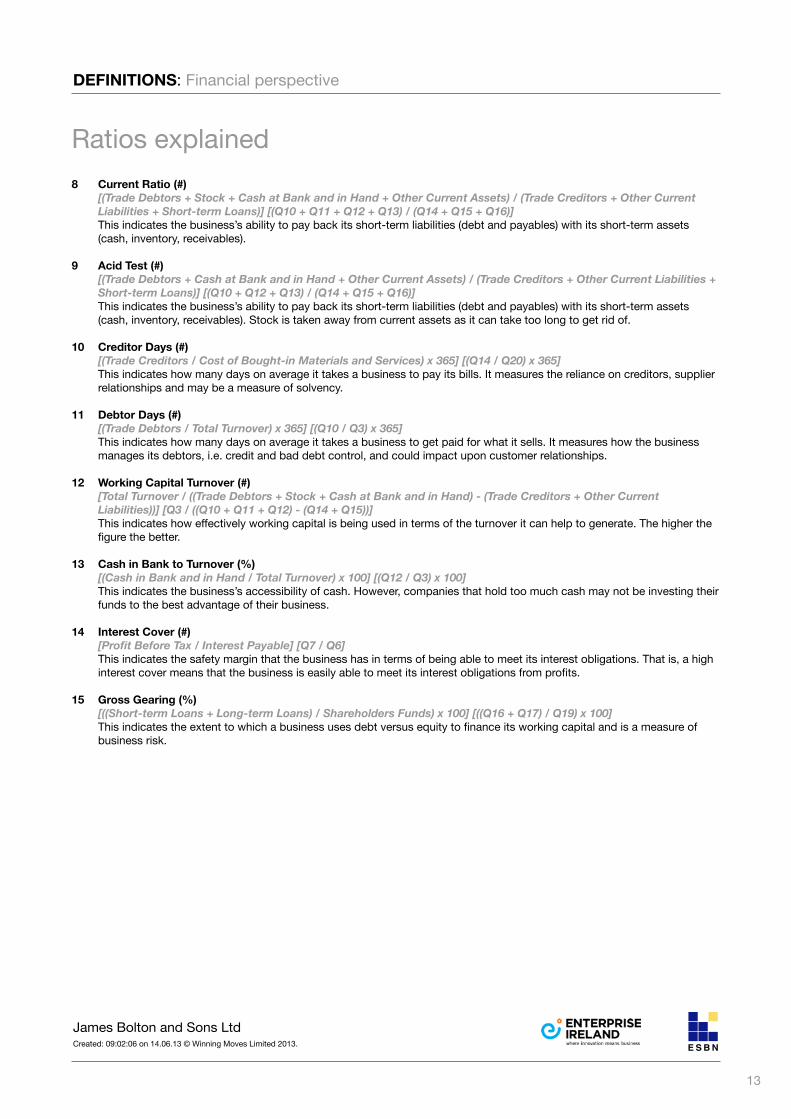
Ratios explained8 Current Ratio (#)
[(Trade Debtors + Stock + Cash at Bank and in Hand + Other Current Assets) / (Trade Creditors + Other Current Liabilities + Short-term Loans)] [(Q10 + Q11 + Q12 + Q13) / (Q14 + Q15 + Q16)]
This indicates the business’s ability to pay back its short-term liabilities (debt and payables) with its short-term assets (cash, inventory, receivables).
9 Acid Test (#) [(Trade Debtors + Cash at Bank and in Hand + Other Current Assets) / (Trade Creditors + Other Current Liabilities + Short-term Loans)] [(Q10 + Q12 + Q13) / (Q14 + Q15 + Q16)]
This indicates the business’s ability to pay back its short-term liabilities (debt and payables) with its short-term assets (cash, inventory, receivables). Stock is taken away from current assets as it can take too long to get rid of.
10 Creditor Days (#) [(Trade Creditors / Cost of Bought-in Materials and Services) x 365] [(Q14 / Q20) x 365]
This indicates how many days on average it takes a business to pay its bills. It measures the reliance on creditors, supplier relationships and may be a measure of solvency.
11 Debtor Days (#) [(Trade Debtors / Total Turnover) x 365] [(Q10 / Q3) x 365]
This indicates how many days on average it takes a business to get paid for what it sells. It measures how the business manages its debtors, i.e. credit and bad debt control, and could impact upon customer relationships.
12 Working Capital Turnover (#) [Total Turnover / ((Trade Debtors + Stock + Cash at Bank and in Hand) - (Trade Creditors + Other Current Liabilities))] [Q3 / ((Q10 + Q11 + Q12) - (Q14 + Q15))]
This indicates how effectively working capital is being used in terms of the turnover it can help to generate. The higher the figure the better.
13 Cash in Bank to Turnover (%) [(Cash in Bank and in Hand / Total Turnover) x 100] [(Q12 / Q3) x 100]
This indicates the business’s accessibility of cash. However, companies that hold too much cash may not be investing their funds to the best advantage of their business.
14 Interest Cover (#) [Profit Before Tax / Interest Payable] [Q7 / Q6]
This indicates the safety margin that the business has in terms of being able to meet its interest obligations. That is, a high interest cover means that the business is easily able to meet its interest obligations from profits.
15 Gross Gearing (%) [((Short-term Loans + Long-term Loans) / Shareholders Funds) x 100] [((Q16 + Q17) / Q19) x 100]
This indicates the extent to which a business uses debt versus equity to finance its working capital and is a measure of business risk.
DEFINITIONS: Financial perspective
14
James Bolton and Sons LtdCreated: 09:02:06 on 14.06.13 © Winning Moves Limited 2013.
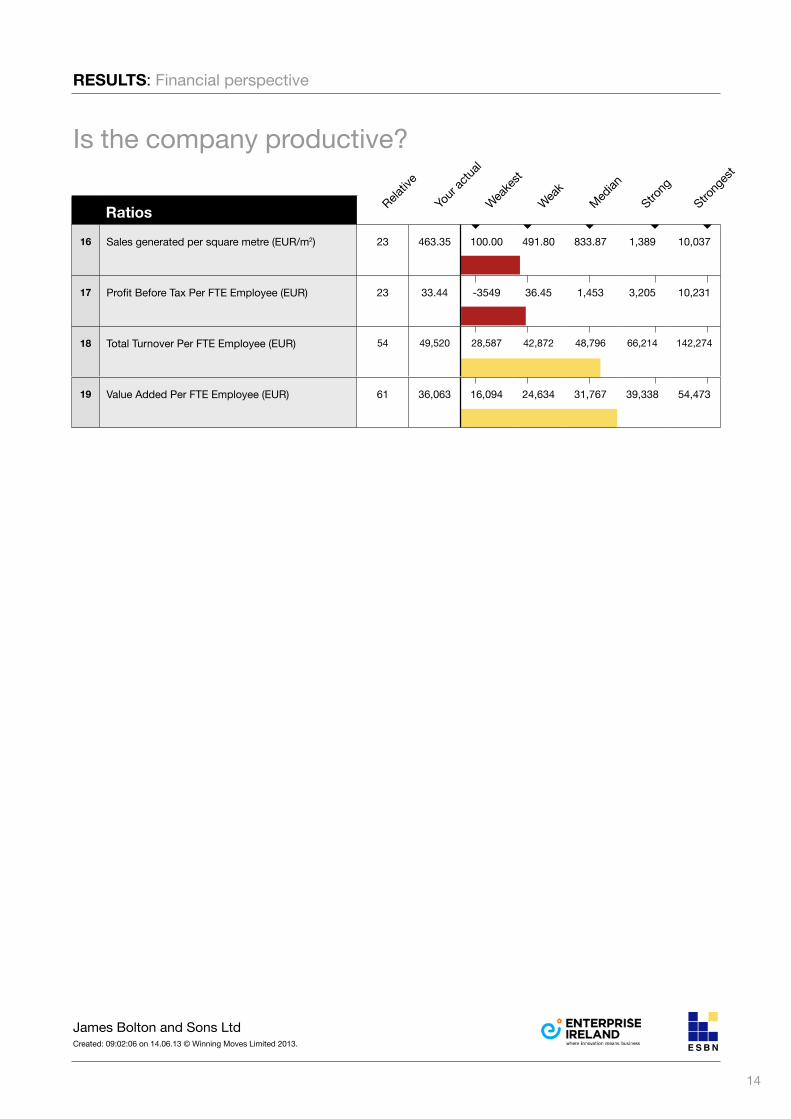
Is the company productive?
Relativ
e
Your
actua
l
Weake
st
Weak
Median
Strong
Strong
est
RESULTS: Financial perspective
Ratios
16 Sales generated per square metre (EUR/m2) 23 463.35 100.00 491.80 833.87 1,389 10,037
17 Profit Before Tax Per FTE Employee (EUR) 23 33.44 -3549 36.45 1,453 3,205 10,231
18 Total Turnover Per FTE Employee (EUR) 54 49,520 28,587 42,872 48,796 66,214 142,274
19 Value Added Per FTE Employee (EUR) 61 36,063 16,094 24,634 31,767 39,338 54,473
15
James Bolton and Sons LtdCreated: 09:02:06 on 14.06.13 © Winning Moves Limited 2013.
Ratios explained16 Sales generated per square metre (EUR/m2)
[(Total Turnover / Square Metres of Factory Floor Space) x 1000] [(Q3 / Q58) x 1000] This indicates the sales revenue generated per square metre of factory floor space. This measure relates the value of
the factory space to the generation of sales, and demonstrates how the effective use of space can reduce the fixed cost element of the unit.
17 Profit Before Tax Per FTE Employee (EUR) [(Profit Before Tax / Number of FTE Employees) x 1000] [(Q7 / Q59) x 1000]
This indicates employee profitability. It is calculated as profit before tax divided by the number of FTE employees.
18 Total Turnover Per FTE Employee (EUR) [(Total Turnover / Number of FTE Employees) x 1000] [(Q3 / Q59) x 1000]
This indicates employee productivity. It is calculated as ratio of turnover (sales) divided by the total number of FTE employees.
19 Value Added Per FTE Employee (EUR) [(Total Turnover - Cost of Bought-in Materials and Services) / Number of FTE Employees x1000] [(Q3 - Q20) / Q59 x1000] This indicates the average level of value added generated per FTE employee and is also an indicator of employee productivity and business profitability.
DEFINITIONS: Financial perspective
16
James Bolton and Sons LtdCreated: 09:02:06 on 14.06.13 © Winning Moves Limited 2013.
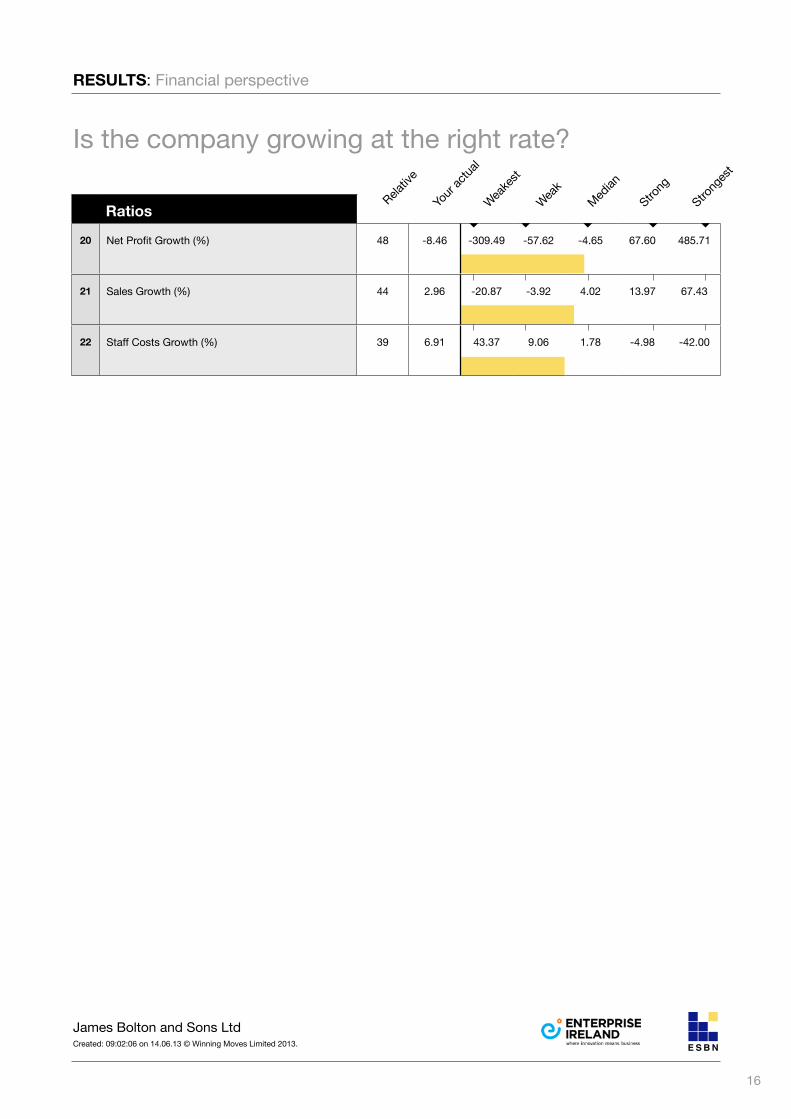
Is the company growing at the right rate?
Relativ
e
Your
actua
l
Weake
st
Weak
Median
Strong
Strong
est
RESULTS: Financial perspective
Ratios
20 Net Profit Growth (%) 48 -8.46 -309.49 -57.62 -4.65 67.60 485.71
21 Sales Growth (%) 44 2.96 -20.87 -3.92 4.02 13.97 67.43
22 Staff Costs Growth (%) 39 6.91 43.37 9.06 1.78 -4.98 -42.00
17
James Bolton and Sons LtdCreated: 09:02:06 on 14.06.13 © Winning Moves Limited 2013.
Ratios explained20 Net Profit Growth (%)
[((Profit Before Tax - Profit Before Tax prev year) / Profit Before Tax prev year) x 100] [((Q7 - Q7a) / Q7a) x 100] This indicates the changes to the profit margin for the last accounting year compared to the previous-to-last year.
It measures how well costs have been controlled when compared to the growth of pre-tax profit.
21 Sales Growth (%) [((Total Turnover-Total Turnover prev year) / Total Turnover prev year) x 100] [((Q3 - Q3a) / Q3a) x 100]
This indicates the increase/decrease in total sales of your business last year, compared with the previous-to-last year. It measures the ability of the client company to boost sales in the future.
22 Staff Costs Growth (%) [((Staff Costs - Staff Costs prev year) / Staff Costs prev year) x 100] [((Q8 - Q8a) / Q8a) x 100]
This indicates the increase/decrease in total staff costs of your business last year, compared with the previous-to-last year.
DEFINITIONS: Financial perspective
18
James Bolton and Sons LtdCreated: 09:02:06 on 14.06.13 © Winning Moves Limited 2013.
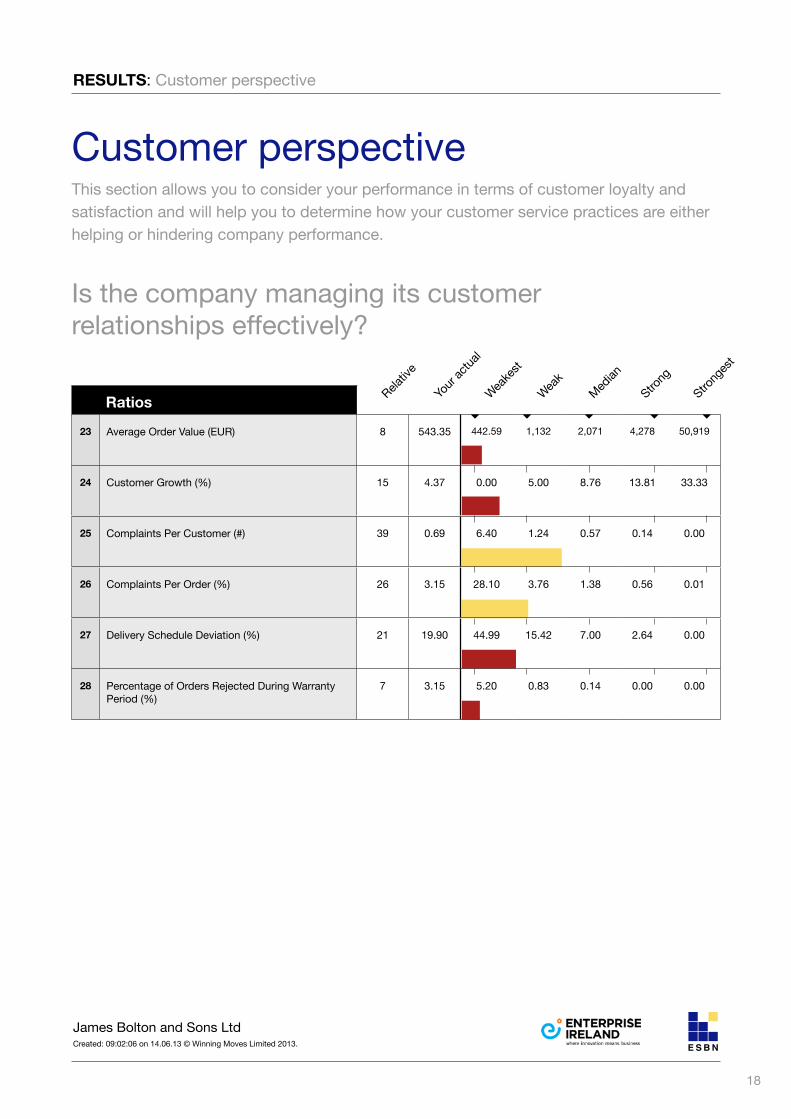
Customer perspectiveThis section allows you to consider your performance in terms of customer loyalty and satisfaction and will help you to determine how your customer service practices are either helping or hindering company performance.
Is the company managing its customer relationships effectively?
Relativ
e
Your
actua
l
Weake
st
Weak
Median
Strong
Strong
est
Ratios
23 Average Order Value (EUR) 8 543.35 442.59 1,132 2,071 4,278 50,919
24 Customer Growth (%) 15 4.37 0.00 5.00 8.76 13.81 33.33
25 Complaints Per Customer (#) 39 0.69 6.40 1.24 0.57 0.14 0.00
26 Complaints Per Order (%) 26 3.15 28.10 3.76 1.38 0.56 0.01
27 Delivery Schedule Deviation (%) 21 19.90 44.99 15.42 7.00 2.64 0.00
28 Percentage of Orders Rejected During Warranty Period (%)
7 3.15 5.20 0.83 0.14 0.00 0.00
RESULTS: Customer perspective
19
James Bolton and Sons LtdCreated: 09:02:06 on 14.06.13 © Winning Moves Limited 2013.
Ratios explained23 Average Order Value (EUR)
[(Total Turnover / Number of Orders Received) x 1000] [(Q3 / Q27) x 1000] This indicates the average order value expressed as EUR per order.
24 Customer Growth (%) [(Number of New Customers / Number of Customers) x 100] [(Q23 / Q22) x 100]
This indicates how the business is expanding, in terms of its customer base.
25 Complaints Per Customer (#) [Number of Recorded Customer Complaints Received / Number of Customers] [Q28 / Q22]
This indicates the average number of complaints per customer, independent of the number of orders.
26 Complaints Per Order (%) [(Number of Recorded Customer Complaints Received / Number of Orders Received) x 100] [(Q28 / Q27) x 100]
This indicates customer satisfaction with the products and services supplied. The trend for this ratio can be useful to measure improvements in performance, and is also a method of assessing lost business.
27 Delivery Schedule Deviation (%) [(Number of Customer Orders Which Were Not Delivered When Promised / Number of Orders Received) x 100] [(Q29 / Q27) x 100]
This indicates how well a business is meeting its commitment for delivery promises. A lower figure shows better performance.
28 Percentage of Orders Rejected During Warranty Period (%) [(Number of Orders Rejected by the Customer During the Specified Warranty Period / Number of Orders Received) x 100] [(Q45 / Q27) x 100]
This indicates the percentage of orders that have failed during the warranty period. The lower the percentage, in general, the better, as it means that more orders are supplied where the product or service was of satisfactory quality.
DEFINITIONS: Customer perspective
20
James Bolton and Sons LtdCreated: 09:02:06 on 14.06.13 © Winning Moves Limited 2013.
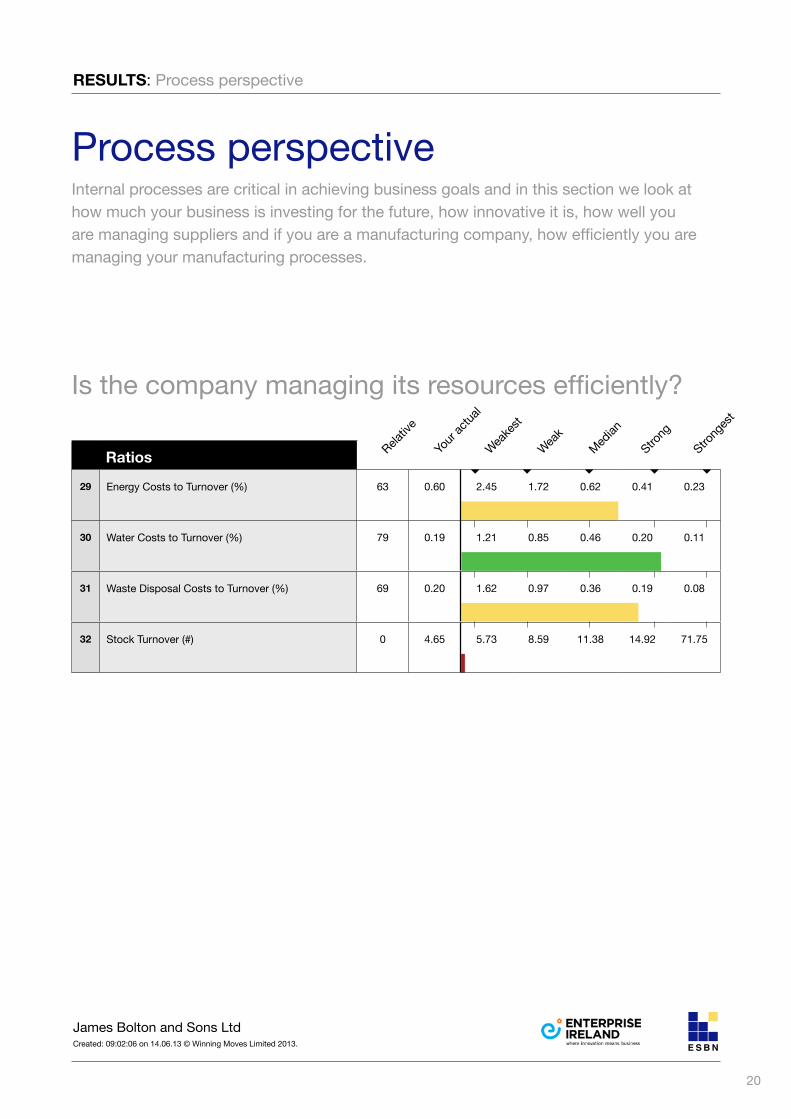
Process perspectiveInternal processes are critical in achieving business goals and in this section we look at how much your business is investing for the future, how innovative it is, how well you are managing suppliers and if you are a manufacturing company, how efficiently you are managing your manufacturing processes.
RESULTS: Process perspective
Is the company managing its resources efficiently?
Relativ
e
Your
actua
l
Weake
st
Weak
Median
Strong
Strong
est
Ratios
29 Energy Costs to Turnover (%) 63 0.60 2.45 1.72 0.62 0.41 0.23
30 Water Costs to Turnover (%) 79 0.19 1.21 0.85 0.46 0.20 0.11
31 Waste Disposal Costs to Turnover (%) 69 0.20 1.62 0.97 0.36 0.19 0.08
32 Stock Turnover (#) 0 4.65 5.73 8.59 11.38 14.92 71.75
21
James Bolton and Sons LtdCreated: 09:02:06 on 14.06.13 © Winning Moves Limited 2013.
DEFINITIONS: Process perspective
Ratios explained29 Energy Costs to Turnover (%) [(Annual energy costs / Total turnover) x 100] [(Q38 / Q3) x 100] This indicates how efficiently the business uses natural resources as well as being an indicator of sustainability
30 Water Costs to Turnover (%) [(Annual water costs / Total turnover) x 100] [(Q39 / Q3) x 100] The annual cost of water expressed as a percentage of turnover. It is a measure of how efficiently the company uses its
natural resources as well as being an indicator of sustainability.
31 Waste Disposal Costs to Turnover (%) [(Waste disposal cost / Total turnover) x 100] [(Q40 / Q3) x 100] A measure of the level of waste produced by the business as a percentage of turnover. It is an indicator of sustainability
and internal resource efficiency.
32 Stock Turnover (#) [Cost of bought-in materials and services / Stock] [Q20 / Q11] This indicates the number of times stocks are turned over during a year. The higher the stock turnover the better, because
money is then tied up for less time in stocks. A quicker stock turnover also means that the firm gets to make its profit on the stock quicker, and so the firm should be more competitive.
22
James Bolton and Sons LtdCreated: 09:02:06 on 14.06.13 © Winning Moves Limited 2013.
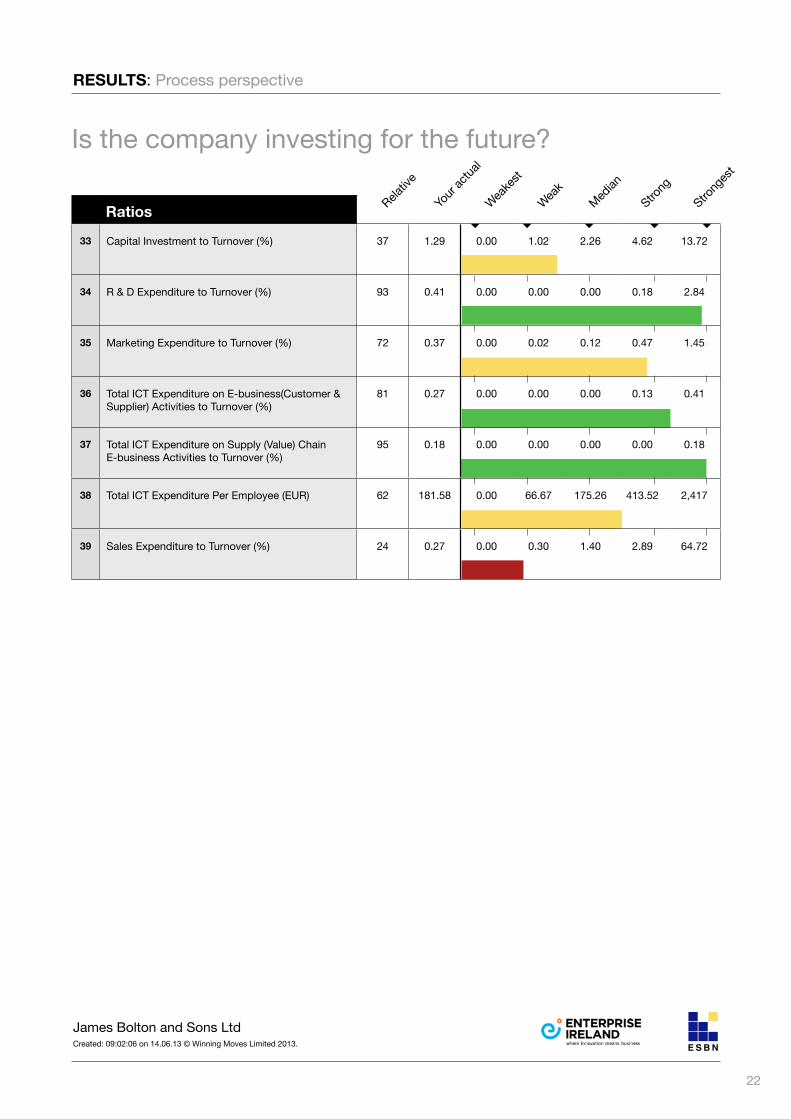
Is the company investing for the future?
Relativ
e
Your
actua
l
Weake
st
Weak
Median
Strong
Strong
est
Ratios
33 Capital Investment to Turnover (%) 37 1.29 0.00 1.02 2.26 4.62 13.72
34 R & D Expenditure to Turnover (%) 93 0.41 0.00 0.00 0.00 0.18 2.84
35 Marketing Expenditure to Turnover (%) 72 0.37 0.00 0.02 0.12 0.47 1.45
36 Total ICT Expenditure on E-business(Customer & Supplier) Activities to Turnover (%)
81 0.27 0.00 0.00 0.00 0.13 0.41
37 Total ICT Expenditure on Supply (Value) Chain E-business Activities to Turnover (%)
95 0.18 0.00 0.00 0.00 0.00 0.18
38 Total ICT Expenditure Per Employee (EUR) 62 181.58 0.00 66.67 175.26 413.52 2,417
39 Sales Expenditure to Turnover (%) 24 0.27 0.00 0.30 1.40 2.89 64.72
RESULTS: Process perspective
23
James Bolton and Sons LtdCreated: 09:02:06 on 14.06.13 © Winning Moves Limited 2013.
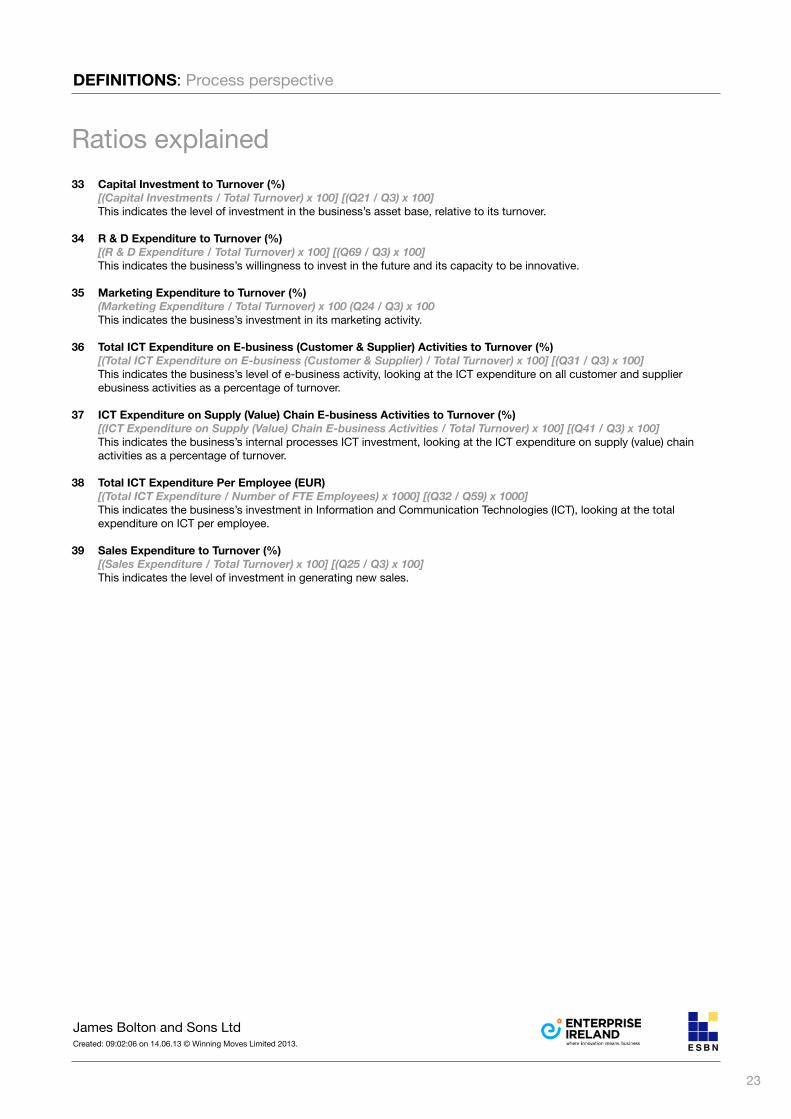
DEFINITIONS: Process perspective
Ratios explained33 Capital Investment to Turnover (%)
[(Capital Investments / Total Turnover) x 100] [(Q21 / Q3) x 100] This indicates the level of investment in the business’s asset base, relative to its turnover.
34 R & D Expenditure to Turnover (%) [(R & D Expenditure / Total Turnover) x 100] [(Q69 / Q3) x 100] This indicates the business’s willingness to invest in the future and its capacity to be innovative.
35 Marketing Expenditure to Turnover (%) (Marketing Expenditure / Total Turnover) x 100 (Q24 / Q3) x 100
This indicates the business’s investment in its marketing activity.
36 Total ICT Expenditure on E-business (Customer & Supplier) Activities to Turnover (%) [(Total ICT Expenditure on E-business (Customer & Supplier) / Total Turnover) x 100] [(Q31 / Q3) x 100]
This indicates the business’s level of e-business activity, looking at the ICT expenditure on all customer and supplier ebusiness activities as a percentage of turnover.
37 ICT Expenditure on Supply (Value) Chain E-business Activities to Turnover (%) [(ICT Expenditure on Supply (Value) Chain E-business Activities / Total Turnover) x 100] [(Q41 / Q3) x 100]
This indicates the business’s internal processes ICT investment, looking at the ICT expenditure on supply (value) chain activities as a percentage of turnover.
38 Total ICT Expenditure Per Employee (EUR) [(Total ICT Expenditure / Number of FTE Employees) x 1000] [(Q32 / Q59) x 1000]
This indicates the business’s investment in Information and Communication Technologies (ICT), looking at the total expenditure on ICT per employee.
39 Sales Expenditure to Turnover (%) [(Sales Expenditure / Total Turnover) x 100] [(Q25 / Q3) x 100]
This indicates the level of investment in generating new sales.
24
James Bolton and Sons LtdCreated: 09:02:06 on 14.06.13 © Winning Moves Limited 2013.
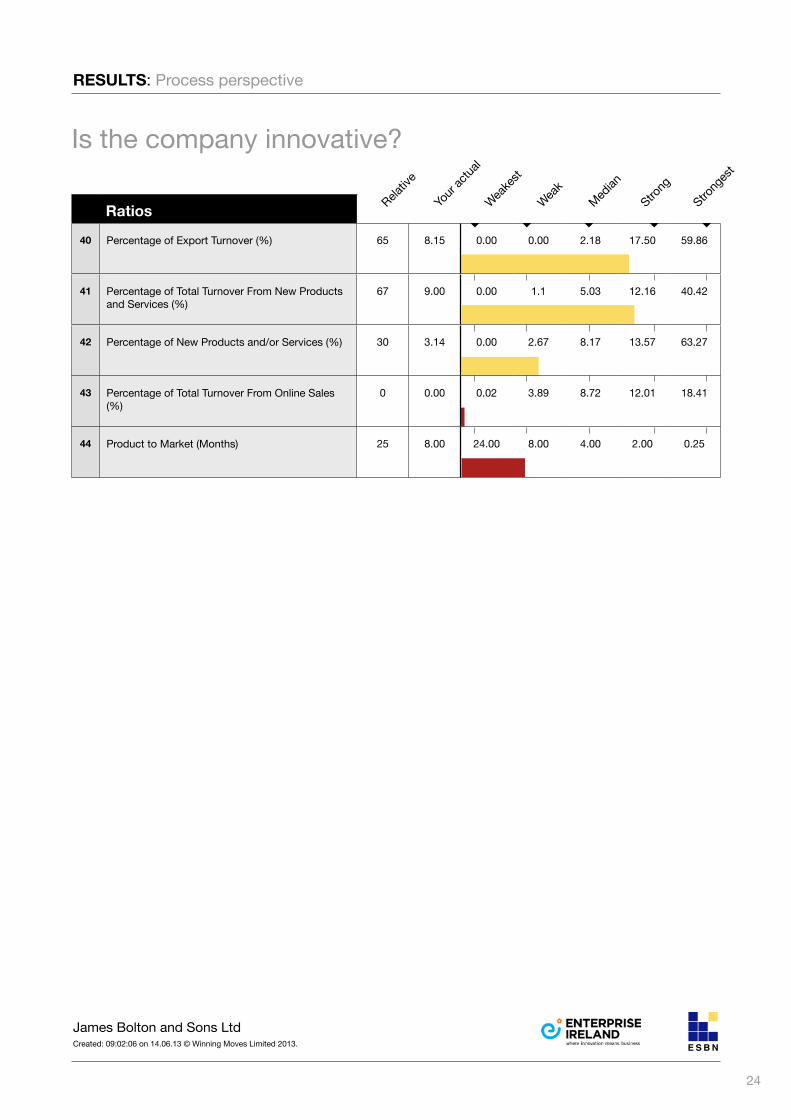
Is the company innovative?
Relativ
e
Your
actua
l
Weake
st
Weak
Median
Strong
Strong
est
RESULTS: Process perspective
Ratios
40 Percentage of Export Turnover (%) 65 8.15 0.00 0.00 2.18 17.50 59.86
41 Percentage of Total Turnover From New Products and Services (%)
67 9.00 0.00 1.1 5.03 12.16 40.42
42 Percentage of New Products and/or Services (%) 30 3.14 0.00 2.67 8.17 13.57 63.27
43 Percentage of Total Turnover From Online Sales (%)
0 0.00 0.02 3.89 8.72 12.01 18.41
44 Product to Market (Months) 25 8.00 24.00 8.00 4.00 2.00 0.25
25
James Bolton and Sons LtdCreated: 09:02:06 on 14.06.13 © Winning Moves Limited 2013.
DEFINITIONS: Process perspective
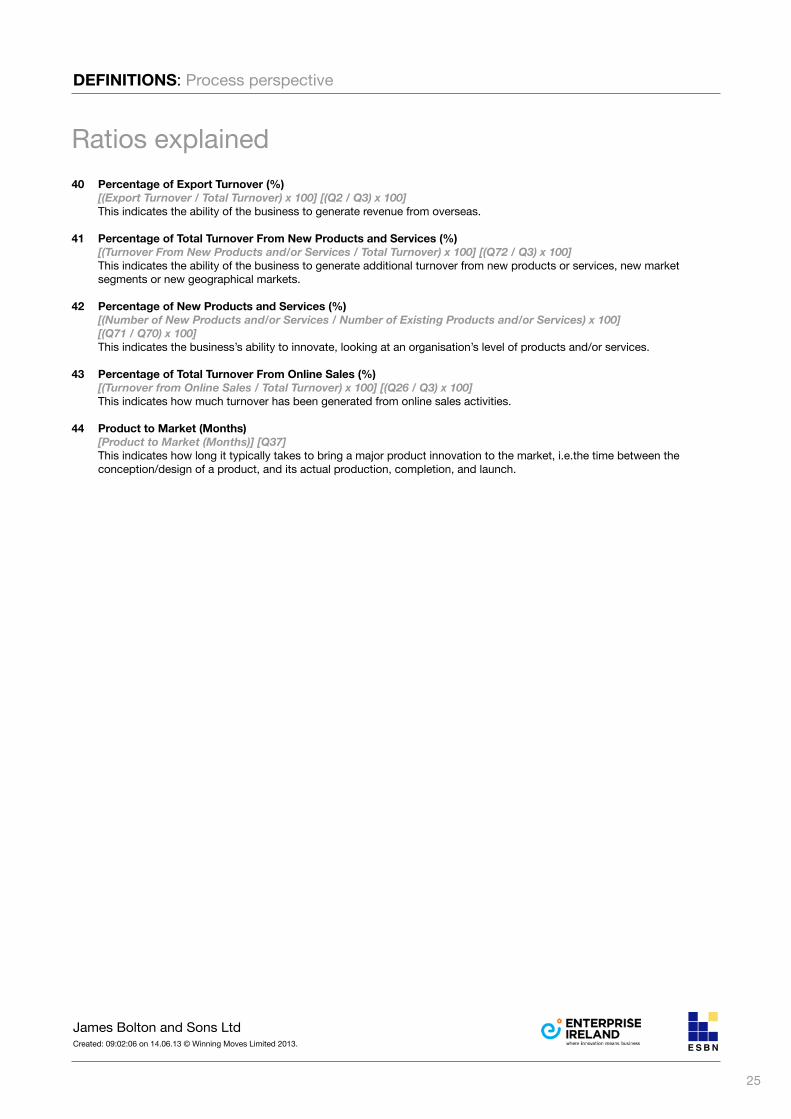
Ratios explained40 Percentage of Export Turnover (%)
[(Export Turnover / Total Turnover) x 100] [(Q2 / Q3) x 100] This indicates the ability of the business to generate revenue from overseas.
41 Percentage of Total Turnover From New Products and Services (%) [(Turnover From New Products and/or Services / Total Turnover) x 100] [(Q72 / Q3) x 100]
This indicates the ability of the business to generate additional turnover from new products or services, new market segments or new geographical markets.
42 Percentage of New Products and Services (%) [(Number of New Products and/or Services / Number of Existing Products and/or Services) x 100] [(Q71 / Q70) x 100]
This indicates the business’s ability to innovate, looking at an organisation’s level of products and/or services.
43 Percentage of Total Turnover From Online Sales (%) [(Turnover from Online Sales / Total Turnover) x 100] [(Q26 / Q3) x 100]
This indicates how much turnover has been generated from online sales activities.
44 Product to Market (Months) [Product to Market (Months)] [Q37]
This indicates how long it typically takes to bring a major product innovation to the market, i.e.the time between the conception/design of a product, and its actual production, completion, and launch.
26
James Bolton and Sons LtdCreated: 09:02:06 on 14.06.13 © Winning Moves Limited 2013.
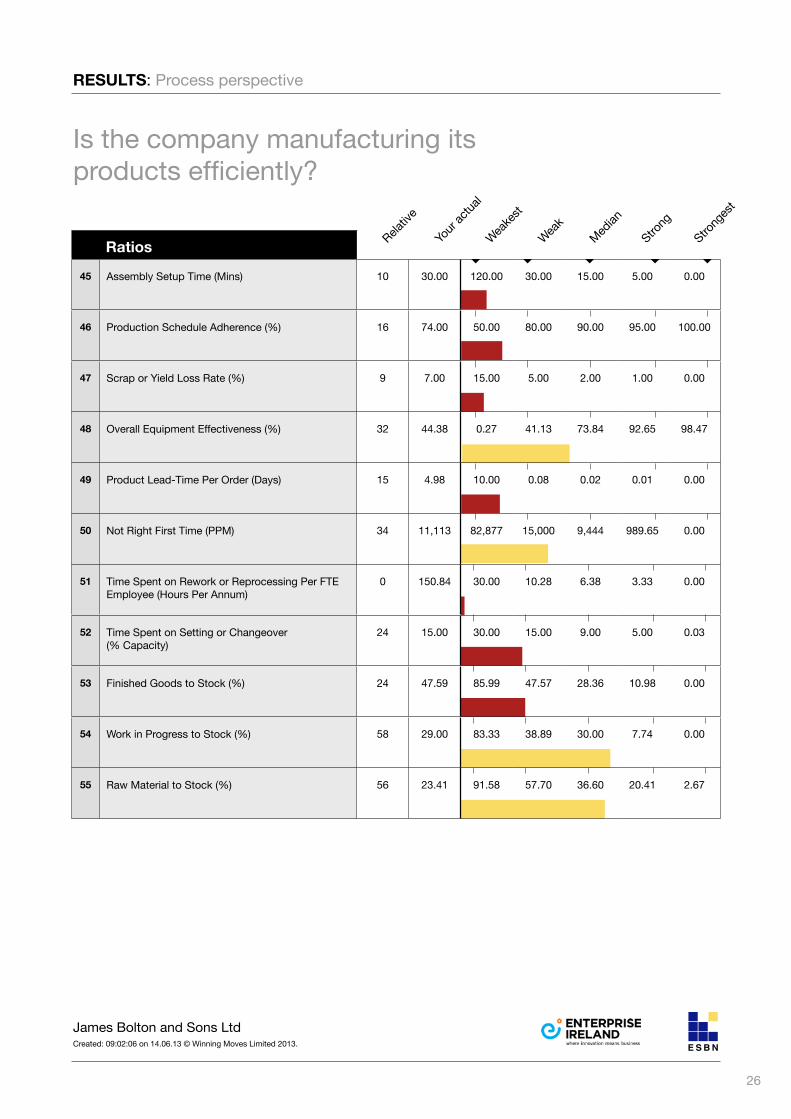
Is the company manufacturing its products efficiently?
Relativ
e
Your
actua
l
Weake
st
Weak
Median
Strong
Strong
est
RESULTS: Process perspective
Ratios
45 Assembly Setup Time (Mins) 10 30.00 120.00 30.00 15.00 5.00 0.00
46 Production Schedule Adherence (%) 16 74.00 50.00 80.00 90.00 95.00 100.00
47 Scrap or Yield Loss Rate (%) 9 7.00 15.00 5.00 2.00 1.00 0.00
48 Overall Equipment Effectiveness (%) 32 44.38 0.27 41.13 73.84 92.65 98.47
49 Product Lead-Time Per Order (Days) 15 4.98 10.00 0.08 0.02 0.01 0.00
50 Not Right First Time (PPM) 34 11,113 82,877 15,000 9,444 989.65 0.00
51 Time Spent on Rework or Reprocessing Per FTE Employee (Hours Per Annum)
0 150.84 30.00 10.28 6.38 3.33 0.00
52 Time Spent on Setting or Changeover (% Capacity)
24 15.00 30.00 15.00 9.00 5.00 0.03
53 Finished Goods to Stock (%) 24 47.59 85.99 47.57 28.36 10.98 0.00
54 Work in Progress to Stock (%) 58 29.00 83.33 38.89 30.00 7.74 0.00
55 Raw Material to Stock (%) 56 23.41 91.58 57.70 36.60 20.41 2.67
27
James Bolton and Sons LtdCreated: 09:02:06 on 14.06.13 © Winning Moves Limited 2013.
DEFINITIONS: Process perspective
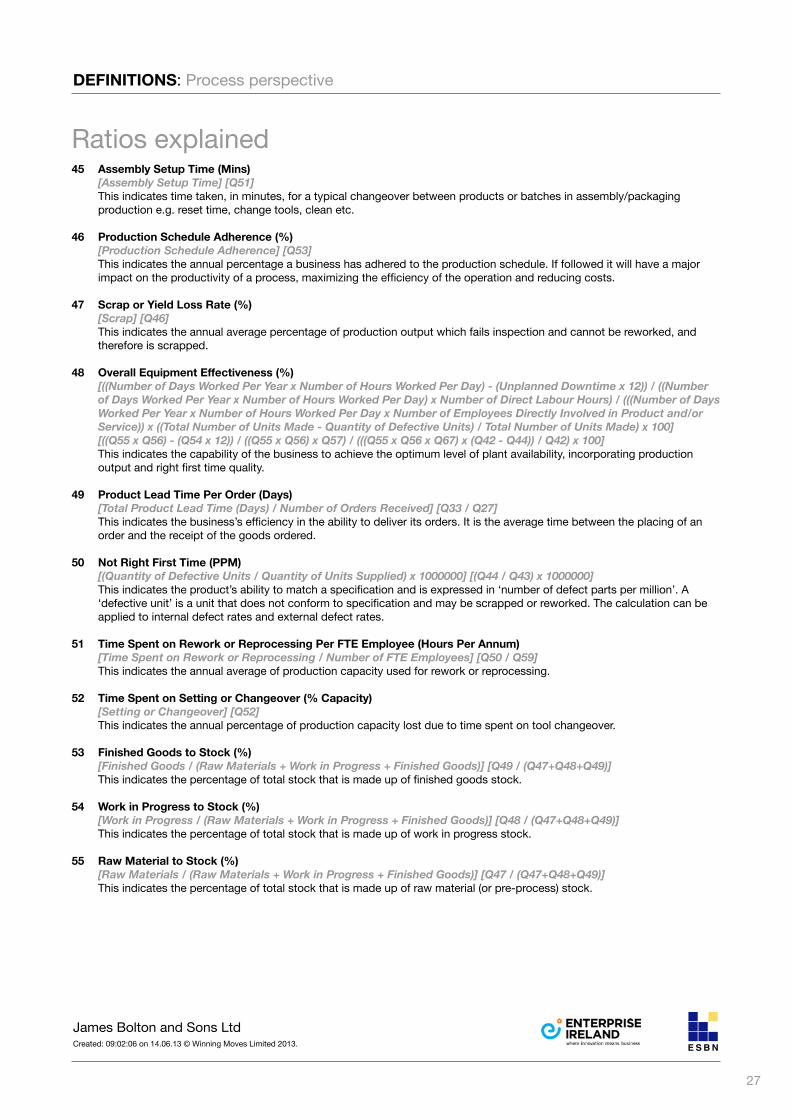
Ratios explained45 Assembly Setup Time (Mins)
[Assembly Setup Time] [Q51] This indicates time taken, in minutes, for a typical changeover between products or batches in assembly/packaging
production e.g. reset time, change tools, clean etc.
46 Production Schedule Adherence (%) [Production Schedule Adherence] [Q53]
This indicates the annual percentage a business has adhered to the production schedule. If followed it will have a major impact on the productivity of a process, maximizing the efficiency of the operation and reducing costs.
47 Scrap or Yield Loss Rate (%) [Scrap] [Q46]
This indicates the annual average percentage of production output which fails inspection and cannot be reworked, and therefore is scrapped.
48 Overall Equipment Effectiveness (%) [((Number of Days Worked Per Year x Number of Hours Worked Per Day) - (Unplanned Downtime x 12)) / ((Number of Days Worked Per Year x Number of Hours Worked Per Day) x Number of Direct Labour Hours) / (((Number of Days Worked Per Year x Number of Hours Worked Per Day x Number of Employees Directly Involved in Product and/or Service)) x ((Total Number of Units Made - Quantity of Defective Units) / Total Number of Units Made) x 100] [((Q55 x Q56) - (Q54 x 12)) / ((Q55 x Q56) x Q57) / (((Q55 x Q56 x Q67) x (Q42 - Q44)) / Q42) x 100]
This indicates the capability of the business to achieve the optimum level of plant availability, incorporating production output and right first time quality.
49 Product Lead Time Per Order (Days) [Total Product Lead Time (Days) / Number of Orders Received] [Q33 / Q27]
This indicates the business’s efficiency in the ability to deliver its orders. It is the average time between the placing of an order and the receipt of the goods ordered.
50 Not Right First Time (PPM) [(Quantity of Defective Units / Quantity of Units Supplied) x 1000000] [(Q44 / Q43) x 1000000]
This indicates the product’s ability to match a specification and is expressed in ‘number of defect parts per million’. A ‘defective unit’ is a unit that does not conform to specification and may be scrapped or reworked. The calculation can be applied to internal defect rates and external defect rates.
51 Time Spent on Rework or Reprocessing Per FTE Employee (Hours Per Annum) [Time Spent on Rework or Reprocessing / Number of FTE Employees] [Q50 / Q59]
This indicates the annual average of production capacity used for rework or reprocessing.
52 Time Spent on Setting or Changeover (% Capacity) [Setting or Changeover] [Q52]
This indicates the annual percentage of production capacity lost due to time spent on tool changeover.
53 Finished Goods to Stock (%) [Finished Goods / (Raw Materials + Work in Progress + Finished Goods)] [Q49 / (Q47+Q48+Q49)]
This indicates the percentage of total stock that is made up of finished goods stock.
54 Work in Progress to Stock (%) [Work in Progress / (Raw Materials + Work in Progress + Finished Goods)] [Q48 / (Q47+Q48+Q49)]
This indicates the percentage of total stock that is made up of work in progress stock.
55 Raw Material to Stock (%) [Raw Materials / (Raw Materials + Work in Progress + Finished Goods)] [Q47 / (Q47+Q48+Q49)]
This indicates the percentage of total stock that is made up of raw material (or pre-process) stock.
28
James Bolton and Sons LtdCreated: 09:02:06 on 14.06.13 © Winning Moves Limited 2013.
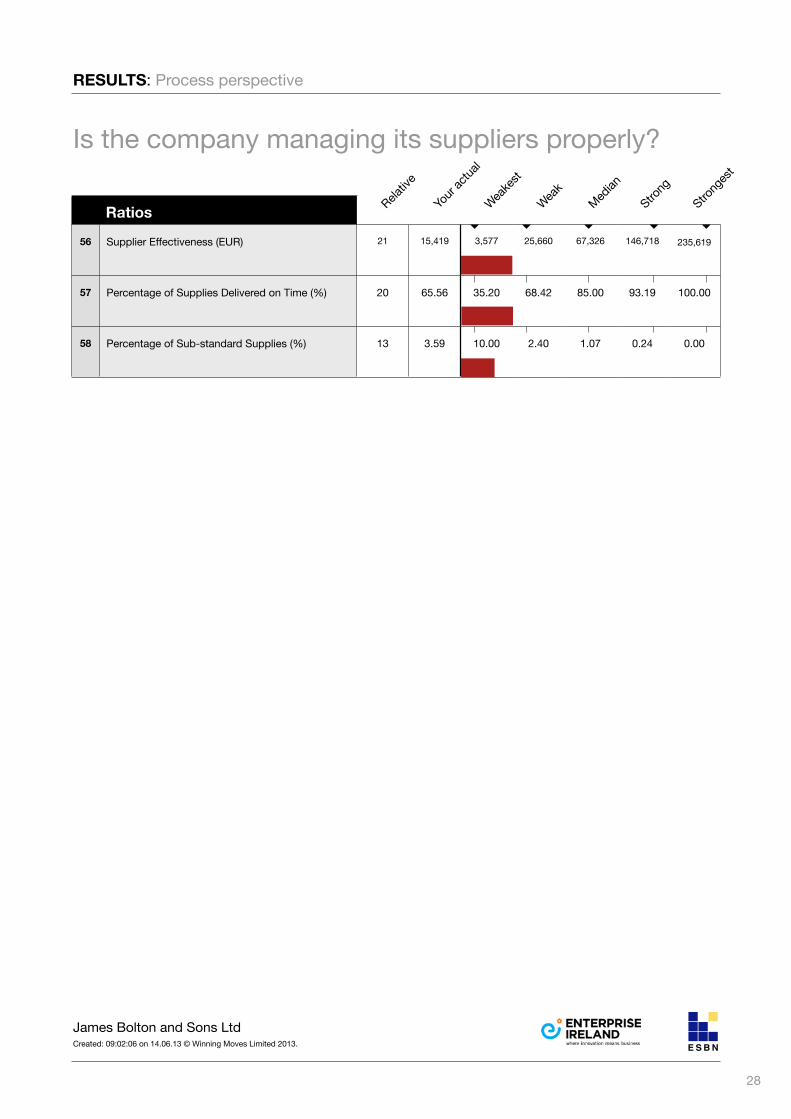
Is the company managing its suppliers properly?
Relativ
e
Your
actua
l
Weake
st
Weak
Median
Strong
Strong
est
RESULTS: Process perspective
Ratios
56 Supplier Effectiveness (EUR) 21 15,419 3,577 25,660 67,326 146,718 235,619
57 Percentage of Supplies Delivered on Time (%) 20 65.56 35.20 68.42 85.00 93.19 100.00
58 Percentage of Sub-standard Supplies (%) 13 3.59 10.00 2.40 1.07 0.24 0.00
29
James Bolton and Sons LtdCreated: 09:02:06 on 14.06.13 © Winning Moves Limited 2013.
DEFINITIONS: Process perspective
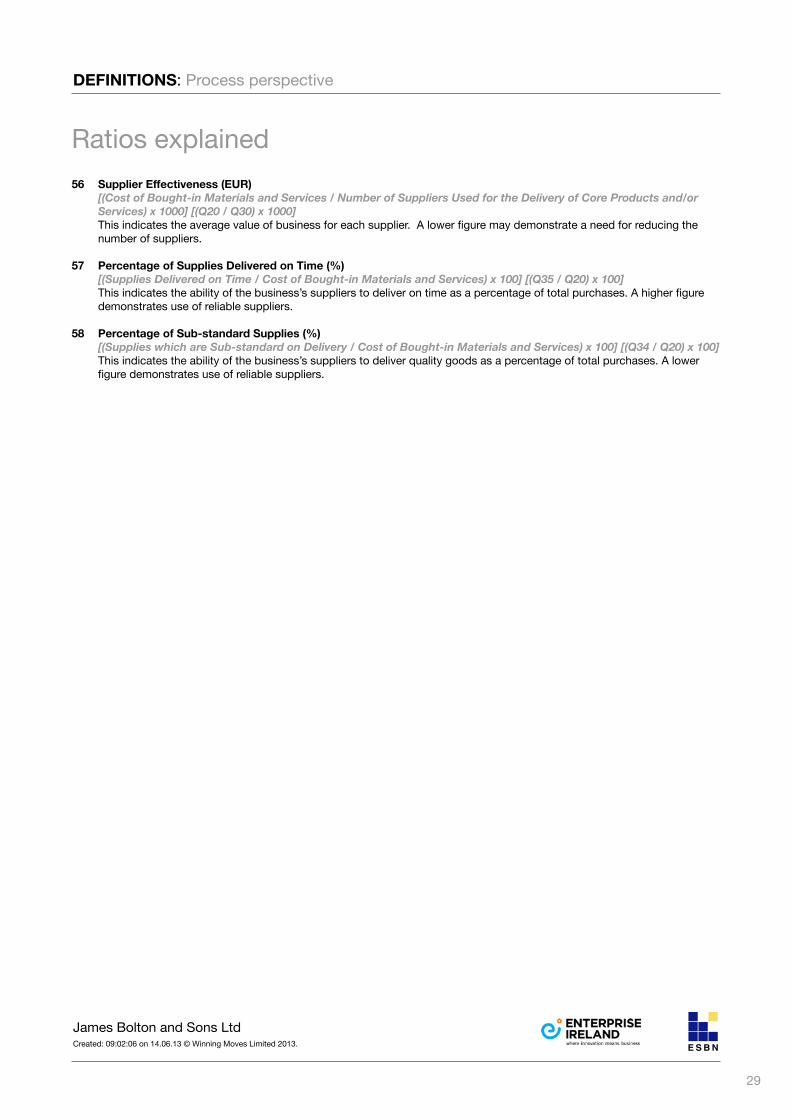
Ratios explained56 Supplier Effectiveness (EUR)
[(Cost of Bought-in Materials and Services / Number of Suppliers Used for the Delivery of Core Products and/or Services) x 1000] [(Q20 / Q30) x 1000] This indicates the average value of business for each supplier. A lower figure may demonstrate a need for reducing the number of suppliers.
57 Percentage of Supplies Delivered on Time (%) [(Supplies Delivered on Time / Cost of Bought-in Materials and Services) x 100] [(Q35 / Q20) x 100]
This indicates the ability of the business’s suppliers to deliver on time as a percentage of total purchases. A higher figure demonstrates use of reliable suppliers.
58 Percentage of Sub-standard Supplies (%) [(Supplies which are Sub-standard on Delivery / Cost of Bought-in Materials and Services) x 100] [(Q34 / Q20) x 100]
This indicates the ability of the business’s suppliers to deliver quality goods as a percentage of total purchases. A lower figure demonstrates use of reliable suppliers.
30
James Bolton and Sons LtdCreated: 09:02:06 on 14.06.13 © Winning Moves Limited 2013.
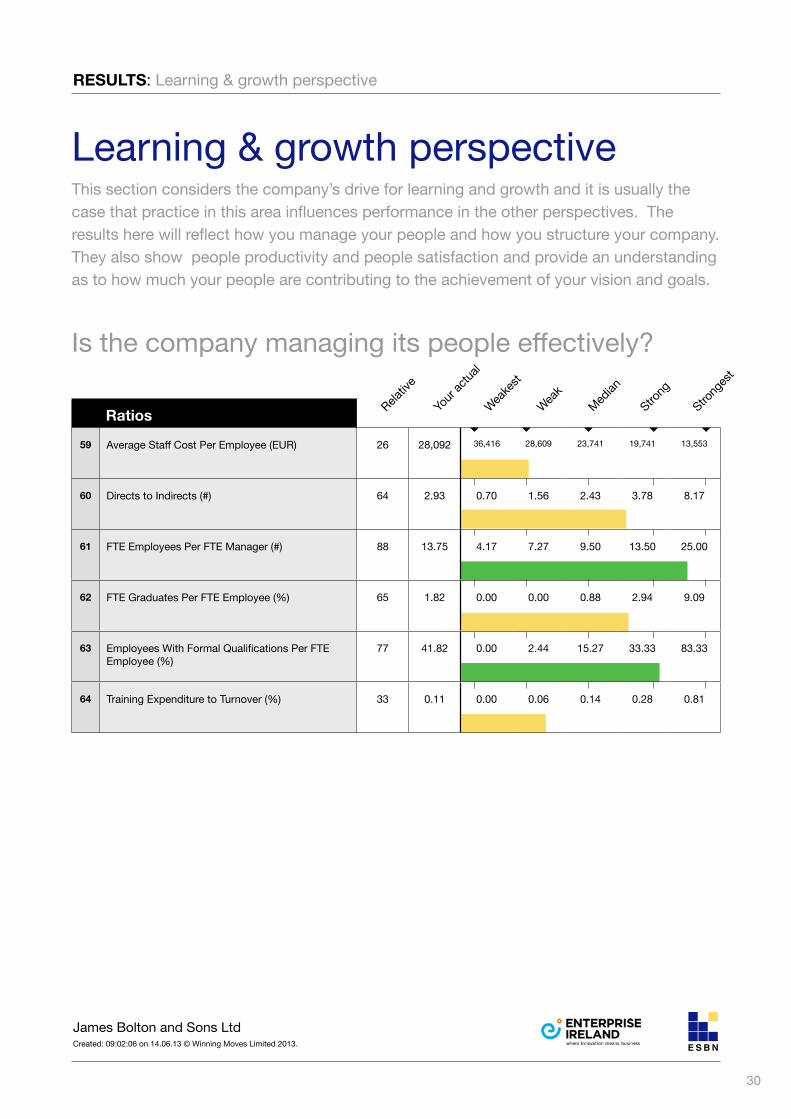
Is the company managing its people effectively?
Relativ
e
Your
actua
l
Weake
st
Weak
Median
Strong
Strong
est
Learning & growth perspectiveThis section considers the company’s drive for learning and growth and it is usually the case that practice in this area influences performance in the other perspectives. The results here will reflect how you manage your people and how you structure your company. They also show people productivity and people satisfaction and provide an understanding as to how much your people are contributing to the achievement of your vision and goals.
RESULTS: Learning & growth perspective
Ratios
59 Average Staff Cost Per Employee (EUR) 26 28,092 36,416 28,609 23,741 19,741 13,553
60 Directs to Indirects (#) 64 2.93 0.70 1.56 2.43 3.78 8.17
61 FTE Employees Per FTE Manager (#) 88 13.75 4.17 7.27 9.50 13.50 25.00
62 FTE Graduates Per FTE Employee (%) 65 1.82 0.00 0.00 0.88 2.94 9.09
63 Employees With Formal Qualifications Per FTE Employee (%)
77 41.82 0.00 2.44 15.27 33.33 83.33
64 Training Expenditure to Turnover (%) 33 0.11 0.00 0.06 0.14 0.28 0.81
31
James Bolton and Sons LtdCreated: 09:02:06 on 14.06.13 © Winning Moves Limited 2013.
DEFINITIONS: Learning & growth perspective
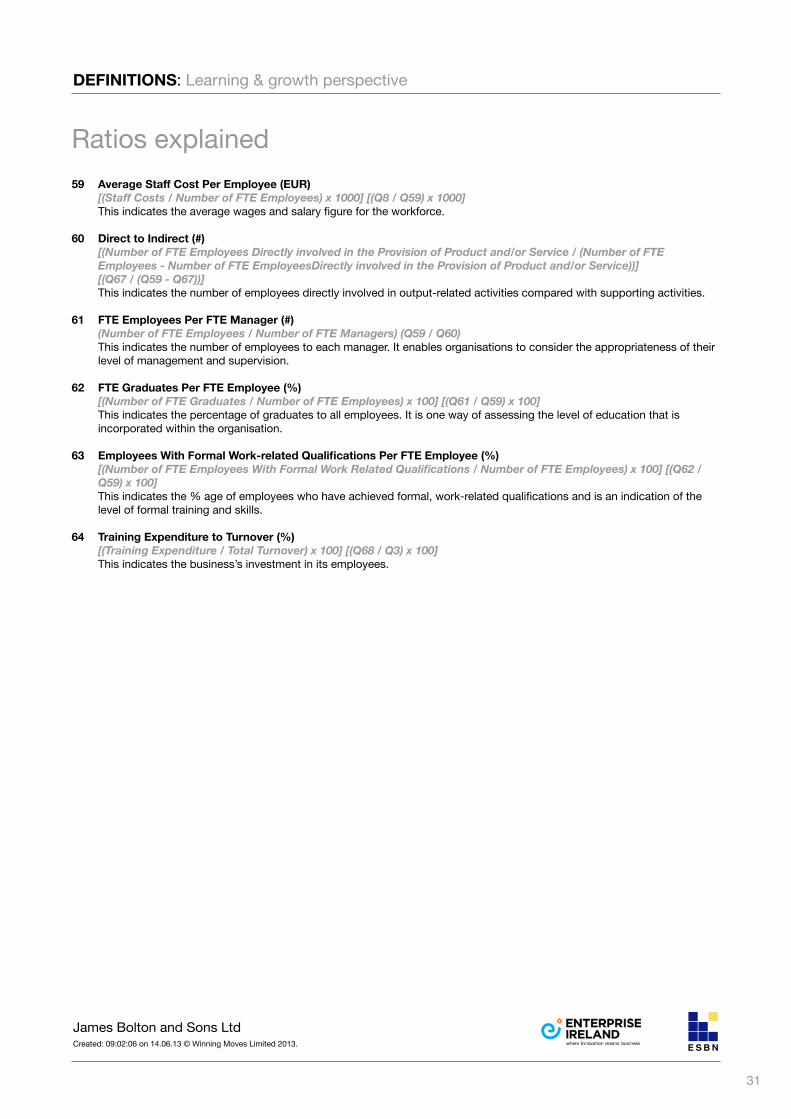
Ratios explained59 Average Staff Cost Per Employee (EUR)
[(Staff Costs / Number of FTE Employees) x 1000] [(Q8 / Q59) x 1000] This indicates the average wages and salary figure for the workforce.
60 Direct to Indirect (#) [(Number of FTE Employees Directly involved in the Provision of Product and/or Service / (Number of FTE Employees - Number of FTE EmployeesDirectly involved in the Provision of Product and/or Service))] [(Q67 / (Q59 - Q67))] This indicates the number of employees directly involved in output-related activities compared with supporting activities.
61 FTE Employees Per FTE Manager (#) (Number of FTE Employees / Number of FTE Managers) (Q59 / Q60)
This indicates the number of employees to each manager. It enables organisations to consider the appropriateness of their level of management and supervision.
62 FTE Graduates Per FTE Employee (%) [(Number of FTE Graduates / Number of FTE Employees) x 100] [(Q61 / Q59) x 100]
This indicates the percentage of graduates to all employees. It is one way of assessing the level of education that is incorporated within the organisation.
63 Employees With Formal Work-related Qualifications Per FTE Employee (%) [(Number of FTE Employees With Formal Work Related Qualifications / Number of FTE Employees) x 100] [(Q62 / Q59) x 100]
This indicates the % age of employees who have achieved formal, work-related qualifications and is an indication of the level of formal training and skills.
64 Training Expenditure to Turnover (%) [(Training Expenditure / Total Turnover) x 100] [(Q68 / Q3) x 100]
This indicates the business’s investment in its employees.
32
James Bolton and Sons LtdCreated: 09:02:06 on 14.06.13 © Winning Moves Limited 2013.
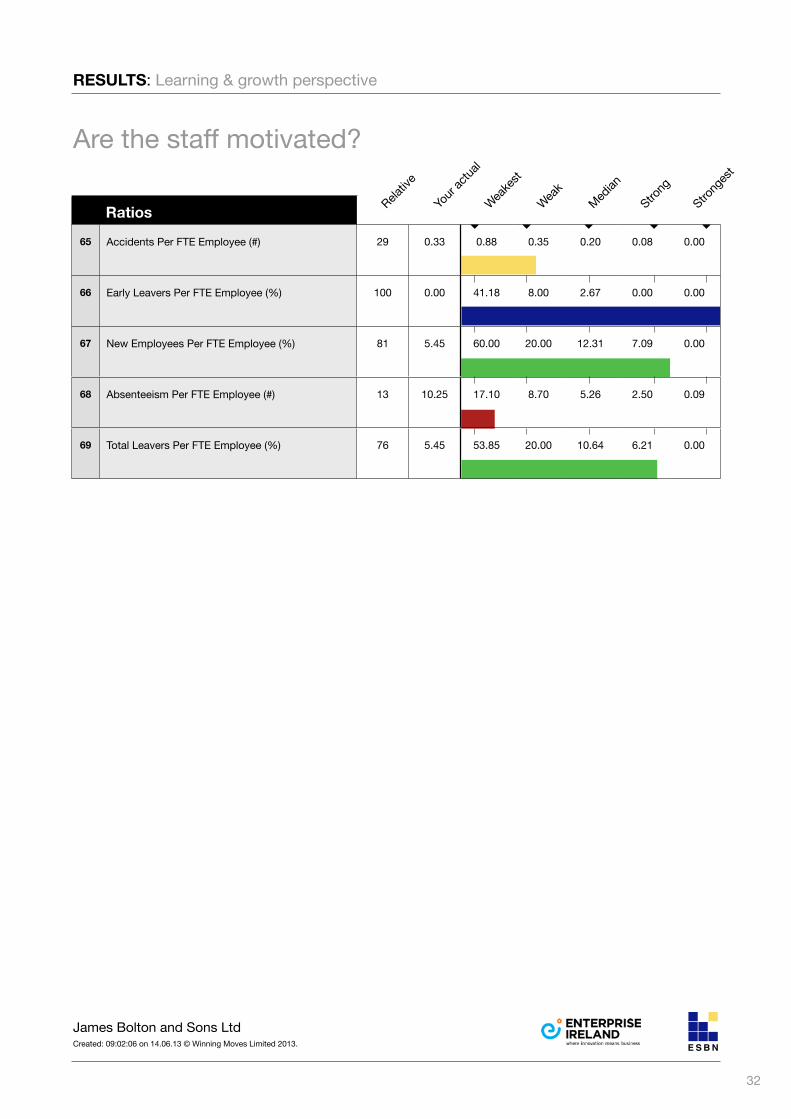
Are the staff motivated?
Relativ
e
Your
actua
l
Weake
st
Weak
Median
Strong
Strong
est
RESULTS: Learning & growth perspective
Ratios
65 Accidents Per FTE Employee (#) 29 0.33 0.88 0.35 0.20 0.08 0.00
66 Early Leavers Per FTE Employee (%) 100 0.00 41.18 8.00 2.67 0.00 0.00
67 New Employees Per FTE Employee (%) 81 5.45 60.00 20.00 12.31 7.09 0.00
68 Absenteeism Per FTE Employee (#) 13 10.25 17.10 8.70 5.26 2.50 0.09
69 Total Leavers Per FTE Employee (%) 76 5.45 53.85 20.00 10.64 6.21 0.00
33
James Bolton and Sons LtdCreated: 09:02:06 on 14.06.13 © Winning Moves Limited 2013.
DEFINITIONS: Learning & growth perspective
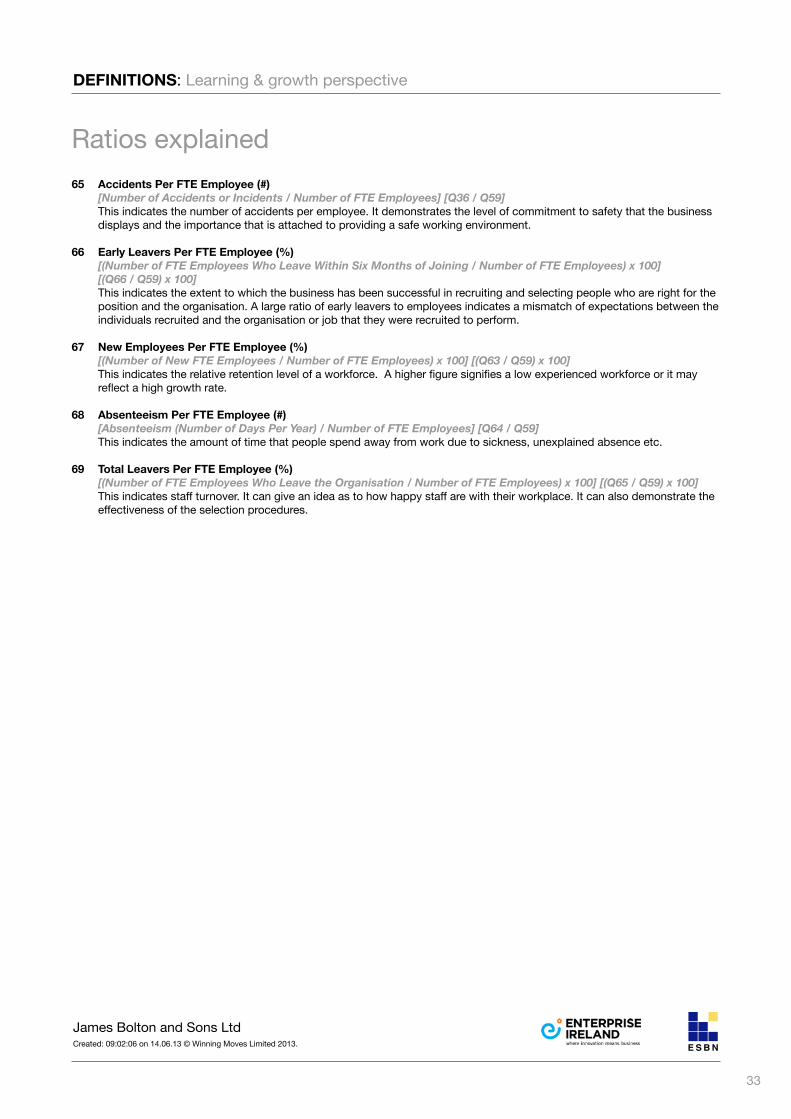
Ratios explained65 Accidents Per FTE Employee (#) [Number of Accidents or Incidents / Number of FTE Employees] [Q36 / Q59] This indicates the number of accidents per employee. It demonstrates the level of commitment to safety that the business
displays and the importance that is attached to providing a safe working environment.
66 Early Leavers Per FTE Employee (%) [(Number of FTE Employees Who Leave Within Six Months of Joining / Number of FTE Employees) x 100]
[(Q66 / Q59) x 100] This indicates the extent to which the business has been successful in recruiting and selecting people who are right for the position and the organisation. A large ratio of early leavers to employees indicates a mismatch of expectations between the individuals recruited and the organisation or job that they were recruited to perform.
67 New Employees Per FTE Employee (%) [(Number of New FTE Employees / Number of FTE Employees) x 100] [(Q63 / Q59) x 100] This indicates the relative retention level of a workforce. A higher figure signifies a low experienced workforce or it may
reflect a high growth rate.
68 Absenteeism Per FTE Employee (#) [Absenteeism (Number of Days Per Year) / Number of FTE Employees] [Q64 / Q59] This indicates the amount of time that people spend away from work due to sickness, unexplained absence etc.
69 Total Leavers Per FTE Employee (%) [(Number of FTE Employees Who Leave the Organisation / Number of FTE Employees) x 100] [(Q65 / Q59) x 100]
This indicates staff turnover. It can give an idea as to how happy staff are with their workplace. It can also demonstrate the effectiveness of the selection procedures.
34
James Bolton and Sons LtdCreated: 09:02:06 on 14.06.13 © Winning Moves Limited 2013.
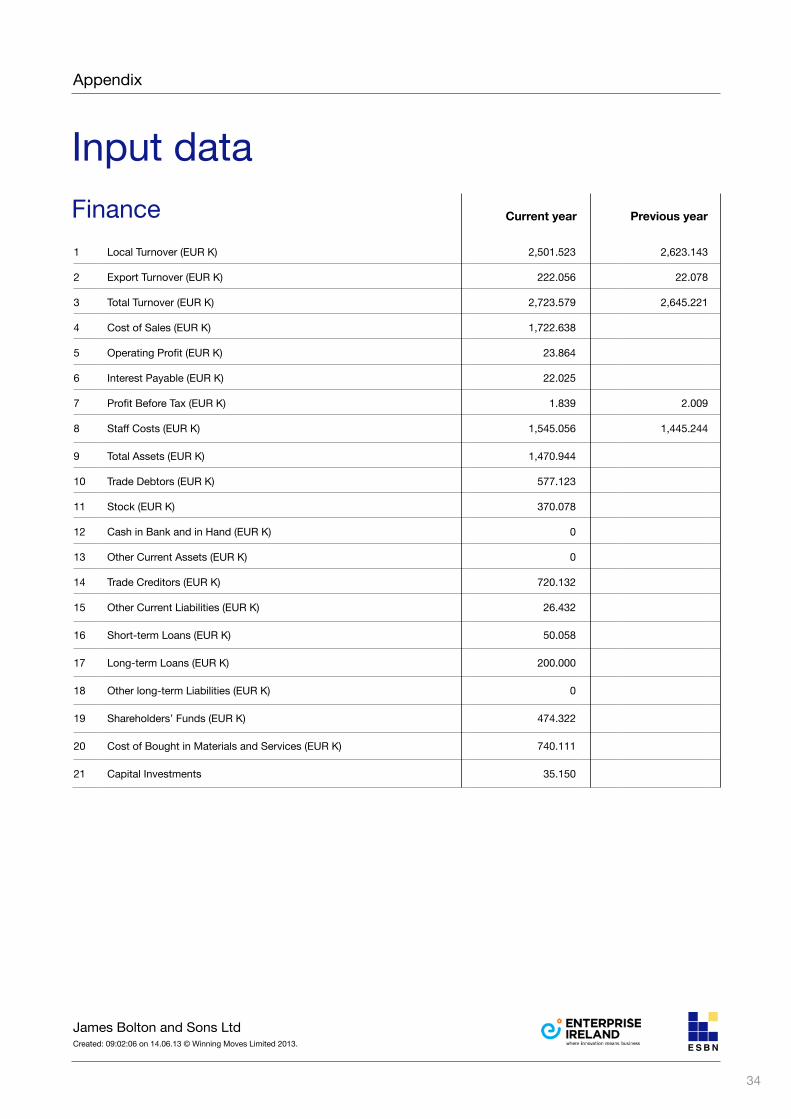
Finance
Input data
Appendix
Previous yearCurrent year
1 Local Turnover (EUR K) 2,501.523 2,623.143
2 Export Turnover (EUR K) 222.056 22.078
3 Total Turnover (EUR K) 2,723.579 2,645.221
4 Cost of Sales (EUR K) 1,722.638
5 Operating Profit (EUR K) 23.864
6 Interest Payable (EUR K) 22.025
7 Profit Before Tax (EUR K) 1.839 2.009
8 Staff Costs (EUR K) 1,545.056 1,445.244
9 Total Assets (EUR K) 1,470.944
10 Trade Debtors (EUR K) 577.123
11 Stock (EUR K) 370.078
12 Cash in Bank and in Hand (EUR K) 0
13 Other Current Assets (EUR K) 0
14 Trade Creditors (EUR K) 720.132
15 Other Current Liabilities (EUR K) 26.432
16 Short-term Loans (EUR K) 50.058
17 Long-term Loans (EUR K) 200.000
18 Other long-term Liabilities (EUR K) 0
19 Shareholders’ Funds (EUR K) 474.322
20 Cost of Bought in Materials and Services (EUR K) 740.111
21 Capital Investments 35.150
35
James Bolton and Sons LtdCreated: 09:02:06 on 14.06.13 © Winning Moves Limited 2013.
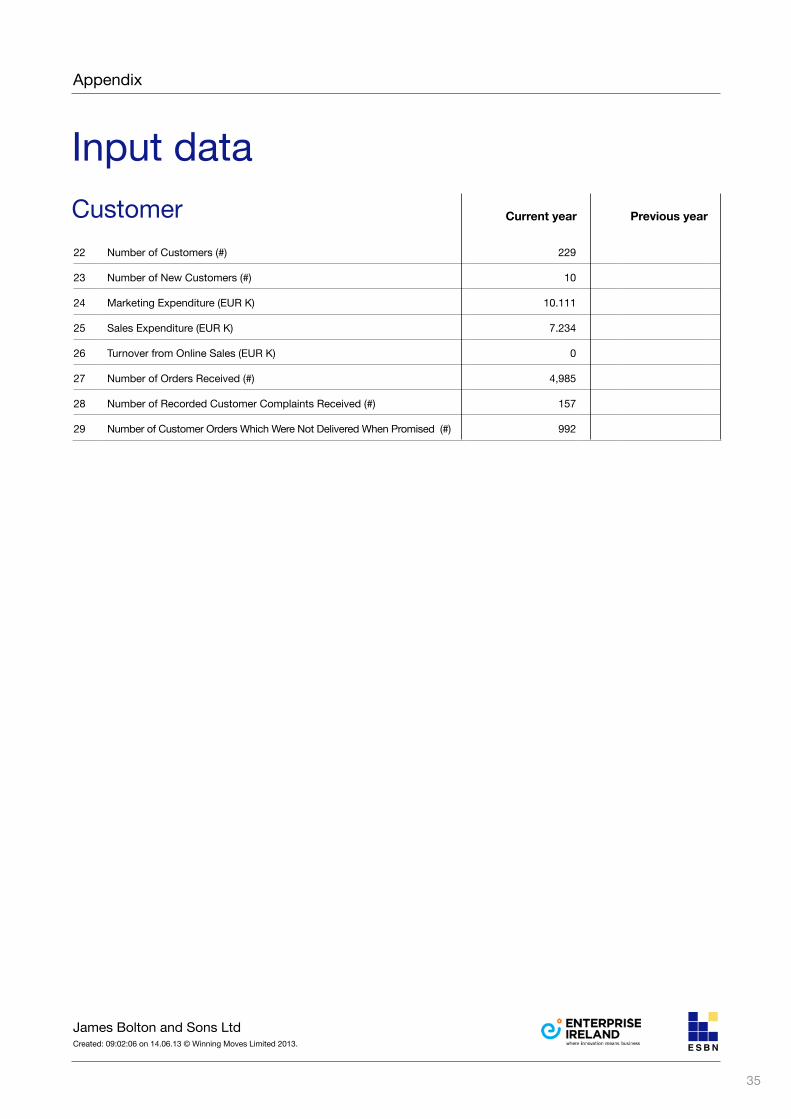
Customer
Input data
Appendix
22 Number of Customers (#) 229
23 Number of New Customers (#) 10
24 Marketing Expenditure (EUR K) 10.111
25 Sales Expenditure (EUR K) 7.234
26 Turnover from Online Sales (EUR K) 0
27 Number of Orders Received (#) 4,985
28 Number of Recorded Customer Complaints Received (#) 157
29 Number of Customer Orders Which Were Not Delivered When Promised (#) 992
Previous yearCurrent year
36
James Bolton and Sons LtdCreated: 09:02:06 on 14.06.13 © Winning Moves Limited 2013.
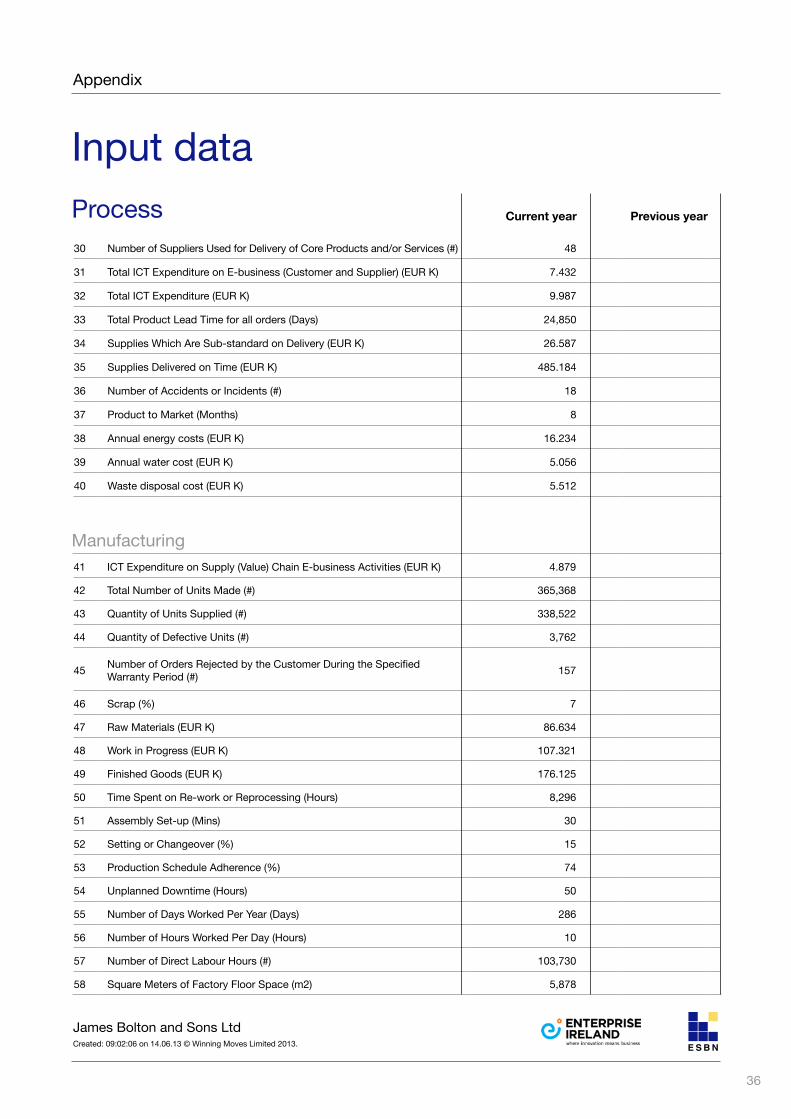
Input data
Appendix
41 ICT Expenditure on Supply (Value) Chain E-business Activities (EUR K) 4.879
42 Total Number of Units Made (#) 365,368
43 Quantity of Units Supplied (#) 338,522
44 Quantity of Defective Units (#) 3,762
45 Number of Orders Rejected by the Customer During the Specified Warranty Period (#) 157
46 Scrap (%) 7
47 Raw Materials (EUR K) 86.634
48 Work in Progress (EUR K) 107.321
49 Finished Goods (EUR K) 176.125
50 Time Spent on Re-work or Reprocessing (Hours) 8,296
51 Assembly Set-up (Mins) 30
52 Setting or Changeover (%) 15
53 Production Schedule Adherence (%) 74
54 Unplanned Downtime (Hours) 50
55 Number of Days Worked Per Year (Days) 286
56 Number of Hours Worked Per Day (Hours) 10
57 Number of Direct Labour Hours (#) 103,730
58 Square Meters of Factory Floor Space (m2) 5,878
Manufacturing
Process30 Number of Suppliers Used for Delivery of Core Products and/or Services (#) 48
31 Total ICT Expenditure on E-business (Customer and Supplier) (EUR K) 7.432
32 Total ICT Expenditure (EUR K) 9.987
33 Total Product Lead Time for all orders (Days) 24,850
34 Supplies Which Are Sub-standard on Delivery (EUR K) 26.587
35 Supplies Delivered on Time (EUR K) 485.184
36 Number of Accidents or Incidents (#) 18
37 Product to Market (Months) 8
38 Annual energy costs (EUR K) 16.234
39 Annual water cost (EUR K) 5.056
40 Waste disposal cost (EUR K) 5.512
Previous yearCurrent year
37
James Bolton and Sons LtdCreated: 09:02:06 on 14.06.13 © Winning Moves Limited 2013.
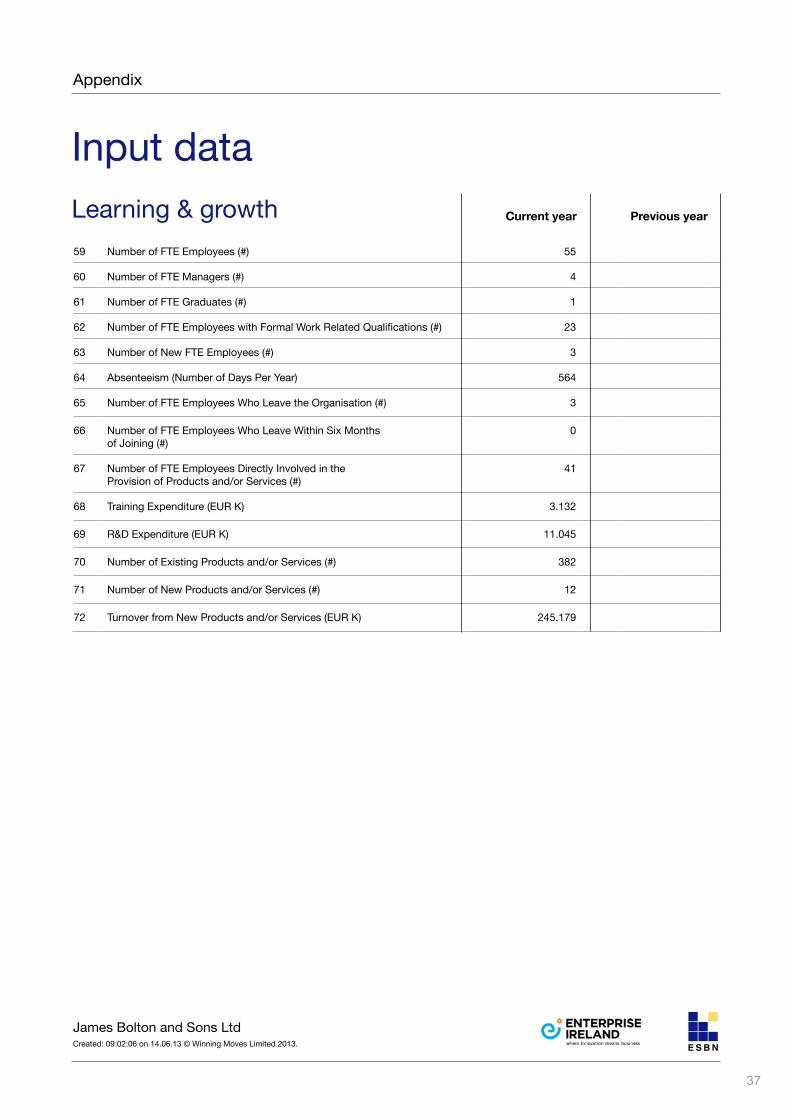
Input data
Appendix
59 Number of FTE Employees (#) 55
60 Number of FTE Managers (#) 4
61 Number of FTE Graduates (#) 1
62 Number of FTE Employees with Formal Work Related Qualifications (#) 23
63 Number of New FTE Employees (#) 3
64 Absenteeism (Number of Days Per Year) 564
65 Number of FTE Employees Who Leave the Organisation (#) 3
66 Number of FTE Employees Who Leave Within Six Months of Joining (#)
0
67 Number of FTE Employees Directly Involved in the Provision of Products and/or Services (#)
41
68 Training Expenditure (EUR K) 3.132
69 R&D Expenditure (EUR K) 11.045
70 Number of Existing Products and/or Services (#) 382
71 Number of New Products and/or Services (#) 12
72 Turnover from New Products and/or Services (EUR K) 245.179
Learning & growth Previous yearCurrent year
Benchmark Index data protection declarationsWinning Moves Ltd is primarily responsible for the delivery of the Benchmark Index system and will process your personal data in accordance with the Data Protection Act 1998 (‘DPA’) as the data controller. The information you provide will be used for the following purposes:
1. Processing and assessing the data contained in the questionnaire.
2. Submission to the database, which allows the data to be processed and a benchmark derived.
3. The ratio results (but not your personal details) may be used for statistical, performance reporting, benchmarking and evaluation purposes.
The database refers to all businesses that have used Benchmark Index for the purpose of benchmarking themselves against a comparison group of similar businesses.
You have a right to request a copy of any personal data held by Winning Moves Ltd at any time, so that you can check the accuracy of the information held.
If you wish to do this, please write (explaining that your interest is in personal data maintained by Winning Moves Ltd) to: Winning Moves Ltd, 3, St Mary’s Mews, Stafford, ST16 2AP UK.
The European SME Benchmarking NetworkBEST PRACTICE SERVICES
Enterprise IrelandEast Point Business ParkDublin 3 Tel: +353 1 727 2000Fax: +353 1 727 2020