manufacturing competitiveness analysis for hydrogen ... · cemac – clean energy manufacturing...
TRANSCRIPT

CEMAC – Clean Energy Manufacturing Analysis Center 1
Manufacturing Competitiveness Analysis for Hydrogen Refueling Stations
This presentation does not contain any proprietary, confidential, or otherwise restricted information
Project ID #MN017
Department of Energy Annual Merit Reviewfor Fuel Cell ResearchJune 08, 2016 || Washington, D.C.Ahmad Mayyas (Co-P.I.); Margaret Mann (P.I.)National Renewable Energy Laboratory
CEMAC – Clean Energy Manufacturing Analysis Center 2
Overview
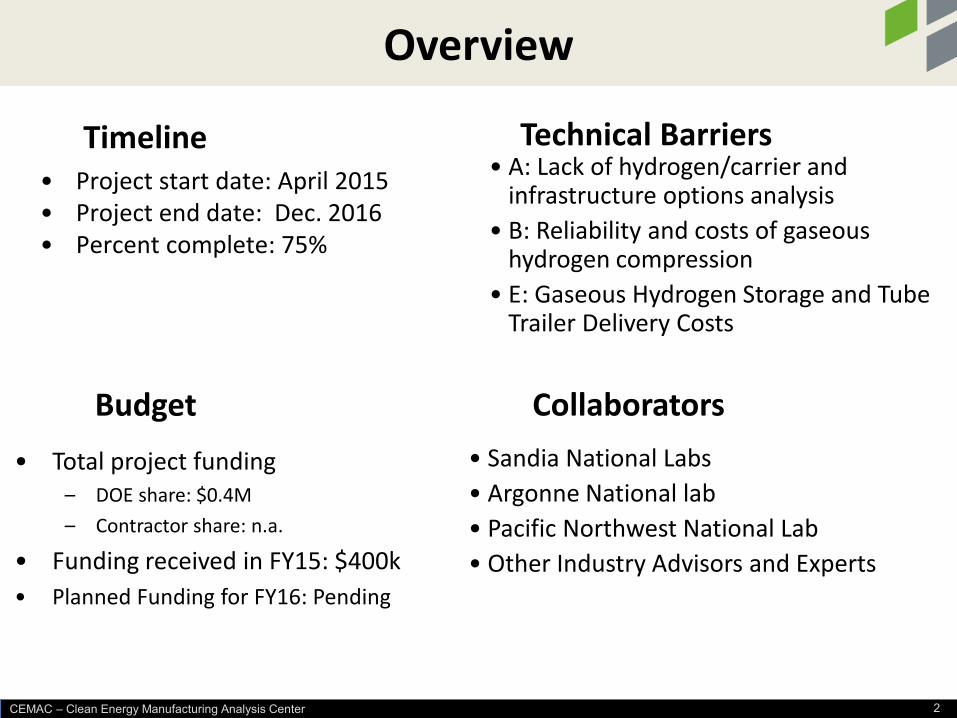
• Project start date: April 2015 • Project end date: Dec. 2016• Percent complete: 75%
• A: Lack of hydrogen/carrier and infrastructure options analysis
• B: Reliability and costs of gaseous hydrogen compression
• E: Gaseous Hydrogen Storage and Tube Trailer Delivery Costs
• Total project funding– DOE share: $0.4M– Contractor share: n.a.
• Funding received in FY15: $400k• Planned Funding for FY16: Pending
Budget
Technical Barriers
• Sandia National Labs• Argonne National lab• Pacific Northwest National Lab• Other Industry Advisors and Experts
Collaborators
Timeline
CEMAC – Clean Energy Manufacturing Analysis Center 31
The Clean Energy Manufacturing Analysis Center (CEMAC) provides unique and high-impact analysis, benchmarking, and insights of supply chains and manufacturing for clean energy technologies that can be leveraged by decision makers to inform research and development strategies, and other policy and investment decisions. Housed at the National Renewable Energy Laboratory and operated by the Joint Institute for Strategic Energy Analysis, CEMAC engages the DOE national lab complex, DOE offices, U.S. federal agencies, universities, and industry to promote economic growth and competitiveness in the transition to a clean energy economy.
CEMAC was established in 2015 by the U.S. DOE’s Clean Energy Manufacturing Initiative.
CEMAC – Clean Energy Manufacturing Analysis Center 4
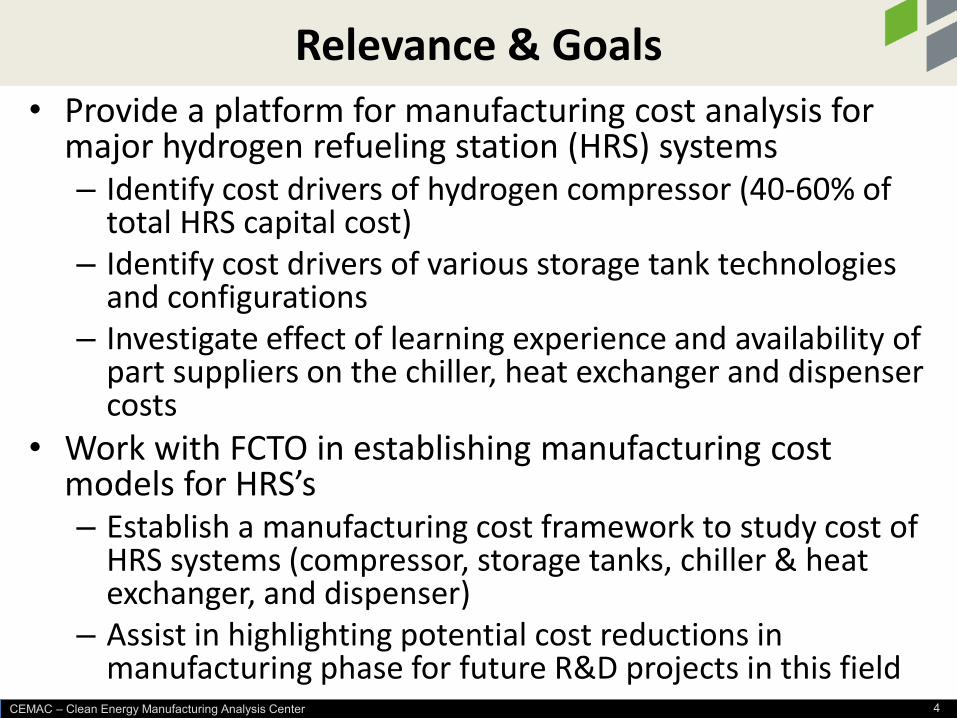
Relevance & Goals• Provide a platform for manufacturing cost analysis for
major hydrogen refueling station (HRS) systems– Identify cost drivers of hydrogen compressor (40-60% of
total HRS capital cost)– Identify cost drivers of various storage tank technologies
and configurations– Investigate effect of learning experience and availability of
part suppliers on the chiller, heat exchanger and dispenser costs
• Work with FCTO in establishing manufacturing cost models for HRS’s– Establish a manufacturing cost framework to study cost of
HRS systems (compressor, storage tanks, chiller & heat exchanger, and dispenser)
– Assist in highlighting potential cost reductions in manufacturing phase for future R&D projects in this field

CEMAC – Clean Energy Manufacturing Analysis Center 5
Approach Global Assumptions
(e.g., capital; tool life; building life; etc.)
Local Assumptions by Country
(e.g., labor; energy cost; building cost; etc.)
Manufacturing Cost Model(compressor; storage tanks;
dispenser; chiller, etc.)
Benchmark with Existing/Future
Commercial Products
Compare to other cost studies
(HRSAM; H2FIRST; California; Japan, Europe)
HRS Rollouts 2005-2016
(PNNL; CEC; NEDO; HySTU, NOW; CPE etc.)
HRS Trade Flows(HRS Developers, part
suppliers)
Supply Chain MapsHRS technology
(Gaseous, Liquid, Onsite) System components
Future HRS Rollouts2016-2030
Key Outputs1) HRS system manufacturing costs and minimum sustainable prices2) International trade flows & supply chain maps (U.S. supply chain)3) Estimation of future HRS technologies cost and effects on H2 price
Minimum Sustainable Price(Mnf’g cost, profit margin,
transportation, etc.)
Qualitative Factors(e.g. skilled labor; existing supply chain; Regulations;
tax policy, etc.
Quantifying these factors

CEMAC – Clean Energy Manufacturing Analysis Center 6
Approach: Hydrogen Delivery to the HRS
Truck delivery Compressed H2Tube storage
CompressorHigh pressure
hydrogen storage/cooling
Dispenser
A configuration of a hydrogen station with gaseous hydrogen delivery
Truck deliveryLiquid H2 Tank Cryogenic
Pump
A configuration of a hydrogen station with liquid hydrogen delivery
Evaporator
Liquid Hydrogen

CEMAC – Clean Energy Manufacturing Analysis Center 7
Accomplishments: International HRS Rollouts
2015/2016 50 HRS†
2020 300 HRS2030 1,000 HRS
2015/2016 100 HRS†
2020 187 HRS 2030 >500 HRS
2015/2016 43 HRS†
2020 168 HRS 2030 500 HRS
2015/2016 ~5 HRS†
2020 65 HRS2030 330 HRS
2015/2016 ~15 HRS†
2020 185 HRS 2030 500 HRS
2015/2016 51 HRS†
2020 87 HRS 2030 >500 HRS
† Rollout in 2015/2016 is based on the announced number of HRS’sHRS: Hydrogen Refueling Station

CEMAC – Clean Energy Manufacturing Analysis Center 8
Accomplishments: HRS Trade Flows Map
• HRS’s trade flow by number of stations in the past 11 years• Germany is leading European countries in the numbers of
produced HRS’s and the number of installations (~100 HRS’s)• Japan has a strategic plan for Hydrogen infrastructure (~100
HRS’s by end of FY 2015; about 87 already installed)
Medium to high capacities (>50 kg/day)

CEMAC – Clean Energy Manufacturing Analysis Center 9
Accomplishments: HRS Flow Map
International HRS’s including planned HRS’s be end of 2016
HRS’s by Capacity; medium to high capacities (>50 kg/day)

CEMAC – Clean Energy Manufacturing Analysis Center 10
Accomplishments: HRS Capital Cost
Maeda, 2013
Elgowainy et al., 2015Other Expenses include site engineering; permitting; commissioning; and construction
Pratt et al., 2015
Shinka, 2014Suzauki, 2014
HRS Cost-Japan
CEMAC – Clean Energy Manufacturing Analysis Center 11
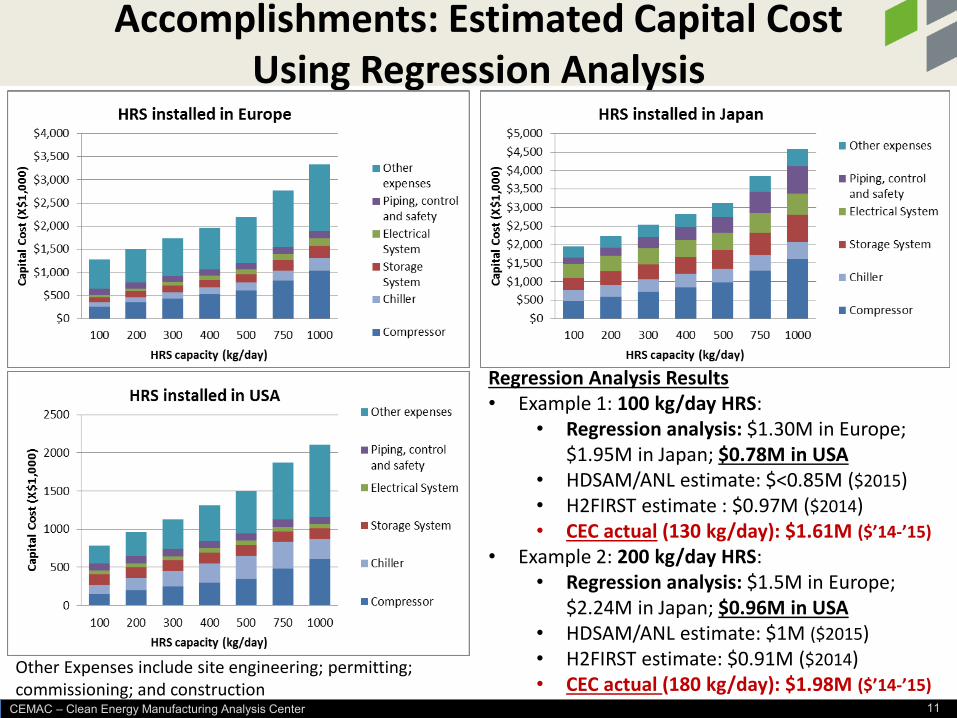
Accomplishments: Estimated Capital CostUsing Regression Analysis
Regression Analysis Results• Example 1: 100 kg/day HRS:
• Regression analysis: $1.30M in Europe; $1.95M in Japan; $0.78M in USA
• HDSAM/ANL estimate: $<0.85M ($2015) • H2FIRST estimate : $0.97M ($2014)• CEC actual (130 kg/day): $1.61M ($’14-’15)
• Example 2: 200 kg/day HRS:• Regression analysis: $1.5M in Europe;
$2.24M in Japan; $0.96M in USA • HDSAM/ANL estimate: $1M ($2015) • H2FIRST estimate: $0.91M ($2014)• CEC actual (180 kg/day): $1.98M ($’14-’15)
Other Expenses include site engineering; permitting; commissioning; and construction
CEMAC – Clean Energy Manufacturing Analysis Center 12
Assumptions- Compressor Manufacturing• 1 stage compressor• Compression ratio < 6• Pin= 150-200 bar; Pout= 350-420 bar (5,000-6,000 psi)• Manufacturing cost model for compressor case and internal
parts only• Balance of system was added to the direct manufacturing
cost of the compressor case &internal parts• 30% of the direct manufacturing cost was added as a profit
margin (average value for machinery and equipment in early markets)
• 70 MPa HRS might need a hydrogen booster besides the compressor to increase the pressure from 350-420 bar (35-42 MPa) to about 700-900 bar for direct filling or storage in the cascade/buffer system

CEMAC – Clean Energy Manufacturing Analysis Center 13
Accomplishment: Manufacturing Cost Analysis - Hydrogen Compressor
Process Flow- Piston Compressor- 1 stage While diaphragm compressors have maintenance and performance advantages over piston compressors, they are also considerably more expensive*
Mf’g cost=$28,450 Mf’g cost= $5,150
CEMAC – Clean Energy Manufacturing Analysis Center 14
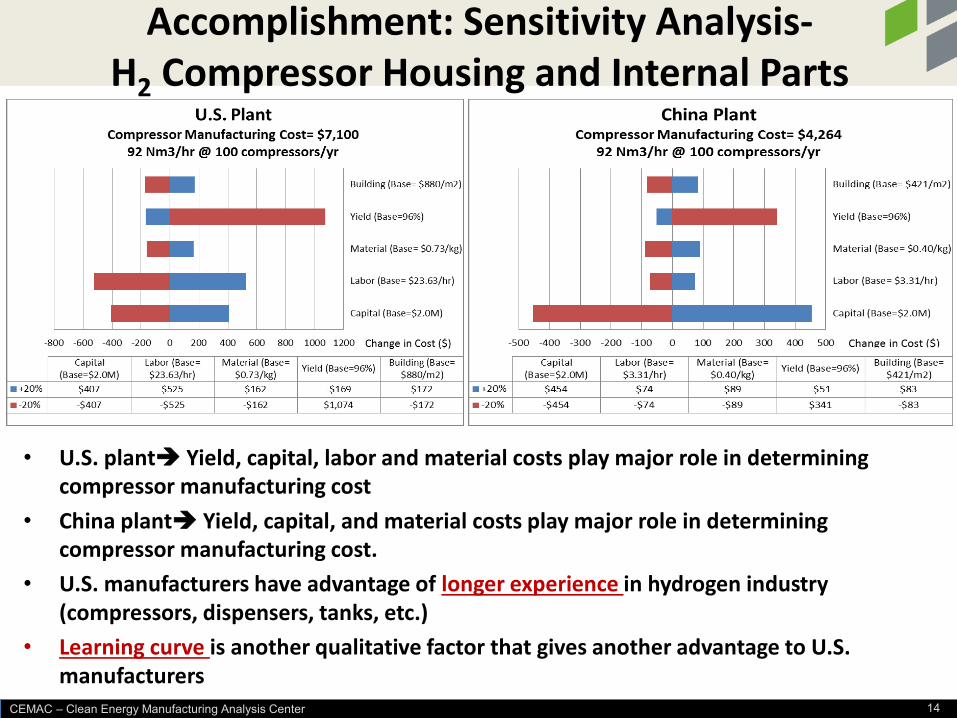
Accomplishment: Sensitivity Analysis-H2 Compressor Housing and Internal Parts
• U.S. plant Yield, capital, labor and material costs play major role in determining compressor manufacturing cost
• China plant Yield, capital, and material costs play major role in determining compressor manufacturing cost.
• U.S. manufacturers have advantage of longer experience in hydrogen industry (compressors, dispensers, tanks, etc.)
• Learning curve is another qualitative factor that gives another advantage to U.S. manufacturers
CEMAC – Clean Energy Manufacturing Analysis Center 15
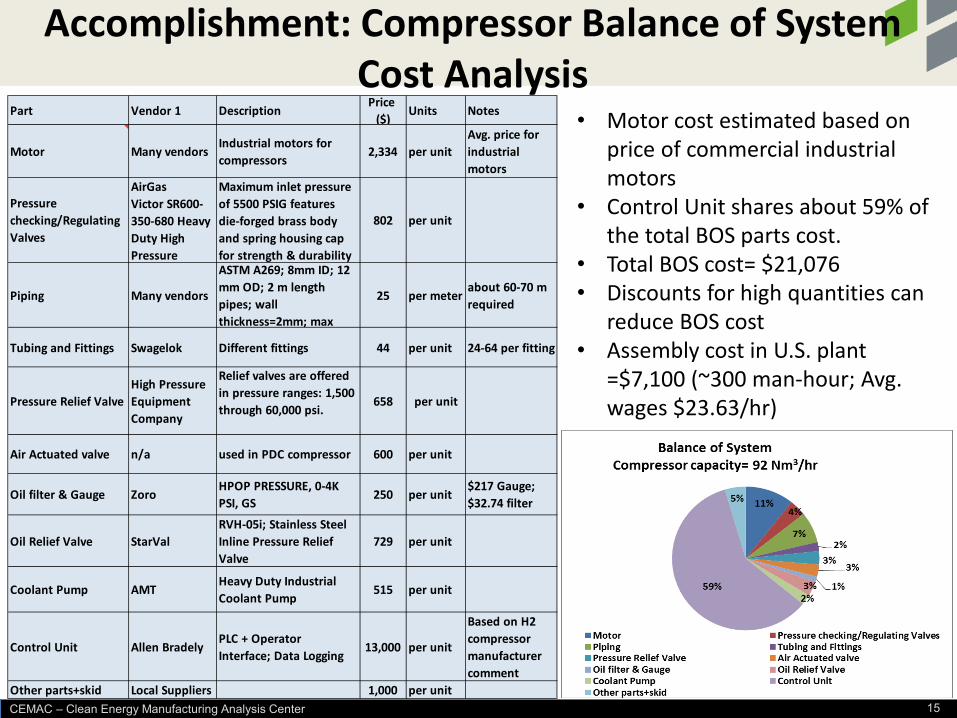
Accomplishment: Compressor Balance of System Cost Analysis
• Motor cost estimated based on price of commercial industrial motors
• Control Unit shares about 59% of the total BOS parts cost.
• Total BOS cost= $21,076• Discounts for high quantities can
reduce BOS cost• Assembly cost in U.S. plant
=$7,100 (~300 man-hour; Avg. wages $23.63/hr)
Part Vendor 1 DescriptionPrice
($)Units Notes
Motor Many vendorsIndustrial motors for compressors
2,334 per unitAvg. price for industrial motors
Pressure checking/Regulating Valves
AirGasVictor SR600-350-680 Heavy Duty High Pressure
Maximum inlet pressure of 5500 PSIG features die-forged brass body and spring housing cap for strength & durability
802 per unit
Piping Many vendors
ASTM A269; 8mm ID; 12 mm OD; 2 m length pipes; wall thickness=2mm; max
25 per meterabout 60-70 m required
Tubing and Fittings Swagelok Different fittings 44 per unit 24-64 per fitting
Pressure Relief ValveHigh Pressure Equipment Company
Relief valves are offered in pressure ranges: 1,500 through 60,000 psi.
658 per unit
Air Actuated valve n/a used in PDC compressor 600 per unit
Oil filter & Gauge ZoroHPOP PRESSURE, 0-4K PSI, GS
250 per unit$217 Gauge; $32.74 filter
Oil Relief Valve StarValRVH-05i; Stainless Steel Inline Pressure Relief Valve
729 per unit
Coolant Pump AMTHeavy Duty Industrial Coolant Pump
515 per unit
Control Unit Allen BradelyPLC + Operator Interface; Data Logging
13,000 per unit
Based on H2 compressor manufacturer comment
Other parts+skid Local Suppliers 1,000 per unit

CEMAC – Clean Energy Manufacturing Analysis Center 16
Accomplishment: Hydrogen Compressor-Minimum Sustainable Price
• Compressor capacity= 92 Nm3/hr or 200 kg/day (1 stage)
• Pin= 150-200 bar; Pout= 350-420 bar
• Shipping cost is assumed for shipping compressors from East Coast to West Coast in this example
• Margin is assumed to be 30% of the manufacturing cost
Mf’gcost=$80,268
Mf’g cost= $43,340

CEMAC – Clean Energy Manufacturing Analysis Center 17
Accomplishment: Minimum Sustainable Price
• United States advantages are lower shipping and interest rates and longer experience in this field
• China’s advantage relative to the U.S. is driven by lower labor, low material cost, building and energy costs
• Mexico’s advantage relative to the U.S. is driven by lower labor, and building costs

CEMAC – Clean Energy Manufacturing Analysis Center 18
Accomplishment: Seamless Metal H2 Vessels (Type I)
Process Flow- Type 1 Steel Tanks
Manufacturing Cost Curve (U.S. Plant) Minimum Sustainable Price
Profit margin=10% of total manufacturing cost

CEMAC – Clean Energy Manufacturing Analysis Center 19
Remaining Challenges and BarriersChallenges we’re seeking to overcome to improve the robustness of our study:• Limited data on HRS component suppliers for
international HRS’s• Lack of competition between part suppliers (e.g.
nozzles and hoses) make it hard to study potentials for cost reductions
• Finding collaborators in Europe and Asia is still a big challenge for our team
• Japan is updating its safety and standards, so it’s not clear how this will affect the cost of HRS’s
CEMAC – Clean Energy Manufacturing Analysis Center 20
Proposed Future Work
• Develop new set of trade flow maps with flows by HRS developer and by component manufacturers
• Complete manufacturing cost analysis for other HRS’s systems (e.g. dispenser, heat exchanger and chiller)
• Study effect of standardization in several countries on the cost of HRS’s
• Study effect of future technologies and economies of scale on the HRS cost and hydrogen prices

CEMAC – Clean Energy Manufacturing Analysis Center 21
Responses to 2015 AMR Reviewer Comments
• This is a new project and was not reviewed last year

CEMAC – Clean Energy Manufacturing Analysis Center 22
Collaborations• Joe Pratt: Sandia National Labs
– Provided some cost data for manufacturing cost analysis• Amgad Elgowainy & Marianne Mintz; Argonne National Lab (ANL)
– Help in validating manufacturing cost model results & effect of qualitative factors (e.g. number of jobs created)
• Daryl Brown; Pacific Northwest National Lab (PNNL)– Provided data on HRS capital costs (HRSAM)
• Tetsufumi Ikeda; HySTU program; Japan– HRS installations in Japan
• Kareem Afzal and Osama Al-Qasem; PDC Machines– Provided critical inputs for manufacturing cost analysis for compressors
• Tetsuya Tanaka; Hitachi compressors, Japan– Provided some specifications for H2 compressors for Japanese market
• Sean Shunsuke Chigusa; Kobelco Compressors, Japan/USA– Provided some inputs for hydrogen compressor
• Flex Happe; Commercial Specialist at US consulate in Berlin, Germany– Provided some data about hydrogen station installations in Europe
• Industry stakeholders: provided estimates for dispenser cost (SunDyne, Tescom, Swagelok, HyDAC, High Pressure Equipment, Rust Automation & Control, SBS, MyDax, Welcon, Russels Technical, Thermofin, etc.)

CEMAC – Clean Energy Manufacturing Analysis Center 23
Project Summary • Relevance: Provide framework for manufacturing cost and supply chain
analyses for hydrogen refueling stations• Approach: Bottom-up cost analysis cost models; detailed supply chain maps
and investigation of qualitative factors effect on manufacturing competitiveness
• Technical Accomplishments and Progress: – Manufacturing cost models for hydrogen compressors, storage tanks and
dispensers– Statistical models to estimate HRS capital cost in USA, Germany and Japan– Trade flow maps for global HRS’s
• Collaboration: Sandia; ANL and PNNL• Proposed Next-Year Research:
– Complete manufacturing cost models for dispensers, heat exchangers and chillers
– Update supply chain maps with more emphasis on HRS parts/systems– Investigate effect of qualitative factors in manufacturing competitiveness
CEMAC – Clean Energy Manufacturing Analysis Center 24
Technology Transfer Activities
• Not applicable for this cost analysis

CEMAC – Clean Energy Manufacturing Analysis Center 25
Thank youAhmad Mayyas ([email protected])
www.manufacturingcleanenergy.org

CEMAC – Clean Energy Manufacturing Analysis Center 26
Backup Slides

CEMAC – Clean Energy Manufacturing Analysis Center 27
Approach: Gaseous HRS ComponentsHydrogen Refueling
Station (HRS)
Storage System Dispensing System Electrical System
Compressor
Compression System
Chiller
Pressure Transmitter
Bleed Valves
TubingHydrogen
Filter Fittings
Nozzles (35MPa/70MPa)
Low Pressure Storage
Wiring
Air Operated
Valves
Dispenser (card reader, digital
display, etc. )
Heat Exchanger
IR Flame Detectors
PLC/ Gas Control Cabinet
Air Dryer
Position Switch
Check Valves
Check Valves
Bleed Valves
Air Operated
Valves
Fittings
Tubing
Hydrogen Receiving Port
Compressor
Valves
HosesCascade Storage

CEMAC – Clean Energy Manufacturing Analysis Center 28
Accomplishments: HRS Flow Map
International HRS’s including planned HRS’s be end of 2016
Number of HRS’s; medium to high capacities (>50 kg/day)
CEMAC – Clean Energy Manufacturing Analysis Center 29
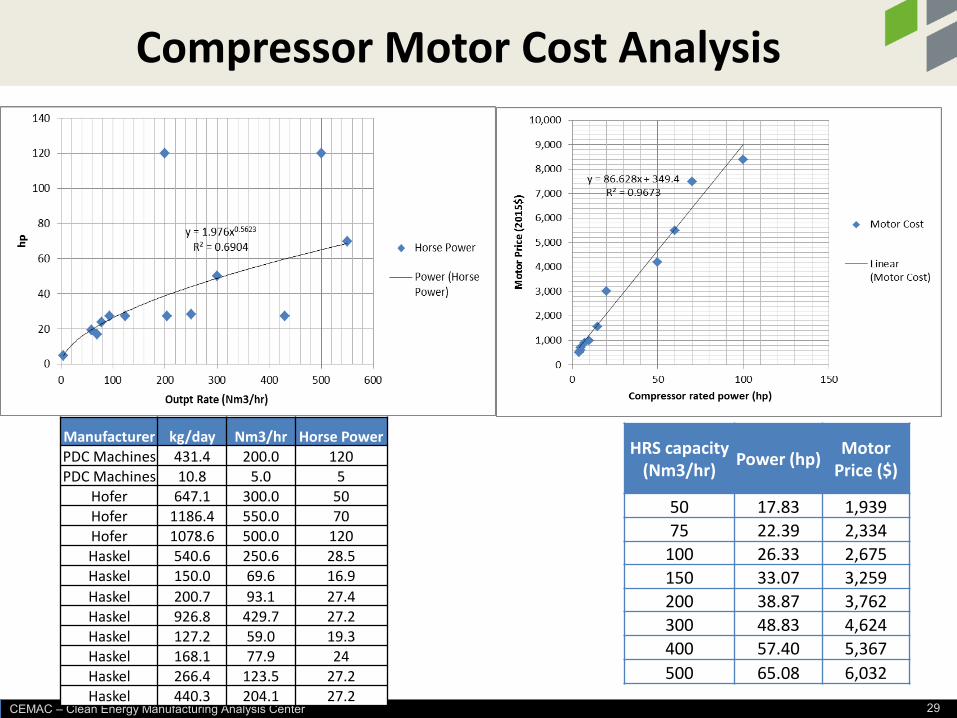
Compressor Motor Cost Analysis
Manufacturer kg/day Nm3/hr Horse PowerPDC Machines 431.4 200.0 120PDC Machines 10.8 5.0 5
Hofer 647.1 300.0 50Hofer 1186.4 550.0 70Hofer 1078.6 500.0 120Haskel 540.6 250.6 28.5Haskel 150.0 69.6 16.9Haskel 200.7 93.1 27.4Haskel 926.8 429.7 27.2Haskel 127.2 59.0 19.3Haskel 168.1 77.9 24Haskel 266.4 123.5 27.2Haskel 440.3 204.1 27.2
HRS capacity (Nm3/hr) Power (hp) Motor
Price ($)
50 17.83 1,93975 22.39 2,334
100 26.33 2,675150 33.07 3,259200 38.87 3,762300 48.83 4,624400 57.40 5,367500 65.08 6,032

CEMAC – Clean Energy Manufacturing Analysis Center 30
Welded Metal H2 Vessels (Type I)Process Flow- Type 1 Steel Tanks
Manufacturing Cost Curve (U.S. Plant) Cost Breakdown
Profit margin=10% of total manufacturing cost

CEMAC – Clean Energy Manufacturing Analysis Center 31
Elements of Manufacturing Analysis
• Innovation potential• Manufacturing experience: Learn
by Doing• Intellectual property• Cost of energy• Cost of manufacturing• Availability of investment capital• Low-cost labor requirements &
availability• Product quality• Skilled labor requirements &
availability• Tax policy• Currency fluctuations
• Import and export policies• Automation/advanced
manufacturing• Raw material availability• Ease of transportation• Existing supply chains• Synergistic industries and
clustering• Existing or growing market• Ease of doing business• Safety• Regulations• Inventory costs and supply chain
delays