manufacturing game - csus.edu · the erp simulation game is an innovative “learning-by-doing”...
TRANSCRIPT

Manufacturing Game
http://erpsim.hec.ca© Léger et al. 2004-2017. ERPsim Lab, HEC Montréal
Pierre-Majorique LÉGER Jacques ROBERT Gilbert BABIN
Powered by ERPsimCompatible with SAP™ ERP ECC. & Business Suite on HANA
Derick LYLERobert PELLERIN Bret WAGNER
2017-2018 EDITION

© Léger et al. (2017) ERPsim Lab, HEC Montréal. All rights reserved, including the right to repro-duce this book or portions thereof in any form. Copying or distributing in print or electronic forms without written permission of HEC Montréal is prohibited. For information contact ERPsim Lab, HEC
Montréal, 3000 Chemin de la Côte Sainte-Catherine, Montréal (Québec), Canada, H3T 2A7.
Please visit http://erpsim.hec.ca for more details.
For academic use only. For information about commercial use, please visit
http://batonsimulations.com/
This book contains references to the products of SAP SE, Dietmar-Hopp-Allee 16, 69190 Walldorf, Germany. The names of these products are registered and/or unregistered trademarks of SAP SE. SAP SE is neither the author nor the publisher of this book and is not responsible for its content.
Made in Canada
ISBN : 978-0-9866653-2-5

Table of ContentIntroduction 7Welcome to Your New Job 10Enterprise Overview 11Muesli Cereals: Products and Composition 11
Suppliers 12Customer Markets 13
Product Recipes 13Marketing 14Product Price 15Product Availability 15Retail Store Types 15
Business Process 17
Physical Layout and Logistics 19Production Lines 20Warehousing and storage costs 21
Finance and Accounting 21Banks 21Company Performance: Profit and Value 22Accounting Policies 22
Management Responsibilities 24Product Mix 24Forecasting and Procurement 24Productivity Decisions 25Pricing 25Marketing 26
The Simulation and Associated Rules 26
Elements of a Winning Strategy 29Manufacturing Scenarios 32Instructional Aids 32Company Performance: Profit and Value 33Credit Ratings 33
Company Valuation 35Extended and Advanced Scenarios 35
Manufacturing Introduction 36Game specifics 37
Round 1 – Sales and Marketing 38Reports 40Pricing 41Marketing 42Planning Ahead 42
Round 2 - Production 42Production Capacity and Setup Time 44Reports 45
Round 3 – Planning and Procurement 46Material Requirements Planning 46Sales Forecasting 46Warehouse Capacity and Storage Costs 47Running Material Requirements Planning 48Reports 50Review and Planning Ahead 50
Conclusion 50
Manufacturing Extended 51Game Specifics 52
Customer Markets 52Product Design and Product Mix 53Finance and Investment 55Production Lot Sizing 59Fixed Costs 59Market Forces 60
Conclusion 60Manufacturing Advanced 61Game Specifics 61
Customer Markets 62Warehouse Capacity and Storage Costs 62Transportation Planning and Shipping Costs 62
Conclusion 64Getting Around in the SAP System 67User Menus 67
Toolbars and Options 68
Selection Screens 69Transactions Used During the Simulation 70Sales and Marketing 71
Change Price List 71Marketing Expense Planning 72Inventory Report 73Summary Sales Order Report 75Detailed Sales Order Report 76Price Market Report 77

Logistics 78Stock Transfer Planning 78
Production 79Convert Production Order from Planned Order 79Production Schedule 80
Planning and Procurement 81Validated Bill of Material Change 81Create Planned Independent Requirements 82MRP Run 83Create Purchase Orders 84Purchase Order Tracking 85
Accounting 86General Ledger Account Posting (Investments, Consulting Expenses and Loans) 86
Financial Statements 87Product Cost Planning 88Liquidity Planning 90
Appendix A 91List of General ledger accounts 91
Afterword by Pierre-Majorique Léger 92

PARTICIPANT’S GUIDE: MANUFACTURING GAME © Léger et al. (2017) ERPsim Lab, HEC Montréal. 7
IntroductionTeaching the concepts underlying an Enterprise Resource Planning (ERP) system is a difficult task. Many students have very little IT experience to which they can relate these concepts. They may have acquired business experience in one or two functional areas, but many of them have only a limited understanding of the operational aspects supporting the value creation process in modern firms. Moreover, they usually have had no firsthand experience with the functional non-integrated software that the ERP system was designed to replace. For these students, the horizontal integration of the firm, one of the greatest benefits of implementing an ERP system, can be very abstract due to their lack of hands-on experience with legacy systems.
Yet business students are very computer-literate these days. Born after the first personal computers came onto the market, many of them have never experienced life without a keyboard or a mouse. Therefore, if they get hands-on experience with an ERP system, undergraduate and graduate students can learn the system and its core concepts very quickly.
The ERP Simulation game is an innovative “learning-by-doing” approach to teaching ERP concepts. During this game, students have to run a business with a real-life ERP (SAP®). Groups of five to six students each operate a firm in a make-to-stock manufac-turing supply chain context, and must interact with suppliers and customers by sending and receiving orders, delivering their products, and completing the whole end-to-end business cycle. A simulation software program automates the sales process such that each firm receives a large number of orders every round of the simulation. Several administrative functions in SAP® are automated too, so that students can focus on making business decisions, rather than mastery of the many transactions of a complex ERP system. Using a mix of the ERP system’s standard transactions and customized reports, students must analyze information and make business decisions to ensure the profitability of their operations. The learning objectives of this game are fivefold: (i) to develop a hands-on understanding of the concepts underlying enterprise systems, (ii) to experience the benefits of enterprise integration firsthand, (iii) to develop technical skills using ERP software, (iv) to learn how to work in a team, and (v) to learn how to develop, execute and refine strategy in a real-time business environment.
CHAPTER 1

PARTICIPANT’S GUIDE: MANUFACTURING GAME © Léger et al. (2017) ERPsim Lab, HEC Montréal. 8
The manufacturing context of the game is designed in many separate parts, scaling in complexity so that separate learning goals can be emphasized and achieved and then all brought together. The 3 scenarios – Introduction, Extended and Advanced scale in level of business difficulty – factors that must be managed in order for firms to be profitable. The simulation software also divides time into a series of rounds, with opportunity for reflection and debrief after each.
The Introduction scenario in particular, exploits the round-by-round nature of the simulation to ease the students into the different aspects of the business process and associated transactions they must learn in order to operate their companies. In Round 1, teams only have to focus on selling their stock of finished product. In Round 2, we add production – teams transform their available stock of raw materials into finished product and keep on selling. Finally, in Round 3, procurement and planning are added, with teams adjusting their sales forecasts, and buying raw materials to keep on producing and selling. By the end of Round 3, teams will have learned the basic operational transactions of the entire manufacturing game.
The Extended scenario adds product design, finance and investment strategy to the scope of the Introduction scenario. The difficulty is also increased with the introduc-tion of multiple customer markets exhibiting variations in behaviour, as well as fluctu-ating raw material prices. The emphasis here is on developing and executing business strategy – the operational process and transactional complexity in the ERP system are relatively unchanged.
The Advanced scenario adds transportation logistics to the scope. Teams need to produce the correct quantities of the desired products and price them correctly, as before, but must now also manage stock levels in regional distribution centers to have the correct quantities of product close to the customers that desire them.
Part I of this book introduces the business context and process of the manufacturing scenarios. It does not discuss these with direct reference to the SAP system, or even specific parameter values of the 3 simulation scenarios. It is meant to be a conceptual overview.
In Part II we discuss the specifics of each of the 3 manufacturing scenarios.
In Part III we cover using the SAP software – how it is used to support the busi-ness decisions and operations of our fictitious manufacturing firm. These include all the transactions covering the full business process, whether they are automated in the simulation or performed by students. The section highlights how all the different elements of the business process are integrated together into the system. The final chapter reviews the decisions required in order to run the company, in context with the ERP system.

http://erpsim.hec.ca© Léger et al. (2017) ERPsim Lab, HEC Montréal.
PART 1
Welcome to Your New Job!
PARTICIPANT’S GUIDE: MANUFACTURING GAME © Léger et al. (2017) ERPsim Lab, HEC Montréal. 10
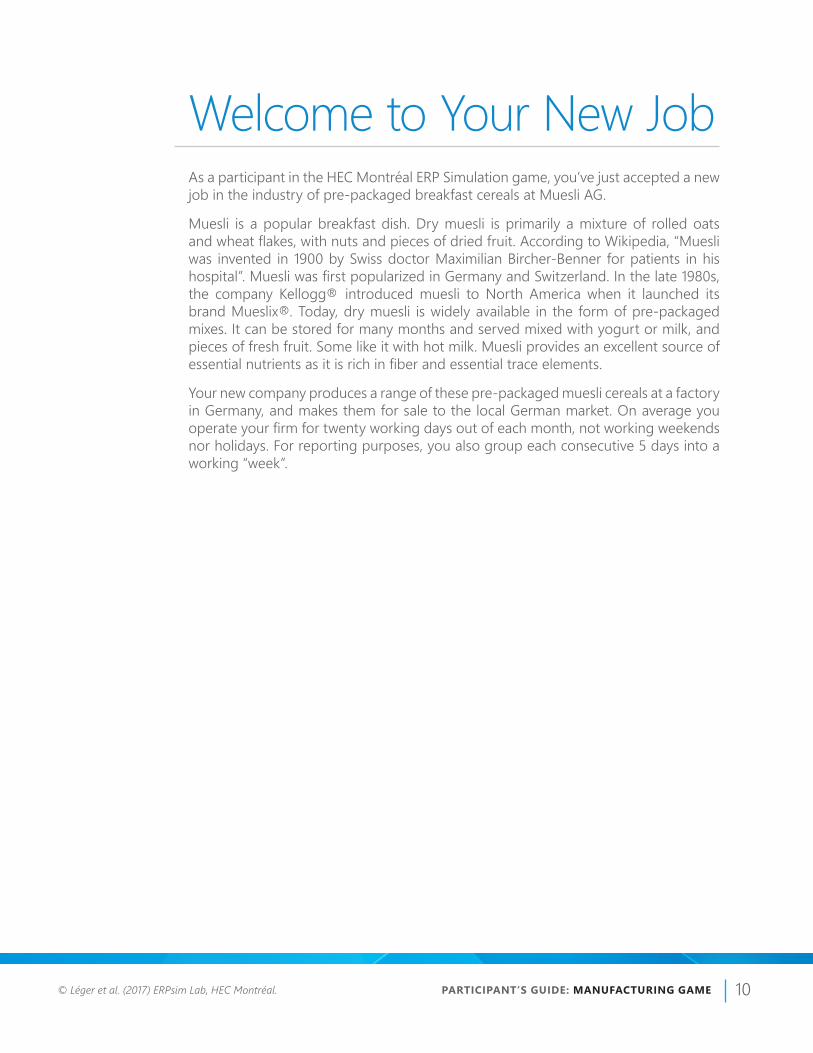
Welcome to Your New JobAs a participant in the HEC Montréal ERP Simulation game, you’ve just accepted a new job in the industry of pre-packaged breakfast cereals at Muesli AG.
Muesli is a popular breakfast dish. Dry muesli is primarily a mixture of rolled oats and wheat flakes, with nuts and pieces of dried fruit. According to Wikipedia, “Muesli was invented in 1900 by Swiss doctor Maximilian Bircher-Benner for patients in his hospital”. Muesli was first popularized in Germany and Switzerland. In the late 1980s, the company Kellogg® introduced muesli to North America when it launched its brand Mueslix®. Today, dry muesli is widely available in the form of pre-packaged mixes. It can be stored for many months and served mixed with yogurt or milk, and pieces of fresh fruit. Some like it with hot milk. Muesli provides an excellent source of essential nutrients as it is rich in fiber and essential trace elements.
Your new company produces a range of these pre-packaged muesli cereals at a factory in Germany, and makes them for sale to the local German market. On average you operate your firm for twenty working days out of each month, not working weekends nor holidays. For reporting purposes, you also group each consecutive 5 days into a working “week”.

PARTICIPANT’S GUIDE: MANUFACTURING GAME © Léger et al. (2017) ERPsim Lab, HEC Montréal. 11
Enterprise OverviewMUESLI CEREALS: PRODUCTS AND COMPOSITIONTo produce a box of muesli cereal, you can use up to six different ingredients: wheat, oats, nuts, raisins, strawberries, and blueberries. It is customary in the muesli industry to classify muesli cereal into six different categories depending on the composition of the product: original, raisin, nut, blueberry, strawberry, and mixed fruit muesli.
The industry is self-regulated by the Muesli Manufacturers Association (MMA) which has developed a set of product categories with recipe regulations (Table 2.1). Since consumers are looking for products with specific ingredients, the regulations require that products are labelled appropriately based on their content. For example, a product referred to as “Blueberry Muesli” may only contain blueberries, wheat and oats and no other ingredients. Products labeled as “Original Muesli” must contain only oats and wheat. Any product containing a mix of all the ingredients must be labeled “Mixed Fruit Muesli” regardless of the proportion of ingredients contained therein. Within each of the labeling categories, there are rules as to the minimum and maximum quantities of each ingredient that is allowed. “Blueberry Muesli” for example, must contain at minimum, 20% blueberries by weight. As a member of the MMA, your firm must follow the MMA labeling regulations.
The MMA has also standardized product sizing, and regulates that products must be sold by weight, not volume, and that only two size variants may be produced and sold: 500 g (small) and 1 kg (large). The two sizes and six flavour categories make for a total of twelve products that can be sold in the market. All muesli cereals must be sold in standardized packaging comprising two components: an inner, sealed plastic bag and an outside cardboard box. Given the two standard sizes, packing components also come in two sizes.
CHAPTER 2
Figure 2.1: Muesli Manufacturers Association Product Categories
Product Design
CUSTOMERS
SUPPLIERSLead time (days) 1-5
Payment time (days) 20
STORAGE CAPACITY AND COSTS
Product type Current spaceCost per
additional 50,000 units*
Finished product 250,000 boxes €500/day
Raw materials 250,000 kg €1 000/day
Packaging(bags and boxes) 750,000 units €100/day
*Billed automatically
FIXED COSTS (€ paid each 5 days)*Direct labor 20 000
Factory overhead 15 000
S, G & A 40 000
Depreciation (Building) 1 250
Depreciation (Equipment) 50 000**
*Billed automatically
Nut$$-F01$$-F11
500g1kg
20% wheat*20% oat*20% nut*1 box / 1 bag*
*minimum
Blueberry$$-F02$$-F12
500g1kg
20% wheat*20% oat*20% blueberry*1 box / 1 bag*
*minimum
Strawberry$$-F03$$-F13
500g1kg
20% wheat*20% oat*20% strawberry*1 box / 1 bag*
*minimum
Raisin$$-F04$$-F14
500g1kg
20% wheat*20% oat*20% raisins*1 box / 1 bag*
*minimum
Original$$-F05$$-F15
500g1kg
20% wheat*30% oat*1 box / 1 bag*
*minimum
Mixed$$-F06$$-F16
500g1kg
20% wheat*20% oat*30% fruits & nuts**1 box / 1 bag*
*minimum**At least some of all fruits/nut
PRODUCTION CAPACITY
Capacity (units/day) 24,000
Additional Capacity (€ per 1,000 units) 1 000 000**
**Investing in additional capacity will increase equipment depreciation costs SETUP TIME
Setup time (hours) Investment (€)
8 -
7 50 000
6 125 000
5 250 000
4 500 000
3 1 250 000
DC10
DC12
DC14
DC 10: HypermarketsPayment Time : 20 Approximate Market Size€90 000 per team per week
DC 12: Grocery ChainsPayment Time : 10-20 Approximate Market Size€220 000 per team per week
DC 14: Independant GrocersPayment Time : 1-20 Approximate Market Size€130 000 per team per week
© Copyright 2004-2017, Léger et al., HEC Montréal.All rights reserved.
Last Update: August 28th 2017

PARTICIPANT’S GUIDE: MANUFACTURING GAME © Léger et al. (2017) ERPsim Lab, HEC Montréal. 12
Table 2.1: Muesli Manufacturing Association Label Regulation
LABEL
REQUIRED INGREDIENTS QUANTITIES
WHEAT OATS NUTS BLUEBERRIES STRAWBERRIES RAISINS
Nuts Min. 20% Min. 20% Min. 20% N/A N/A N/A
Blueberry Min. 20% Min. 20% N/A Min. 20% N/A N/A
Strawberry Min. 20% Min. 20% N/A N/A Min. 20% N/A
Raisin Min. 20% Min. 20% N/A N/A N/A Min. 20%
Original Min. 20% Min. 30% N/A N/A N/A N/A
Mixed Min. 20% Min. 20% Minimum 30% (at least some of all fruit/nut)
SuppliersAll the ingredients going into the production of muesli cereals are produced within highly competitive markets. Wheat, oats, raisins, strawberries, blueberries, and nuts are all commodities whose prices are determined by the Global Commodities Market. Blueberries and strawberries are typically the most expensive ingredients, raisins and nuts less so, while wheat and oats are fairly cheap. Prices of these commodities vary with market conditions, the quality of the harvests and the seasons. Prices for straw-berries and blueberries are particularly seasonal. The prices during the off season periods may be much higher than what they are shortly after the harvest season.
Specialized preparation and distribution of these commodities for the muesli industry in Germany is provided by a single firm: Food Brokers Inc. With only a single supplier of these materials, your firm has little influence on commodity prices. You must simply accept the prices quoted by Food Brokers at any moment.
Similarly, there is only one supplier of the standard size packaging materials to the industry: Continental Printing Co. Prices for cardboard, plastic and printing services are very stable, typically adjusted only once or twice a year.
Even though there are only two suppliers, they are very reliable. Each guarantees delivery of ordered products within 5 days, sometimes even delivering as early as the following day. Both suppliers offer the same payment terms – 20 days after delivery.

PARTICIPANT’S GUIDE: MANUFACTURING GAME © Léger et al. (2017) ERPsim Lab, HEC Montréal. 13
CUSTOMER MARKETSAs a manufacturer, you do not sell directly to the end consumer but rather to a variety of retail stores. Competition and margins in the breakfast cereals market is very tight. While the total demand for ready-to-eat cereal is relatively stable throughout the year the net sale of local brands of muesli cereal was not. Traditional ready-to-eat cereal seems to offer genuine competition to the local muesli brands. Recently, a strike in one of the local muesli plants substantially reduced the supply of muesli cereal. As a result many consumers switched to ready-to-eat cereal, and a significant proportion of these customers have not yet returned to muesli cereal.
There are four key decision areas that each firm can use to influence the sale of their specific muesli cereals – product recipes, marketing, price and product availability.
Product RecipesEach firm can influence the desirability of their products, by adjusting the recipe of each product – the percentage of each ingredient inside each box – in conformance with the MMA regulations. Consumers are willing to pay more for products that contain extra fruits and nuts. However, consumers have recipe preferences affecting the desir-ability of each product. A consumer might prefer strawberries to blueberries, and would therefore prefer to buy products that contain strawberries. Even though a box of Blueberry Muesli might contain extra fruit, and the consumer feel that a premium price for the product is fair because of that, they still may not prefer it if they simply don’t like blueberries. Be aware that a preference for an ingredient doesn’t imply that more is always better. Some consumers like more fruit and nuts in their muesli than others, so in the end, a “perfect” recipe for one consumer may simply be the one that has “just the right amount” of nuts.
Plastic bag
Cardboard box
++
Raisins
Oats
Strawberries
Wheat
Blueberries
Nuts
%
%
%
%
%
%
Figure 2.2: Mixed Muesli Cereals Composition

PARTICIPANT’S GUIDE: MANUFACTURING GAME © Léger et al. (2017) ERPsim Lab, HEC Montréal. 14
Deciding on product recipes is a very strategic decision, and one that should be thought through carefully as part of the strategy of the company as a whole. The MMA has strict guidelines on recipe changes. It is forbidden to sell products from different batches with different recipes at the same time. So while a firm may choose to change the recipe of one of its products, it must be careful not to mix inventory with two different recipes. Muesli AG has adopted a very simple policy to meet this requirement – inventory with the old product recipe must be sold before any produc-tion with a new recipe can begin.
MarketingEach firm can set a daily marketing budget for each product. In the Muesli industry, marketing is persuasive and largely based on direct financial incentives to end consumers. It seeks to convince consumers that your product is the one they should buy, right at the moment that they are making the purchase.
For marketing purposes, the German market is divided into three areas, loosely defined as the “North” (Saxony, Saxony Anhalt, Brandenburg, Berlin, Mecklenburg Western, Schleswig Holstein, Hamburg, Lower Saxony and Bremen), “South” (Bavaria, Baden Wurttemberg, Hesse, and Thuringia) and “West” (North Rhine-West-falia, Rhineland Palatinate, and Saarland). Using local flyers, newspapers or the stores themselves firms can promote specific products. This is particularly effective in the short term, as consumers do not have significant long term brand preferences or loyalty.
You share your marketing budget intent with your customers. Knowing that you are promoting specific products to end consumers will influence their likelihood of buying those products, since they expect consumers to be incentivized to buy them. Since stores know the marketing budgets of all firms, their decision to buy is influenced by the proportion of spending between products. A marketing budget of twice the amount for one product over another has twice the influence on the buy decision for any given store. Be aware that this is also true for two of your own products – marketing for one product in a region may be ineffective if you are spending more on marketing for another product in the same region.
Hesse
West
South
NorthBrandenbourg
MecklenbourgWestern
Saxony
Lower Saxony
SaxonyAnhalt
SchleswigHolstein
Thuringia
RhinelandPalatinate
BadenWurttemberg
Bavaria
Hamburg
Berlin
Saarland
NorthRhine-Westphalia
Bremen
Figure 2.3: The 3 marketing areas for the German market

PARTICIPANT’S GUIDE: MANUFACTURING GAME © Léger et al. (2017) ERPsim Lab, HEC Montréal. 15
Globally, it is like a zero-sum game. If a firm increases advertising for one of its prod-ucts, it attracts consumers away from other products in the same area, including your own.
You do not need to concern yourself with the details of how the various marketing activities are performed. Your role is to set the budget for each product in each region – your marketing department will take care of the rest.
Remember – you sell to retail stores and not directly to consumers. While consumer preferences are important to your customers and will influence their buying decisions, they are not as important as your product price and availability which are the primary factors affecting the buying decisions of retail stores.
Product PriceThe price of your products is very important to your customers. The prices they can charge to end consumers is highly competitive, so your price has a big impact on their sales margins.
Product AvailabilityThe biggest factor that will affect your sales revenue, is product availability. The last thing any retail store wants to have is empty shelves. Even at high prices, retailers would rather pass along the cost to the end consumer than have empty shelves. None of your customers will ever order product from you that is not immediately available for delivery. Ordering different products or from a different firm, even at higher prices, is always the better option than running the risk of empty shelves.
On the one hand, this works to your advantage. Regardless of consumer preferences, your customers will always buy whatever you have available, if they cannot get the desired product elsewhere or for a reasonable price. It is very important to have some-thing for sale at all times, at fair prices.
On the other hand, this is a distinct disadvantage. If your competitors are much better than you at keeping a range of products in stock and always available for sale, they will earn a lot more revenue than you.
Retail Store TypesStores that carry breakfast cereals in Germany can be roughly classified into three types, largely based on their size. Each type of store has similar buying behaviour. The consumers that shop of each type of store also share some characteristics, at least with regard to the purchase and consumption of muesli.
Your firm maintains 3 standard price-lists for all your products, one for each type of store. It will be your responsibility to maintain these 3 price lists. Understanding the importance of various factors affecting the buying decisions of each type of store is essential to pricing effectively.

PARTICIPANT’S GUIDE: MANUFACTURING GAME © Léger et al. (2017) ERPsim Lab, HEC Montréal. 16
GROCERY CHAINS
Grocery stores are the main distribution channel for the muesli industry. Grocery stores offer their customers more variety than the other types of stores. A typical store would carry several different flavours and sizes of muesli on their shelves. If a grocery store is to carry an individual firm’s brand, they will want to buy more than just one type of muesli. Grocery stores typically buy 4 different products at a time from each individual firm. Which firm they buy from depends on the overall “best deal” of 4 products, considering availability, price, recipe and consumer product preferences.
There are currently 59 grocery stores carrying muesli in the local market. Estimated revenues are €220 000 per manufacturing firm per week, approximately 50% of total revenue. Although you offer payment terms of up to 20 days, many groceries stores may pay early, and you can typically expect to see payment for orders within 10 to 20 days of sale.
INDEPENDENT GROCERS
Independent grocers or convenience stores are small proximity stores. They sell a small variety of products: beverages, beer, dairy products, snacks, newspapers and maga-zines, and some everyday non-perishable food products including muesli cereals. Convenience stores have limited shelf space, and will only carry a few types of muesli, whether that be different brands or different flavours. They only carry the 500g size boxes. Given the lack of variety, shelf space, and volume in sales they will want to carry the flavours and recipes preferred by their consumers, and typically place orders for a limited quantity of just one product at time.
Consumers buying muesli at convenience stores are typically not looking for a good price, and so it is much easier for these retailers to pass on any price changes you make. Prices are on average 15% to 20% higher in convenience stores than in tradi-tional grocery stores. However, these consumers are relatively easy to influence with in store promotions (marketing).
There are currently 123 convenience stores carrying muesli in the local market for estimated weekly revenues of around €130 000 per firm, approximately 30% of total revenue. Because their internal process is mainly manual, the time before you receive payment can vary greatly – from cash on delivery (1 day) right up to the full 20 days your payment terms allow.
HYPERMARKETS
Large discount stores or hypermarkets are a growing phenomenon. They not only sell food, they also sell books, CDs, clothing, and electronic appliances. These stores have managed to attract a large number of consumers looking for cheaper prices. Hypermarkets are a high volume, low margin business and are very sensitive to price changes. If a hypermarket is to carry an individual firm’s brand, they will want to buy more than just one type of muesli, typically buying large quantities of 3 different products at a time from each individual firm. They only carry the 1kg boxes, and the products are sold at prices 5% to 10% lower than in traditional grocery stores.

PARTICIPANT’S GUIDE: MANUFACTURING GAME © Léger et al. (2017) ERPsim Lab, HEC Montréal. 17
Currently there are only 12 outlets in the local market, but these account for approxi-mately 20% of total revenues – an estimated €90 000 in revenue per firm per week. Hypermarkets always take full advantage of your payment terms, paying you exactly 20 days after sale.
BUSINESS PROCESSYour muesli company, Muesli AG, is a make-to-stock manufacturer. Given that your customers demand immediate delivery, you can only sell products that are held in inventory, and therefore you must anticipate demand and manufacture in advance. This determines some of the business processes that your company performs.
You and your team will need to forecast the number of products the firm intends to sell in each planning cycle. Based on this forecast, production is planned. Mate-rial requirements are met by purchasing raw materials from the appropriate supplier. Production is done in long batches; several thousand boxes at a time. By the time you have received the raw materials and begun to produce and sell, you will find yourself needing to pay for those materials. It is unlikely that you will have collected enough cash from your sales to customers to cover the payment, so part of your planning needs to consider your cash flow. If you choose to forecast and produce a large number of boxes in long cycles, you will have to ensure you have the necessary cash to fund your operation. There are several other expenses that you will need to pay – salaries and wages, factory overheads such as electricity, and administrative expenses. To be successful you will need to establish a sustainable cycle of procure-ment, production and sales that generates enough cash to cover your fixed costs. In addition, non-cash costs such as depreciation will also affect your bottom line – generating sufficient, sustainable sales revenues is essential to being profitable.
Table 2.2 describes each part of the full business process, organized by functional role. Because this is a small company, your team will have to supervise many of the opera-tions of the company and take an active part in some of the day-to-day processes. This is in addition to the managerial and strategic activities that you will have to undertake – setting the prices and marketing budgets for each product, choosing the recipes for your products, forecasting sales, managing cash flow. Occasionally you will even make investment and financing decisions. This is hard and challenging work but this is why you accepted the job.

PARTICIPANT’S GUIDE: MANUFACTURING GAME © Léger et al. (2017) ERPsim Lab, HEC Montréal. 18
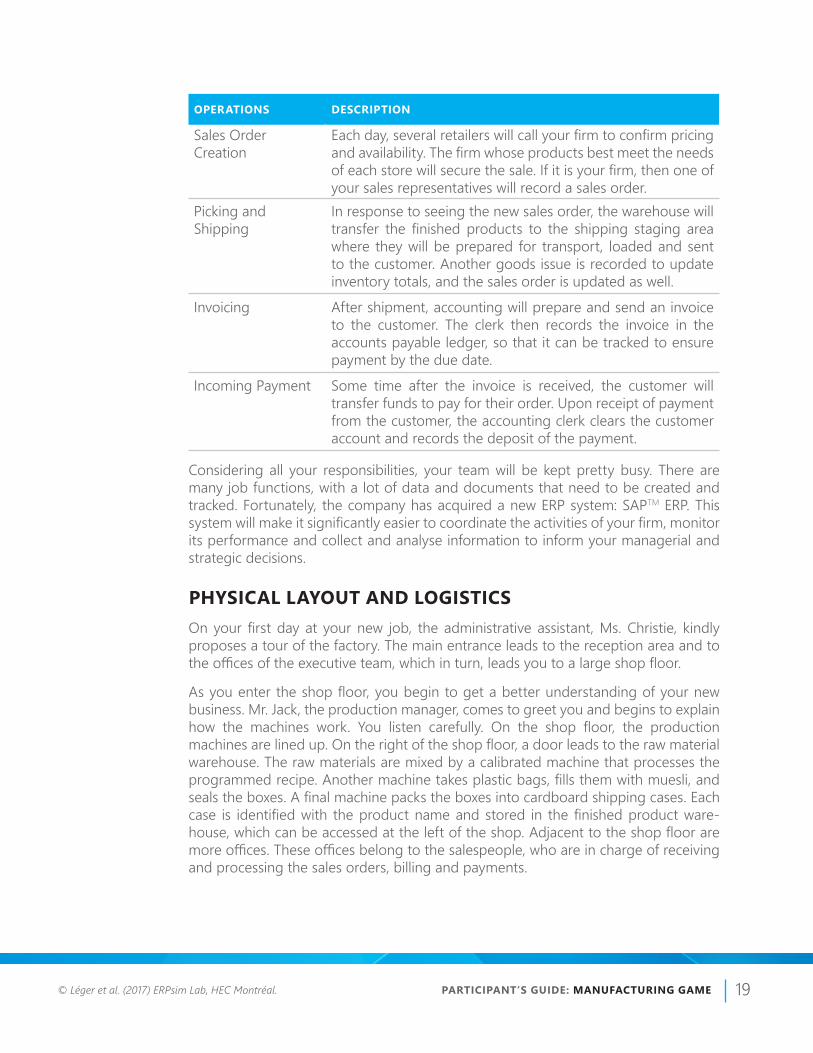
Table 2.2: Operations in the cash-to-cash cycle
OPERATIONS DESCRIPTION
Forecasting All firms in the simulation are using a make-to-stock approach. Therefore, the sales manager needs to forecast demand each period.
Production Planning Based on the forecasted sales units for the next period, the planner then performs materials requirements planning, generating a production plan and a purchasing plan.
Purchase Order Creation
From the purchasing plan, the purchasing manager contacts the suppliers of the products required. A formal purchase order is created and sent to the relevant suppliers.
Goods Receipt Some time after each purchase order is sent, the materials will arrive at the factory. The receiving clerk checks that the goods delivered correspond to the purchase order and records a goods receipt, letting the warehouse know that the items can be put into storage and the rest of the company know that they are available for use.
Invoice Receipt An invoice for the ordered materials is sent to accounting and checked against both the purchase order and the goods receipt by an accounting clerk. The clerk then records the invoice in the accounts payable ledger, so that it can be paid by the due date.
Outgoing Payment Since the goods are payable upon an agreed term of payment, the accounting clerk carries out the transaction required to pay the supplier when it is time. A payment for the amount owed is made to the supplier.
Production Order Creation and Release
Once all raw materials required for production are available, the production plan can be put into action. The production controller reviews the plan, along with other information such as available inventory and decides what quantity of which product will be produced next. They create and release a production order to signal to the factory shop floor what to produce.
Production Execution and Confirmation
The raw materials required for production are transferred from the warehouse to the production line, and a goods issue is recorded to update inventory figures. Once the physical production run is complete, the production order is confirmed and the finished products are transferred from the produc-tion line to the warehouse. Once again to update inventory figures, a goods receipt is recorded. This lets the sales team know that this new inventory is now available for sale.
PARTICIPANT’S GUIDE: MANUFACTURING GAME © Léger et al. (2017) ERPsim Lab, HEC Montréal. 19
OPERATIONS DESCRIPTION
Sales Order Creation
Each day, several retailers will call your firm to confirm pricing and availability. The firm whose products best meet the needs of each store will secure the sale. If it is your firm, then one of your sales representatives will record a sales order.
Picking and Shipping
In response to seeing the new sales order, the warehouse will transfer the finished products to the shipping staging area where they will be prepared for transport, loaded and sent to the customer. Another goods issue is recorded to update inventory totals, and the sales order is updated as well.
Invoicing After shipment, accounting will prepare and send an invoice to the customer. The clerk then records the invoice in the accounts payable ledger, so that it can be tracked to ensure payment by the due date.
Incoming Payment Some time after the invoice is received, the customer will transfer funds to pay for their order. Upon receipt of payment from the customer, the accounting clerk clears the customer account and records the deposit of the payment.
Considering all your responsibilities, your team will be kept pretty busy. There are many job functions, with a lot of data and documents that need to be created and tracked. Fortunately, the company has acquired a new ERP system: SAPTM ERP. This system will make it significantly easier to coordinate the activities of your firm, monitor its performance and collect and analyse information to inform your managerial and strategic decisions.
PHYSICAL LAYOUT AND LOGISTICSOn your first day at your new job, the administrative assistant, Ms. Christie, kindly proposes a tour of the factory. The main entrance leads to the reception area and to the offices of the executive team, which in turn, leads you to a large shop floor.
As you enter the shop floor, you begin to get a better understanding of your new business. Mr. Jack, the production manager, comes to greet you and begins to explain how the machines work. You listen carefully. On the shop floor, the production machines are lined up. On the right of the shop floor, a door leads to the raw material warehouse. The raw materials are mixed by a calibrated machine that processes the programmed recipe. Another machine takes plastic bags, fills them with muesli, and seals the boxes. A final machine packs the boxes into cardboard shipping cases. Each case is identified with the product name and stored in the finished product ware-house, which can be accessed at the left of the shop. Adjacent to the shop floor are more offices. These offices belong to the salespeople, who are in charge of receiving and processing the sales orders, billing and payments.

PARTICIPANT’S GUIDE: MANUFACTURING GAME © Léger et al. (2017) ERPsim Lab, HEC Montréal. 20
Further in the back, you visit the two warehouses. The one at the right is the raw mate-rials warehouse – a specialized facility for storing foodstuffs such as grains, nuts, and dried fruits. It is important that these materials are kept dry, clean and free of vermin. The delivery trucks stop at the reception dock located at the back of the factory, where they unload the raw materials. On the left side is the finished product ware-house. Cases of finished cereal are stored in this warehouse. A smaller space is also set aside for storing the bags and boxes that the mixed muesli cereal is packaged in.
When an order is received from a customer, the salespeople prepare a shipment order and a delivery truck comes to the loading dock to load the cases of finished product.
“Clearly,” Mr. Jack says, “you do not want to have a delivery truck come in when there is no product in stock, so as a rule we never take an order if the desired product is out of stock. It happens from time to time. When it does, we lose a sale. Once, an employee had forgotten to enter the latest production run of finished products in the computer system and we lost a lot of sales, even though we had product for sale. We missed out on a lot of money - the boss was not very happy.”
Production LinesMuesli AG produces muesli on a single production line, and can only make one product at a time. This line can operate 24 hours a day, and the number of boxes that can be made per hour depends on how many machines and which models are installed. The staff working the assembly line will process production orders in the sequence that they were released by the production controller. Whenever a new production order is started for a different product than the one before, the machines must be reconfig-ured and an allergen cleanup is required, which takes several hours.
“I understand that one of the mandates you have been given is to evaluate our installed machinery and equipment” says Mr. Jack. “We can purchase extra processing units, or upgrade existing ones to increase our throughput. The machines are very expensive though. We can also hire consultants to evaluate our workflow and factory layout. They can make recommendations for our work practices and machine place-ment that can improve our efficiency, reducing the number of hours it takes to change over production runs. Before that however, you should consider the length of our production runs. If we don’t make too many products, and run the production lines for several days each time we produce a product, then we will only do changeovers once or twice a week. I’ve been trying to get the sales team to understand this, but they fear losing sales if we don’t have the right products available for sale at any given moment.”
A critical strategic decision is how long to make production campaigns. A campaign corresponds to a series of consecutive production orders of the same product. Long production campaigns will reduce the average setup time (there is no setup time between production orders of the same product). On the other hand, producing in small campaigns will allow a wider offering to the customer but reduce total output
PARTICIPANT’S GUIDE: MANUFACTURING GAME © Léger et al. (2017) ERPsim Lab, HEC Montréal. 21
because of the capacity lost to machine setup. Finding the right balance between small production campaigns that allow you to respond to changing markets and long production campaigns that increase productivity is a key element of the game.
Warehousing and storage costsThe company has two warehouses. The finished products and packaging warehouse is a fairly spacious facility with enough room to store 250,000 boxes of finished product. A smaller space is set aside for packaging materials and has room for 750,000 boxes and 500,000 bags. The other warehouse is the raw food materials warehouse, and it has enough room for 250,000 kg of raw materials.
There are some other warehouses in the area that can also be used to store any excess inventory. Renting short term space is not cheap, but at least it’s better than having to throw excess items away because they cannot be safely protected from weather, thieves and vermin.
HERE IS A TIP: Storage costs can be onerous and quickly drain cash reserves. While it is generally better to keep the production lines going, accumulating a lot of inventory is a sign that your sales strategy needs adjustment. Make sure that you win enough sales to keep these costs under control.
It may be tempting to order a lot of raw materials when prices are low, to improve your profit margins. If you buy too much however, you may lose a lot of the margin gained to storage costs while you wait for the production line to transform those materials into finished product.
FINANCE AND ACCOUNTINGIt may not come as a surprise to you, but your company needs money to make money. You have to purchase and hold inventory of raw materials and produce finished goods ahead of demand. To pay for the raw materials and production you will need cash.
Muesli AG was started by a small group of investors who collectively pooled €20m. The land and the factory was purchased for €2m, and €16m was used to buy and install the current factory machinery and equipment.
BanksThe company has a good relationship with the Weizen Bank. The Bank extends a suffi-ciently large credit line, should you need it to temporarily fund operations or make additional investments in the firm’s capital infrastructure.
Your banker, a smart but rigid fellow named Mathias, does not like amateurs and risk-takers. Your banker will continue to extend you favorable credit only if your company makes interest payments on time. He does not like companies that take too many risks and have excessive unsold merchandise. He dislikes managers that fail to pay bills on time – to their bank or suppliers. But most of all, he dislikes managers that

PARTICIPANT’S GUIDE: MANUFACTURING GAME © Léger et al. (2017) ERPsim Lab, HEC Montréal. 22
do not respect the law or fail to respect elementary ethical rules. He will not hesitate to reduce credit ratings, refuse to increase credit lines or simply recall any debt. As your boss often says: “I have worked hard to build my company’s reputation, do not damage it by bad management.” Your credit line bears a flexible interest rate.
The Weizen Bank has a strict system for assessing the risk of all firms in the industry. The process is fairly simple. Each month, every company must submit their balance sheet to the bank. Amounts owing, such as the balance of the credit line and accounts payable owed to suppliers is compared with liquid assets available, such as cash and accounts receivable yet to be paid by customers, to pay those amounts. If a firm has more liquid assets than debt, it is awarded the best credit rating – AAA+. If a firm has more debt than assets, this is not necessarily a bad thing, but increased debt levels is an indicator of risk, and companies are assigned a credit rating by the bank directly linked to the net amount of monies owing.
The prime interest rate has been relatively stable during the last decade. A sound monetary and fiscal policy has kept inflation down and the interest rates (namely, the business prime rates of the chartered banks) were between 5% – 6%. For most companies what really matters is their credit rating. The difference between a good credit rating and a bad one can lead to as much as a 12-point difference in the interest rate charged by the bank.
Company Performance: Profit and ValueYour credit rating is very important for another reason. The investors use it to measure the performance of the company, and the management team. These shareholders in the company rely on the bank to assess the risk profile of the firm, and by asso-ciation the riskiness of the decisions taken by the management team. Generating a healthy profit is very important, but not if it exposes the company to unnecessary risks. Because the company is privately held, the value of the company is very impor-tant to its shareholders. Two important factors determine the value of the company – its annual profit and its credit rating. The higher the annual profit the higher the value of the company. Conversely, the lower the credit rating, the lower the value of the company.
Accounting PoliciesMuesli AG has fairly simple accounting practices, but adheres to international accounting principles. It uses a perpetual inventory management system for tracking costs, value of inventory on hand, and cost of good sold. This is advantageous because at any given moment, draft financial statements can be retrieved from the system. For preparing annual financial statements for it’s investors, the accounting team will first audit the accounts and then perform various financial year closing procedures to produce the final statements.

PARTICIPANT’S GUIDE: MANUFACTURING GAME © Léger et al. (2017) ERPsim Lab, HEC Montréal. 23
For a perpetual inventory management system to be effective, both the quantity and value of inventory needs to be tracked at all times. Since all movements in and out of the warehouses are recorded with goods receipt and goods issue documents, knowing the quantity on hand of each material is straightforward. Calculating the value of items, is a little more involved.
For raw materials, the value of inventory on hand is determined by the purchase price paid. Every time items are received into the warehouse, the total value on hand is increased by the total amount paid for those items. A new average cost per unit is then calculated: value of stock on hand divided by amount of stock on hand. When items are used by production, the value of stock is reduced based on the average cost: quantity consumed multiplied by current average cost. Only purchases can affect the average cost, and over time, this measure becomes very useful as it captures the moving average of actual costs paid for raw materials.
For finished goods, valuation is more difficult. There is no purchase cost, since the items are produced rather than bought. The accounting department uses a technique called standard costing to determine the unit value of finished goods inventory. The standard cost is calculated by considering the raw material moving average costs and recipes of each individual product. All inventory movements – production confirma-tion and sales – are entered in the system using the standard cost: change in inven-tory value is the standard cost multiplied by the change in quantity. Of course, this implies that the standard cost must be recalculated any time the recipe for a product changes. This is another reason why Muesli AG has adopted the policy to sell all stock of a product before changing its recipe. “There are rules governing inventory revalu-ation” your boss told you, “and there is no need to be changing recipes all the time. Consumer tastes are stable – people don’t suddenly crave an extra scoop of raisins in their bowls one morning.”
The standard cost is very helpful when setting product prices. So long as the sales price is more than the standard cost, you are earning a margin. Of course, the company also has overheads and a marketing budget, and the combined margin of all sales needs to cover those overheads before we make any actual profit. To be profitable you will need good margins and to sell sufficient quantity.
PARTICIPANT’S GUIDE: MANUFACTURING GAME © Léger et al. (2017) ERPsim Lab, HEC Montréal. 24
MANAGEMENT RESPONSIBILITIES
Product MixIn the simulation game, firms can produce up to twelve different products (six types of muesli cereal in two sizes). For each of these products, the firm must specify its recipe (composition).
Each team must define, according to its own strategy, the recipes that it wishes to produce and market. One of the strategic objectives is to try to find niches, i.e. recipes that are unique in the market and which are desired by a sufficiently large number of consumers. Another objective is to appropriately target the various types of stores. One must recall that small boxes are only ordered by convenience stores and grocery chains while large boxes are sold only to hypermarkets and grocery stores. Most importantly, pricing and marketing must be carefully considered, given the different sensitivities of the 3 markets.
Forecasting and ProcurementRecall that you can only sell products that are in inventory. Your executive team will need to forecast the number of units of each product you plan to sell each period. Muesli production is done in batches, but before producing a batch you need to have all of the required raw materials in inventory. Recall that your executive team has many operational responsibilities: you must forecast demand and develop production plans, create purchase orders for raw materials, wait for delivery, and finally release the production orders. Further, purchasing raw materials requires liquidity. If you choose to produce a large number of boxes in advance, you may have to borrow the neces-sary funds from the bank on which you will have to pay interest; and if you exceed your warehouse capacity you will have to pay storage costs while those materials sit unused. All this requires careful planning.
As mentioned previously, the price of some raw materials (in particular, blueberries and strawberries) is highly seasonal. For those products it may be advantageous to buy the raw materials for future production when the price is low. As part of your procurement strategy, you may want to consider not only strategic purchases that minimize procurement costs, but also advance purchases that will allow production of a new order to begin immediately. In other words, you may want to maintain a suffi-cient stock of raw materials so that any of your products can be produced at any time. Planning becomes even more important in these cases.
Also, don’t forget delivery time: It can take up to 5 days to receive raw materials. Make sure you plan early enough and place raw material orders with suppliers – well before you run out of finished products to sell or the raw materials to produce more.

PARTICIPANT’S GUIDE: MANUFACTURING GAME © Léger et al. (2017) ERPsim Lab, HEC Montréal. 25
Productivity DecisionsOnce again, be reminded that sales will not occur unless your product is in stock. This critical constraint to your success cannot be overstressed. Therefore, it is critical that production provides the correct products at the correct time to support your busi-ness strategy. It is critical to size production campaigns so that you have the correct balance between flexibility and production efficiency. It is not very useful to efficiently produce products that no one wants, but it is also not very useful to try to be flex-ible to the point that too much of your production time is spent on changeovers and you have very low quantities available for sale. Of course, it is equally important that your business strategy is consistent with your production capabilities. The number of products you decide to make available to the market has a big impact on finding this balance – the more products you want to sell, the more often you will need to do production changeovers or you will be out of stock of those products for longer periods.
Finally, production throughput may be your strategic weapon. If you think there is untapped demand in the market, you will need to consider investing in your produc-tion facilities by buying additional equipment to increase capacity or hiring consul-tants to improve your efficiency.
PricingA firm may choose to change its selling price whenever it desires. Pricing is a key element of your strategy. If your prices are too high, demand will be low and your production will sit as inventory; if your prices are too low, you will not make enough money to cover your expenses.
Recall that you have three pricing sheets – one for each type of store. Because conve-nience store customers are less price sensitive, it is smart to charge these stores a higher price than traditional grocery stores. Calculating the optimal price for each product and customer type is a complex task. Factor in that the pricing, marketing, recipes and availability of stock for your competitors will impact your sales at all times. Your “optimal” price may well shift over time due to these factors that are outside of your control. Business acumen is required to make the correct pricing decisions, by considering your own situation and learning to detect the trends that indicate your competitors’ situations.
Remember that muesli consumption accounts for a small proportion of ready-to-eat cereal consumption. Consumers have other options. They can buy something else if muesli cereal is out of their price range. Remember also that you have advertising expenditures, interest payments, operating overheads and payments for the raw materials; you must price your products so that you do not lose money. As your boss often says, “We do not run a charity down here.” You must make a profit.
Optimal pricing depends on many things: (i) the prices charged by competitors; (ii) the size and cost of the product; (iii) the customer type; (iv) the level of inventory on hand and (v) ultimately the strategy of the firm including its advertising strategy.

PARTICIPANT’S GUIDE: MANUFACTURING GAME © Léger et al. (2017) ERPsim Lab, HEC Montréal. 26
MarketingYou must decide on how much to invest in marketing. You must determine the daily advertising budget for each of your products (up to 12) and each of the 3 regional areas.
Because the preferences of consumers might differ from one area to the other, it may be optimal to target expenditures differently from one area to the other. The diffi-culty, of course, is to know how much should be spent for marketing each product in each area. The effects of marketing are short term; in the breakfast cereals market there is little brand loyalty among consumers. It is foolish to waste money marketing products that you do not have available. Breakfast cereals are not like consumer elec-tronics – large marketing budgets and limited availability does not inspire people to go hungry and wait in anticipation of your product to hit the shelves.
You may change your daily marketing budget at any time.
HERE IS A TIP: Advertising is good but not always necessary, especially if your product has the desired recipe. It is easy to aggressively overspend on advertising and not see a sufficient return; you will end up losing money. Set yourself a budget based on the expected revenues from your sales forecasts. Monitor your performance and adjust often and according to your situation and strategy.
HERE IS A TIP: Try to avoid spending a lot of advertising money for two different products in the same geographic area. One euro spent on a product hurts the sale of the other and vice versa.
THE SIMULATION AND ASSOCIATED RULESIn this section we will provide several important tips to help you as you start to learn the simulation game. While we’ve attempted to embed the game in a rich context and backstory, and make it sufficiently challenging and fast-paced so that you will not be bored, it is none-the-less a simulation game, and therefore a vast simplification of reality. There are some important characteristics that are specific to the simulation, which may not immediately resonate with your perception of what can or can’t be done in real life.
The rules proposed below have two main objectives. The first and most important one is fairness. The second objective is to make the game challenging and instructive, without being overly complicated.
First, we wish to introduce you to some of the important detail and rules of the game. Second, we will provide strategy tips to additionally prepare you for the simulation.

PARTICIPANT’S GUIDE: MANUFACTURING GAME © Léger et al. (2017) ERPsim Lab, HEC Montréal. 27
You may not change the recipe of a product if you are still carrying more than 1,000 units in inventory
In the simulation game, changing a recipe is equivalent to changing the label on the box. If you change the recipe of a product for which you still have inventory, it is similar to changing the recipe on the labels of those boxes. Effectively you could make one product, and then sell it as if it were another. It is simply not done!
You can only change the quantities of the existing raw materials, not add or remove materials. In other words, you cannot design your own products, such as “Blueberry-Nut Muesli”. Changing the bill of material will revise the standard cost (inventory value per unit) for that product, and revalue any inventory. This rule to prevent recipe changes except when stocks are almost gone, also prevents the revaluation having any significant impact on company financials.
The algorithms in the simulation can lead to small amounts of inventory in stock that can never be sold, even at very low prices. For this reason, the rule allows for recipe changes at low stock, rather than zero.
Interest payment and credit line renegotiation
Interest is accrued daily and will be charged automatically at the end of every week (5 days). Consequently, you will not have to do it during the game.
You should aim to have a positive cash balance at all times during the game. If you don’t, your credit line will automatically be extended to cover any shortfall.
You can repay your credit line with the bank at any time. In principle, as you accu-mulate profits, you should be able to begin paying back any amounts owed and you should not need to borrow additional funds. You can easily do this yourself during the game.
Being able to pay back your credit line also opens the possibility to borrow more. Your instructor will act as the banker, and you should ask them if your “loan request” is approved before making any changes in the system. Your instructor has sole discre-tion to grant or approve your request.
Consumers do not change throughout the game, hence you may learn from their past behaviour
At the beginning of the simulation, the simulator randomly creates a large population of consumers, each endowed with a “preferred recipe”. These preferences influence the orders retailers place with team companies.
As the game progresses, you may infer the “preferences” of these consumers using your transactional data and adapt your plans accordingly. However, stock availability always overrides preferences, so you should keep that in mind when making any analysis.

PARTICIPANT’S GUIDE: MANUFACTURING GAME © Léger et al. (2017) ERPsim Lab, HEC Montréal. 28
The company with the highest company value at the end of the simulation wins the game
We compare the performance of the teams by simply using the company valuation of each company at the end. Company valuation is determined by profit and credit rating.
Be aware that the investments in marketing as well as investments to reduce your production changeover time are recorded as direct expenses. Although they have value in increasing productivity, and potentially sales, their immediate impact on profit is negative.
Investment in machinery and equipment to increase capacity increases the fixed assets of the company. Hence, the impact to profit is only reflected over time in the increase in depreciation. It also decreases the liquid assets of the company, or increases the debt depending on whether financed by cash or extending credit with the bank. This significant commitment of resources with uncertain outcome (sales of extra production at good margins are not guaranteed), represents additional risk to the shareholders. Large investments will immediately reduce credit ratings and therefore company valu-ation. Over time, if the additional production is converted to profitable sales, both profits and liquid assets will rise, increasing the company value.
You must behave ethically at all times
The simulation game is fun when it is played competitively. As in real-life, cheating may prove to be an easy way to get a head start, but it should never be an option. We ask participants of the simulation game to act as they would in real life, with the highest ethical standards. Cheating in this game includes the use of any transaction not explicitly permitted in this book, or by your instructor, and that is used for the sole purpose of increasing the firm’s profit or credit rating, or to bypass time delays such as those with production and supplier delivery.
There are several ways to cheat in this game, but be advised that the ERP system and the simulation software keeps track of all transactions. Your instructor is highly likely to punish those who feel the need to play unfairly!
PARTICIPANT’S GUIDE: MANUFACTURING GAME © Léger et al. (2017) ERPsim Lab, HEC Montréal. 29
ELEMENTS OF A WINNING STRATEGY
Do not run out of stock
One of the most importxzant tips for the game is “do not run out of stock”. Even if you have the best sales strategy, if you do not have products to sell, it will not matter.
This is particularly important at the beginning of the more difficult scenarios of the game, where you start without any products to sell. Before you manage to have finished products in inventory, you must perform a series of tasks. If you are too slow to perform these tasks you will miss lucrative opportunities to sell. You need to learn quickly how to perform the operational transactions to create finished product inven-tories.
One of your objectives should be to hold inventories of a large range of products. To do so is harder than you think. Your popular brand may sell quickly and unexpect-edly; unless you react quickly to this information you may run out of stock before you realize it. There are three actions you can take to avoid running out of stock: reduce demand by increasing the price (short term solution), increase supply by initi-ating production (medium term solution, depending on whether you have the correct raw materials and production plan, and production backlog of other products) and increasing the supply by increasing the forecast for that product (long term solution). Managing inventories of popular brands requires operational excellence and is a key element in a winning strategy.
Delays, production capacities and liquidity constraints are important elements of the game
Delays and capacity constraints are built into the simulation. These features are impor-tant because they limit your ability to react quickly to changes in the marketplace.
To have a product available for the customer, you will have to account for the delay in delivery of raw materials and production capacity limitations. This means that you will need to plan in advance and build and maintain the inventories of raw materials and finished products to sustain your production and sales strategy. However, this will require some liquidity. You must be careful not to buy too much raw material or hold too much finished goods inventory.
The challenge is to be able to find the right balance between low inventory levels and readiness to respond to market demand.
Exploration and exploitation
Beginning the game with a precise strategy is a little presumptuous. You must accept that the simulated marketplace is full of surprises. Learning and adapting should be your motto. Use your data to learn and use the system to adapt to the market.

PARTICIPANT’S GUIDE: MANUFACTURING GAME © Léger et al. (2017) ERPsim Lab, HEC Montréal. 30
Most members of your team have the misfortune of having little experience. Fortu-nately for you, it is the same amongst your competitors. To fully exploit the full poten-tial of your business, you will need to learn more about the market and industry. You should use a strategy of “exploration and exploitation”.
The initial part of the game should be devoted to exploration. You should experi-ment with different recipes and advertising and pricing strategies with the objective of learning more about the market and what works and what does not.
Once you have identified a profitable niche (or niches), you should design your strategy around these niches and exploit and defend them as much as possible. In the face of too much competition, you may have to abandon a previously lucrative niche. Identify a new one before your competitors. It is often easy to follow, but to win you must lead!
Organization may be the most important factor in your team’s success.
A large number of tasks need to be coordinated. Your team needs to (i) keep track of market and sales information, (ii) follow the evolution of stocks of goods and cash, (iii) select the right recipes, (iv) produce goods in a timely fashion, etc. Good team work is essential.
If your team members do not communicate and coordinate their activities, you will undoubtedly fail. You cannot do this if the roles and the information flow within the team is not well adapted to the requirements of this fast-paced game. You are faced with the challenge of organization and must learn how to delegate roles within your team. Finding the perfect division of responsibilities is not as important as identifying and agreeing who will do what, even if chosen arbitrarily. There are many possibilities for innovation that will make your team more efficient. This innovation may ultimately make the difference.
Have fun!
This is only a game! So enjoy being a manager using a real-life ERP system. Ultimately, this is about learning not winning.
The business simulation presented in this book is an obvious simplification of reality. There are numerous elements of running a business that have not been included. Yet the game remains a complex affair. You must be able to extract the information necessary to make timely decisions from a large set of transactional data. You need to operate this virtual enterprise in an accelerated time frame.
We have taken the point of view that if there is no challenge then it’s no fun, and if the simulation is no fun and unchallenging then one does not learn as much. You are asked to run a company at an accelerated pace with a real-life highly complex ERP system. You are bound at one point or another in the game to make errors and find yourself in trouble. Cursing the computer will generally not help. Ask your friends or the instructor for help and keep smiling.
Ultimately, what matters is what you learn from the experience – we hope you learn a lot.

http://erpsim.hec.ca© Léger et al. (2017) ERPsim Lab, HEC Montréal.
PART 2

PARTICIPANT’S GUIDE: MANUFACTURING GAME © Léger et al. (2017) ERPsim Lab, HEC Montréal. 32
Manufacturing ScenariosThe Manufacturing simulation game comes with three scenarios, increasing in the level of difficulty – Introduction, Extended, and Advanced. Many of the concepts intro-duced in Part 1 of this book are explored in further detail in this section, in the context of each scenario.
In this section we begin to refer to the ERP system, SAP ECC, however we will not cover the transactions in detail until Part 3. Many parts of the business process that someone would normally complete in the SAP system, are automated by the simulator. These administrative tasks are not business decisions, so you are free of distraction by not having to worry about completing them.
Note that the chapters in this section assume that your instructor runs the simulation game with the default settings. There are options that allow your instructor to change these settings. Before committing to a strategy or decision in the game, check with your instructor if any settings will be changed that would affect your decisions.
This text assumes that the three scenarios will be played in order. Rather than repeat, a concept is discussed in the scenario where it first appears. If your instructor does not start with the Introduction scenario, you should still review the next chapter as the majority of core elements in the manufacturing simulation are discussed within.
INSTRUCTIONAL AIDSThis text should be used in conjunction with the companion presentation slides and job aids that are provided. Each of the three scenarios have a presentation deck of slides to assist with introducing the concepts and business processes and how to use the associated SAP functionality. Each scenario also has a 2-page job aid that you will find very valuable to remember key information about the scenario, and how to use the SAP software.
Both are available from the ERPsim Learning Portal (website) hosted by HEC Montreal, where you downloaded this book. If you received this book from your instructor directly, and do not yet have access to the ERPsim Learning Portal, ask your instructor if you can get a copy of the job aid or slides to refer to as you read through this book.

PARTICIPANT’S GUIDE: MANUFACTURING GAME © Léger et al. (2017) ERPsim Lab, HEC Montréal. 33
CHAPTER 3
Company Performance: Profit and ValueAll the simulation scenarios use Company Valuation as the metric to measure perfor-mance. This is also used by the simulator to provide a default ranking of all the compa-nies competing against one another in the same simulation. Your instructor may use this in combination with other metrics, or use something else entirely. Verify with them how the performance of each team will be assessed.
In Part 1, we introduced the concept of company value and linked it to profit and credit ratings. We will now go into more detail regarding how credit ratings are determined, and the exact formula for calculating Company Valuation.
CREDIT RATINGSYour company credit rating, as determined by your bank, is entirely based on your balance sheet. The bank is interested in how much you owe to third parties (liabilities), including themselves, and your ability to pay off those debts (assets). The less able you are to pay your debts, and the more debt you have, the lower your credit rating. For Muesli AG, there are only four accounts in the general ledger of accounts that are relevant, as listed in table 3.1.Table 3.1: General ledger accounts for determining credit rating
ACCOUNT NUMBER ACCOUNT NAME CLASSIFICATION
113300 Bank Cash Account Current Assets
140000 Customers – Domestic Receivables Current Assets
160000 Accounts Payable - Domestic Current Liabilities
113101 Bank Loan Current Liabilities
Your net debt is therefore:
(Loan + Payables) – (Cash + Receivables)
PARTICIPANT’S GUIDE: MANUFACTURING GAME © Léger et al. (2017) ERPsim Lab, HEC Montréal. 34
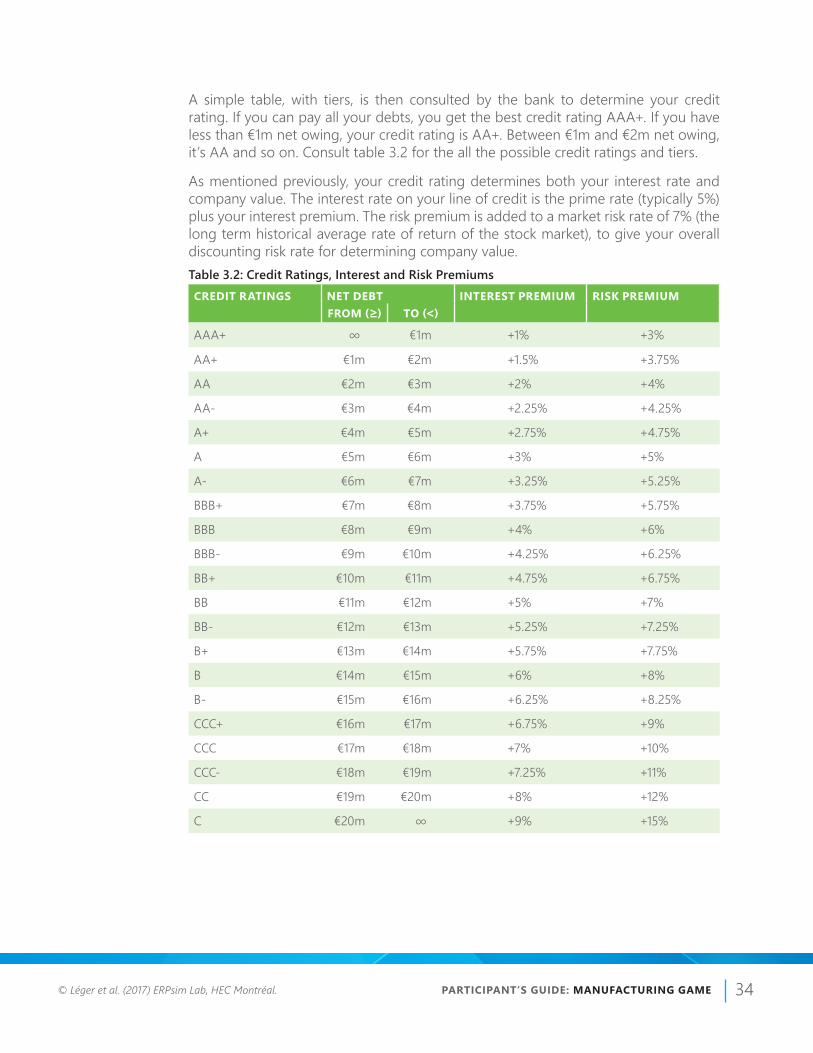
A simple table, with tiers, is then consulted by the bank to determine your credit rating. If you can pay all your debts, you get the best credit rating AAA+. If you have less than €1m net owing, your credit rating is AA+. Between €1m and €2m net owing, it’s AA and so on. Consult table 3.2 for the all the possible credit ratings and tiers.
As mentioned previously, your credit rating determines both your interest rate and company value. The interest rate on your line of credit is the prime rate (typically 5%) plus your interest premium. The risk premium is added to a market risk rate of 7% (the long term historical average rate of return of the stock market), to give your overall discounting risk rate for determining company value.Table 3.2: Credit Ratings, Interest and Risk Premiums CREDIT RATINGS NET DEBT INTEREST PREMIUM RISK PREMIUM
FROM (≥) TO (<)
AAA+ ∞ €1m +1% +3%
AA+ €1m €2m +1.5% +3.75%
AA €2m €3m +2% +4%
AA- €3m €4m +2.25% +4.25%
A+ €4m €5m +2.75% +4.75%
A €5m €6m +3% +5%
A- €6m €7m +3.25% +5.25%
BBB+ €7m €8m +3.75% +5.75%
BBB €8m €9m +4% +6%
BBB- €9m €10m +4.25% +6.25%
BB+ €10m €11m +4.75% +6.75%
BB €11m €12m +5% +7%
BB- €12m €13m +5.25% +7.25%
B+ €13m €14m +5.75% +7.75%
B €14m €15m +6% +8%
B- €15m €16m +6.25% +8.25%
CCC+ €16m €17m +6.75% +9%
CCC €17m €18m +7% +10%
CCC- €18m €19m +7.25% +11%
CC €19m €20m +8% +12%
C €20m ∞ +9% +15%

PARTICIPANT’S GUIDE: MANUFACTURING GAME © Léger et al. (2017) ERPsim Lab, HEC Montréal. 35
COMPANY VALUATIONTo calculate your company valuation, a simple formula is applied:
CompanyValuation=AnnualProfit/DiscountingRiskRate
Finance students may recognize this as the same formula used to calculate the present value of a perpetuity. The implicit assumptions behind the bank using this formula are (i) that your current profit is a predictor of future profit; (ii) the value of your company is the present value of all future profit streams; and (iii) that the more debt (risk) the company has, the more heavily those future profits are discounted to calculate their present value. Keep in mind that the value of the company in this context is the value to its investors, assuming the company is an ongoing concern. This is not to be confused with net worth based on book or market value of assets versus liabilities.
Given that the simulation divides time into rounds, and that we equate 1 round to be roughly 1 month, it is a simple matter to estimate annual profit.
AnnualProfit=(CumulativeNetIncome/RoundsPlayed)*12
Consistent with the current profit as predictor of future profit assumption, the average profit per round you’ve earned so far, multiplied by 12, is your predicted annual profit.
An important aspect of this company valuation mechanism, is that it is stable for non-growing companies. If your business is stable such that your net debt remains in the same tier and your profit per round is also similar, then your company valuation will be comparable round after round. This is very useful in tracking your performance. If your company valuation increases from one round to the next, it is because you made good decisions that either improved profitability (from efficiency or growth) or reduced debt. If your company valuation decreases, it’s because your decisions were probably poor, reducing profitability or increasing risk. Note that it is possible to increase risk by taking on more debt, and making capital investments in order to grow the company. However, the growth your investors are looking for is in profit, not net worth. If you don’t generate sufficient return for the extra risk, the company valuation formula is going to make that very transparent.
Extended and Advanced ScenariosFor the Extended and the Advanced version of the manufacturing game, the Annual profit is adjusted to take into account the non-recurring nature of the Setup-Time reduction (Setup) investments. Please note that (Setup) is a negative value in the following formula.
AnnualProfit=(CumulativeNetIncome-(Setup)/RoundsPlayed)*12+(Setup)

PARTICIPANT’S GUIDE: MANUFACTURING GAME © Léger et al. (2017) ERPsim Lab, HEC Montréal. 36
Manufacturing IntroductionIn this chapter, we introduce a simple game. The objective is to provide a quick hands-on experience of an integrated business process in order to get an overview of both the ERP simulation game and of the SAP system. The goal of the scenario is not to offer long, in depth gameplay, but to get comfortable with the muesli business model, and SAP. Typically, this game is played only once and just for 3 or 4 simulation rounds.
As a make-to-stock manufacturing company, there are a set of processes that must be performed to run your business. There are four main processes that are presented here: (i) the planning process, (ii) the procurement process, (iii) the production process, and (iv) the sales process (See figure 4.1). Each process can be decomposed into trans-actions. In SAP®, a transaction corresponds to an operation that interacts with the centralized data of the ERP system.
Figure 4.1: Manufacturing process
CHAPTER 4
PLANNING PROCESS
SALES PROCESS
DB CRDB CR
PRO
CURE
MEN
T PR
OCE
SS
Cash
DB CRDB CR
Acc. Pay
GR/IR
DB CRDB CR
Acc. Pay
DB CRDB CR
Raw mat. GR/IR
Raw
DB CRDB CR
Cons. Raw materials
Finished Prod.
DB CRDB CR
products Output
DB CR
Inventory Finished
DB CR
change product
Cash
490000_ _ _ _
Acc. Rec.
10000_ _ _ _
Factory OutputProduction
490000_ _ _ _
Investment
490000_ _ _ _
ConsuptionRaw material
9000_ _ _ _
Change: SaleInventory
Domestic$$-01 140000_ _ _ _
$$-01 9000 _ _ _ _ V01 500000 _ _ _ _V02 500000 _ _ _ _
V01 510000 _ _ _ _
Sales Revenue
V02 510000 _ _ _ _
V01 150000 _ _ _ _V02 150000 _ _ _ _
G/L 490000_ _ _ _
10000_ _ _ _
490000_ _ _ _
F-28
Payment
PurchaseRequisition
Planned
(PurReq)
Order(PldOrd)Independant
Requirement(IndReq)
Sales Order(CusOrd)
Delivery(Delvry)
CustomerInvoice
OrderReservation
Supplier
(OrdRes)
Goods
Invoice
Receipt
PurchaseOrder(PO)
ProductionOrder
(PrdOrd)
Goods Issue
DB CRDB CR
Sales
DB CRDB CR
Acc. Rec. revenues
Investments Cash
PRODUCTION PROCESS
PLANNER
PRODUCTION MANAGER
SALES &
MARKETINGMANAGER

PARTICIPANT’S GUIDE: MANUFACTURING GAME © Léger et al. (2017) ERPsim Lab, HEC Montréal. 37
While at first glance it may look quite involved with a lot to learn, the SAP system takes care of many things for you, especially important things like most of the centralized accounting. The simulator also automates many things to create the illusion of time passing and customer and vendor behavior. It also frees you from mechanical tasks that are pretty much just data entry, that don’t require any decision to be made.
So on the one hand, you only have to master a few key decisions, and the associated functions in SAP to make them. On the other hand, your success is very much going to depend on the quality of those decisions. It’s not about who learns to operate the system quickly without error, but rather who is able to leverage the system most intel-ligently.
GAME SPECIFICSTo provide a quick hands-on experience in the introductory game, you will be gradu-ally introduced to each of the business processes – typically over 3 rounds. In Round 1 you will be introduced to the sales process, in Round 2 the production process, followed by planning and procurement in Round 3 (see figure 4.2). This gradual easing into the full business process is designed so as not to overwhelm, adding an extra layer of complexity in each new round. We begin with the sales process, because (i) it is typically the easiest to understand given that most people have at least a basic under-standing of how pricing and marketing affect sales, and (ii) some data on customer demand needs to exist before intelligent decisions about demand forecasting can be made in the planning process.
Figure 4.2: Transactions for each round
MD61Create Planned
Indep. Req.
MD01MRP Run
ME59NAutomatic
Generation of POs
CO41Coll. Conversion of
Planned Orders
VK32Marketing Expense
Planning
ZADSCondition
Maintenance: Change
VK32
(PurReq)Finished Products
Sales and Distribution Only Production, Sales and Distribution
Planning, Purchasing, Production, and Sales and Distribution
Manufacturing Introduction
ROUND 3
ROUND 2ROUND 1
Raw MaterialsPurchase Requisition
Planned Order(PldOrd)
Independent Requirement
(IndReq)
(PldOrd)

PARTICIPANT’S GUIDE: MANUFACTURING GAME © Léger et al. (2017) ERPsim Lab, HEC Montréal. 38
You will concentrate your attention on traditional grocery stores, selling exclusively to them. Table 4.1 has a summary of the characteristics of this market.Table 4.1: Market Characteristics of Traditional Grocery Store Customers
GROCERY STORES
Geographic Distribution 17 stores in the West
19 stores in the North
23 stores in the South
Approximate Market Revenue € 220 000 per manufacturing company per week
Ordering Behavior Buys 4 products at a time
Payment Behavior Between 10 and 20 days after delivery A default recipe for each product with 30% flavor content (10% more than the minimum required by MMA regulations) is set in the system. Standard costs and associated default pricing (cost + markup) are also set in the system. You are not permitted to change recipes for your products in the Introduction scenario.
ROUND 1 – SALES AND MARKETINGTo begin the game, each company has some inventory in stock of both finished goods and raw materials; already paid for. The factory equipment is installed and ready to go, and all staff hired and trained. You will need to pay wages, salaries and oper-ating expenses, but have plenty of cash reserves in the bank to cover these as well as fund your marketing efforts. Table 4.2 has the full breakdown of your company balance sheet (financial situation) at the start of the game. With no debt, you have a AAA+ credit rating, and therefore a discounting risk rate of 10%. You cannot make any finance decisions, so with all companies having the same credit rating, you should place all your attention on maximizing your profit in order to maximize your company value.

PARTICIPANT’S GUIDE: MANUFACTURING GAME © Léger et al. (2017) ERPsim Lab, HEC Montréal. 39
Table 4.2: Balance sheet at the start of Manufacturing Introduction Round 1
Assets
Cash 1,274,844
Receivables 0
Inventory - Raw materials 375,056
Inventory - Finished products 350,100
Land 500,000
Buildings 1,500,000
Machinery and Equipment 16,000,000
Total 20,000,000
Liabilities Bank Loan 0
Accounts Payable 0
Total 0
Equity Common Stock 20,000,000
Total 20,000,000
Table 4.3 breaks down the total amount you will need to pay for operating and other expenses each round – the simulator will automatically charge you for a portion of these every week (5 simulated days).Table 4.3: Fixed costs per round
Cash Costs Direct Labor 40,000
Manufacturing Overhead 30,000
Sales, General and Administration
80,000
Total 150,000
Accounting Costs Depreciation - Building 5,000
Depreciation - Equipment 133,333
Total 138,333
In the first round, the task of each team is to focus on pricing and marketing to sell the existing inventory of finished products. You will start by selling just 8 of the 12 products. Later on, you will have an opportunity to choose your product mix among the full set of 12 products. Refer to Table 4.4 for a summary of the starting inventory, standard cost and default price for each of the 8 products you will be selling.
There is no budget yet set for marketing – you will need to decide how much spend.
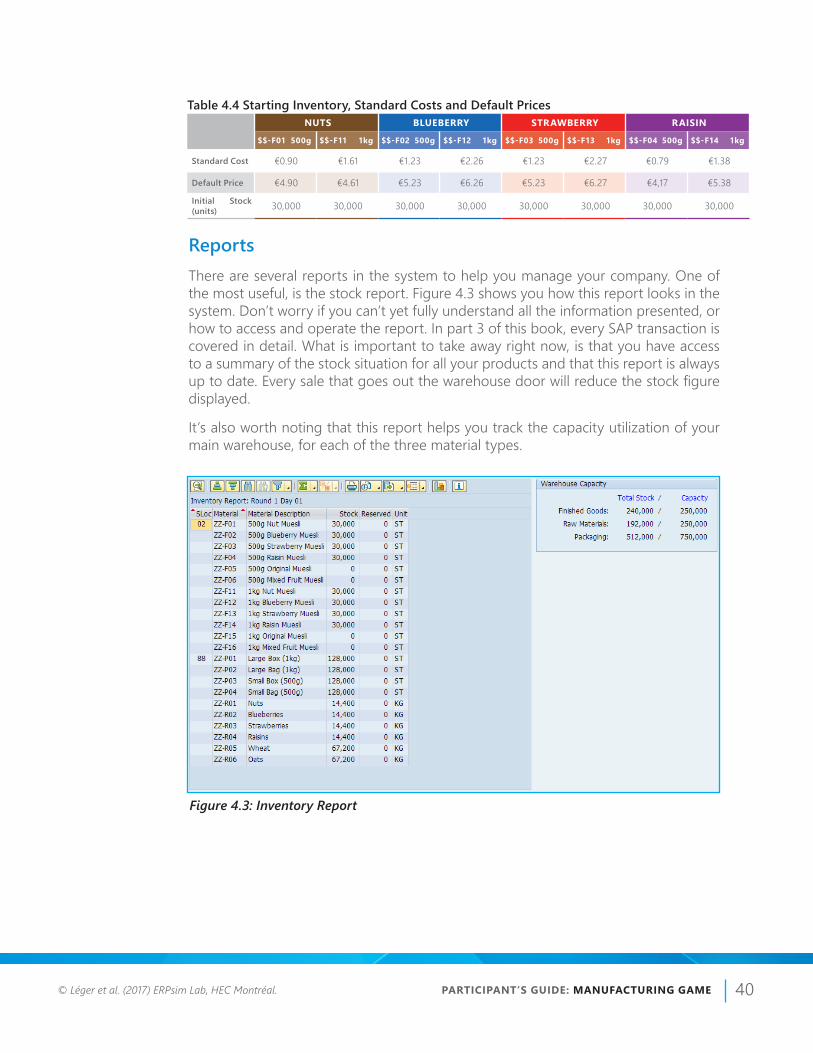
PARTICIPANT’S GUIDE: MANUFACTURING GAME © Léger et al. (2017) ERPsim Lab, HEC Montréal. 40
ReportsThere are several reports in the system to help you manage your company. One of the most useful, is the stock report. Figure 4.3 shows you how this report looks in the system. Don’t worry if you can’t yet fully understand all the information presented, or how to access and operate the report. In part 3 of this book, every SAP transaction is covered in detail. What is important to take away right now, is that you have access to a summary of the stock situation for all your products and that this report is always up to date. Every sale that goes out the warehouse door will reduce the stock figure displayed.
It’s also worth noting that this report helps you track the capacity utilization of your main warehouse, for each of the three material types.
NUTS BLUEBERRY STRAWBERRY RAISIN
$$-F01 500g $$-F11 1kg $$-F02 500g $$-F12 1kg $$-F03 500g $$-F13 1kg $$-F04 500g $$-F14 1kg
Standard Cost €0.90 €1.61 €1.23 €2.26 €1.23 €2.27 €0.79 €1.38
Default Price €4.90 €4.61 €5.23 €6.26 €5.23 €6.27 €4,17 €5.38
Initial Stock (units) 30,000 30,000 30,000 30,000 30,000 30,000 30,000 30,000
Table 4.4 Starting Inventory, Standard Costs and Default Prices
Figure 4.3: Inventory Report

PARTICIPANT’S GUIDE: MANUFACTURING GAME © Léger et al. (2017) ERPsim Lab, HEC Montréal. 41
PricingYou will be responsible for setting the 8 prices for your 8 products, and can change them whenever you like, including changing the default prices prior to the start of Round 1. At minimum, you should price over standard cost. How high you can price you will have to discover – it depends somewhat on consumer preferences and a lot on the pricing policies of your competitors. Keep in mind that your customers want to buy 4 products at a time. You will need to consider your pricing strategy as a whole, rather than for each product in isolation. Pricing some products really high and others really low will probably stall your sales, as a competitor with more even sales prices may be able to offer the total sale at an overall lower cost, despite some of your prices being better than theirs.Getting your first sales orders should prove quite easy, without pricing aggressively. The challenge will actually be in finding the right sales velocity. Too fast, and you will miss out on profit and could be left waiting without anything to sell for several days; too slow and you won’t generate enough revenue and margin to cover your fixed costs (you will have to dip into your cash reserves, and will probably not show a profit).Figure 4.4 shows the price maintenance screen (with default prices) in SAP.
Figure 4.4: Price Condition Maintenance
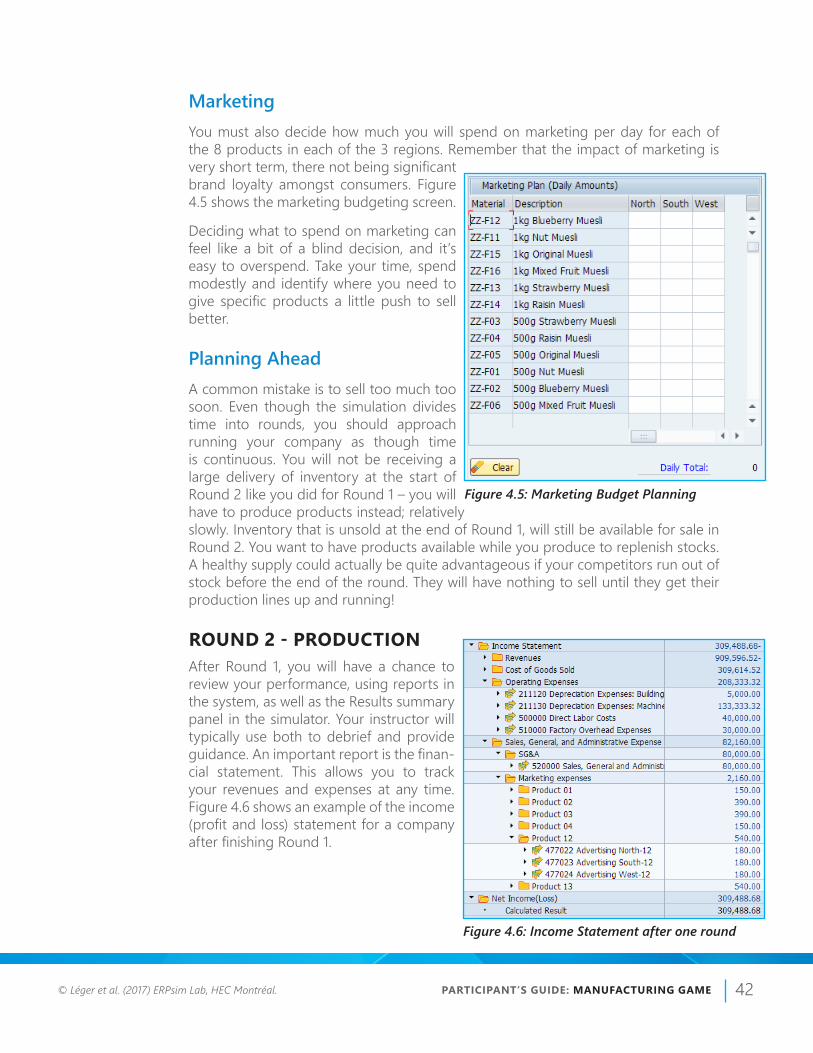
PARTICIPANT’S GUIDE: MANUFACTURING GAME © Léger et al. (2017) ERPsim Lab, HEC Montréal. 42
MarketingYou must also decide how much you will spend on marketing per day for each of the 8 products in each of the 3 regions. Remember that the impact of marketing is very short term, there not being significant brand loyalty amongst consumers. Figure 4.5 shows the marketing budgeting screen.
Deciding what to spend on marketing can feel like a bit of a blind decision, and it’s easy to overspend. Take your time, spend modestly and identify where you need to give specific products a little push to sell better.
Planning AheadA common mistake is to sell too much too soon. Even though the simulation divides time into rounds, you should approach running your company as though time is continuous. You will not be receiving a large delivery of inventory at the start of Round 2 like you did for Round 1 – you will have to produce products instead; relatively slowly. Inventory that is unsold at the end of Round 1, will still be available for sale in Round 2. You want to have products available while you produce to replenish stocks. A healthy supply could actually be quite advantageous if your competitors run out of stock before the end of the round. They will have nothing to sell until they get their production lines up and running!
ROUND 2 - PRODUCTIONAfter Round 1, you will have a chance to review your performance, using reports in the system, as well as the Results summary panel in the simulator. Your instructor will typically use both to debrief and provide guidance. An important report is the finan-cial statement. This allows you to track your revenues and expenses at any time. Figure 4.6 shows an example of the income (profit and loss) statement for a company after finishing Round 1.
Figure 4.5: Marketing Budget Planning
Figure 4.6: Income Statement after one round
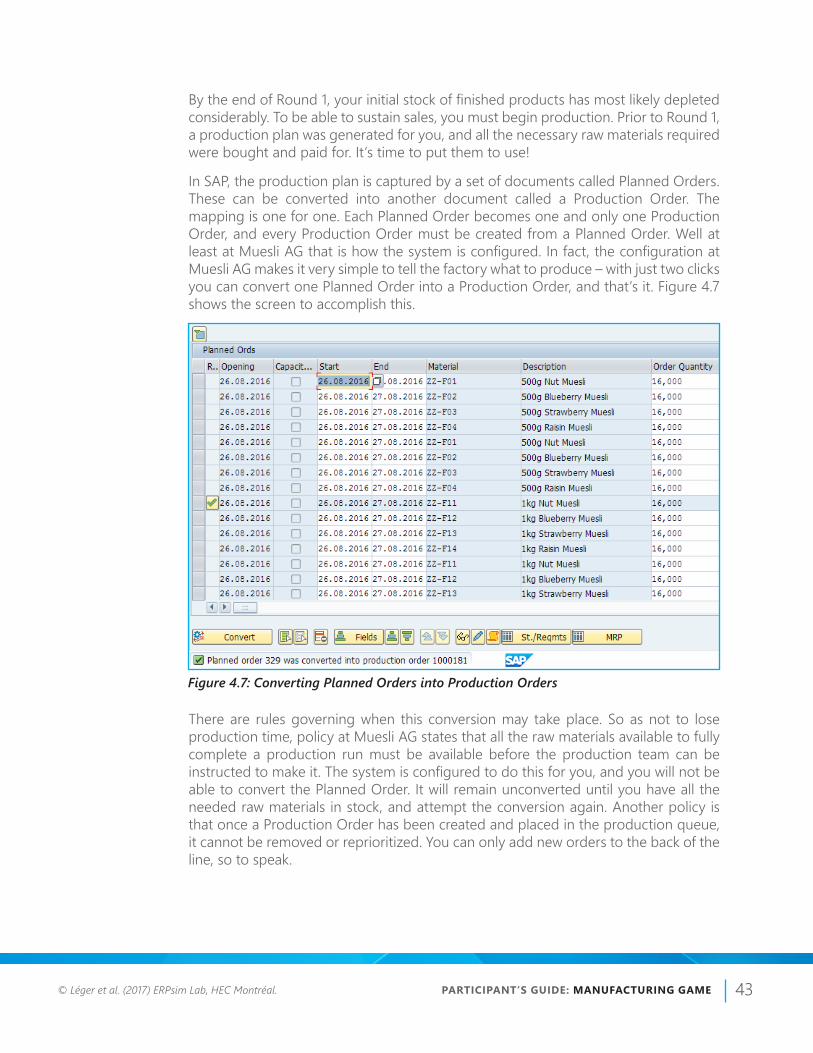
PARTICIPANT’S GUIDE: MANUFACTURING GAME © Léger et al. (2017) ERPsim Lab, HEC Montréal. 43
By the end of Round 1, your initial stock of finished products has most likely depleted considerably. To be able to sustain sales, you must begin production. Prior to Round 1, a production plan was generated for you, and all the necessary raw materials required were bought and paid for. It’s time to put them to use!
In SAP, the production plan is captured by a set of documents called Planned Orders. These can be converted into another document called a Production Order. The mapping is one for one. Each Planned Order becomes one and only one Production Order, and every Production Order must be created from a Planned Order. Well at least at Muesli AG that is how the system is configured. In fact, the configuration at Muesli AG makes it very simple to tell the factory what to produce – with just two clicks you can convert one Planned Order into a Production Order, and that’s it. Figure 4.7 shows the screen to accomplish this.
There are rules governing when this conversion may take place. So as not to lose production time, policy at Muesli AG states that all the raw materials available to fully complete a production run must be available before the production team can be instructed to make it. The system is configured to do this for you, and you will not be able to convert the Planned Order. It will remain unconverted until you have all the needed raw materials in stock, and attempt the conversion again. Another policy is that once a Production Order has been created and placed in the production queue, it cannot be removed or reprioritized. You can only add new orders to the back of the line, so to speak.
Figure 4.7: Converting Planned Orders into Production Orders
PARTICIPANT’S GUIDE: MANUFACTURING GAME © Léger et al. (2017) ERPsim Lab, HEC Montréal. 44
Each Plan or Production Order is for a specific quantity of a single product. It repre-sents a single production run. Several orders for the same product can be grouped together and processed one after another, thereby producing one long production campaign for the same product. This can be advantageous, because as you may recall, switching between products requires setup and cleaning time, and production output is lost.
Production Capacity and Setup TimeSo just how fast does product come off the production line, and how long does it take to setup and clean the machines between production runs of different products? Production capacity – how many boxes of muesli you can produce in a day, depends on what machinery and equipment you have. To keep it simple, the simulator uses a very simple formula to calculate your production capacity.
UnitsProducedperDay=MachineryandEquipment/1,000
If you recall from your balance sheet earlier, you have € 16m invested in machinery and equipment. So your daily production capacity is 16,000 units.
Setup time is constant – switching products takes 8 hours. Effectively, you miss out on 5,333 units of production every time you switch. The boundaries between simulated days are not relevant to production. Daily production capacity is for a continuous 24 hours. If you create a Production Order, and first spend the 8 hours on setup time, the rest of the 16 hours will be spent on production. At the end of the day you will see 10,667 units of new stock available for sale tomorrow. Production of the remaining 5,333 units will take place in the next 8 hours, leaving 16 hours available for something else (10,667 units of the same product, or 8 hours of setup followed by 5,333 units of some other product).
You have 16 Planned Orders in the system, 2 for each of the 8 products. Each one is for exactly 16,000 units – one day’s production. A quick bit of mental arithmetic should tell you that’s only 16 days of production. With 20 days a round, you will be 4 days short, but that is without taking the setup time into consideration. If you switch products every day, you will spend a total of 120 (15 x 8) hours, or 5 days on setup and cleaning. So actually, you won’t be able to finish the entire production plan. To squeeze it all in, you’ll need to double up production runs of at least 3 products.
To maximize your productivity, you’re going to need to look for opportunities where you can produce the same product two days in a row, and delay the production of some other product.

PARTICIPANT’S GUIDE: MANUFACTURING GAME © Léger et al. (2017) ERPsim Lab, HEC Montréal. 45
ReportsYou have reports that can help you. The stock report will be very useful in helping you to prioritize what to produce next. Items out of stock or with low stock should be produced first. Products with a lot of stock still available for sale, can be produced later.
Keeping track of what has been produced, what is being currently produced and what will be produced in future (and precisely when) can easily be tracked with the production schedule report, an example of which can be seen in Figure 4.8.
Review and Planning AheadEven though Round 2 introduces the production process, you still need to manage sales. Use pricing, marketing and production scheduling together to try to rebuild and maintain stocks of all 8 products. It will be even more important to have stock of finished products available for sale at the start of Round 3, since you will probably be out of raw materials having completed all of your production plan, and suppliers can take up to 5 days to deliver!
Figure 4.8: Production schedule report
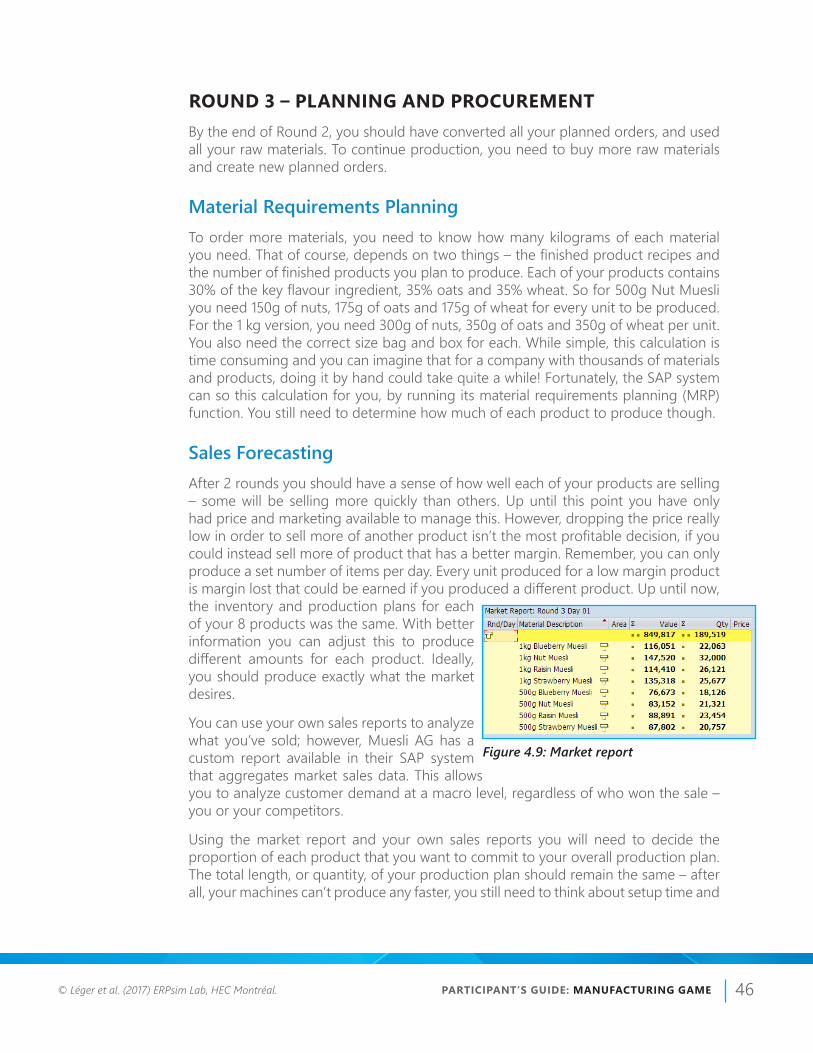
PARTICIPANT’S GUIDE: MANUFACTURING GAME © Léger et al. (2017) ERPsim Lab, HEC Montréal. 46
ROUND 3 – PLANNING AND PROCUREMENTBy the end of Round 2, you should have converted all your planned orders, and used all your raw materials. To continue production, you need to buy more raw materials and create new planned orders.
Material Requirements PlanningTo order more materials, you need to know how many kilograms of each material you need. That of course, depends on two things – the finished product recipes and the number of finished products you plan to produce. Each of your products contains 30% of the key flavour ingredient, 35% oats and 35% wheat. So for 500g Nut Muesli you need 150g of nuts, 175g of oats and 175g of wheat for every unit to be produced. For the 1 kg version, you need 300g of nuts, 350g of oats and 350g of wheat per unit. You also need the correct size bag and box for each. While simple, this calculation is time consuming and you can imagine that for a company with thousands of materials and products, doing it by hand could take quite a while! Fortunately, the SAP system can so this calculation for you, by running its material requirements planning (MRP) function. You still need to determine how much of each product to produce though.
Sales ForecastingAfter 2 rounds you should have a sense of how well each of your products are selling – some will be selling more quickly than others. Up until this point you have only had price and marketing available to manage this. However, dropping the price really low in order to sell more of another product isn’t the most profitable decision, if you could instead sell more of product that has a better margin. Remember, you can only produce a set number of items per day. Every unit produced for a low margin product is margin lost that could be earned if you produced a different product. Up until now, the inventory and production plans for each of your 8 products was the same. With better information you can adjust this to produce different amounts for each product. Ideally, you should produce exactly what the market desires.
You can use your own sales reports to analyze what you’ve sold; however, Muesli AG has a custom report available in their SAP system that aggregates market sales data. This allows you to analyze customer demand at a macro level, regardless of who won the sale – you or your competitors.
Using the market report and your own sales reports you will need to decide the proportion of each product that you want to commit to your overall production plan. The total length, or quantity, of your production plan should remain the same – after all, your machines can’t produce any faster, you still need to think about setup time and
Figure 4.9: Market report

PARTICIPANT’S GUIDE: MANUFACTURING GAME © Léger et al. (2017) ERPsim Lab, HEC Montréal. 47
the number of working days per round remains the same. In round 2 your production plan was for 16 days, with production runs of 1 day each. The system at Muesli AG is configured to always create production runs (a single planned order) of exactly 1 day, so even if you plan for less it is going to round up.
Rather than think about the exact quantity of each product to produce, you may find it simpler to decide how many days’ production to commit to each product – should we forgo one day of production for 500g Blueberry Muesli in order to produce 1kg Nut Muesli for three days? Your sales forecasts can then be entered simply as multiples of your daily production capacity.NEW PRODUCTS AVAILABLE FOR ROUND 3
Before making a final decision however, you have an opportunity to consider. Recall that the MMA regulations regarding categories of muesli, allow for 6 products in 2 sizes. So far, you’ve only been making 4 in 2 sizes. You can now consider all 6.
Original Muesli contains no fruit. There may be consumers out there who don’t like, or like only a little fruit in their muesli. This product might appeal more than what has been available so far. Mixed fruit muesli contains a lot of fruit and nuts, but only 10% by weight of each of those ingredients. This product could appeal to a wide range of consumers. Your production capacity is limited however, and trying to produce too many products requires a lot of switches and setup time reducing your productivity. To make one of the new products means you should drop one of the existing prod-ucts. Keep in mind, that this is a simple introductory game meant for learning, and exploration is a major goal – so don’t overthink it. Also, you do not have to always make both sizes of one flavor.
Warehouse Capacity and Storage CostsOne final thing to consider is your warehouse capacity. You can only fit so much finished product and raw materials in it; anything over and you will have to rent addi-tional space. Table 4.5 summarizes the capacity of your main warehouse for different types of materials, and the cost to rent additional space.Table 4.5 Warehouse capacity and cost
STORAGE CAPACITY AND COSTS
PRODUCT TYPE CURRENT SPACE COST PER ADDITIONAL 50,000 UNITS
Finished product 250,000 boxes €500/day
Raw materials 250,000 kg €1 000/day
Packaging (bags and boxes) 750,000 units €100/day
This is another constraint that you need to keep in mind when making your sales forecast. Not only do you need to consider how long it will take to complete all the production, but also how much space you will need to store all the raw materials that you will need purchase in advance. In general, it’s better to plan more often and avoid
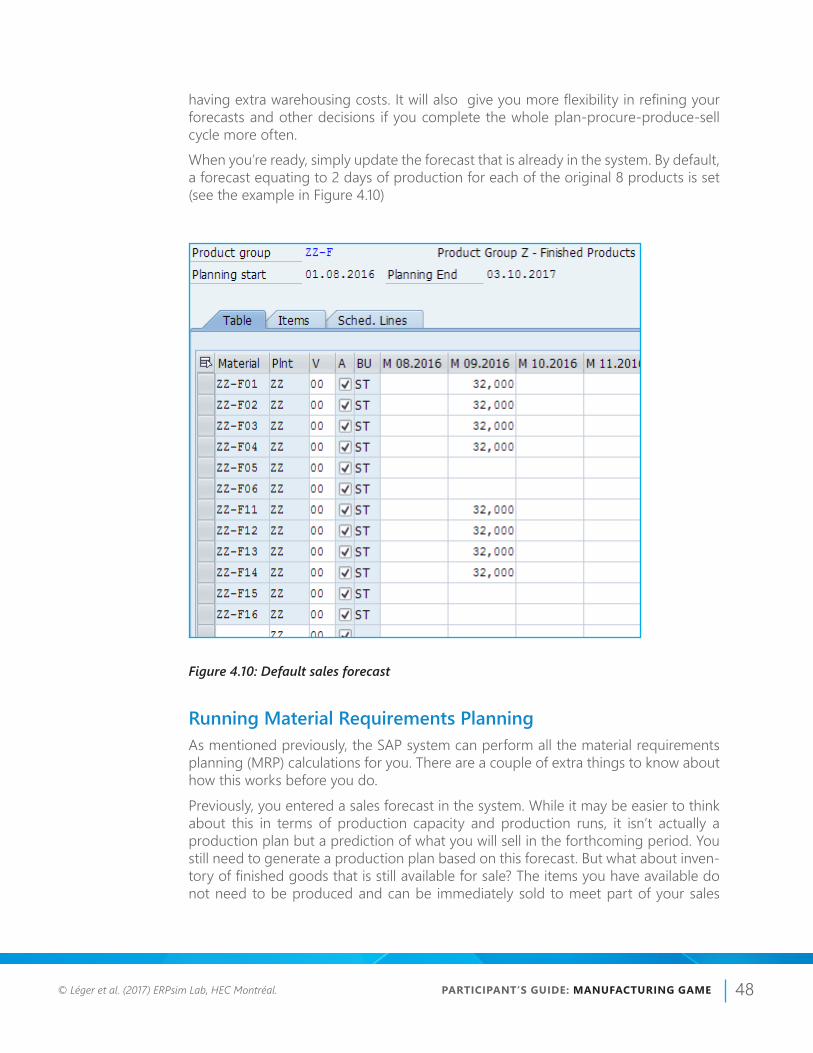
PARTICIPANT’S GUIDE: MANUFACTURING GAME © Léger et al. (2017) ERPsim Lab, HEC Montréal. 48
having extra warehousing costs. It will also give you more flexibility in refining your forecasts and other decisions if you complete the whole plan-procure-produce-sell cycle more often.When you’re ready, simply update the forecast that is already in the system. By default, a forecast equating to 2 days of production for each of the original 8 products is set (see the example in Figure 4.10)
Figure 4.10: Default sales forecast
Running Material Requirements PlanningAs mentioned previously, the SAP system can perform all the material requirements planning (MRP) calculations for you. There are a couple of extra things to know about how this works before you do.Previously, you entered a sales forecast in the system. While it may be easier to think about this in terms of production capacity and production runs, it isn’t actually a production plan but a prediction of what you will sell in the forthcoming period. You still need to generate a production plan based on this forecast. But what about inven-tory of finished goods that is still available for sale? The items you have available do not need to be produced and can be immediately sold to meet part of your sales

PARTICIPANT’S GUIDE: MANUFACTURING GAME © Léger et al. (2017) ERPsim Lab, HEC Montréal. 49
forecast. Similarly, production runs that have been scheduled but are not finished, is product already planned and on the way, so can also be sold to meet part of your sales forecast. The SAP calculations take this into account. To generate your produc-tion plan, it will compare your forecast with your current inventory and incomplete production and only create planned orders where there is a shortfall. Keep in mind that each planned order is for exactly one day of production, so even if you are only 1,000 units short of your forecast, rather than sell less it is better to do another production run for a day. In this way, you plan to always have more than you need, but never excessively – never more than one days’ worth of production for each product.In most large organizations sales forecasting and planning is performed separately from managing suppliers and buying materials. To enable this role specialization and to give flexibility, the SAP system does not place orders with suppliers directly as a result of running the MRP. It will identify the need to purchase materials, a purchasing plan if you will, which much like the production plan needs to be put into action. In many organizations this could be quite involved, possibly requiring quotations from multiple vendors before placing any orders. At Muesli AG, it’s simple, there being only one supplier for each material. You must perform the task of placing orders with suppliers. The MRP will produce a set of purchase requisition documents to let you know which materials and in what quantity you need to buy. Fortunately, there is a function in the system which allows you to place orders in bulk for simple situations like yours, where a single supplier is preselected for purchase. This function will convert the purchase requisition documents to purchase order documents. From there your team will take care of the rest, submitting the order to the suppliers, waiting for the ordered materials to arrive and putting the items away in the warehouse when they do.
The MRP will also generate new planned orders in the system. As soon as the mate-rials have been delivered and put away you will be able to convert them to production orders, just like you did in Round 2.
Your responsibilities now include sales forecasting, running the MRP, creating purchase orders from purchase requisitions (planning and procurement); creating production orders from planned orders (production); pricing and marketing (sales).
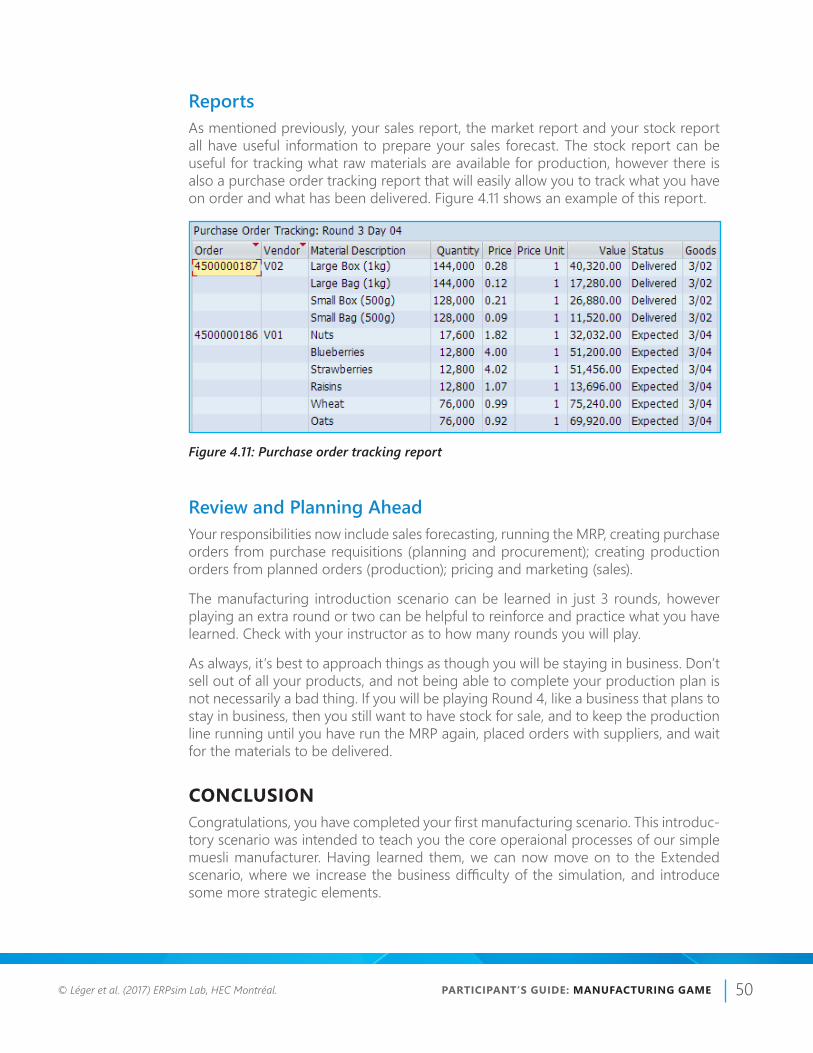
PARTICIPANT’S GUIDE: MANUFACTURING GAME © Léger et al. (2017) ERPsim Lab, HEC Montréal. 50
ReportsAs mentioned previously, your sales report, the market report and your stock report all have useful information to prepare your sales forecast. The stock report can be useful for tracking what raw materials are available for production, however there is also a purchase order tracking report that will easily allow you to track what you have on order and what has been delivered. Figure 4.11 shows an example of this report.
Figure 4.11: Purchase order tracking report
Review and Planning AheadYour responsibilities now include sales forecasting, running the MRP, creating purchase orders from purchase requisitions (planning and procurement); creating production orders from planned orders (production); pricing and marketing (sales).
The manufacturing introduction scenario can be learned in just 3 rounds, however playing an extra round or two can be helpful to reinforce and practice what you have learned. Check with your instructor as to how many rounds you will play.
As always, it’s best to approach things as though you will be staying in business. Don’t sell out of all your products, and not being able to complete your production plan is not necessarily a bad thing. If you will be playing Round 4, like a business that plans to stay in business, then you still want to have stock for sale, and to keep the production line running until you have run the MRP again, placed orders with suppliers, and wait for the materials to be delivered.
CONCLUSIONCongratulations, you have completed your first manufacturing scenario. This introduc-tory scenario was intended to teach you the core operaional processes of our simple muesli manufacturer. Having learned them, we can now move on to the Extended scenario, where we increase the business difficulty of the simulation, and introduce some more strategic elements.
PARTICIPANT’S GUIDE: MANUFACTURING GAME © Léger et al. (2016) ERPsim Lab, HEC Montréal. 51
CHAPTER 5
Manufacturing ExtendedIn this chapter, we extend the concepts introduced with the Manufacturing Introduc-tion. If you will not play the introductory scenario, you should review the previous chapter anyway, as the extended scenario cannot be played without understanding the operational business processes of Muesli AG.The goal of the Extended scenario is to include more strategic business decisions. The key differences from the Introduction scenario are the following:
■ New customer types – All three customer types are in scope. You sell products to all three, and must set pricing policies for each accordingly. Marketing, if you recall, is by geography and to end consumers, so including the extra customers doesn’t directly affect your marketing decisions. However, the effectiveness of marketing is dependent on where consumers shop, so you should consider customer/con-sumer mix in your strategy.
■ Additional production capacity – New customers to serve means more inventory needed. In the Extended scenario you own more machinery and equipment, and therefore have greater production capacity. You can make further investment for additional capacity.
■ Bank loan – In order to purchase more plant and equipment, you took advantage of your line of credit to fund this investment. You can extend and repay the bal-ance on your line of credit at will.
■ Reduction in setup time – You can hire consultants to recommend better work practices and factory layout to reduce the time it takes to switch production from one product to another.
■ Variable production lot sizes – Rather than fix production runs at 1 day, a minimum and maximum run size are configured in the system. The game setup routine will set the minimum to (1 day – setup) and the maximum to (2 days), based on the default production capacity and setup time.
■ Variable raw material prices – Your suppliers update their prices every five days, so you will see seasonal variations as well as adjustments in response to global events - positive and negative. You will need to adopt a strategy to manage cost fluctuations – pass them along by revising prices, accept the fluctuations in your margins, or retime your purchases.

PARTICIPANT’S GUIDE: MANUFACTURING GAME © Léger et al. (2016) ERPsim Lab, HEC Montréal. 52
■ Product mix and product design – You can change the recipes for your products, and have full control over which products you are producing and selling at all times.
■ Empty warehouse – You begin the game with an empty warehouse. You will need to choose an initial sales forecast, buy your first raw materials and spin up the production lines, build your inventory of product and then maintain a sustainable operating cycle. The storage capacity of your warehouse is as it was before, so keep that in mind when deciding your sales forecast.
GAME SPECIFICSThe goal of the Extended scenario, is to reinforce the understanding of the Muesli business process, and expand the range of strategic choices. You could say, that it is the “normal difficulty” level for the manufacturing scenarios. Where you gradually learned the business process “in reverse” during the Introduction scenario, here you must execute it “forward”, from planning through to sales.
Customer MarketsIn this scenario you have full access to all possible customers, from each of the three customer types. Table 5.1 contains the summary of key characteristics of each of the customer types – note that the characteristics for grocery stores have not changed, they are the same customers; however there is some additional information.
In the SAP system, similar customers are organized into groups known as Distribution Channels, or DC for short. Each is identified by a 2-digit number. Recall that you have different pricing sheets for each of the 3 DCs - when maintaining your prices in the system you will need to enter the DC number, in order to maintain the relevant prices for products sold to customers in that DC. Also recall that the different DC customers do not all stock the same size products. Table 5.1: Market Characteristics for All Distribution Channels (DC)HYPERMARKETS (DC 10)
Geographic Distribution 3 stores in the West
2 stores in the North
7 stores in the South
Approximate Market Revenue € 90 000 per manufacturing company per week
Ordering Behavior Buys 3 products at a time
Buys only 1kg products
Payment Behavior 20 days after delivery
Price Sensitivity Very High
Marketing Effectiveness Low

PARTICIPANT’S GUIDE: MANUFACTURING GAME © Léger et al. (2016) ERPsim Lab, HEC Montréal. 53
GROCERY STORES (DC 12)
Geographic Distribution 17 stores in the West
19 stores in the North
23 stores in the South
Approximate Market Revenue € 220 000 per manufacturing company per week
Ordering Behavior Buys 4 products at a time
Buys 500g and 1kg products
Payment Behavior Between 10 and 20 days after delivery
Price Sensitivity High
Marketing Effectiveness Medium
INDEPENDENT GROCERS (DC 14)
Geographic Distribution 40 stores in the West
45 stores in the North
38 stores in the South
Approximate Market Revenue € 130 000 per manufacturing company per week
Ordering Behavior Buys 1 product at a time
Buys only 500g products
Payment Behavior Between 1 and 20 days after delivery
Price Sensitivity Medium
Marketing Effectiveness High
Product Design and Product MixBy default, the 12 products in the system are pre-configured with recipes that typically include 30% by weight of the key flavour ingredient. These are the same as what you sold in the Introduction scenario. You are now allowed to change these, so long as you conform to the regulations of the MMA.
In the SAP system, product recipes are stored in the system as a bill of materials, or BOM for short. Muesli AG has developed a custom transaction to change product recipes, enforcing that all BOM stored in the system conform to the MMA regula-tions. It also prevents making changes to the BOM of any product when that product has more than 1,000 units of unsold inventory in stock. Figure 5.1 shows an example of the BOM maintenance screen, and Figure 5.2 shows an example error message if someone was to save a BOM that does not conform to MMA regulations.

PARTICIPANT’S GUIDE: MANUFACTURING GAME © Léger et al. (2016) ERPsim Lab, HEC Montréal. 54
Figure 5.1: BOM maintenance
Figure 5.2: A non-MMA conforming BOM
The two principle advantages you can gain over your competitors by changing the recipes from the default values are (i) reduce variable cost, and (ii) create products that are more desirable to consumers.Given that you have 12 possible products and 3 different customer types you should give some thought to your product mix strategy. Which customer markets are you going to target? Do they prefer competitively priced products, or are they willing to pay more for something closer to their preferences? Adjust your BOMs, decide which of the 12 products and make your sales forecasts based on your answers to questions such as these.

PARTICIPANT’S GUIDE: MANUFACTURING GAME © Léger et al. (2016) ERPsim Lab, HEC Montréal. 55
Finance and InvestmentYour financial starting situation is quite similar to the Introduction scenario, except for two key differences. The first difference, is that you have borrowed against your credit line to finance the purchase of additional machinery and equipment. The second difference is that you have more starting cash, but no inventory of finished goods or raw materials. Table 5.2 has the breakdown of your balance sheet.Table 5.2 Balance sheet at the start of the Manufacturing Extended scenarioAssets Cash 2,000,000
Receivables 0
Inventory - Raw materials 0
Inventory - Finished products 0
Land 500,000
Buildings 1,500,000
Machinery and Equipment 24,000,000
Total 28,000,000
Liabilities Bank Loan 8,000,000
Accounts Payable 0
Total 8,000,000
Equity Common Stock 20,000,000
Total 20,000,000
You will need to use part of your available cash to make your first purchase of raw materials. How much depends on the cost and quantity of the raw materials needed for each product (your BOM) and your forecast – the bigger your forecast, the more raw materials you will purchase up front, and the more you will need to pay (you might also have to rent additional warehouse space if you exceed the capacity of any of the sections of your warehouse). You will not be able to produce, sell, and collect payment from your customers before you will need to pay your suppliers; so plan your cash outflow wisely. As with the Introduction scenario, you have wage, salary and overhead expenses to pay. In fact, even higher expenses (see the next section), so your cash is needed to fund operations until you start collecting from customers too.
The cash you have is more than enough to cover these costs, and even setting some aside for marketing will still leave you with extra in the bank. Leaving cash sitting in the bank doesn’t earn you anything, since the bank doesn’t pay you interest. Fortunately, there are some available options for you to “put your cash to work” so to speak.

PARTICIPANT’S GUIDE: MANUFACTURING GAME © Léger et al. (2016) ERPsim Lab, HEC Montréal. 56
INCREASE PRODUCTION CAPACITY (BUY MACHINERY AND EQUIPMENT)
You can invest any available cash into purchasing even more machinery and equip-ment, thereby increasing your production capacity. This could be advantageous as you might be able to sell those extra units at a good margin, and get a good return on the investment. In exchange for your cash, you acquire fixed assets. Those assets will be depreciated over time, so the impact to your income statement is incremental and constant over time; hopefully offset by the extra sales revenues you will earn. The relationship between production capacity and machinery and equipment owned is linear, you will recall (refer back to the section discussing Round 2 of the Introduc-tion scenario for specific detail). Whether you already own €10m or €30m, the extra capacity gained by investing another €1m is the same.REDUCE SETUP TIME (PAY FOR LEAN MANUFACTURING CONSULTANTS)
You also have the option to bring in some consultants to improve your work practices or factory layout to reduce the amount of time lost to clean and reconfigure machines between production runs of different products. This will increase your productivity, particularly if your strategy involves selling a lot of different products. Ultimately, you will gain more productive output, and have more units to sell. Efficiency, especially as it relates to eliminating wasted time, isn’t easy to come by, and becomes more and more difficult to gain as you go. Table 5.3 lists the total amount you will need to pay in order to achieve the desired number of hours to perform a production switch.Table 5.3: Setup time and Lean Manufacturing expenditures
SETUP TIME (HOURS) CUMULATIVE INVESTMENT (€) MARGINAL INVESTMENT (€)
8 - -
7 50 000 50 000
6 125 000 75 000
5 250 000 125 000
4 500 000 250 000
3 1 250 000 750 000
You can make incremental payments, each time reducing the hours spent on setup. However, unlike buying machinery and equipment where you own an asset and depre-ciate it over time, you cannot “own” consulting advice – well certainly not that you could resell it! As a result, the accounting treatment for these two methods of improving productive output are quite different. For consulting, it’s an expense on your income statement that immediately impacts your net income! So spend cautiously and be certain that you are going to gain sufficient future revenues and margins in return to offset the deduction from your net income.
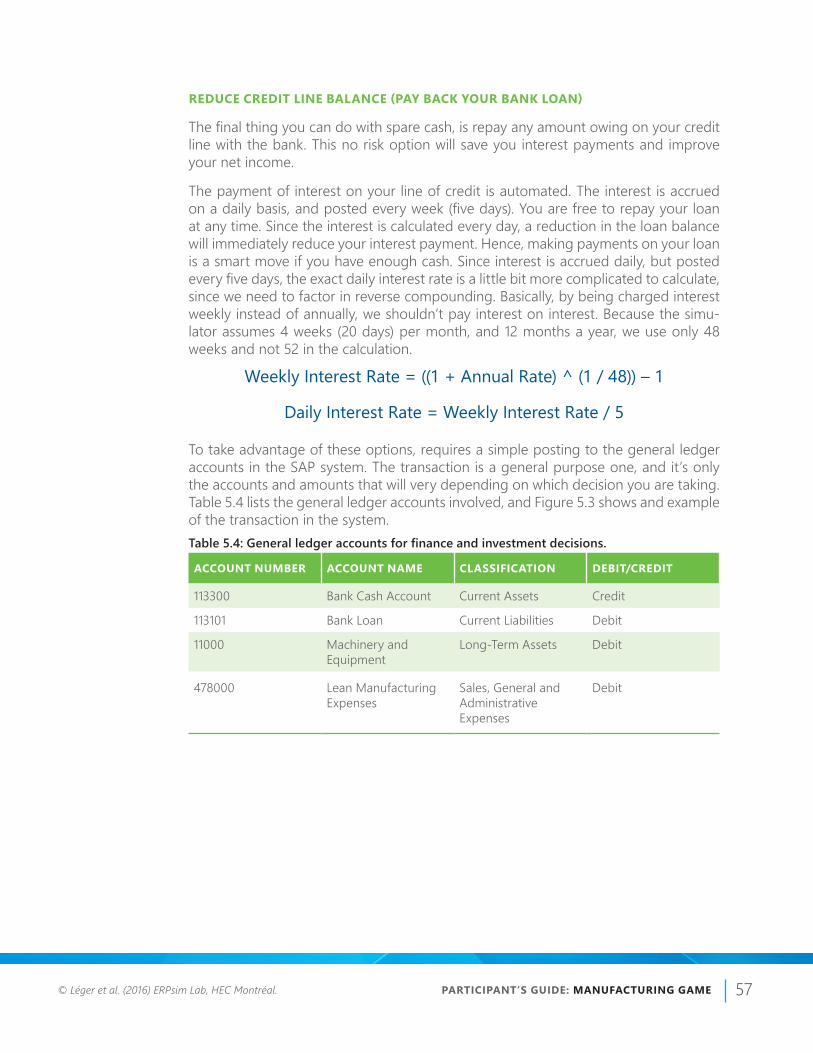
PARTICIPANT’S GUIDE: MANUFACTURING GAME © Léger et al. (2016) ERPsim Lab, HEC Montréal. 57
REDUCE CREDIT LINE BALANCE (PAY BACK YOUR BANK LOAN)
The final thing you can do with spare cash, is repay any amount owing on your credit line with the bank. This no risk option will save you interest payments and improve your net income.
The payment of interest on your line of credit is automated. The interest is accrued on a daily basis, and posted every week (five days). You are free to repay your loan at any time. Since the interest is calculated every day, a reduction in the loan balance will immediately reduce your interest payment. Hence, making payments on your loan is a smart move if you have enough cash. Since interest is accrued daily, but posted every five days, the exact daily interest rate is a little bit more complicated to calculate, since we need to factor in reverse compounding. Basically, by being charged interest weekly instead of annually, we shouldn’t pay interest on interest. Because the simu-lator assumes 4 weeks (20 days) per month, and 12 months a year, we use only 48 weeks and not 52 in the calculation.
WeeklyInterestRate=((1+AnnualRate)^(1/48))–1
DailyInterestRate=WeeklyInterestRate/5
To take advantage of these options, requires a simple posting to the general ledger accounts in the SAP system. The transaction is a general purpose one, and it’s only the accounts and amounts that will very depending on which decision you are taking. Table 5.4 lists the general ledger accounts involved, and Figure 5.3 shows and example of the transaction in the system.Table 5.4: General ledger accounts for finance and investment decisions.
ACCOUNT NUMBER ACCOUNT NAME CLASSIFICATION DEBIT/CREDIT
113300 Bank Cash Account Current Assets Credit
113101 Bank Loan Current Liabilities Debit
11000 Machinery and Equipment
Long-Term Assets Debit
478000 Lean Manufacturing Expenses
Sales, General and Administrative Expenses
Debit
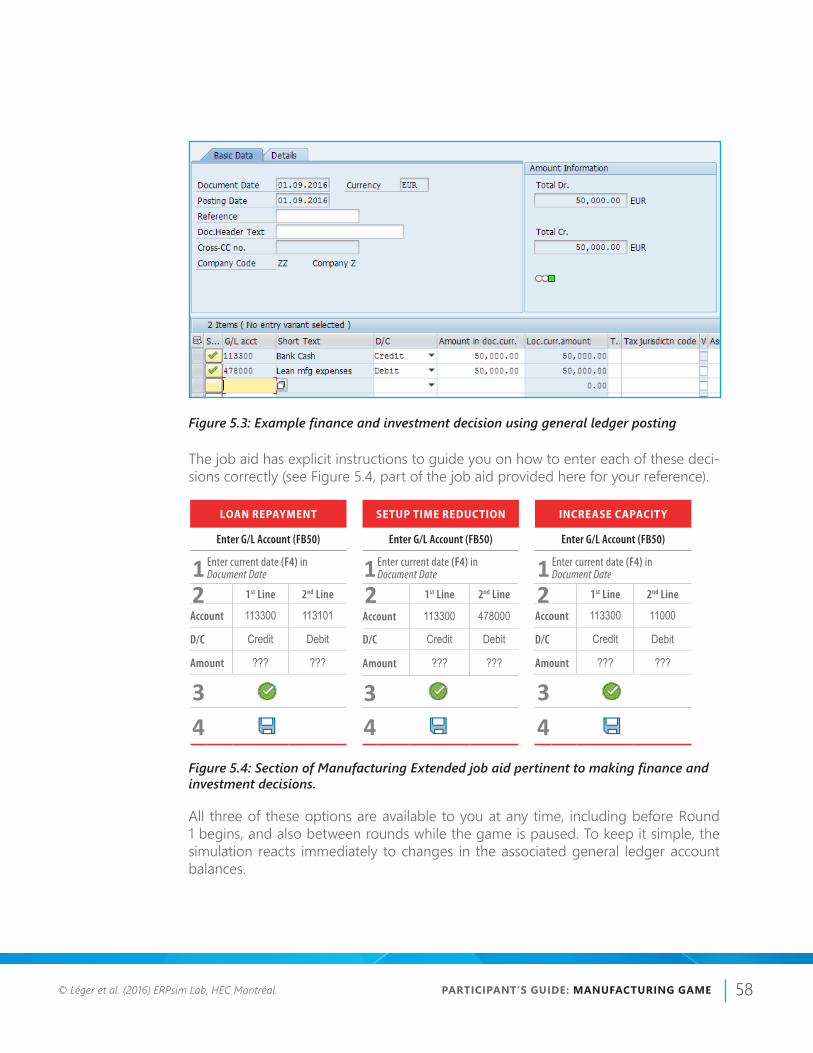
PARTICIPANT’S GUIDE: MANUFACTURING GAME © Léger et al. (2016) ERPsim Lab, HEC Montréal. 58
Figure 5.3: Example finance and investment decision using general ledger posting
The job aid has explicit instructions to guide you on how to enter each of these deci-sions correctly (see Figure 5.4, part of the job aid provided here for your reference).
CHANGE PRODUCT DESIGN
Modify BOM (ZCS02)
1 In Material, enter the productto redesign : $$-F##
23 Change quantities
4
? If prompted the “incorrect recipe“ message, click on to modify it
LOAN REPAYMENT
Enter G/L Account (FB50)
1 Enter current date (F4) in Document Date
2 1st Line 2nd Line
Account 113300 113101
D/C Credit Debit
Amount ??? ???
34
SETUP TIME REDUCTION
Enter G/L Account (FB50)
1Enter current date (F4) in Document Date
2 1st Line 2nd Line
Account 113300 478000
D/C Credit Debit
Amount ??? ???
34
INCREASE CAPACITY
Enter G/L Account (FB50)
1 Enter current date (F4) in Document Date
2 1st Line 2nd Line
Account 113300 11000
D/C Credit Debit
Amount ??? ???
34
FORECAST SALES
Create Planned Indep. Req. (MD61)
1 Select Product group, then enter : $$-F
23 Enter forecasted quantities
in the 2nd date column
4? The quantity corresponds to
the replenishment level
CALCULATE REQUIREMENTS
MRP Run (MD01)
1
2 Click once again on Enter
3 In the pop-up window, click
PURCHASING
Automatic Gen. of POs (ME59N)
1
2 Purchase orders are created
? If no open requisitions : No suitable requisitions found.
RELEASE PRODUCTION
Coll. Conversion of Pld Orders (CO41)
1? If no planned order: Planned
order could not be selected
2 Select orders
3 Click on Convert. Messageconfirms the conversion.
? If conversion fails,click on to see log
MARKETING EXPENSE
Marketing Expense Planning (ZADS)
1Enter the daily amount ofmarketing for each productand each area.
2 To apply your marketing expense plan
CHANGE PRICE
Condition Maintenance: Change (VK32)
1 Open prices folder and double click on Price list
2 In Distribution channel, enter 10, 12 or 14
34 Enter your prices
5
FINANCIAL STATEMENT
Financial Statements (F.01)
1 In company code, enter your company code ($$)
2 Select ALV Tree control (optional)
3Liquidity Planning (ZFF7B)
Displays an estimate of your cashflow for the coming weeks.
STOCK LEVELS
Inventory Report (ZMB52)
Shows all stock levels
PO TRACKING
Purchase Order Tracking (ZME2N)
Shows for each purchaseorder, the issue , arrival andpayment dates.
Vendor Pricing (ZME13)
Shows material prices for each vendor.
PRODUCTION SCHEDULE
Production Schedule (ZCOOIS)
Shows released production orders, past and future. For each order the time released, started and finished (or to start and finish if incomplete).Target Qty > Conf. Qtymeans still pending.
PRODUCTION COST
Product Cost Analysis (ZCK11)
For each product, it showsvariable and fixed costs.
SALES AND MARKET DATA
Sales Order Report (ZVA05)
Shows sales transactions:time, sales revenues, boxessold and price per box.
Summary Sales Report (ZVC2)
Aggregates the daily sales orders by product.
Price Market Report (ZMARKET)
Shows market sales forlagging 5 days - revenues,units, and average price.
Manufacturing Extended Game
User:
Password:
to
ERPSIM
$9$1© Copyright 2004-2017, Léger et al., HEC Montréal.All rights reserved.
Last Update: August 28th 2017
Figure 5.4: Section of Manufacturing Extended job aid pertinent to making finance and investment decisions.
All three of these options are available to you at any time, including before Round 1 begins, and also between rounds while the game is paused. To keep it simple, the simulation reacts immediately to changes in the associated general ledger account balances.
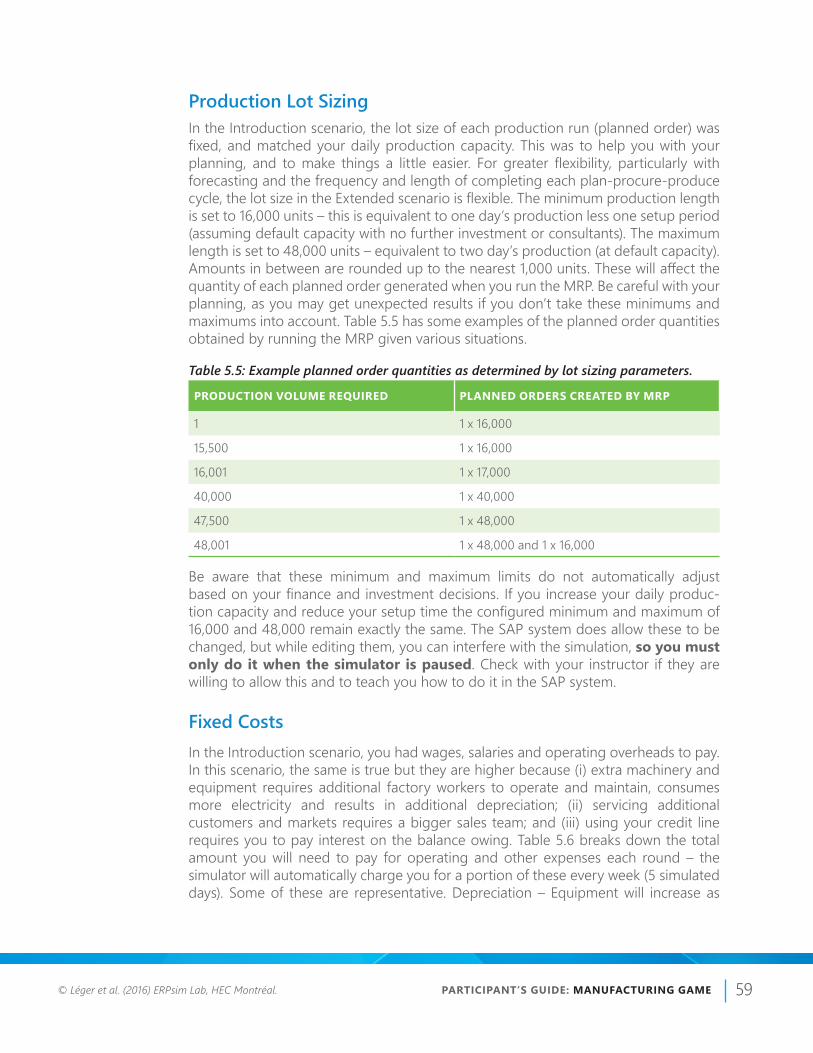
PARTICIPANT’S GUIDE: MANUFACTURING GAME © Léger et al. (2016) ERPsim Lab, HEC Montréal. 59
Production Lot SizingIn the Introduction scenario, the lot size of each production run (planned order) was fixed, and matched your daily production capacity. This was to help you with your planning, and to make things a little easier. For greater flexibility, particularly with forecasting and the frequency and length of completing each plan-procure-produce cycle, the lot size in the Extended scenario is flexible. The minimum production length is set to 16,000 units – this is equivalent to one day’s production less one setup period (assuming default capacity with no further investment or consultants). The maximum length is set to 48,000 units – equivalent to two day’s production (at default capacity). Amounts in between are rounded up to the nearest 1,000 units. These will affect the quantity of each planned order generated when you run the MRP. Be careful with your planning, as you may get unexpected results if you don’t take these minimums and maximums into account. Table 5.5 has some examples of the planned order quantities obtained by running the MRP given various situations.
Table 5.5: Example planned order quantities as determined by lot sizing parameters.
PRODUCTION VOLUME REQUIRED PLANNED ORDERS CREATED BY MRP
1 1 x 16,000
15,500 1 x 16,000
16,001 1 x 17,000
40,000 1 x 40,000
47,500 1 x 48,000
48,001 1 x 48,000 and 1 x 16,000
Be aware that these minimum and maximum limits do not automatically adjust based on your finance and investment decisions. If you increase your daily produc-tion capacity and reduce your setup time the configured minimum and maximum of 16,000 and 48,000 remain exactly the same. The SAP system does allow these to be changed, but while editing them, you can interfere with the simulation, so you must only do it when the simulator is paused. Check with your instructor if they are willing to allow this and to teach you how to do it in the SAP system.
Fixed CostsIn the Introduction scenario, you had wages, salaries and operating overheads to pay. In this scenario, the same is true but they are higher because (i) extra machinery and equipment requires additional factory workers to operate and maintain, consumes more electricity and results in additional depreciation; (ii) servicing additional customers and markets requires a bigger sales team; and (iii) using your credit line requires you to pay interest on the balance owing. Table 5.6 breaks down the total amount you will need to pay for operating and other expenses each round – the simulator will automatically charge you for a portion of these every week (5 simulated days). Some of these are representative. Depreciation – Equipment will increase as

PARTICIPANT’S GUIDE: MANUFACTURING GAME © Léger et al. (2016) ERPsim Lab, HEC Montréal. 60
you invest in additional Machinery and Equipment. The interest on the balance of your credit line will vary depending on the amount you owe and your interest rate (depending on your credit rating and the prime rate). Table 5.6: Representative fixed costs per roundCash Costs Direct Labor 80,000
Manufacturing Overhead 60,000
Sales, General and Administration 80,000
Loan Interest 60,000
Total 280,000
Accounting Costs Depreciation – Building 5,000
Depreciation – Equipment 200,000
Total 205,000
Market ForcesIn the Extended scenario you will not have it quite so easy, with global market forces affecting you. Primarily, the global market for raw materials will fluctuate, resulting in supplier prices changing every few days. Keep an eye on your costs, and do not assume that the analysis you did at the start of the game is still valid. Your margins will be affected every time you complete the planning and procurement cycle.
The financial markets are traditionally stable, however the central bank may change the prime rate from time to time, so factor that in when considering decisions that can affect your loans and credit rating.
CONCLUSIONThe Extended scenario adds a fair degree of challenge above what is encountered in the Introduction scenario. The Introduction is intended to be played once, to get familiar with the business processes and context of Muesli AG and the SAP system. The Extended scenario can be played many times, each time starting from the begin-ning to explore different strategies and to learn from mistakes. We recommend a few short (1-3 rounds) games for orientation and practice before a final long game (up to 12 rounds) to let strategies play out and then debrief on final performance. If you do get to play multiple times, use it to your advantage to try different things and learn from the experience. Remember, as much as it feels good to win, we can all become a little too focused on just that and forget to have fun and learn anything!

PARTICIPANT’S GUIDE: MANUFACTURING GAME © Léger et al. (2017) ERPsim Lab, HEC Montréal. 61
CHAPTER 6
Manufacturing AdvancedIn this chapter, we further extend the concepts introduced with the Manufacturing Introduction and expanded with the Manufacturing Extended. If you will not play the introductory or extended scenarios, you should review the previous chapters anyway, as the Advanced scenario cannot be played without understanding the operational business processes of Muesli AG and the strategy elements related to product design, finance and investment.
The goal of the Advanced scenario is to include elements of inventory management and transportation logistics. The key differences from the Extended scenario are the following:
■ Regional distribution centers – To service order deliveries to your customers, you no longer ship from your main warehouse, but rather three regional distribution centers. Each of these is located in the North, South and West, the same geo-graphic partitioning you are already familiar with from managing your marketing budgets. You do not own these facilities, and must pay to rent space.
■ Transportation – To replenish stocks at your regional distribution centers, you must transport finished product from your main warehouse to the regional distribution centers. The trucks can only transport goods one way, from main warehouse to region – you cannot ship items back to the main warehouse, nor from one region to another. It is your responsibility to determine how many units to send and how frequently the trucks will make the trip. Each time you send a truck to one of the regions, you must pay for shipping.
GAME SPECIFICSThe goal of the Advanced scenario is to add an optimization problem for analysis. It is the most challenging of the three scenarios and not recommended for play without completing the Introduction and/or Extended scenarios, and preferably the Extended scenario more than once.
The nature of the optimization problem is as follows. Every time you send a truck, it will cost you. Every day that you have inventory sitting in a regional warehouse, it will cost you. If you don’t have the right inventory in the right place at the right time, it will also cost you – not directly as an expense, but in terms of lost revenue and margins. As you should appreciate by now, a core aspect of the manufacturing scenarios is to avoid stocking out of finished product. The three regional distribution centers increase

PARTICIPANT’S GUIDE: MANUFACTURING GAME © Léger et al. (2017) ERPsim Lab, HEC Montréal. 62
the likelihood of stocking out, since you could have stock available for sale in one region where it goes unsold, and run out in another region – missed opportunity. Reducing the chance of stock outs requires to either send more product, increasing storage costs; and/or sending trucks more often, increasing transportation costs. The goal is to determine a schedule of resupply that minimizes the sum of these three costs.
The task is made more complex by the fact that consumers in the three regions do not all prefer the same products and recipes.
Customer MarketsYou may have noticed by now, particularly as you explored how to get the most return for your marketing expenditures, that the 12 different products do not sell uniformly in the three regions. This is because different groups of consumers prefer different products and recipes, and there are biases designed into the simulation that make these non-uniform between the three regions. Also, the store mix is not the same, so the relative number of hypermarkets, grocery stores and independent grocers in each region also affect the distribution of sales, particularly between the two product size categories.
You are going to need to pay more attention to these preference patterns. Shipping a uniform amount of each product to each region isn’t likely to yield maximum revenue.
Warehouse Capacity and Storage CostsThe capacity of your main warehouse remains the same. You have no “free” or “pre-paid” storage capacity at any of the regional distribution centers – all space must be rented. Costs for renting space in the regions are the same as for renting extra space near your main warehouse. Refer to your job aid or the Manufacturing Introduction chapters for specifics.
Transportation Planning and Shipping CostsThe cost to send a truck is fixed. Regardless of how many total units or how many different products you put in the truck, it will cost you €1000. You do not send the same truck to all three regions – you must send one to each. So, if you are to send a truck to each of the three regions every day, it will cost you €3000 every day. You can decide how often the trucks will go, from once every day to as infrequently as you like.
There are two strategies by which to determine the quantity of product to load into the trucks.
Push – If you adopt a push strategy, you decide exactly how many units of each product to load into the truck. If you specify 1,000 units then every time the truck is scheduled to make a delivery, it will take 1,000 units from your main warehouse (provided they are available!) to the respective region. This strategy is pretty good

PARTICIPANT’S GUIDE: MANUFACTURING GAME © Léger et al. (2017) ERPsim Lab, HEC Montréal. 63
if you want to optimize deliveries based on your production output. You know your production capacity and can plan your transportation schedule around multiples and fractions of your production capacity.
Pull – If you adopt a pull strategy, then you are deciding how many units of each product you would like to have at the regional warehouse, after the truck has made its delivery. It works similarly to the MRP calculations. What is loaded into the truck is calculated by subtracting the amount of inventory already at the destination from the target amount. This strategy is pretty good if you don’t know too much about the pattern of demand, or if the sales volume varies a lot over time.
Specifying your transportation plan is straightforward. Muesli AG has a custom trans-action in their SAP system to record this and inform your warehouse and logistics team of your decision. Figure 6.1 shows an example of this transaction.
Figure 6.1: Stock transfer planning
Regardless of which strategy you choose and what amounts you set, you cannot send inventory that simply does not exist. In the case of short supply of one or more products at your main warehouse, your team will simply recalculate and send what-ever is available. If you specify to send more to the North than the South and West for example, your team will honour the proportions specified and send proportional

PARTICIPANT’S GUIDE: MANUFACTURING GAME © Léger et al. (2017) ERPsim Lab, HEC Montréal. 64
amounts based on what you have to the regions. So long as there is at least 1 unit that can be sent, the truck will go. If you have nothing to send for all products, and it’s time for the trucks to go, they will skip a cycle, so you won’t pay to send empty trucks. Be aware that they don’t wait until the next day – if your schedule is every 3 days and you skip a delivery because your warehouse is empty, it will be another 3 days before another delivery is attempted.
What if you change your transportation plan? Your team will adjust accordingly. If you were sending trucks every 5 days and decide to send every 3 days instead, your team will simply consider whether it’s time to send trucks based on the last time one was sent. If it’s been 3 days or more, it’s time for shipment. If not, then wait until it’s time based on the new schedule. For a pull strategy, if you reduce the target quanti-ties below what is currently there, the team won’t send any more until you’ve sold off stocks to be once again below target. Remember, the trucks only ship one way, so you will not be seeing items shipped back to the main warehouse.
CONCLUSIONThe Advanced scenario is quite challenging, especially if introduced early when you’ve had little practice. Do not underestimate the difficulty from varied consumer prefer-ences. Warehousing and transportation costs can quickly eat into your margins if you do not pay attention – factor these additional costs into your pricing. Monitor your inventory in the three regions and adjust your marketing budgets based on the situa-tion you see there. There’s a lot to think about and keep track of. Divide responsibilities and coordinate well. Good team work will reward you particularly well in this scenario.

http://erpsim.hec.ca© Léger et al. (2017) ERPsim Lab, HEC Montréal.
PART 3
PARTICIPANT’S GUIDE: MANUFACTURING GAME © Léger et al. (2017) ERPsim Lab, HEC Montréal. 66
Each company in the game is using an integrated information system to manage its operations. The idea is to use all existing information to avoid data re-entry, and to create and store new data for future use in other transactions. Broadly speaking the data in the system can be separated into three types. In SAP, these are termed Organizational Elements, Master Data and Transactional Data (or Transactional Docu-ments). The organizational elements represent the structure of the enterprise, and business rules associated with that structure. Master data is one of the cornerstones of an effective ERP. This is data that changes infrequently but is referenced often, and relevant to several of the organization’s business processes. Information about products, materials, price conditions, freight conditions, customers and suppliers are examples of master data. Transactional data is information about all the day to day operations – purchase orders, sales orders, inventory movements, accounting entries; It is the essence of the business activities that are taking place.
An enterprise system is built around an integrated database. A system like SAP contains tens of thousands of data tables. When a user creates, changes or views data in the system, he or she performs a transaction. Data changed or created by one user can be exploited by all other users (e.g. reporting, tracking, execution of orders, etc.). This is the virtue of an integrated system.
A large number of pre-programmed transactions exist in SAP. All transactions are traceable; for legal and controlling purposes, transactions with financial impacts can be reversed but not erased.
Each transaction has a transaction code or technical name – a user can execute a transaction if one knows the transaction code. An alternative way to select a transac-tion is to use the SAP menu. One can browse the SAP menu by drilling down through the successive folders and finding the desired transaction.
The standard SAP menu provides access to a very large number of transactions. For the purpose of the ERP Simulation Game, we have created a user menu that contains all and only the transactions mentioned in this book. For each transaction that you will use, we provide both the transaction code and the path in the user menu to access it.
Many transactions take you directly to the screen to view, edit or create information. Others require you to first fill in a selection screen, where you enter criteria to filter the information you will using.
Information on how to configure settings to access specific SAP systems, as well as login to those same systems is not covered in this book. You instructor will provide you details and teach you what to do.
Before moving on to the specific transactions used for ERPsim, we will cover a few navigation basics.
CHAPTER 7

PARTICIPANT’S GUIDE: MANUFACTURING GAME © Léger et al. (2017) ERPsim Lab, HEC Montréal. 67
Getting Around in the SAP System USER MENUSAfter you log in to the SAP system you will be presented with a user menu much like the one that can be seen in Figure 7.1. This menu is custom to the manufacturing simu-lation, and has some variations depending on which scenario – Introduction, Extended or Advanced. In all cases, transactions are only added as you progress through the scenarios, never moved or removed. So once you learn where something is, you will always be able to find it.
The user menu is structured by role, with the transactions relevant to each business process grouped together into top level folders – one per role. Several reporting transactions may appear more than once, if they are relevant to more than one role. All the reports are also grouped together into their own top level folder for conve-nience.
Figure 7.1: User menu for the Manufacturing Advanced scenario
To run a transaction, you can simple double click it from the menu. Figure 7.2 shows the Inventory Report for example, once it has been opened.
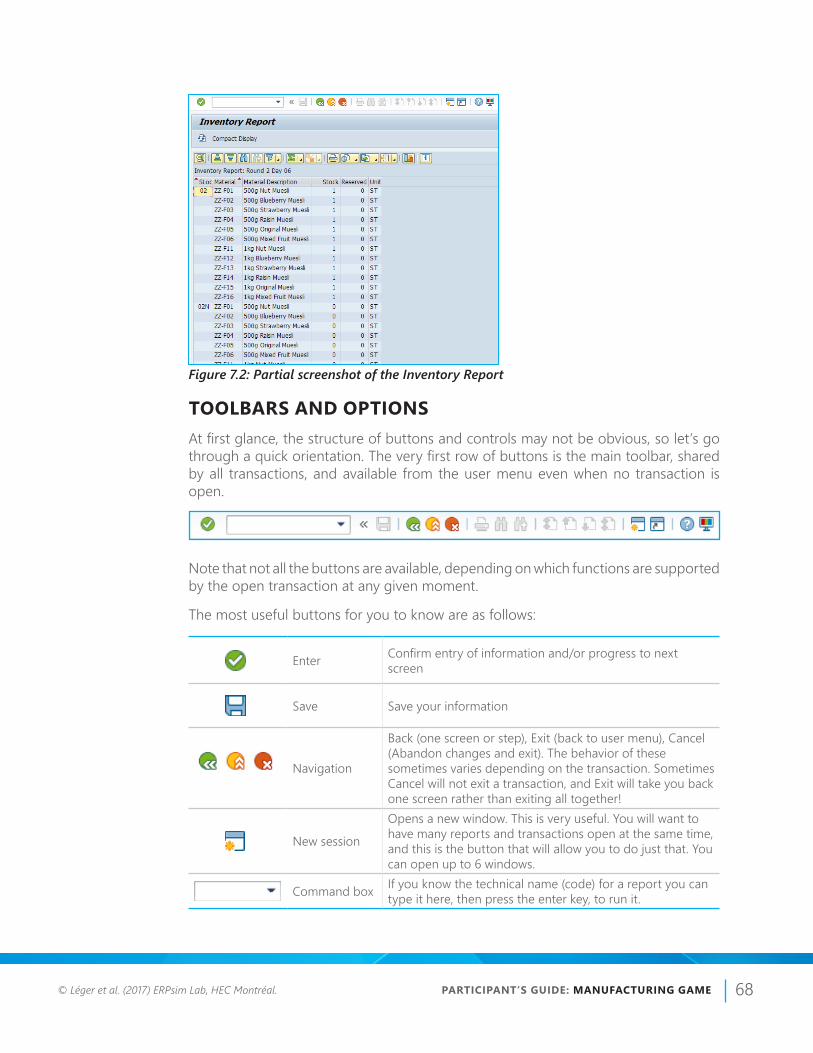
PARTICIPANT’S GUIDE: MANUFACTURING GAME © Léger et al. (2017) ERPsim Lab, HEC Montréal. 68
TOOLBARS AND OPTIONSAt first glance, the structure of buttons and controls may not be obvious, so let’s go through a quick orientation. The very first row of buttons is the main toolbar, shared by all transactions, and available from the user menu even when no transaction is open.
Note that not all the buttons are available, depending on which functions are supported by the open transaction at any given moment.
The most useful buttons for you to know are as follows:
Enter Confirm entry of information and/or progress to next screen
Save Save your information
Navigation
Back (one screen or step), Exit (back to user menu), Cancel (Abandon changes and exit). The behavior of these sometimes varies depending on the transaction. Sometimes Cancel will not exit a transaction, and Exit will take you back one screen rather than exiting all together!
New session
Opens a new window. This is very useful. You will want to have many reports and transactions open at the same time, and this is the button that will allow you to do just that. You can open up to 6 windows.
Command box If you know the technical name (code) for a report you can type it here, then press the enter key, to run it.
Figure 7.2: Partial screenshot of the Inventory Report

PARTICIPANT’S GUIDE: MANUFACTURING GAME © Léger et al. (2017) ERPsim Lab, HEC Montréal. 69
Below the main toolbar, is the transaction header and transaction toolbar. This toolbar is specific to the open transaction.
On many reports you will see a Refresh icon ( ). Use this button to refresh the data displayed in the report.
Finally, on some transactions, typically reports, you can see a data grid that also has its own toolbars and headers.
Many custom reports are available that look like this, and conveniently have a line just after the toolbar and before the data that tells you the current day in the simulation. The toolbar has options that let you sort, total, subtotal and filter the data in the grid.
SELECTION SCREENSIn many transactions you will first see a selection screen, with many criteria that you can use to narrow the scope of the data that you will be maintaining. Many of these have been configured with default values to help you, but there are a few you will have to fill in for yourself. Some fields require only a single value, others allow a range to be specified. If you enter a range of values, then all values between (and including) what you entered will be retrieved. You can specify just one value, by filling in the just the first field, or a range by filling in both like in the example shown in figure 7.3. In that example, the values 10 and 14 are specified for Distribution Channel; which will also include 12 since it is between 10 and 14.
After entering values in the selection screen, you click on Execute ( ) in the transac-tion specific toolbar to submit your selections and retrieve or process data.
Figure 7.3: Part of a typical selection screen

PARTICIPANT’S GUIDE: MANUFACTURING GAME © Léger et al. (2017) ERPsim Lab, HEC Montréal. 70
Transactions Used During the SimulationIn this chapter, we cover in detail all the transactions used during the simulation. As mentioned previously, the simulation automates many transactions – those transac-tions, which are not used during the simulation, are covered in the next chapter. For reference Figure 7.4 shows the complete business process and associated transac-tions. We will present the transactions in reverse business process order, like they are organized in the custom user menu. Reporting transactions, which are shared among many functions, will be discussed with the business functions where they are first encountered.
PLANNING PROCESS
SALES PRO
CESS
DB CRDB CR
PRO
CURE
MEN
T PR
OCE
SS
Cash
DB CRDB CR
Acc. Pay
GR/IR
DB CRDB CR
Acc. Pay
DB CRDB CR
Raw mat. GR/IR
Raw
DB CRDB CR
Cons. Raw materials
Finished Prod.
DB CRDB CR
products Output
DB CR
Inventory Finished
DB CR
change product
Cash
490000_ _ _ _
Acc. Rec.
10000_ _ _ _
Factory OutputProduction
490000_ _ _ _
Investment
490000_ _ _ _
ConsuptionRaw material
9000_ _ _ _
Change: SaleInventory
Domestic$$-01 140000_ _ _ _
$$-01 9000 _ _ _ _ V01 500000 _ _ _ _V02 500000 _ _ _ _
V01 510000 _ _ _ _
Sales Revenue
V02 510000 _ _ _ _
V01 150000 _ _ _ _V02 150000 _ _ _ _
G/L 490000_ _ _ _
10000_ _ _ _
490000_ _ _ _
F-28
Payment
PurchaseRequisition
Planned
(PurReq)
Order(PldOrd)Independant
Requirement(IndReq)
Sales Order(CusOrd)
Delivery(Delvry)
CustomerInvoice
OrderReservation
Supplier
(OrdRes)
Goods
Invoice
Receipt
PurchaseOrder(PO)
ProductionOrder
(PrdOrd)
Goods Issue
DB CRDB CR
Sales
DB CRDB CR
Acc. Rec. revenues
Investments Cash
PRODUCTION PROCESS
PLANNER
PRODUCTION MANAGER
SALES &
MARKETINGMANAGER
Figure 7.4: The Complete Muesli Manufacturing Business Cycle

PARTICIPANT’S GUIDE: MANUFACTURING GAME © Léger et al. (2017) ERPsim Lab, HEC Montréal. 71
SALES AND MARKETING
Change Price ListIn SAP, a price list is just one part of many conditions that can determine final pricing when a sales order is created. The pricing procedure looks for condition records to set the prices based on the various conditions applicable when a product is sold. These condition records include the price list, discounts, surcharges, transportation costs and taxes. In the simulation, we only use price list conditions, so you must specify a sales price condition record for each finished product that you wish to sell to every distribution channel.1. After running VK32 – Change Price List you will see the “Change Condition
Records” screen, with several folders.2. Open the “Prices” folder by clicking on the small black triangle to the left of it.3. Double click on the “Price List” item. A selection screen appears.4. Enter the values for the DC(s) that you wish to edit. Enter 12 for the Manufac-
turing Introduction, or 10, 12 or 14 for the Extended or Advanced (or a range between two values).
5. Click Execute ( ). The list of products and prices appears. Depending on which DC(s) you entered, you will see products only relevant to that DC.
6. Edit the prices in the Amount column.7. Click Save ( ). The screen closes and a confirmation message appears.
VK32Sales and Marketing / VK32 – Change Price List
RelevantScenarios: Introduction Extended Advanced

PARTICIPANT’S GUIDE: MANUFACTURING GAME © Léger et al. (2017) ERPsim Lab, HEC Montréal. 72
Marketing Expense PlanningYou may change your marketing budget at any point in time in the game. Remember that the effect of marketing is short term, so you may want to optimize where you spend your budget often. You can specify any amount (in whole Euros, no cents) for each of the 12 products in each of the 3 geographic regions – this is the amount that will be spent PER DAY1. After running ZADS – Marketing Expense Planning you will see the “Marketing
Expense Planning” screen, with a 12x3 grid layout.2. In each of the cells of the grid, enter the amount that you would like to spend
on marketing each day, for the associated product (row) and geographic region (column). You do not need to enter 0 where you do not wish to spend anything – you can leave cells blank.
3. Press the Enter key. Under the grid, the Daily Total will update to reflect what your total daily spend will be. Verify that this amount is in line with your overall budget and strategy.
4. Click Save ( ). A confirmation message appears.
When you enter in this transaction, you will see that current amounts you are spending each day. You will continue to spend these amounts every day until you change them. To stop spending, or to more quickly change your whole marketing budget, you can click on Clear ( ) to reset all the values in the grid to zero. Clearing does NOT save. After clearing you must click on Save ( ) to record your decision to stop spending money on marketing.
ZADSSales and Marketing / ZADS – Marketing Expense Planning
RelevantScenarios: Introduction Extended Advanced

PARTICIPANT’S GUIDE: MANUFACTURING GAME © Léger et al. (2017) ERPsim Lab, HEC Montréal. 73
Inventory ReportOne of the key elements of the game is to be able to react to customer demand and ensure that the inventory of your products is maintained at the right level. Each time production for a given product is confirmed, the inventory of the finished product goes up. Each time a sale is processed the inventory goes down accordingly. Tracking the evolution of inventory levels provides you with a useful diagnostic on how well your production schedule matches the pace of sales.
Monitoring inventory levels will help you forecast demand and decide when you should issue production orders. This report also provides information about raw material stocks, so you can know when you have the necessary amounts available to release production orders.Table 7.1: Inventory Report Column Descriptions
SHORT NAME FULL NAME DESCRIPTION
SLoc Storage Location
In the SAP system, a storage location is a logical grouping of materials, used to manage like inventory. In the manufacturing game there are 5 storage locations:02: This is for finished goods in your main warehouse.02N, 02S, 02W: These are for finished goods in your regional distribution centers (Advanced scenario only) in the North, South and West respectively.88: This is for raw materials – both food and packaging in your main warehouse.
Material MaterialThis the SAP code for the material. $$-F## for finished goods, $$-P## for packing raw materials, and $$-R## for food raw materials.
Description Material Description This is the name of the material.
Stock Stock This is the quantity on hand of the associated material in the associated storage location.
Reserved Reserved
This applies to raw materials only. It is the portion of the on hand quantity of material that is held aside for in-process production orders. Only unreserved stock can be used (and therefore also become reserved) to create other production orders.
Unit Base Unit
This is the base unit of measure for the material – it allows you to make sense of the Stock and Reserved quantities. For food raw materials, the unit is kilograms (KG). For all other materials the unit is pieces (ST) – a straight count of items. Note that the weight of the finished goods is not used for counting inventory.
OTHER INFORMATION AND OPTIONS
In addition to the material stock listing by location information, a Warehouse Capacity block is also included in this report. This block shows the capacity of the main ware-house by material type as well use the total quantity of materials on hand for that type. Effectively, you can see how much of your storage capacity is in use at a glance.
ZMB52Sales and Marketing / Reports / ZMB52 – Inventory Report
RelevantScenarios: Introduction Extended Advanced

PARTICIPANT’S GUIDE: MANUFACTURING GAME © Léger et al. (2017) ERPsim Lab, HEC Montréal. 74
On the toolbar there is a standard Refresh button, and a “Compact Display” option. This later button moves the position of the Warehouse Capacity information block from the right of the stock material listing to above it. Once clicked, the button will read “Widescreen Display”. Click to move the block back to the right of the list.
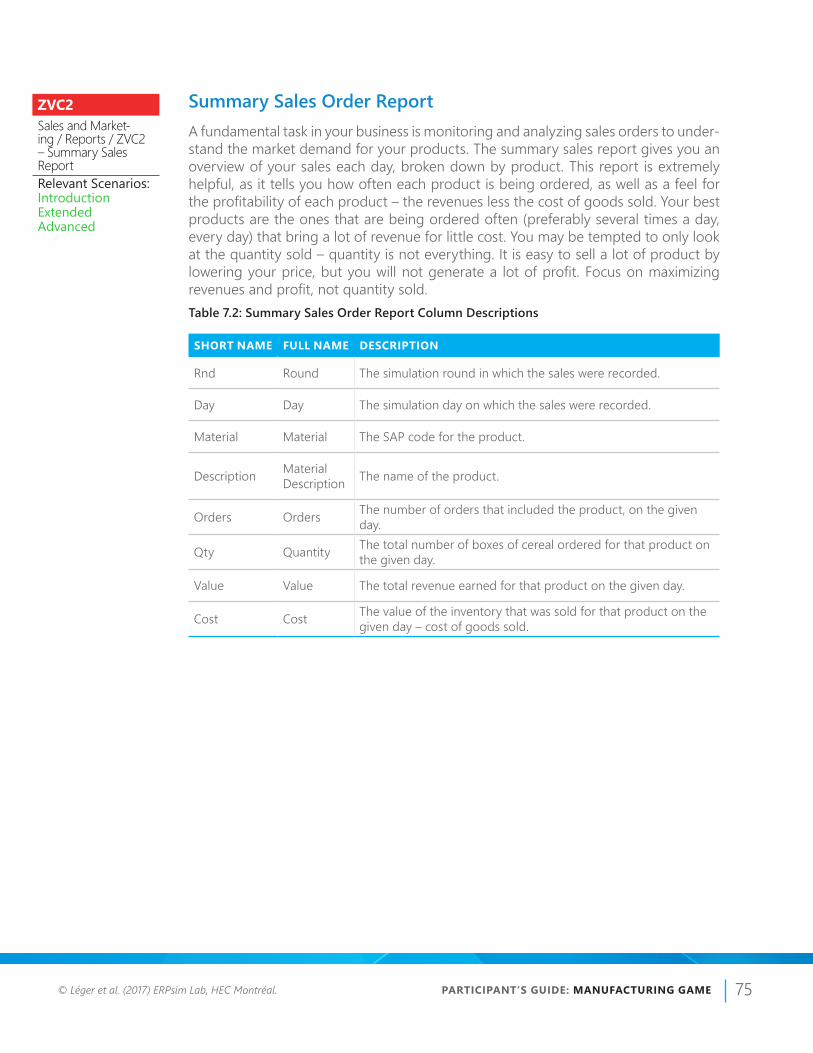
PARTICIPANT’S GUIDE: MANUFACTURING GAME © Léger et al. (2017) ERPsim Lab, HEC Montréal. 75
Summary Sales Order ReportA fundamental task in your business is monitoring and analyzing sales orders to under-stand the market demand for your products. The summary sales report gives you an overview of your sales each day, broken down by product. This report is extremely helpful, as it tells you how often each product is being ordered, as well as a feel for the profitability of each product – the revenues less the cost of goods sold. Your best products are the ones that are being ordered often (preferably several times a day, every day) that bring a lot of revenue for little cost. You may be tempted to only look at the quantity sold – quantity is not everything. It is easy to sell a lot of product by lowering your price, but you will not generate a lot of profit. Focus on maximizing revenues and profit, not quantity sold.Table 7.2: Summary Sales Order Report Column Descriptions
SHORT NAME FULL NAME DESCRIPTION
Rnd Round The simulation round in which the sales were recorded.
Day Day The simulation day on which the sales were recorded.
Material Material The SAP code for the product.
Description Material Description The name of the product.
Orders Orders The number of orders that included the product, on the given day.
Qty Quantity The total number of boxes of cereal ordered for that product on the given day.
Value Value The total revenue earned for that product on the given day.
Cost Cost The value of the inventory that was sold for that product on the given day – cost of goods sold.
ZVC2Sales and Market-ing / Reports / ZVC2 – Summary Sales ReportRelevantScenarios: Introduction Extended Advanced

PARTICIPANT’S GUIDE: MANUFACTURING GAME © Léger et al. (2017) ERPsim Lab, HEC Montréal. 76
Detailed Sales Order ReportTo review the sales orders received by your company in detail, use the detailed sales order report. This report displays every product ordered for every sale. Most impor-tantly, it has information about the 3 geographic regions and the 3 customer types (DC). Use the summary report to guide your overall pricing and marketing strategy. Use this detailed report to fine tune your marketing budget between the geographic regions and pricing decisions between the customer types.Table 7.3: Detailed Sales Order Report Column Descriptions
SHORT NAME FULL NAME DESCRIPTION
Rnd Round The simulation round in which the sales were recorded.
Day Day The simulation day on which the sales were recorded.
Area Area The geographic region the customer is in – North (NO), South (SO) or West (WE).
DChl Distribution Channel
The type of customer – hypermarket (10), grocery store (12) or corner store (14).
Material Material The SAP code for the product.
Description Material Description The name of the product.
Price Price The unit price that the product was sold for.
Qty Quantity The number of units sold.
Value Value The revenue earned by the sale of that product (Qty X Price)
Cost Cost The value of the inventory that was sold – cost of goods sold (Qty X Standard Price).
ZVA05Sales and Marketing / Reports / ZVA05 – Detailed Sales ReportRelevantScenarios: Introduction Extended Advanced

PARTICIPANT’S GUIDE: MANUFACTURING GAME © Léger et al. (2017) ERPsim Lab, HEC Montréal. 77
Price Market ReportThe previous two sales reports only show you information about your company’s sales orders. The price market report on the other hand shows you information about the industry as a whole. While you cannot see individual details about each company’s sales, it will show you the total sales by region for each product. You can use this infor-mation to get a sense of how much of the potential market you are capturing.
This report only updates every five days, showing aggregate information for the whole 5-day period. Only the most recent 20 days of information is retained, grouped into four 5-day periods.Table 7.4: Price Market Report Column Descriptions
SHORT NAME FULL NAME DESCRIPTION
Rnd/Day Round and Day
The simulation round and day that is the last day of the reported period. For example, “02/10” means aggregated data from Round 2 for days 6 to 10 inclusive.
Material Description
Material Description The name of the product.
Area Area The geographic region the customers are in – North (NO), South (SO) or West (WE).
Value Value The total revenue earned from sales of that product in that area by all companies for the 5-day period.
Qty Quantity The total units sold for sales of that product in that area by all companies for the 5-day period.
Price Price
The weighted average sales price (Value / Qty). Note that this is the average price of actual won sales. It is NOT the average ASKING price of all the companies. Any company who did not win any sales for the product/area because their price was too high, or had no stock available, will NOT affect the reported average price.
ZMARKETSales and Marketing / Reports / ZMARKET – Price Market Report
RelevantScenarios: Introduction Extended Advanced

PARTICIPANT’S GUIDE: MANUFACTURING GAME © Léger et al. (2017) ERPsim Lab, HEC Montréal. 78
LOGISTICSThe logistics top level menu is only relevant to the Advanced Scenario.
Stock Transfer PlanningThe stock transfer planning transaction is where you maintain your shipping plans, deciding how much product to send, and how often, from your main warehouse to your regional warehouses.1. Select your Planning Mode. Either Pull or Push.2. Enter your Scheduling duration in days. Recommended values are from 1 to 5
days.3. In the Allocation Plan grid, enter the quantity for each product and region.
Remember, with a push strategy, these are the amount of product to ship each time a truck is sent. For a pull strategy these are the target inventory levels to maintain for each product and region, with the amount to put in the truck calcu-lated each time a truck is sent.
4. Press the Enter key. Under and to the right of the grid, the subtotals will update. Verify that these subtotals by product and region are in line with your overall strategy, schedule, and production capacity.
5. Click Save ( ). A confirmation message appears.
When you enter in this transaction, you will see the current stock transfer plan. You will continue to follow this plan of stock transfer amount and frequency until you change it. To stop sending products to the regions, or to more quickly change your whole plan, you can click on Clear ( ) to reset all the values in the grid to zero. Clearing does NOT save. After clearing you must click on Save ( ) to record your decision.
ZMB1BLogistics / ZMB1B – Stock Transfer PlanningRelevantScenarios: Introduction Extended Advanced
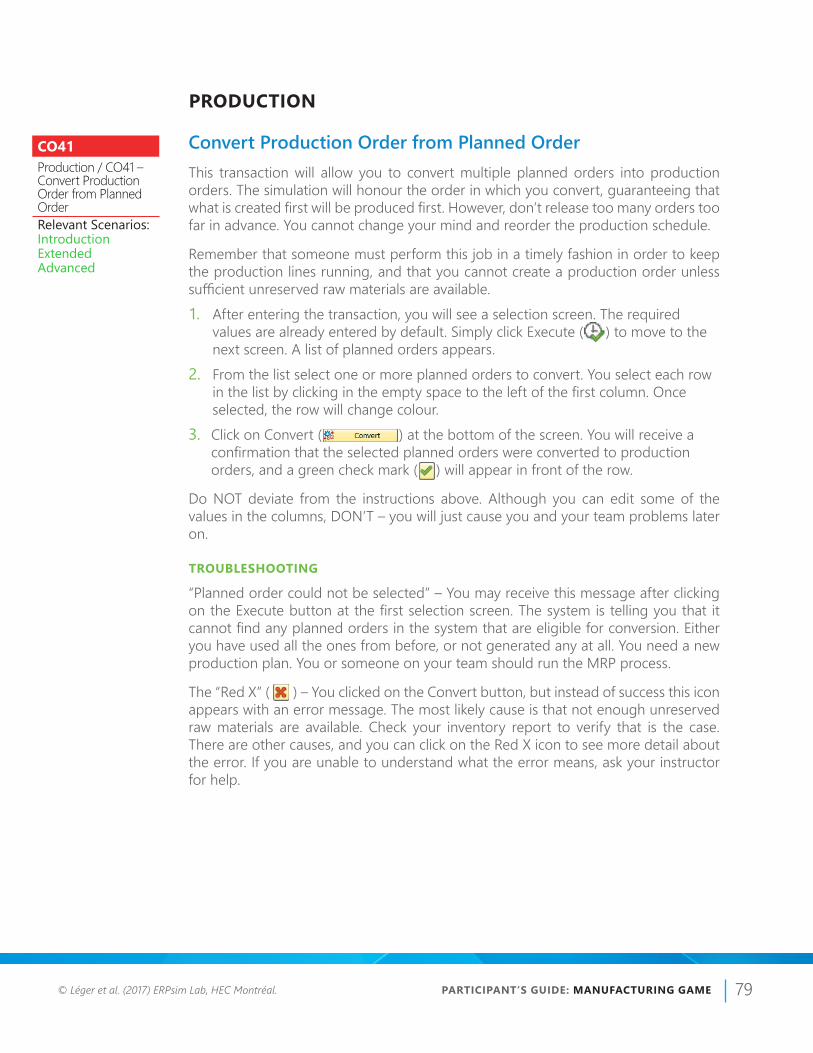
PARTICIPANT’S GUIDE: MANUFACTURING GAME © Léger et al. (2017) ERPsim Lab, HEC Montréal. 79
PRODUCTION
Convert Production Order from Planned OrderThis transaction will allow you to convert multiple planned orders into production orders. The simulation will honour the order in which you convert, guaranteeing that what is created first will be produced first. However, don’t release too many orders too far in advance. You cannot change your mind and reorder the production schedule.
Remember that someone must perform this job in a timely fashion in order to keep the production lines running, and that you cannot create a production order unless sufficient unreserved raw materials are available. 1. After entering the transaction, you will see a selection screen. The required
values are already entered by default. Simply click Execute ( ) to move to the next screen. A list of planned orders appears.
2. From the list select one or more planned orders to convert. You select each row in the list by clicking in the empty space to the left of the first column. Once selected, the row will change colour.
3. Click on Convert ( ) at the bottom of the screen. You will receive a confirmation that the selected planned orders were converted to production orders, and a green check mark ( ) will appear in front of the row.
Do NOT deviate from the instructions above. Although you can edit some of the values in the columns, DON’T – you will just cause you and your team problems later on.
TROUBLESHOOTING
“Planned order could not be selected” – You may receive this message after clicking on the Execute button at the first selection screen. The system is telling you that it cannot find any planned orders in the system that are eligible for conversion. Either you have used all the ones from before, or not generated any at all. You need a new production plan. You or someone on your team should run the MRP process.
The “Red X” ( ) – You clicked on the Convert button, but instead of success this icon appears with an error message. The most likely cause is that not enough unreserved raw materials are available. Check your inventory report to verify that is the case. There are other causes, and you can click on the Red X icon to see more detail about the error. If you are unable to understand what the error means, ask your instructor for help.
CO41Production / CO41 – Convert Production Order from Planned OrderRelevantScenarios: Introduction Extended Advanced

PARTICIPANT’S GUIDE: MANUFACTURING GAME © Léger et al. (2017) ERPsim Lab, HEC Montréal. 80
Production ScheduleThis report shows you information about all the production orders in your system. You can use this to keep track of which production runs have been completed already, and which production runs have yet to be produced. Use this report in conjunction with the inventory report to help you decide on the optimal sequence of production runs, such that you maintain the quantity of inventory for your products between the desired levels.
Table 7.5 describes the many different columns of information available in this report. Note that these descriptions are written as though all orders have been completed, and activity occurred in the past. During the simulation, some production orders will not be processes yet, and their start and finish dates will be in the future. This tells you when those production runs are going to occur, and you should interpret the descrip-tions below knowing that not only past events are reported. Table 7.5: Production Schedule Report Column Descriptions
SHORT NAME FULL NAME DESCRIPTION
Order Order The unique number assigned by the system to the production order.
Material Description
Material Description The name of the product produced.
Start Start Date The simulation date when the production run began processing.
Finish Finish Date The simulation date when the production run was completed.
Setup Setup TimeThe amount of time, in hours, that was needed to clean and reconfigure machines, before the production run could begin.
Released Date Released
The simulation date when the production order was created.
Target Target Quantity The number of units for the production run.
Confirmed Confirmed Quantity
The number of units produced so far. If this number is zero, then no production has begun. If this number is greater than zero, but less than the target quantity, then this is the production order that is currently being processed.
Unit Cost Unit Cost The cost of the raw materials consumed to produce one unit of the product.
ZCOOISProduction / Reports / ZCOOIS – Production ScheduleRelevantScenarios: Introduction Extended Advanced

PARTICIPANT’S GUIDE: MANUFACTURING GAME © Léger et al. (2017) ERPsim Lab, HEC Montréal. 81
PLANNING AND PROCUREMENT
Validated Bill of Material ChangeAt the beginning of the game, each of the twelve products has a preset recipe. Should you wish to change the recipe of a product, you need to change its bill of material (BOM).
Remember that the system will not allow you to change a BOM if you have too much inventory of the product, and your new recipe must match the MMA rules. For these reasons, you must use the custom transaction, ZCS02, to change the BOM. If you do not use this transaction, then the simulator will not recognize your product, and it will not sell.
Here are the steps to modify a bill-of-material in SAP®. 4. On “ERPsim: Validated BOM Change”, enter the Material Code for the product
whose recipe you wish to change.5. Click Execute ( ). The “Change material BOM: General Item Overview” screen
appears.6. Edit the amounts in the Quantity column. You should only change the values
for the food raw materials (measured in kg), since each product needs exactly 1 bag and 1 box. Remember that the total weight of each product needs to add to 500g or 1kg, depending on the product.
7. Click on Save ( ) to record your changes. The modified transaction will now validate your changes against the MMA regulations. A confirmation message will appear, e.g. “Material ZZ-F01 has a valid 500g Nut Muesli recipe.”
TROUBLESHOOTING
“You still have #,### units of _____ in stock. Reduce stock to #,### units first.” – You still have too much of this product in stock. You will need to sell more before you can change the BOM.
“Product weight of #.### is incorrect for ____ packing” – The amount of food mate-rials is incorrect, the total not matching the weight of the product. Click on Continue ( ) and you will be taken back to the BOM editing screen to correct your mistake.
ZCS02Planning and Pro-curement / ZCS02 – Validated BOM ChangeRelevantScenarios: Introduction Extended Advanced

PARTICIPANT’S GUIDE: MANUFACTURING GAME © Léger et al. (2017) ERPsim Lab, HEC Montréal. 82
Create Planned Independent RequirementsThis is where you enter your sales forecasts, known as planned independent require-ments in SAP. The MRP will use these values as target inventory levels, generating a production plan for the shortfall between the target values and the inventory & in-process production orders.1. On the “Created Planned Independent Requirements: Initial Screen” enter the
required selection filters. Select Product group option, and enter $$-F in the field to the right of this option.
2. Click Enter ( ). The “Plnd Ind. Reqmts Create: Planning Table” screen appears. The grid with products (material numbers) and columns with months is where you will enter and maintain your forecast.
3. Enter your forecast values in the second column. This second column will corre-spond to next month. Since you are forecasting for future sales we use this col-umn instead of the current month. Since the real SAP system date and time will not move forward during the simulation, the future months will never approach, so don’t use the other columns either. Enter values into the second column only – do not use the other months.
4. Click Save ( ). A confirmation message appears, and you are returned back to the “Created Planned Independent Requirements: Initial Screen”.
MD61Planning and Procure-ment / MD61 - Create Planned Independent RequirementsRelevantScenarios: Introduction Extended Advanced

PARTICIPANT’S GUIDE: MANUFACTURING GAME © Léger et al. (2017) ERPsim Lab, HEC Montréal. 83
MRP RunThe MRP calculation process uses the planned independent requirements, available inventory counts, and in-process production orders to generate a new production plan (new planned orders). Along with this production plan, a Dependent requirement is also created to support the new production plan, as well as Purchase Requisitions to meet these requirements..
Running the MRP process is simple.
1. On the “MRP Run” initial screen, default values and settings have already been set for you. You do not need to enter anything.
2. Click on Enter ( ). A warning message “Please check input parameters” appears. For most organizations with thousands of products, components and raw mate-rials, running the MRP can be a lengthy process. Getting it wrong, means setting up a production and procurement plan that you don’t want. This is why the system asks you to verify the settings. Don’t worry, the correct ones are set for you – just don’t change them!
3. Click in Enter ( ) once again to clear the warning. A confirmation dialog appears “To start the planning run, press enter.”
4. Click on Continue ( ). The MRP process runs, and a summary of the results appears.
After running the MRP, there is a section titled “Database Statistics”. Here you will see how many planned orders and purchase requisitions were created by the MRP process.
TROUBLESHOOTING
No planned orders created – Check your planned independent requirements. Did you enter them in the second column before running the MRP? Look at your stock levels and in-process production orders. Do they exceed your sales forecast? In that case you didn’t need to generate a new production plan, since the inventory and in-process production to come will already give you enough stock to meet your sales target.
No requisitions created – If the MRP didn’t generate any new planned orders, then there’s no need to procure any materials. If it did generate new planned orders, but still no requisitions then you already have enough materials on hand to support the new production plan. This can often happen if you updated your sales forecast – reducing the forecast for one product and increasing it for another might mean that even though you intend to produce more of one product, the raw materials that were ordered for the other product that you will no longer produce can be used to produce the increased product.
MD01Planning and Procurement / MD01 – MRP RunRelevantScenarios: Introduction Extended Advanced

PARTICIPANT’S GUIDE: MANUFACTURING GAME © Léger et al. (2017) ERPsim Lab, HEC Montréal. 84
Create Purchase OrdersThe MRP process creates purchase requisitions, which are internal documents that signal the procurement department to evaluate different sources of supply, and then place the orders with a selected supplier. Since you only have one possible supplier of each raw material, the system is configured to have a fixed supplier for each material, and the MRP process automatically assigns the relevant supplier to each requisition when it creates them. To place orders with your suppliers, you simply need to convert the requisitions to purchase orders.
Prior to doing this you can still readjust your forecast and re-run the MRP if you change your mind. Once you create and send the purchase orders, you commit to making the purchase. You cannot change your mind after the order if placed.1. At the “Automatic Creation of Purchase Orders from Requisitions” selection
screen, all the required fields are filled by default. You do not need to enter any-thing.
2. Click Execute ( ). The conversion process runs, and a summary of the purchase orders created appears.
There is only need for one order per supplier. Not that the SAP term for a supplier is “Vendor”. For each purchase order created, one or more line items is attached with the desired material and quantity. You must now wait for the order to be filled by the vendor, and the items to be received into your warehouse.
TROUBLESHOOTING
“No suitable requisition found” – If you see this message when you click execute at the selection screen, it tells you that no new, unconverted requisitions are available in the system. In other words, there’s nothing new to order. Once a purchase order is created, the source requisitions are tagged with a completed status. You wouldn’t want old requisitions interfering with new ones in determine which items and what quantity should be ordered. Troubleshooting this message therefore is not a question of why didn’t it work, but rather a question of why you don’t have any requisitions. Did you or someone already run the transaction recently? Did you run the MRP process before you ran this transaction? Did the MRP Run generate any requisitions? Trace the process back far enough, and you will eventually find the answer.
ME59NPlanning and Pro-curement / ME59N – Create Purchase OrderRelevantScenarios: Introduction Extended Advanced

PARTICIPANT’S GUIDE: MANUFACTURING GAME © Léger et al. (2017) ERPsim Lab, HEC Montréal. 85
Purchase Order TrackingYou can use the inventory report to track when you have sufficient raw materials on hand to start creating production orders. However, in order to be more prepared, it is better to know when those materials will arrive, and the Purchase Order Tracking report will give you this information.
Table 7.6 describes the many different columns of information available in this report. Note that these descriptions are written as though all orders are yet to be received, and activity occurs in the future. During the simulation, some purchase orders will have already been delivered, and their dates will be in the past. You should interpret the descriptions below knowing that not only future events are reported. Table 7.6: Purchase Order Tracking Report Column Descriptions
SHORT NAME FULL NAME DESCRIPTION
Order Order
The unique number assigned by the system to the purchase order. Note that since there are multiple items per order, a “blank” value indicates that this is another item on the same order as the previous one.
Vendor Vendor
Which supplier the order has been placed with, as identified by their code in the system. A “blank” value indicates this item is part of the same order as the previous one. A purchase order can only ever be for one vendor.
Material Description
Material Description The name of the item ordered.
Quantity Quantity Ordered
The amount ordered; in kg for foodstuffs, and by item count for packaging.
Price Price The purchase cost per price unit.
Price Unit Price UnitThe amount ordered that is the basis for multiplying by the price to get the total cost. 1kg for foodstuffs, and per item for packaging.
Value Value The total cost of the material amount ordered (Quantity / Price Unit) * Price
Status Status
The condition of the order.Unconfirmed – The supplier (simulator) is yet to confirm that the order has been placed.Expected – The supplier has confirmed the order and the materials have not yet been delivered.Delivered – The materials have been delivered to your warehouse.
GoodsExpected Goods Delivery
The simulation date on which the materials will arrive at your warehouse.N.Sch - Indicates that no delivery date has been communicated yet.
ZME2NPlanning and Pro-curement / Reports / ZME2N – Purchase Order TrackingRelevantScenarios: Introduction Extended Advanced
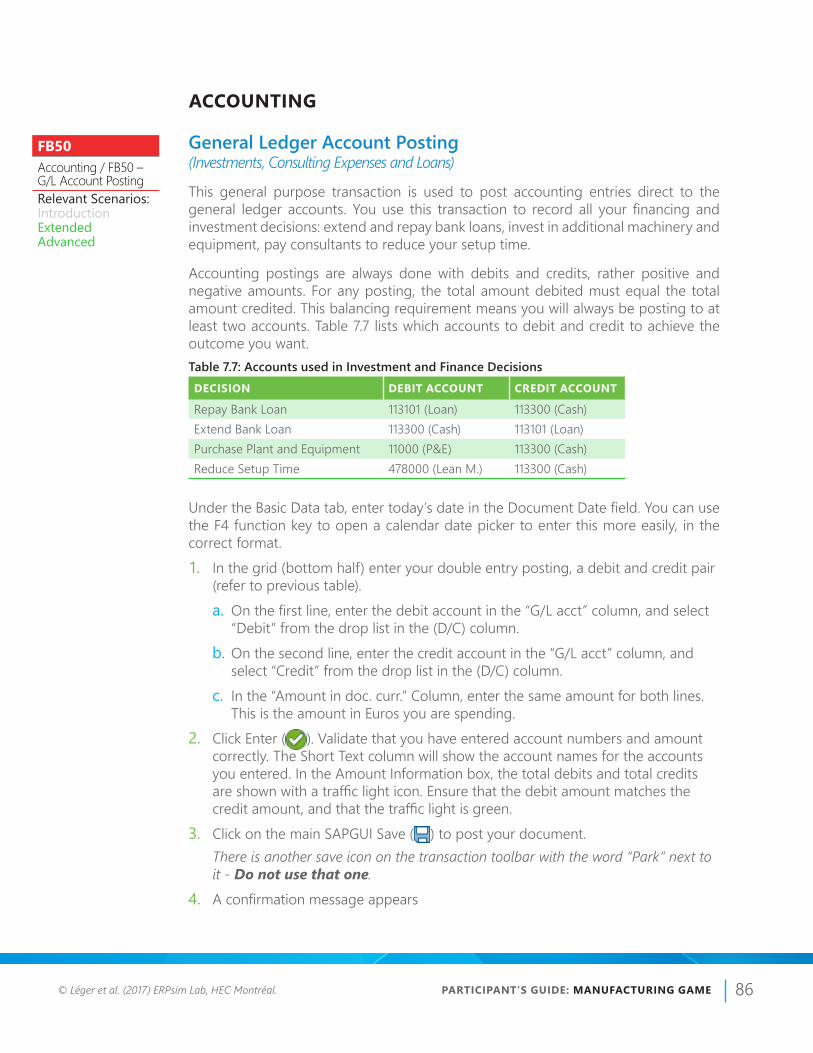
PARTICIPANT’S GUIDE: MANUFACTURING GAME © Léger et al. (2017) ERPsim Lab, HEC Montréal. 86
ACCOUNTING
General Ledger Account Posting (Investments, Consulting Expenses and Loans)
This general purpose transaction is used to post accounting entries direct to the general ledger accounts. You use this transaction to record all your financing and investment decisions: extend and repay bank loans, invest in additional machinery and equipment, pay consultants to reduce your setup time.
Accounting postings are always done with debits and credits, rather positive and negative amounts. For any posting, the total amount debited must equal the total amount credited. This balancing requirement means you will always be posting to at least two accounts. Table 7.7 lists which accounts to debit and credit to achieve the outcome you want.Table 7.7: Accounts used in Investment and Finance DecisionsDECISION DEBIT ACCOUNT CREDIT ACCOUNT
Repay Bank Loan 113101 (Loan) 113300 (Cash)Extend Bank Loan 113300 (Cash) 113101 (Loan)Purchase Plant and Equipment 11000 (P&E) 113300 (Cash)Reduce Setup Time 478000 (Lean M.) 113300 (Cash)
Under the Basic Data tab, enter today’s date in the Document Date field. You can use the F4 function key to open a calendar date picker to enter this more easily, in the correct format.1. In the grid (bottom half) enter your double entry posting, a debit and credit pair
(refer to previous table). a.On the first line, enter the debit account in the “G/L acct” column, and select
“Debit” from the drop list in the (D/C) column.b.On the second line, enter the credit account in the “G/L acct” column, and
select “Credit” from the drop list in the (D/C) column.c. In the “Amount in doc. curr.” Column, enter the same amount for both lines.
This is the amount in Euros you are spending.2. Click Enter ( ). Validate that you have entered account numbers and amount
correctly. The Short Text column will show the account names for the accounts you entered. In the Amount Information box, the total debits and total credits are shown with a traffic light icon. Ensure that the debit amount matches the credit amount, and that the traffic light is green.
3. Click on the main SAPGUI Save ( ) to post your document.
There is another save icon on the transaction toolbar with the word “Park” next to it - Do not use that one.
4. A confirmation message appears
FB50Accounting / FB50 – G/L Account PostingRelevantScenarios: Introduction Extended Advanced

PARTICIPANT’S GUIDE: MANUFACTURING GAME © Léger et al. (2017) ERPsim Lab, HEC Montréal. 87
Financial StatementsIn SAP®, you can get current financial statements at any point in time during the simu-lation to get a snapshot of your financial situation.
Transaction F.01 is used to display your financial statement.1. In the “Company code” field, enter your company code ($$ - your team letter
twice).2. Towards the bottom of the screen (you may need to scroll down), under “List
output” choose the ALV Tree Control option.3. Click Execute ( ). 4. If a warning message appears, dismiss it by clicking on Continue ( ). 5. The financial statements appear.
This standard report provides you with the balance sheet and the income statement of your company. You can get more details on each section, down to individual account balances, by clicking on the triangle on the left hand side of every item.
The net income line corresponds to the cumulative profit (or loss) of your firm since the beginning of the game.
This report is a standard SAP transaction and has not been enhanced. It does not have a refresh button. To refresh the data, you will need to go back ( ) to the selection screen and execute ( ) again.
F.01Accounting / Reports / F.01 – Financial StatementsRelevantScenarios: Introduction Extended Advanced

PARTICIPANT’S GUIDE: MANUFACTURING GAME © Léger et al. (2017) ERPsim Lab, HEC Montréal. 88
Product Cost PlanningPricing is a major challenge in the simulation. What you should charge for your prod-ucts depends on the customer markets, your finished product inventory levels, and the actions of your competitors. Earning a profit depends on your prices and what it costs you to bring that product to market.
To make this easier, a custom transaction exists in the SAP system to help you analyze some of your costs. There is a lot of information on the report.
PROFITABILITY ANALYSIS
This table is one of the most important. For each of your products, you see two values: Variable and Variable + Fixed. The Variable value is the variable cost of producing each product; what it costs in raw materials to produce one unit of each product. This value is calculated from the BOM for each product, and the moving average cost you have paid for raw materials. In general, you should never price below this amount – you are guaranteed to make a loss if you do. Price anywhere above this amount, and you will at least earn a contribution margin on sales of that product. That alone however does not guarantee you a profit, since you have many other costs. The total contribution margin from sales of all your products has to be more than your other costs if you want to be profitable.
To help calculate a minimum price for each product that would be high enough to cover your fixed costs, this report uses some assumptions to calculate a fixed cost per unit value. This is added to the variable cost, and is displayed in the Variable + Fixed column. You can use this as a guideline to more effectively price your prod-ucts. However, do not rely on this figure as your sole, absolute pricing determinant, because it has several limitations you need to be aware of. You should be pricing above these amounts, earning as much as the market and your competitors will allow.
■ Not all costs are included – The report does not include marketing, warehous-ing and transportation costs. Those costs are irregular and difficult to predict since they depend on your actions which can vary widely. You need to price high enough to cover these additional costs also.
■ Breakeven – Pricing near Variable + Fixed isn’t going to secure you a profit. You will only break even, just covering your fixed overheads, and given that not all costs are included you are in fact, likely to be unprofitable.
■ Assumptions – In order to calculate a unit cost, the report has to divide total fixed costs by some quantity of product. It’s shown on the report as Allocation Basis. Where does this quantity come from? It’s based on your daily production capacity and a productivity assumption. This productivity assumption can be changed in the report, and so if you know your historical productivity, you can improve the accuracy of the cost estimate. However, this assumes that i) your future productivity will be the same as your past productivity, which means you will follow the same pattern of creating production orders, with the same fre-quency of setup delays and idle periods; and ii) you will sell everything you pro-
ZCK11Accounting / Reports / ZCK11 – Product Cost PlanningRelevantScenarios: Introduction Extended Advanced

PARTICIPANT’S GUIDE: MANUFACTURING GAME © Léger et al. (2017) ERPsim Lab, HEC Montréal. 89
duce – this is a huge assumption; if you don’t sell everything then your margin earned by sales won’t be enough to cover your fixed costs.
■ Uniformity – You don’t need to, and nor should you, price your products with the same margins. Some products you will sell less of for a higher price, oth-ers more of for a lower price. Thinking uniformly about allocations of fixed costs can distort your thinking. You want to sell the products with the best margins, but once the market for those is saturated, you will need to consider other, less profitable products. Every sale above variable cost contributes to your margin, even if it is below “full cost”. If your best products are generating enough margin to cover your fixed costs and give you profit, why not sell another product even if it’s margin is low. This extra margin will add to your profit. Just be careful not to derail the sales of your best products – you have limited production capacity.
Limitations aside, the report is still useful - use it along with other reports to guide your pricing decisions.

PARTICIPANT’S GUIDE: MANUFACTURING GAME © Léger et al. (2017) ERPsim Lab, HEC Montréal. 90
Liquidity PlanningThis report will give you information about your cash balance and future inflows and outflows. It is organized by week, showing you the expected cash movements and balance for each week. You should consult this report before making any investment and financing decisions. You wouldn’t want to purchase plant and equipment, and then discover that you didn’t leave yourself enough cash to pay for a supplier delivery and have to extend your credit line (loan).
Table 7.8 describes the columns available in this report. Note that while this report shows your future cash flows, it is only reporting on information available in the system. It isn’t estimating your future sales for example – only uncollected payments for actual recorded sales are included.Table 7.8: Liquidity PlanningSHORT NAME FULL NAME DESCRIPTION
Exception Exception
This traffic light indicator informs you of your cash situation and trends.Red - Your cash balance, or predicted cash balance, is below zero.Yellow - The cash balance is positive, but trending down (more outflows than inflows).Green – The cash balance is positive, and stable or trending up.
Virtual Time Virtual Time The end date of the week for which cash flows are summarized.
Customers Customers Accounts Receivable amounts that will be collected for the week.
Vendors Vendors Accounts Payable amounts that will be paid for the week.
Marketing Marketing Your marketing expenses for the week. You control these with Marketing Expense Planning.
Overheads OverheadsThe fixed costs you will pay for the week. Only cash costs are included. Accounting costs such as depreciation do not affect your cash situation.
Interest Interest The amount you will pay in interest on your credit line (loan)
Closing Balance
Closing Balance
The expected cash balance at the end of the week. It is the closing balance from the previous week, plus the inflows, minus the outflows.
ZFF7BAccounting / Reports / ZFF7B – Liquidity PlanningRelevantScenarios: Introduction Extended Advanced

PARTICIPANT’S GUIDE: MANUFACTURING GAME © Léger et al. (2017) ERPsim Lab, HEC Montréal. 91
Appendix ALIST OF GENERAL LEDGER ACCOUNTS
G/L ACCOUNT NUMBER DESCRIPTION
1000 Land
2000 Buildings
2010 Accumulated Depreciation - Buildings
11000 Machinery and equipment
11010 Accumulated depreciation - machinery and equipment
70000 Common stock
113101 Bank Loan
113201 Bank Credit Margin
113300 Bank Cash Account
140000 Customers - Domestic Receivables
160000 Accounts payable - Domestic
211120 Depreciation Expenses: Building
211130 Depreciation Expenses: Machinery and Equipment
300000 Raw materials
400000 Consumption Raw Materials
472000 Shipping costs
476900 Interest expenses
477001 to 477036 Advertising in a region for a given product
478000 Lean Manufacturing Program Expenses
478100 Warehousing costs
500000 Direct Labor Costs
510000 Factory Overhead Expenses
520000 Sales, General and Administrative Expenses
792000 Finished goods
800000 Sales revenues - Domestic
893010 Total Finished Products Sold
895000 Total Finished Products Produced

PARTICIPANT’S GUIDE: MANUFACTURING GAME © Léger et al. (2017) ERPsim Lab, HEC Montréal. 92
AFTERWORD BY PIERRE-MAJORIQUE LÉGERWhen hired as a young professor at HEC Montréal, I was given the responsi-bility to teach ERP systems to undergraduate and MBA students. I was looking for new ways to teach ERP Systems using SAP® when I attended a training seminar led by Dirk-Jan Schenk and Casper Draijer, organized by SAP Canada in Halifax. These two professors from HES Amsterdam had developed a role playing game and it turned out to be truly inspirational. It convinced me then that this was the way to go.
After returning to Montreal, I spent the summer developing an ERP Simulation game. It was first used in October 2004. While it generated much enthusiasm from the participating students, the simulation game lacked a well developed and realistic economic story line. To address these issues, I invited Professor Jacques Robert, a friend and colleague at HEC Montréal,
to participate in the development of this market game. Professor Robert is an economist and a trained game theorist. He developed a very challenging market algorithm to support the game. Since then, he has been instrumental in the development of most aspects of the actual game version.
Building on this market model, a first prototype of the simulation software was developed in Excel. The simulation engine generated text files that were uploaded and executed using a CATT script in SAP®. The simulation software created customer orders per round, but it had two problems. First, it required far too much human intervention to operate the simulation game, and second, orders could only be created in batches once per round.
This is when Professors Gilbert Babin and Robert Pellerin came into play. Professor Babin, also a friend and colleague at HEC Montréal, is a computer scientist specializing in distributed systems. Professor Pellerin is an indus-trial engineer from École Polytechnique de Montréal and a former doctoral colleague. Thanks to both of these researchers, ERPsim was developed. ERPsim is a Java-based application that supports almost every aspect of the simu-lation game. Sales orders are now automatically recorded in the system in real time. Both Professors Babin and Pellerin have significantly contributed in the development of the simulation game. Finally, Professor Bret Wagner from Western Michigan University joined our team in December 2006. With his help, a dedicated simulation client was developed to support the simulation game. Our team is a truly interdisciplinary team.
We have also benefited from the assistance and insightful comments of many faculty members of the SAP University Alliance. The ERP Simulation Game is now used by more than 250 faculty members and in more than 100 universities worldwide. We would like to thank all these collegues for their comments that have helped to improve the software and streamline the simu-lation game.
Pierre-Majorique Léger, Ph.D.
Full professor HEC Montréal
Director ERPsim Lab Co-director Tech3Lab