manuscript - arxiv.org
TRANSCRIPT
Expectancy and musical emotion
Effects of pitch and timing expectancy on musical emotion
Sauvé, S. A.1, Sayed, A.1, Dean, R. T.2, Pearce, M. T.1
1Queen Mary, University of London
2Western Sydney University
Author Note
Correspondence can be addressed to Sarah Sauvé at [email protected]
School of Electronic Engineering and Computer Science
Queen Mary University of London, Mile End Road
London E1 4NS
United Kingdom
+447733661107
Biographies
S Sauve: Originally a pianist, Sarah is now a PhD candidate in the Electronic Engineering
and Computer Science department at Queen Mary University of London studying expectancy
and stream segregation, supported by a college studentship.
Manuscript
EXPECTANCY AND MUSICAL EMOTION 2
A Sayed: Aminah completed her MSc in Computer Science at Queen Mary University of
London, specializing in multimedia.
R.T. Dean: Roger is a composer/improviser and researcher at the MARCS Institute for
Brain, Behaviour and Development. His research focuses on music cognition and music
computation, both analytic and generative.
M.T. Pearce: Marcus is Senior Lecturer at Queen Mary University of London, director of
the Music Cognition and EEG Labs and co-director of the Centre for Mind in Society. His
research interests cover computational, psychological and neuroscientific aspects of music
cognition, with a particular focus on dynamic, predictive processing of melodic, rhythmic and
harmonic structure, and its impact on emotional and aesthetic experience. He is the author of the
IDyOM model of auditory expectation based on statistical learning and probabilistic prediction.
EXPECTANCY AND MUSICAL EMOTION 3
Abstract
Pitch and timing information work hand in hand to create a coherent piece of music; but what
happens when this information goes against the norm? Relationships between musical
expectancy and emotional responses were investigated in a study conducted with 40 participants:
20 musicians and 20 non-musicians. Participants took part in one of two behavioural paradigms
measuring continuous expectancy or emotional responses (arousal and valence) while listening
to folk melodies that exhibited either high or low pitch predictability and high or low onset
predictability. The causal influence of pitch predictability was investigated in an additional
condition where pitch was artificially manipulated and a comparison conducted between original
and manipulated forms; the dynamic correlative influence of pitch and timing information and its
perception on emotional change during listening was evaluated using cross-sectional time series
analysis. The results indicate that pitch and onset predictability are consistent predictors of
perceived expectancy and emotional response, with onset carrying more weight than pitch. In
addition, musicians and non-musicians do not differ in their responses, possibly due to shared
cultural background and knowledge. The results demonstrate in a controlled lab-based setting a
precise, quantitative relationship between the predictability of musical structure, expectation and
emotional response.
Keywords: emotion, expectation, time series, information content, IDyOM

EXPECTANCY AND MUSICAL EMOTION 4
Effects of pitch and timing expectancy on musical emotion
Music is capable of inducing powerful physiological and psychological emotional states
(Bittman et al., 2013; Castillo-Pérez, Gómez-Pérez, Velasco, Pérez-Campos, & Mayoral, 2010).
For example, the practice of music therapy stemmed from the observation that music can have a
positive emotional impact (Khalfa, Bella, Roy, Peretz, & Lupien, 2003; Pelletier, 2004).
However, many studies of emotion induction by music have simply investigated which emotions
are induced rather the psychological mechanisms that account for why these emotions occur
(Juslin & Västfjäll, 2008). The present research aims to address this omission by examining one
theorized psychological mechanism of musical emotion induction in isolation. Although factors
such as personality, age and gender have an influence (Rentfrow & Gosling, 2003), we focus
here on the properties of music that are involved in emotion induction.
While there is general consensus that music can elicit emotional responses (see Juslin &
Sloboda, 2001, for an extensive review), why and how it does so is less clear. Juslin & Vastfjall
(2008) describe six potential psychological mechanisms that might explain how emotions are
induced through music: (1) brain stem reflexes, (2) evaluative conditioning, (3) emotional
contagion, (4) visual imagery, (5) episodic memory, and (6) musical expectancy. Hearing a
sudden loud or dissonant event causes a change in arousal (brain stem reflex) whereas a piece
repetitively paired with a positive, or negative, situation will create a positive, or negative,
emotional reaction (evaluative conditioning). Emotional contagion is the induction of emotion
through mimicry of behavioural or vocal expression of emotion; for example shorter durations
and ascending pitch contours tend to reflect happiness while longer durations and descending
pitch contours communicate sadness. Visual imagery refers to the mental imagery evoked by the
music, which can have positive or negative affect. Finally, pairing between a sound and a past

EXPECTANCY AND MUSICAL EMOTION 5
event can trigger the emotion related to that event when the sound is subsequently heard
(episodic memory). The present study focuses on musical expectancy, while controlling for all
other potential mechanisms proposed above. Meyer (1956) argues that emotion is generated
through musical listening because listeners actively generate predictions reflecting what they
expect to hear next (see also Huron, 2006). Unexpected events are surprising and associated with
an increase in tension while expected events are associated with resolution of tension (e.g.
Gingras et al., 2016). According to this account, surprising events generally evoke high arousal
and low valence (Egermann et al., 2013; Koelsch, Fritz, & Schlaug, 2008; Steinbeis, Koelsch, &
Sloboda, 2006). However, listeners familiar with a piece of music can come to appreciate an
event that has low expectancy through an appraisal mechanism, resulting in a high valence
response (Huron, 2006). This apparent contradiction highlights the importance of isolating the
psychological mechanisms behind musical emotional induction. There are also different
influences on musical expectation (Huron, 2006). Schematic influences reflect general stylistic
patterns acquired through extensive musical listening to many piece of music while veridical
influences reflect specific knowledge of a familiar piece of music. Dynamic influences reflect
dynamic learning of structure within an unfamiliar piece of music (e.g. recognizing a repeated
motif). Listening to new, unfamiliar music in a familiar style engages schematic and dynamic
mechanisms, the former reflecting long-term learning over years of musical exposure and the
latter short-term learning within an individual piece of music. Both these long- and short-term
mechanisms can be simulated as a process of statistical learning and probabilistic generation of
expectations (Pearce, 2005). Furthermore, these may be different for musicians and non-
musicians due to extensive exposure and training in a particular style (Juslin & Vastfjall, 2008).
EXPECTANCY AND MUSICAL EMOTION 6
We now consider the properties of musical events for which expectations are generated.
Prominent among such properties are the pitch and timing of notes and we consider each in turn.
Music theorists have described musical styles as structurally organised, reflecting well
formalised rules that constitute a kind of grammatical syntax (Lerdahl & Jackendoff, 1983). In
the tradition of Western tonal music, compositions usually follow these rules by adhering to a
tonal structure and enculturated listeners are able to identify when a piece of music infringes
tonal rules based on their exposure in everyday music listening (Carlsen, 1981; Krumhansl,
Louhivuori, Toiviainen, Järvinen, & Eerola, 1999; Trainor & Trehub, 1992). Two kinds of
models have been developed to explain listeners’ pitch expectations: first, models that include
static rules; and second, models that focus on learning. An influential example of a rule-based
model is the Implication-Realization (IR) model, developed by Eugene Narmour (1991) which
includes rules defining the expectedness of the final note in a sequence of three notes, where the
first pair of notes forms the implicative interval and the second pair of notes the realized interval.
The size and direction of the implicative interval sets up expectations of varying strengths for the
realized interval. While the original IR model contained five bottom-up rules of melodic
implication, Schellenberg (1997) reduced the five bottom-up rules of the IR model to two: pitch
proximity and pitch reversal. For example, according to the rules of pitch reversal, a small
interval implies another small interval in the same direction while a large interval implies a
subsequent small interval in the opposite direction. Such patterns reflect actual patterns in
existing Western music (Huron, 2006; Thompson & Stainton, 1996) suggesting the possibility
that listeners might learn these patterns through experience.
Statistical learning is a powerful tool for explaining the acquisition of pitch expectations
in music, where common sequential patterns are learned through incidental exposure (Huron,

EXPECTANCY AND MUSICAL EMOTION 7
2006; Pearce, 2005; Saffran, Johnson, Aslin, & Newport, 1999) making them more predictable to
the exposed listener. For example, a perfect cadence is found at the end of the vast majority of
Western classical music, where movement from dominant to tonic is the strongest form of
closure possible in this style. Through repeated exposure to this pattern, a dominant penultimate
chord strongly implies a tonic chord for an enculturated listener (Huron, 2006). IDyOM (Pearce,
2005) is a computational model of auditory expectation that harnesses the power of statistical
learning. It learns the frequencies of variable-order musical patterns from a large corpus of
music (via the long-term model, or LTM) and from the current piece of music being processed
(via the short-term model, or STM) in an unsupervised manner and generates probabilistic
predictions about the properties of the next note in a melody given the preceding melodic
context. The information content (negative log probability; IC) of an event, given the model,
reflects the unexpectedness of the event in context. Low information content corresponds to high
expectedness while high information content corresponds to low expectedness.
Temporal regularities are also learned through exposure (Cirelli, Spinelli, Nozaradan, &
Trainor, 2016; Hannon & Trehub, 2005; Hannon & Trehub, 2005a; Hannon, Soley, & Ullal,
2012). Western music is dominated by beat patterns in divisions of two, and to a lesser extent,
divisions of three, and compositional devices much as syncopation and hemiola (three beats in
the time of two) are used to manipulate listener’s temporal expectations. The dynamic attending
theory (Jones & Boltz, 1989) posits that entrainment to a beat results in attentional focus being
directed at time intervals where a beat is expected to occur, such that longer entrainment times
result in stronger predictions and more focused attention. This was supported using a pitch
discrimination task where participants performed better on pitch discrimination when target
pitches fell on expected time points, as a result of entrainment to a series of isochronous
EXPECTANCY AND MUSICAL EMOTION 8
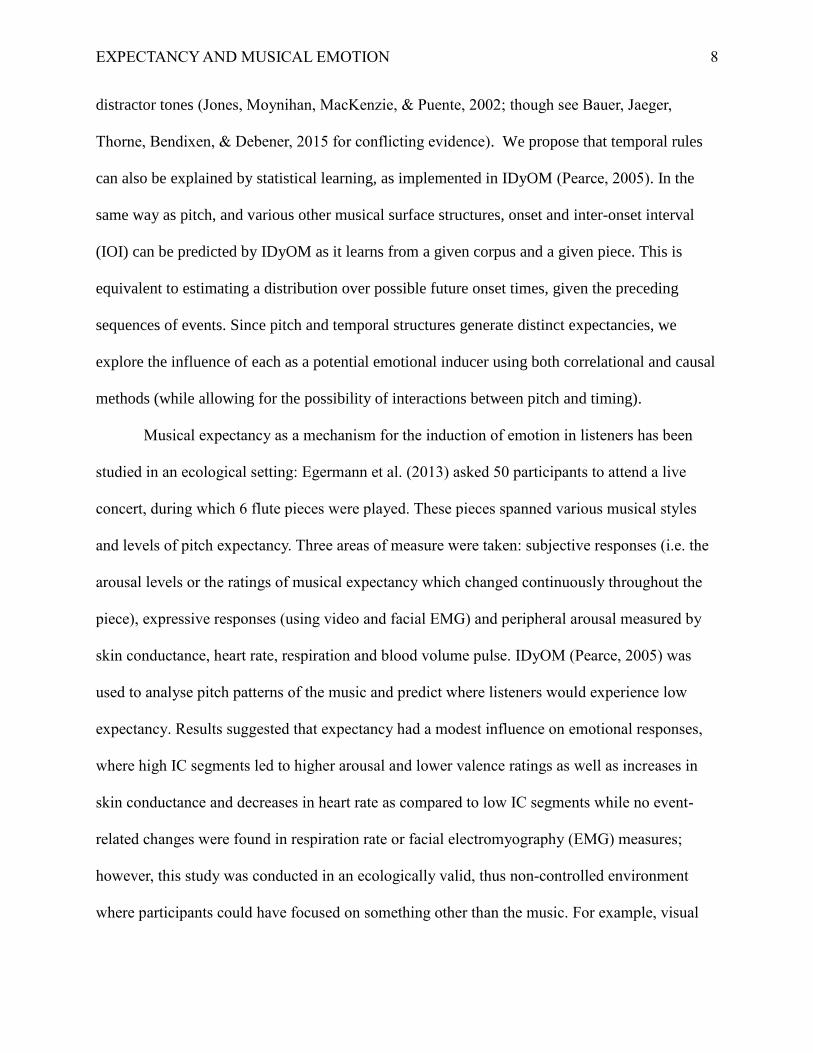
distractor tones (Jones, Moynihan, MacKenzie, & Puente, 2002; though see Bauer, Jaeger,
Thorne, Bendixen, & Debener, 2015 for conflicting evidence). We propose that temporal rules
can also be explained by statistical learning, as implemented in IDyOM (Pearce, 2005). In the
same way as pitch, and various other musical surface structures, onset and inter-onset interval
(IOI) can be predicted by IDyOM as it learns from a given corpus and a given piece. This is
equivalent to estimating a distribution over possible future onset times, given the preceding
sequences of events. Since pitch and temporal structures generate distinct expectancies, we
explore the influence of each as a potential emotional inducer using both correlational and causal
methods (while allowing for the possibility of interactions between pitch and timing).
Musical expectancy as a mechanism for the induction of emotion in listeners has been
studied in an ecological setting: Egermann et al. (2013) asked 50 participants to attend a live
concert, during which 6 flute pieces were played. These pieces spanned various musical styles
and levels of pitch expectancy. Three areas of measure were taken: subjective responses (i.e. the
arousal levels or the ratings of musical expectancy which changed continuously throughout the
piece), expressive responses (using video and facial EMG) and peripheral arousal measured by
skin conductance, heart rate, respiration and blood volume pulse. IDyOM (Pearce, 2005) was
used to analyse pitch patterns of the music and predict where listeners would experience low
expectancy. Results suggested that expectancy had a modest influence on emotional responses,
where high IC segments led to higher arousal and lower valence ratings as well as increases in
skin conductance and decreases in heart rate as compared to low IC segments while no event-
related changes were found in respiration rate or facial electromyography (EMG) measures;
however, this study was conducted in an ecologically valid, thus non-controlled environment
where participants could have focused on something other than the music. For example, visual

EXPECTANCY AND MUSICAL EMOTION 9
aspects of performance are highly important to emotional engagement in live music settings
(Thompson, Graham, & Russo, 2005; Vines, Krumhansl, Wanderley, & Levitin, 2006).
Furthermore, other potential emotion inducing mechanisms, as proposed by Juslin & Vastfjall
(2008) were not explicitly controlled for and effects of temporal expectancy on emotional
responses were not considered.
The current study is designed to investigate pitch and temporal musical expectancy in a
restricted environment which controlled for many other potential emotional mechanisms (Juslin
& Vastfjall, 2008). Brain stem reflexes are controlled for by maintaining equal tempo, intensity
and timbre across all musical excerpts. Evaluative conditioning and episodic memory are
controlled for by presenting unfamiliar musical excerpts, so that expectation ratings and
emotional reactions are not confounded by previous experience with the music. Potential effects
of emotional contagion are controlled for in the analysis by including pitch and IOI as predictors
of subjective ratings as well as pitch and IOI predictability (i.e. higher mean pitch and shorter
IOI could result in higher arousal and valence ratings, regardless of expectancy). Finally,
irrelevant visual imagery cannot be categorically avoided but the rating tasks are expected to
require enough cognitive load to render it unlikely. Furthermore, to the extent that visual imagery
is variable between individuals, averaging across participants should remove its influence.
This research aims to address three questions. First, do the predictability of pitch and
timing (as simulated by IDyOM) have an effect on listeners’ expectations and emotional state,
and can we causally influence this effect with explicit manipulation of the stimuli? We
hypothesize that the degree of musical expectancy for pitch (based on pitch interval) and
temporal (based on inter onset interval) structures, as predicted objectively by information
content provided by IDyOM, will have an effect on emotion as measured by the arousal-valence

EXPECTANCY AND MUSICAL EMOTION 10
model (Russell, 2003), where unexpected events will invoke negative valence and cause an
increase in arousal and expected events will invoke positive valence and decreased arousal. We
also hypothesize that when both pitch and timing are either expected or unexpected, the
emotional response will be more extreme than in conditions of mixed expectedness.
Furthermore, direct manipulation of pitch expectancy while keeping temporal expectancy and all
other musical features constant is expected to produce the predicted changes in ratings (i.e.
transforming unexpected pitches to expected pitches will decrease unexpectedness and arousal,
and increase valence ratings).
Second, how do pitch and timing predictability combine to influence expectation and
emotion? Though the combination of pitch and timing in music perception has been a research
interest for decades (Boltz, 1999; Duane, 2013; Jones, Boltz, & Kidd, 1982; Palmer &
Krumhansl, 1987; Prince, Thompson, & Schmuckler, 2009), no clear conclusions can be drawn
as findings regarding this question have low agreement and seem highly dependent on the choice
of stimuli, participants and paradigm. For example, while Prince et al. (2009) suggest that pitch
is more salient, results from Duane’s (2013) corpus analysis suggest that timing is the most
reliable predictor of streaming. While this study uses monophonic melodies, it could be argued
that if salience is linked to complexity (Prince et al., 2009), then for melodies where pitch or
timing are highly predictable (low complexity), the predictable feature will be more salient than
its unpredictable counterpart. For melodies where pitch and timing are relatively equally
predictable or unpredictable, their relative importance currently remains unknown.
Finally, is there a difference in the effect of pitch and timing predictability on expectation
and emotional responses between musicians and non-musicians? The effect of musical training
will be evaluated by comparing the responses of musicians and non-musicians, with the
EXPECTANCY AND MUSICAL EMOTION 11
expectation that musicians will have higher expectation ratings and more extreme emotional
responses to pitch and timing violations due to training (Strait, Kraus, Skoe & Ashley, 2009),
where Western musical patterns are more familiar, resulting in violations of these patterns
eliciting stronger responses.
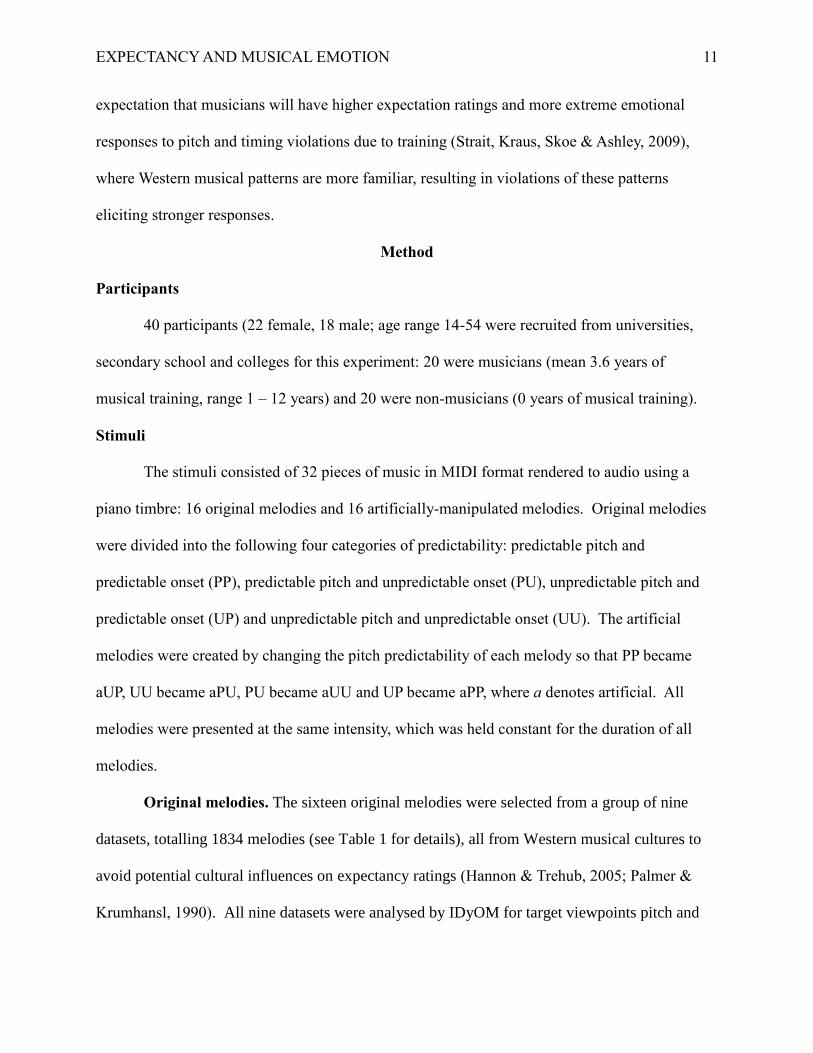
Method
Participants
40 participants (22 female, 18 male; age range 14-54 were recruited from universities,
secondary school and colleges for this experiment: 20 were musicians (mean 3.6 years of
musical training, range 1 – 12 years) and 20 were non-musicians (0 years of musical training).
Stimuli
The stimuli consisted of 32 pieces of music in MIDI format rendered to audio using a
piano timbre: 16 original melodies and 16 artificially-manipulated melodies. Original melodies
were divided into the following four categories of predictability: predictable pitch and
predictable onset (PP), predictable pitch and unpredictable onset (PU), unpredictable pitch and
predictable onset (UP) and unpredictable pitch and unpredictable onset (UU). The artificial
melodies were created by changing the pitch predictability of each melody so that PP became
aUP, UU became aPU, PU became aUU and UP became aPP, where a denotes artificial. All
melodies were presented at the same intensity, which was held constant for the duration of all
melodies.
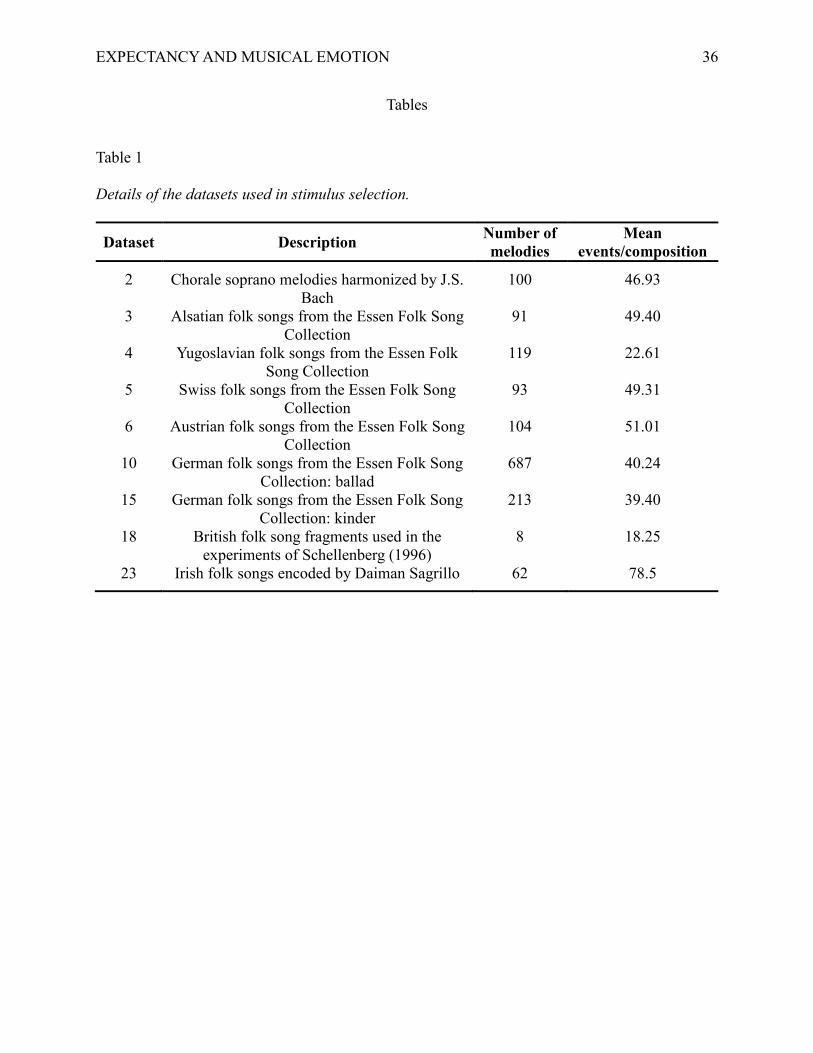
Original melodies. The sixteen original melodies were selected from a group of nine
datasets, totalling 1834 melodies (see Table 1 for details), all from Western musical cultures to
avoid potential cultural influences on expectancy ratings (Hannon & Trehub, 2005; Palmer &
Krumhansl, 1990). All nine datasets were analysed by IDyOM for target viewpoints pitch and

EXPECTANCY AND MUSICAL EMOTION 12
onset with source viewpoints pitch interval and scale degree (linked), and inter-onset-interval
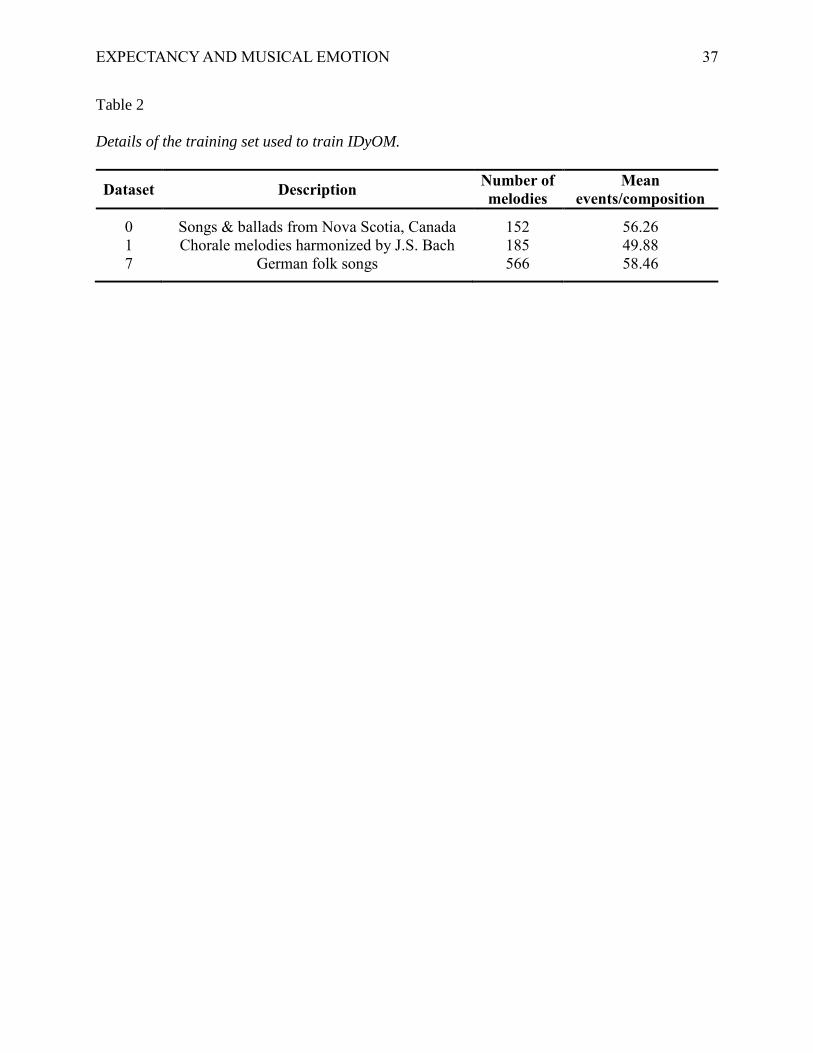
(IOI) respectively. Both STM and LTM models were engaged; the LTM model was trained on
three datasets of Western music, described in Table 2. There was no resampling within the test
datasets.
The 1834 melodies were divided into four categories based on high or low pitch or onset
information content (IC). Melodies were considered predictable if they had a lower IC than the
mean IC of all samples and unpredictable if the IC was greater than the mean IC of all samples.
Four melodies from each category were selected as the most or least predictable by finding
maximum and minimum IC values as appropriate for the category; these are the original sixteen
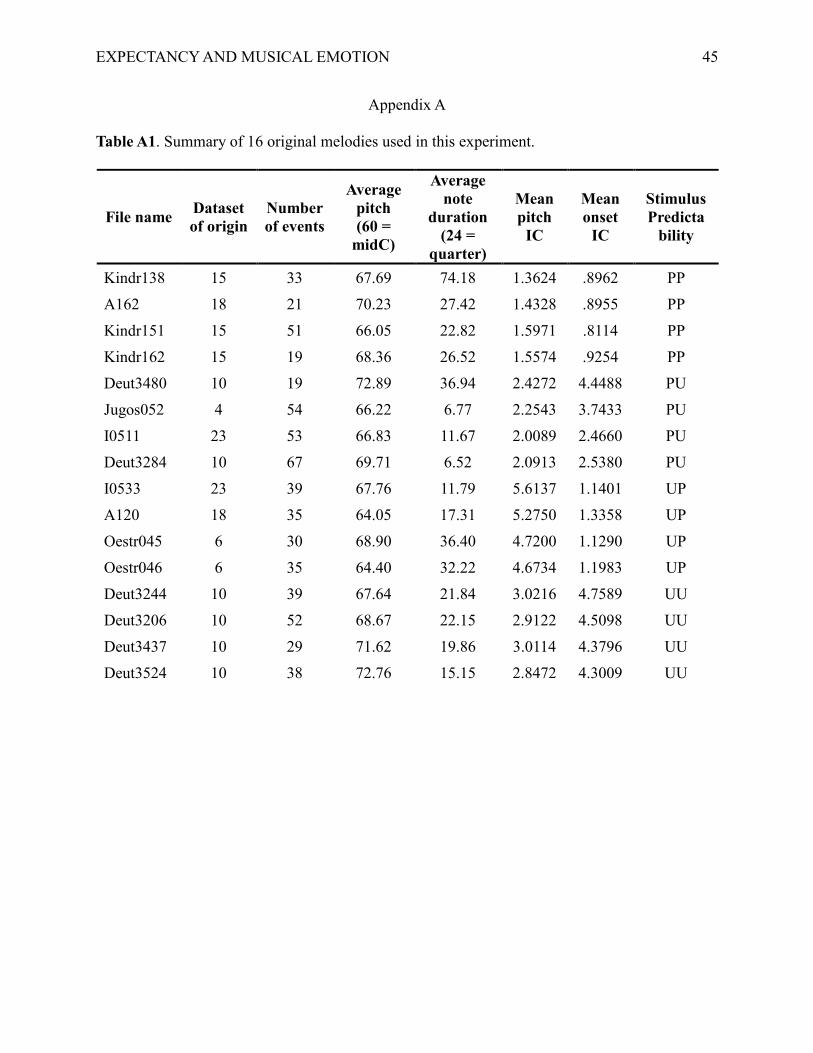
melodies. Melodies in the PP, PU, UP and UU categories had mean pitch IC values ranging from
1.37-1.85, 2.22-2.43, 2.83-5.24 and 2.61-2.78 respectively, mean onset IC values ranging
from .80-.92, 2.49-4.34, 1.13-1.32 and 4.20-4.39 respectively, mean raw pitch values ranging
from 66.85-70.17, 66.05-70.23, 68.67-72.76 and 64.40-71.63 respectively and mean IOI values
ranging from 12.71-21.28, 21.41-69.81, 13.84-21.69 and 21.53-64.00 respectively, where a
quarter note equals 24. Notice that categories with unpredictable onset have higher average IOI
values; this potential confound is discussed below (see Appendix A).
[Table 1]
[Table 2]
Artificial melodies.
The sixteen artificial melodies were created as follows. For each original melody, the
notes with the highest (for PP and PU) or lowest (for UP and UU) information content were
selected for replacement. The notes were replaced with another note from the same melody
which shares the same preceding note as the original note in that melody. If several instances of
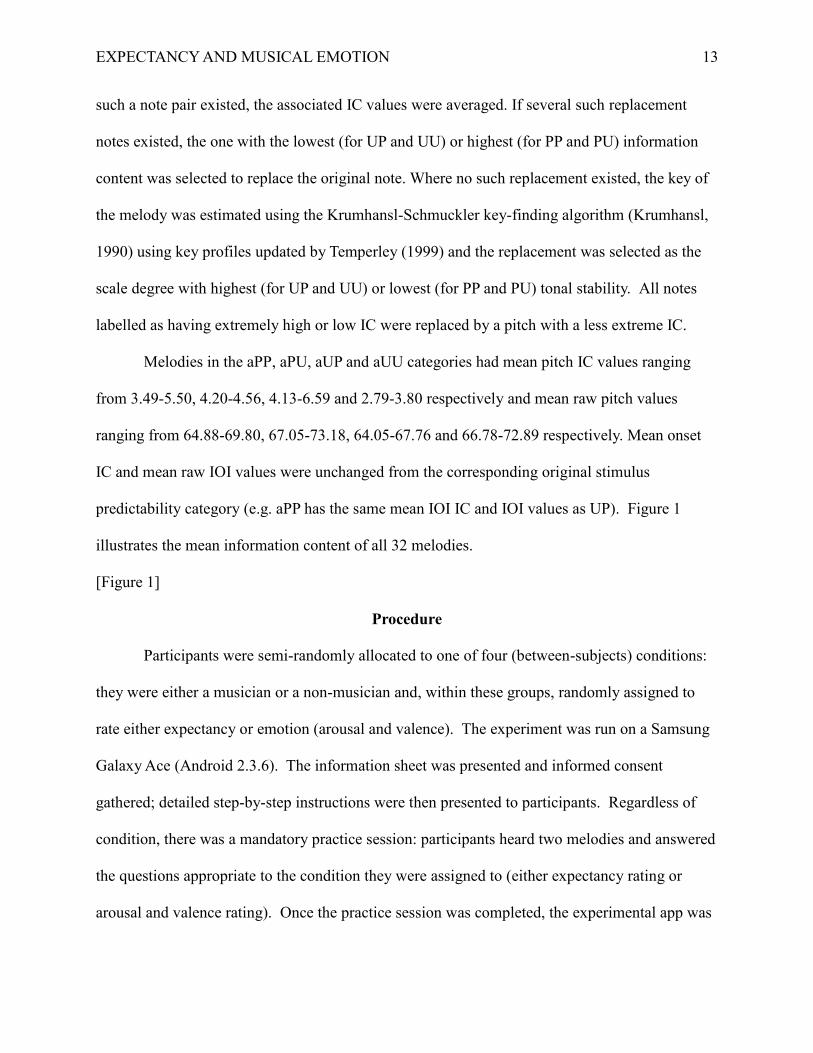
EXPECTANCY AND MUSICAL EMOTION 13
such a note pair existed, the associated IC values were averaged. If several such replacement
notes existed, the one with the lowest (for UP and UU) or highest (for PP and PU) information
content was selected to replace the original note. Where no such replacement existed, the key of
the melody was estimated using the Krumhansl-Schmuckler key-finding algorithm (Krumhansl,
1990) using key profiles updated by Temperley (1999) and the replacement was selected as the
scale degree with highest (for UP and UU) or lowest (for PP and PU) tonal stability. All notes
labelled as having extremely high or low IC were replaced by a pitch with a less extreme IC.
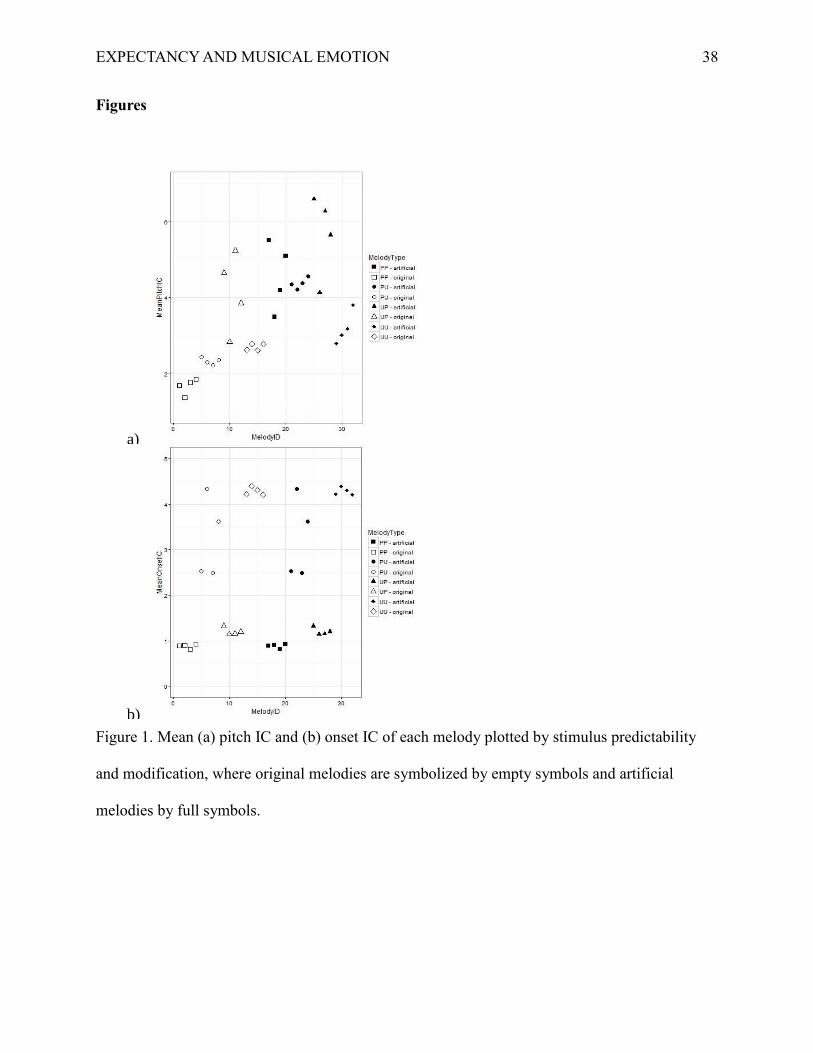
Melodies in the aPP, aPU, aUP and aUU categories had mean pitch IC values ranging
from 3.49-5.50, 4.20-4.56, 4.13-6.59 and 2.79-3.80 respectively and mean raw pitch values
ranging from 64.88-69.80, 67.05-73.18, 64.05-67.76 and 66.78-72.89 respectively. Mean onset
IC and mean raw IOI values were unchanged from the corresponding original stimulus
predictability category (e.g. aPP has the same mean IOI IC and IOI values as UP). Figure 1
illustrates the mean information content of all 32 melodies.
[Figure 1]
Procedure
Participants were semi-randomly allocated to one of four (between-subjects) conditions:
they were either a musician or a non-musician and, within these groups, randomly assigned to
rate either expectancy or emotion (arousal and valence). The experiment was run on a Samsung
Galaxy Ace (Android 2.3.6). The information sheet was presented and informed consent
gathered; detailed step-by-step instructions were then presented to participants. Regardless of
condition, there was a mandatory practice session: participants heard two melodies and answered
the questions appropriate to the condition they were assigned to (either expectancy rating or
arousal and valence rating). Once the practice session was completed, the experimental app was

EXPECTANCY AND MUSICAL EMOTION 14
loaded. Participants entered a unique ID number provided by the experimenter and responded to
a short musical background questionnaire. Participants then heard the 32 musical excerpts (mean
duration 18.34 s) presented in random order without pause or repeat and performed the
appropriate ratings by continuously moving a finger on the screen. Those in the expectancy
rating condition reported expectancy on a 7-point integer Likert scale, where 1 was very expected
and 7 was very unexpected. Those in the arousal/valence condition rated induced arousal
(vertical) and valence (horizontal) on a two-dimensional arousal/valence illustration (Russell,
2003). Responses, in integers, were collected at a 5Hz sample rate (200ms) (Khalfa et al., 2002).
The rating systems used were: Expectancy: 1 – 7 (expected - unexpected); Arousal: 0 – 230
(calm - stimulating); Valence: 0 - 230 (unpleasant – pleasant).
Statistical analysis
For each type of rating, a melody-level analysis was performed. For each melody, a mean
expectancy rating was calculated at every time point across the musician and non-musician
groups (10 responses per group). Linear multiple regression modelling was used to evaluate the
impact of time (point in time at sampling rate of 200ms), musical training (musician or non-
musician), stimulus modification (original or artificial), stimulus predictability
(predictable/unpredictable pitch/onset), pitch and IOI on mean expectancy ratings by comparing
a model with each predictor to a model containing only an intercept. Pitch and IOI are included
as predictors to control for potential confounding effects of musical contagion. While musical
training and stimulus modification were simple factors, contrasts were set for stimulus
predictability to compare all pairs of categories to each other. Interactions were not considered
due to the difficulty of interpretation in such a complex model.
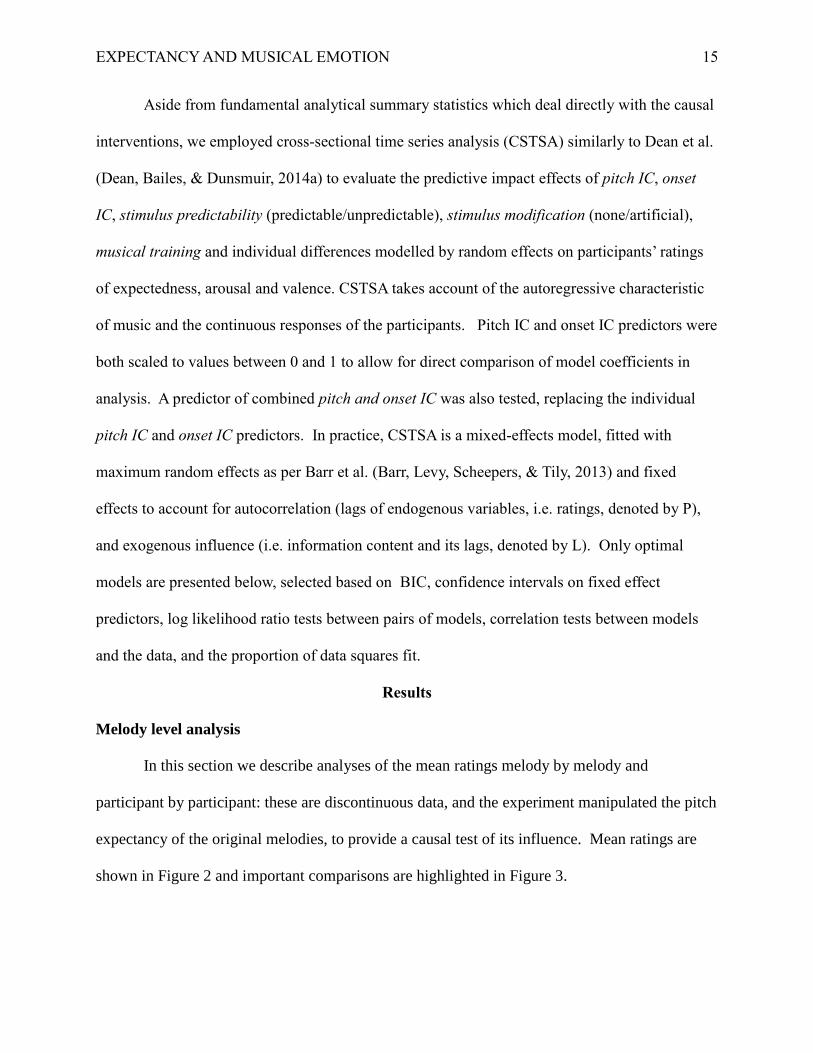
EXPECTANCY AND MUSICAL EMOTION 15
Aside from fundamental analytical summary statistics which deal directly with the causal
interventions, we employed cross-sectional time series analysis (CSTSA) similarly to Dean et al.
(Dean, Bailes, & Dunsmuir, 2014a) to evaluate the predictive impact effects of pitch IC, onset
IC, stimulus predictability (predictable/unpredictable), stimulus modification (none/artificial),
musical training and individual differences modelled by random effects on participants’ ratings
of expectedness, arousal and valence. CSTSA takes account of the autoregressive characteristic
of music and the continuous responses of the participants. Pitch IC and onset IC predictors were
both scaled to values between 0 and 1 to allow for direct comparison of model coefficients in
analysis. A predictor of combined pitch and onset IC was also tested, replacing the individual
pitch IC and onset IC predictors. In practice, CSTSA is a mixed-effects model, fitted with
maximum random effects as per Barr et al. (Barr, Levy, Scheepers, & Tily, 2013) and fixed
effects to account for autocorrelation (lags of endogenous variables, i.e. ratings, denoted by P),
and exogenous influence (i.e. information content and its lags, denoted by L). Only optimal
models are presented below, selected based on BIC, confidence intervals on fixed effect
predictors, log likelihood ratio tests between pairs of models, correlation tests between models
and the data, and the proportion of data squares fit.
Results
Melody level analysis
In this section we describe analyses of the mean ratings melody by melody and
participant by participant: these are discontinuous data, and the experiment manipulated the pitch
expectancy of the original melodies, to provide a causal test of its influence. Mean ratings are
shown in Figure 2 and important comparisons are highlighted in Figure 3.

EXPECTANCY AND MUSICAL EMOTION 16
Expectancy ratings. There were significant effects of time (F (1) = 742.01, p < .0001),
musical training where musicians rated melodies with higher unexpectedness (musicians mean =
4.40; non-musicians mean = 4.16; F (1) = 73.12, p < .0001), stimulus modification where
modified melodies were rated as more unexpected (original melodies mean = 3.92; modified
melodies mean = 4.65; F (1) = 569.75, p < .0001), and stimulus predictability where more
predictable melodies were rated with lower unexpectedness than unpredictable melodies (PP
melodies mean = 3.48; PU melodies mean = 4.71; UP melodies mean = 3.92; UU melodies mean
= 4.66; F (3) = 251.58, p < .0001) on mean expectancy ratings. We also investigated the effect of
stimulus predictability on ratings for original and modified melodies separately, where means for
PP, PU, UP and UU melodies were 1.88, 4.47, 3.58 and 5.19 respectively (F (3) = 1866.2, p
< .0001) and for aPP, aPU, aUP and aUU melodies were 4.27, 4.16, 5.29 and 4.96, respectively
(F (3) = 264.36, p < .0001). Pitch was not a significant predictor, F (1) = 1.37, p = .24, while IOI
was, F (1) = 22.04, p < .0001.
Arousal ratings. There were significant effects of time (F (1) = 127.32, p < .0001),
musical training where musicians rate melodies as more arousing overall as compared to non-
musicians (musicians mean = 118.16; non-musicians mean = 112.90; F (1) = 25.30, p < .0001),
stimulus predictability where more predictable melodies were rated as more arousing (PP
melodies mean = 151.73; PU melodies mean = 109.45; UP melodies mean = 128.86; UU
melodies mean = 95.95; F (3) = 667.31, p < .0001), pitch (F (1) = 62.95, p < .0001) and IOI (F
(1) = 6.59, p = .01). There was no effect of stimulus modification (original melodies mean =
115.83; modified melodies mean = 115.27; F (1) = .62, p = .42). Stimulus predictability was also
a significant predictor when original and artificial melodies’ ratings were investigated separately,
with ratings for PP, PU, UP and UU melodies averaging 138.62, 111.14, 121.07 and 100.79

EXPECTANCY AND MUSICAL EMOTION 17
respectively, F (3) = 210.16, p < .0001, and aPP, aPU, aUP and aUU melodies averaging 137.10,
91.56 144.96 and 107.83, respectively, F (3) = 556.76, p < .0001.
Valence ratings. There were significant effects of time (F (1) = 6.29, p = .01), musical
training where musicians overall rated melodies as having lower valence (musicians mean =
81.26; non-musicians mean = 84.08; F (1) = 5.38, p = .02), stimulus modification where original
melodies had more positive valence than artificial melodies (original melodies mean = 91.20;
artificial melodies mean = 74.33; F (1) = 206.84, p < .0001), stimulus predictability where more
predictable melodies are rated more positively than unpredictable melodies (PP melodies mean =
109.87; PU melodies mean = 74.00; UP melodies mean = 87.00; UU melodies mean = 70.02; F
(3) = 224.81, p < .0001), pitch (F (1) = 44.79, p < .0001), and IOI (F (1) = 210.44, p < .0001).
Stimulus predictability is also a significant predictor when investigating original and artificial
melodies separately, where PP, PU, UP and UU melodies have mean arousal ratings of 171.90,
77.96, 94.59 and 44.46 respectively, F (3), 1582.6, p < .0001 and aPP, aPU, aUP and aUU
melodies have mean ratings of 78.98, 93.21, 45.66 and 70.19 respectively, F (3) = 276.84, p
< .0001.
[Figure 2]
[Figure 3]
Cross-sectional time series analysis
Here we present the analyses of the continuous time series data resulting from
participants’ ongoing responses during listening to the melodies.
Expectancy, arousal and valence ratings were modelled separately using mixed-effects
autoregressive models with random intercepts on participant ID and melody ID as well as
random slopes on the fixed effect predictor with the largest coefficient before slopes were added.

EXPECTANCY AND MUSICAL EMOTION 18
Fixed effects predictors were time, musical training, stimulus predictability, stimulus
modification, autoregressive lags of up to 15 (equivalent of 3 seconds) and exogenous lags of
pitch and onset information content of up to 15. A combined pitch and onset information
predictor was also tested to evaluate whether a combined measure superseded the separate pitch
and onset information content predictors. Maximum lags were selected based on previously
reported rate of change of emotional responses (Juslin & Västfjäll, 2008) as well as precedent in
this type of analysis (Dean et al., 2014a). Pitch and IOI were subsequently added as fixed-effect
predictors to investigate the potential confounding effects of musical structure affecting ratings
through an emotional contagion mechanism. See figures 4 and 5 for an illustration of the
variance fitted by random effects, and the fit of the models for a selection of melodies and
participants.
Expectancy ratings. The best CSTSA model for expectancy ratings is summarized in
Table B1 in Appendix B. In this model, while autoregression and random effects were duly
considered, an effect of musicianship was still clearly observed in addition to pitch IC and onset
IC and a selection of their lags. Thus the model included random intercepts and random slopes
for L1pitchIC on melody ID and participant ID as well as fixed effects of musicianship, L = 0-1,
7-8 of pitch IC, L = 0-2, 10, 12 of onset IC and P = 1-2, 4-6, 15 of autoregression. All predictors
were significant, as Wald 95% confidence intervals did not include zero. The addition of
stimulus predictability as a fixed effect did not improve the model, χ2 (3) = 1.80, p = .61 while
musicianship and stimulus modification did, χ2 (2) = 13.36, p = .001 and χ2 (1) = 3.91, p = .04
respectively. The further addition of pitch and IOI significantly improved the model, χ2 (2) =
409.33, p < .0001, and removed stimulus modification as a significant predictor. Combined pitch
EXPECTANCY AND MUSICAL EMOTION 19
and onset information content with lags of pitch and onset from the best model outlined above
was significantly worse, χ2 (6) = 972.6, p < .0001.
A correlation test between the data and the model is highly significant, with
correlation .93, t (82486) = 783.09, p < .0001. A proportion of data squares fit test is also high,
with the model explaining 98% of the data. While this particular model did not converge, a
model without random slopes removed did converge where all fixed effects were significant,
model fit was equally good (correlation test: .93, t (82486) = 780.53, p < .0001; proportion of
data squares fit: 98%) and the inclusion of slopes improved the model significantly; therefore
random slopes were reinserted into the best model as per the experimental design (Barr et al.,
2013).
Arousal ratings. The best CSTSA model for arousal ratings is summarized in Table B2
in Appendix B. This model revealed stimulus predictability as a significant predictor of arousal
ratings in addition to pitch IC and onset IC and a selection of their lags when autoregression and
random effects were considered. The model included random intercepts and random slopes for
L1onsetIC on melody ID and participant ID as well as fixed effects L = 0-1, 6-8, 10-13, 15 of
pitch IC, L = 0-4, 7, 10, 12-15 of onset IC and P = 1, 3, 5-6, 15 of autoregression. All predictors
were significant, as Wald 95% confidence intervals did not include zero. The addition of
musicianship and stimulus modification as fixed effects did not improve the model, χ2 (2) = .60,
p = .74 and χ2 (2) = 1.72, p = .42 respectively while stimulus predictability did, χ2 (2) = 14.91, p
= .0005. The further addition of pitch and IOI significantly improved the model, χ2 (2) = 178.89,
p < .0001, where both are significant predictors of arousal ratings. Combined pitch and onset
information content with lags of pitch and onset from the best model outlined above was
significantly worse, χ2 (13) = 4482.2, p < .0001.

EXPECTANCY AND MUSICAL EMOTION 20
A correlation test between the data and the model is highly significant, with
correlation .96, t (80183) = 978.48, p < .0001. A proportion of data squares fit test is also high,
with our model explaining 98% of the data. While this particular model did not converge, a
model without random slopes removed did converge where all fixed effects were significant,
model fit was equally good (correlation test: .95, t (80183) = 959.73, p < .0001; proportion of
data squares fit: 98%) and the inclusion of slopes improved the model significantly, χ2 (5) =
335.3, p < .0001; therefore random slopes were reinserted into the best model as per the
experimental design (Barr et al., 2013).
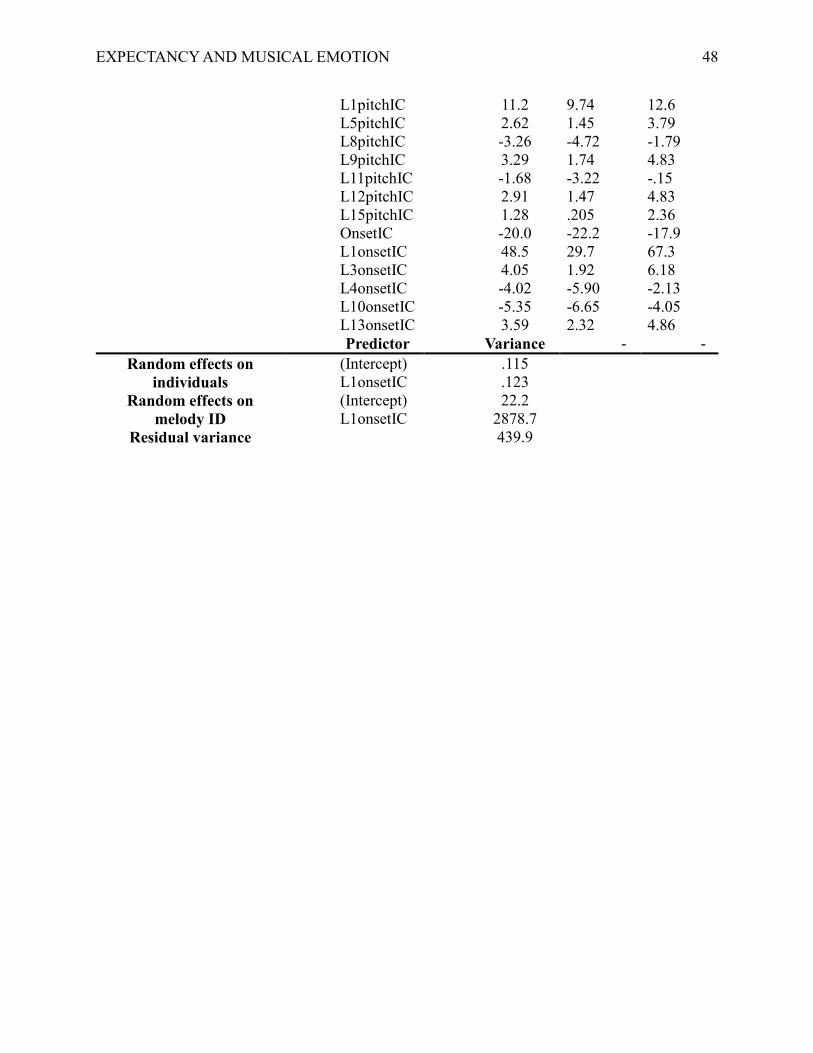
Valence ratings. The best CSTSA model for valence ratings is summarized in Table B3
in Appendix B. This model revealed significant effects of only pitch IC and onset IC and a
selection of their lags when autoregression and random effects were considered. The model
included random intercepts and random slopes for L1onsetIC on melody ID and participant ID as
well as fixed effects L = 0-1, 5, 8-9, 11-13, 15 of pitch IC, L = 0-1, 3-4, 10, 13 of onset IC and P
= 0, 3-7, 9, 15 of autoregression. All predictors were significant, as Wald 95% confidence
intervals did not include zero. The addition of musicianship, stimulus predictability and
modification as fixed effects did not improve the model, χ2 (1) = .29, p = .58, χ2 (3) = 4.77, p
= .18 and χ2 (1) = 3.46, p = .06 respectively. The further addition of pitch and IOI significantly
improved the model, χ2 (1) = 600.99, p < .0001, where both are significant predictors of arousal
ratings. Combined pitch and onset information content with lags of pitch and onset from the best
model outlined above was significantly worse, χ2 (10) = 194.72, p < .0001.
A correlation test between the data and the model is highly significant, with
correlation .94, t (80183) = 827.83, p < .0001. A proportion of data squares fit test is also high,
with our model explaining 98% of the data. While this particular model did not converge, a
EXPECTANCY AND MUSICAL EMOTION 21
model without random slopes removed did converge where all fixed effects were significant,
model fit was equally good (correlation test: .94, t (80183) = 959.73, p < .0001; proportion of
data squares fit: 95%) and the inclusion of slopes improved the model significantly, χ2 (4) =
805.25, p < .0001; therefore random slopes were reinserted into the best model as per the
experimental design (Barr et al., 2013).
[Figure 4]
[Figure 5]
Discussion
The results provide answers to all three of our research questions. First, we find evidence
that predictability of both pitch and temporal musical structure have an effect on listeners’
expectancies and emotional reactions, and that these can be manipulated. Second, we find that
temporal expectancy influences perception more strongly than pitch expectancy. Finally, we find
that individual differences generally supersede effects of musical training (Dean et al., 2014a)
and inter-melody differences were more substantial than differences between melody
predictability groups (PP, UP, PU and UU) or manipulation type, where differences between
predictability groups could nevertheless be detected in the discontinuous, melody-level analysis.
Using IDyOM (Pearce, 2005) to calculate average pitch and onset information content,
we classified folk songs into four categories based on overall expectedness, where average pitch
expectancy and average onset expectancy could be high or low. We also manipulated pitch
expectancy to transform expected pitches into unexpected ones, and vice versa. The four melody
categories resulted in different subjective ratings of expectancy, arousal and valence, where high
pitch and onset information content (PP) resulted in high unexpectedness ratings, higher arousal
and lower valence, low pitch and onset information content (UU) resulted in low unexpectedness
EXPECTANCY AND MUSICAL EMOTION 22
ratings, lower arousal and higher valence, and mixed high and low pitch and onset information
content (PU and UP) lay somewhere in between, where only the predictable pitch and onset (PP)
and unpredictable pitch and predictable onset (UP) categories were not different from each other
in arousal ratings. This confirms previous evidence that statistical learning and information
content may influence listener expectancies (Pearce, Ruiz, Kapasi, Wiggins, & Bhattacharya,
2010; Pearce & Wiggins, 2006) and arousal and valence ratings of music (Egermann et al.,
2013). Cross-sectional time series analysis support these results with excellent models
explaining between 93-96% of expectancy, arousal and valence ratings, all including pitch and
onset information content, and lags of these of up to 3s (Egermann et al., 2013) as predictors. We
additionally find that explicit causal manipulation of pitch expectancy – the modification of
selected pitches from high to low or from low to high expectancy – results in a change in ratings
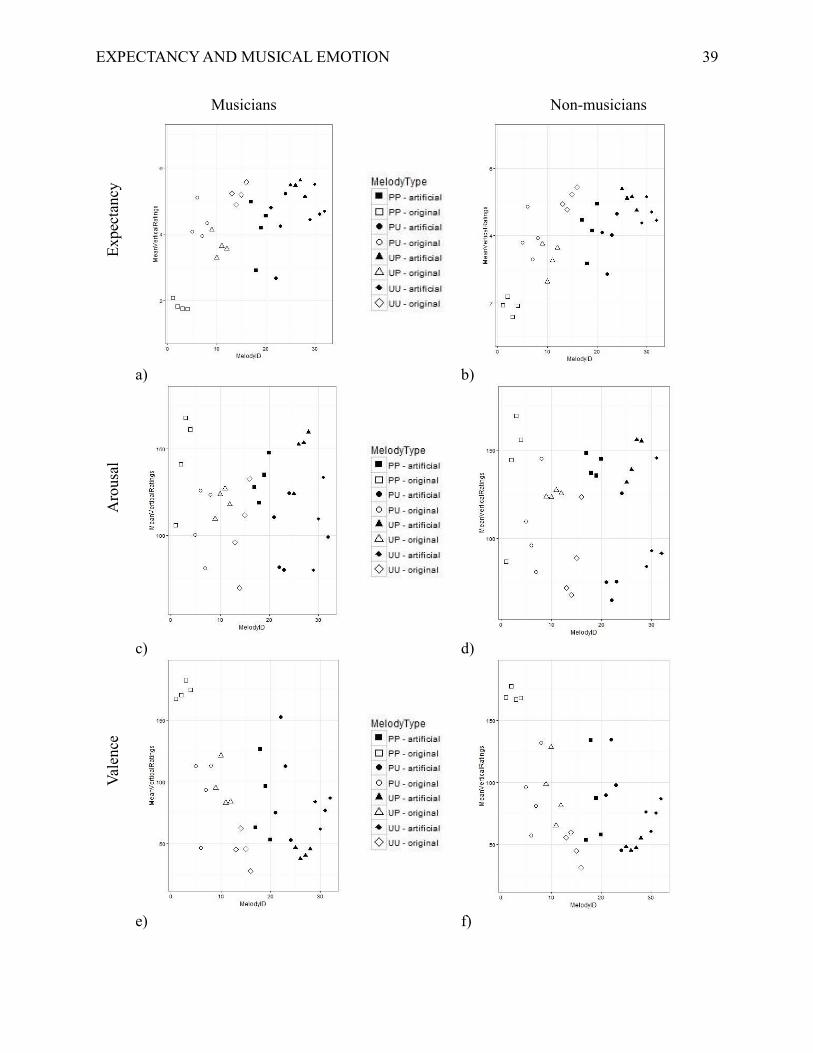
in the expected direction. For example, melodies transformed into the UP category (filled
triangle in Figure 2) are rated with higher unexpectedness ratings and lower valence than their
original PP counterparts (hollow square in Figure 2), yet are also different from the original UP
category (hollow triangle in Figure 2) melodies. This effect is more pronounced for
expectedness and valence ratings than for arousal ratings, which can be explained by the
intentionally inexpressive nature of the stimuli. Therefore, the manipulation of pitch expectancy
adds causal evidence to previous research by demonstrating a direct link between expectancy
manipulation and expectancy, arousal and valence ratings.
CSTSA also allows us to assess the relative contribution of pitch and onset information
content to expectancy, arousal and valence ratings. We find that onset information content
coefficients are almost always approximately 1.1 to 4.3 times larger than pitch information
content coefficients for exactly (i.e. L1pitchIC and L1onsetIC) or loosely (i.e. L5pitchIC and

EXPECTANCY AND MUSICAL EMOTION 23
L6onsetIC) matching lags. Furthermore, the sum of onset IC lag coefficients is far greater than
the sum of pitch IC lag coefficients for arousal and valence rating models, while the sum of pitch
IC lag coefficients is greater than onset IC lag coefficients for the expectancy ratings model
(though absolute values of individual onset IC coefficients are greater than the pitch IC
coefficients). Incidentally, every model includes pitch IC and onset IC lags of 0 and 1, with little
overlap beyond this, suggesting that processing time scales for both pitch and onset expectancy
are similar soon after a particular note event and diverge after this. This variation in time scales
could also explain why a combined pitch and onset IC predictor did not replace the separate pitch
IC and onset IC predictors.
Though analysis of mean ratings yielded a main effect of musical training, the amount of
variance explained by musical background was superseded by the amount of variance explained
by random effects on participant ID for arousal and valence ratings, indicating that though
groups can be formed, individual strategies are more important to explain these ratings. Though
a large body of literature supports the existence of certain differences between musicians and
non-musicians (Brattico, Näätänen, & Tervaniemi, 2001; Carey et al., 2015; Fujioka, Trainor,
Ross, Kakigi, & Pantev, 2004; Granot & Donchin, 2002), similar research by Dean et al. (Dean
et al., 2014a; Dean, Bailes, & Dunsmuir, 2014b) has also found that though there were
differences between groups, individual differences explain more variance than musical
background when rating arousal and valence of electroacoustic and piano music. However,
musical background did hold important predictive power for expectancy ratings, where
musicians gave slightly higher ratings overall, showing greater unexpectedness. Though one
might at first expect musicians to have lower expectancy ratings overall due to expertise with
musical patterns, the alternative is possible when considering work by Hansen & Pearce (2014),

EXPECTANCY AND MUSICAL EMOTION 24
who present evidence that musicians make more specific predictions (i.e., predictions that are
lower in entropy or uncertainty) than non-musicians when listening to music. It is possible that
due to these more specific predictions, any violations were perceived as more unexpected, as
opposed to the less specific predictions of a non-musician, which would result in less surprise
when violated. That being said, it is worth noting that the overall difference in ratings between
musicians and non-musicians is small, with musicians’ ratings being only .2 points higher.
Similarly, we found that the differences between individual melodies, as modelled by
random intercepts and slopes on Melody ID, outweigh categories of stimulus predictability and
stimulus modification in all but two cases: expectancy ratings, where stimulus modification was
a significant predictor, and arousal ratings, where stimulus predictability was a significant
predictor, such that PP > UP > PU > UU in terms of arousal ratings. The predictive power of
stimulus modification in the context of expectancy ratings can be explained by the overall higher
pitch IC in artificial melodies, as shown in Figure 2. This is likely due to the fact that the
modifications were made by an algorithm and are therefore not as smooth as human-composed
changes might have been. As the original melodies already had relatively low IC, it would be
difficult to keep mean IC as low or lower with the change of even one note, as this change could
also have an effect on the IC of all subsequent notes in a given melody.
As for the importance of predictability in predicting arousal ratings, which was in the
opposite direction to what was predicted based on previous empirical (Egermann et al., 2013;
Steinbeis et al., 2006) and theoretical (Meyer, 1956;Huron, 2006) research, this could be
explained by the potentially confounding effect of duration on ratings. Our analysis revealed that
note duration did indeed have a significant effect on ratings, where melodies with longer
durations, corresponding to low onset expectancy, were rated as more unexpected, less arousing
EXPECTANCY AND MUSICAL EMOTION 25
and less pleasant. The pattern of mean arousal ratings by stimulus predictability, with PP and UP
(high onset expectancy) rated as more arousing than PU and UU (low onset expectancy) matches
this interpretation, which is further supported by previous research establishing a positive
correlation between tempo and arousal (Carpentier & Potter, 2007; Husain, Thompson, &
Schellenberg, 2002). The significant effect of pitch on ratings is more surprising; a pattern of
higher average pitch for PP and UP categories corresponds to lower unexpectedness ratings,
higher arousal ratings and higher valence ratings for these categories as compared to PU and UU
categories. However, coefficients for pitch and IOI are smaller than almost all other predictors in
expectancy, arousal and valence models, suggesting that their overall influence is minimal
compared to pitch and onset IC on subjective expectancy and emotion responses.
Also similarly to Dean et al. (2014a), the use of CSTSA allows us to evaluate evidence
for the presence of a common perceptual mechanism across all pieces of music heard. To do
this, predictors encoding melodies by stimulus predictability and modification were added to the
basic models, where a null effect of these additional predictors would indicate that the type of
melody does not matter and the listeners’ ratings depend only on pitch and onset IC in all
melodies. In the case of valence ratings, neither stimulus predictability nor stimulus
modification were found to provide any additional predictive power to the model, while stimulus
modification was a helpful predictor for expectancy ratings and stimulus predictability for
arousal ratings. However, explanations were proposed for these results and we maintain that our
data provides some support for a common perceptual mechanism across all melodies.
Relative salience
The question of relative perceptual weighting between musical parameters such as pitch, timing,
structure, and harmony in music cognition is important but challenging and lacks a unified
EXPECTANCY AND MUSICAL EMOTION 26
explanation (Dibben, 1999; Esber & Haselgrove, 2011; Prince et al., 2009; Uhlig, Fairhurst, &
Keller, 2013). Generally, pitch or melody is considered the most salient aspect of a piece of
music. Prince et al. (2009), for example, argue that there are many more possible pitches than
there are rhythmic durations or chords; therefore, pitch takes more attentional resources to
process and is more salient. On the other hand, in a corpus analysis of eighteenth- and
nineteenth-century string quartets, Duane (2013) found that onset and offset synchrony were the
most important predictors of streaming perception of these string quartets, with pitch explaining
half the variance that onset and offset synchrony did, and harmonic overlap explaining an almost
insignificant amount. Our results indicate that onset information content is more salient than
pitch information content, though here we evaluate the perception of emotion alongside the
subjective experience of expectancy, as opposed to auditory streaming. Interestingly, work in
cue salience outside of music explores the effect of predictability and uncertainty on salience
(Esber & Haselgrove, 2011), with one model predicting increased salience for cues with high
predictability (Mackintosh, 1975) and another model predicting increased salience for cues with
high uncertainty (Pearce & Hall, 1980). Though contradictory, these models have each
accumulated significant evidence and have more recently led to the development of both hybrid
(Pearce & Mackintosh, 2010) and new unified models of cue salience (Esber & Haselgrove,
2011). We considered the possibility that high and low uncertainty and pitch and onset lag
coefficients interacted so that melodies with high pitch predictability (expectancy) and low onset
predictability (PU) led to larger pitch IC coefficients than onset IC coefficients, and vice versa.
This effect was not found in the data (see Appendix C), so we conclude that in this particular
paradigm, onset is the more salient cue overall.
A mechanism for emotional induction
EXPECTANCY AND MUSICAL EMOTION 27
Returning to the identified lack of research into specific mechanisms for emotional induction by
music (Juslin & Västfjäll, 2008; Meyer, 1956), the present research makes a single but
significant step towards isolating individual mechanisms. The study explicitly controlled for
four of the six proposed mechanisms and manipulated one while considering another as a
covariate. Brain stem reflexes, evaluative conditioning, episodic memory and visual imagery are
controlled for by presenting novel stimuli with equal tempo, intensity and timbre alongside a
rating task. Emotional contagion, information conveyed by musical structure itself, was
addressed by including pitch and duration values into our CSTSA models of the expectancy,
arousal and valence ratings. Though these were significant predictors, they carried less weight
than the lags of information content predictors. We examined musical expectancy by selecting
stimuli with either high or low pitch and onset expectancy and additionally explicitly
manipulated pitch expectancy, finding evidence for a consistent effect of pitch and onset
expectancy on ratings of arousal and valence by musicians and non-musicians. We additionally
find that onset is more salient than pitch and that musicians give higher unexpected ratings than
non-musicians, but group differences are overridden by individual differences on emotion
ratings. Potential future work includes the use of stimuli at less extreme ends of the expectancy
spectrum to validate these findings, manipulating onset IC in addition to pitch IC, allowing the
evaluation of dependencies between the two (see Palmer & Krumhansl, 1987), exploring
interactions of predictability and entropy on salience cues in emotion ratings and investigating
other potential emotional induction mechanisms in a similarly controlled way, working towards
an integrated model of musical emotion induction and perception.

EXPECTANCY AND MUSICAL EMOTION 28
References
Barr, D. J., Levy, R., Scheepers, C., & Tily, H. J. (2013). Random effects structure for
confirmatory hypothesis testing: Keep it maximal. Journal of Memory and Language,
68(3). https://doi.org/10.1016/j.jml.2012.11.001
Bauer, A.-K. R., Jaeger, M., Thorne, J. D., Bendixen, A., & Debener, S. (2015). The auditory
dynamic attending theory revisited: A closer look at the pitch comparison task. Brain
Research, 1626, 198–210. https://doi.org/10.1016/j.brainres.2015.04.032
Bittman, B., Croft, D. T., Brinker, J., van Laar, R., Vernalis, M. N., & Ellsworth, D. L. (2013).
Recreational music-making alters gene expression pathways in patients with coronary
heart disease. Medical Science Monitor : International Medical Journal of Experimental
and Clinical Research, 19, 139–147. https://doi.org/10.12659/MSM.883807
Boltz, M. G. (1999). The processing of melodic and temporal information: independent or
unified dimensions? Journal of New Music Research, 28(1), 67–79.
Brattico, E., Näätänen, R., & Tervaniemi, M. (2001). Context effects on pitch perception in
musicians and nonmusicians: evidence from event-related-potential recordings. Music
Perception: An Interdisciplinary Journal, 19(2), 199–222.
https://doi.org/10.1525/mp.2001.19.2.199
Carey, D., Rosen, S., Krishnan, S., Pearce, M. T., Shepherd, A., Aydelott, J., & Dick, F. (2015).
Generality and specificity in the effects of musical expertise on perception and cognition.
Cognition, 137, 81–105. https://doi.org/10.1016/j.cognition.2014.12.005
Carlsen, J. C. (1981). Some factors which influence melodic expectancy. Psychomusicology: A
Journal of Research in Music Cognition, 1(1), 12–29. https://doi.org/10.1037/h0094276
EXPECTANCY AND MUSICAL EMOTION 29
Carpentier, F. R. D., & Potter, R. F. (2007). Effects of Music on Physiological Arousal:
Explorations into Tempo and Genre. Media Psychology, 10(3), 339–363.
https://doi.org/10.1080/15213260701533045
Castillo-Pérez, S., Gómez-Pérez, V., Velasco, M. C., Pérez-Campos, E., & Mayoral, M.-A.
(2010). Effects of music therapy on depression compared with psychotherapy. The Arts in
Psychotherapy, 37(5), 387–390. https://doi.org/10.1016/j.aip.2010.07.001
Cirelli, L. K., Spinelli, C., Nozaradan, S., & Trainor, L. J. (2016). Measuring Neural Entrainment
to Beat and Meter in Infants: Effects of Music Background. Auditory Cognitive
Neuroscience, 229. https://doi.org/10.3389/fnins.2016.00229
Collins, T., Laney, R., Willis, A., & Garthwaite, P. H. (2011). Modeling pattern importance in
Chopin’s Mazurkas. Music Perception, 28(4), 387–414.
https://doi.org/10.1525/mp.2011.28.4.387
Dean, R. T., Bailes, F., & Dunsmuir, W. T. M. (2014a). Shared and distinct mechanisms of
individual and expertise-group perception of expressed arousal in four works. Journal of
Mathematics and Music, 8(3), 207–223. https://doi.org/10.1080/17459737.2014.928753
Dean, R. T., Bailes, F., & Dunsmuir, W. T. M. (2014b). Time series analysis of real-time music
perception: approaches to the assessment of individual and expertise differences in
perception of expressed affect. Journal of Mathematics and Music, 8(3), 183–205.
https://doi.org/10.1080/17459737.2014.928752
Dibben, N. (1999). The Perception of Structural Stability in Atonal Music: The Influence of
Salience, Stability, Horizontal Motion, Pitch Commonality, and Dissonance. Music
Perception: An Interdisciplinary Journal, 16(3), 265–294.
https://doi.org/10.2307/40285794
EXPECTANCY AND MUSICAL EMOTION 30
Duane, B. (2013). Auditory Streaming Cues in Eighteenth- and Early Nineteenth-Century String
Quartets: A Corpus-Based Study. Music Perception: An Interdisciplinary Journal, 31(1),
46–58. https://doi.org/10.1525/mp.2013.31.1.46
Egermann, H., Pearce, M. T., Wiggins, G. A., & McAdams, S. (2013). Probabilistic models of
expectation violation predict psychophysiological emotional responses to live concert
music. Cognitive, Affective, & Behavioral Neuroscience, 13(3), 533–553.
https://doi.org/10.3758/s13415-013-0161-y
Esber, G. R., & Haselgrove, M. (2011). Reconciling the influence of predictiveness and
uncertainty on stimulus salience: a model of attention in associative learning.
Proceedings of the Royal Society of London B: Biological Sciences, 278(1718), 2553–
2561. https://doi.org/10.1098/rspb.2011.0836
Fujioka, T., Trainor, L. J., Ross, B., Kakigi, R., & Pantev, C. (2004). Musical training enhances
automatic encoding of melodic contour and interval structure. Journal of Cognitive
Neuroscience, 16(6), 1010–1021. https://doi.org/10.1162/0898929041502706
Gingras, B., Pearce, M. T., Goodchild, M., Dean, R. T., Wiggins, G., & McAdams, S. (2016).
Linking melodic expectation to expressive performance timing and perceived musical
tension. Journal of Experimental Psychology. Human Perception and Performance,
42(4), 594–609. https://doi.org/10.1037/xhp0000141
Granot, R., & Donchin, E. (2002). Do Re Mi Fa Sol La Ti—Constraints, Congruity, and Musical
Training: An Event-Related Brain Potentials Study of Musical Expectancies. Music
Perception: An Interdisciplinary Journal, 19(4), 487–528.
https://doi.org/10.1525/mp.2002.19.4.487

EXPECTANCY AND MUSICAL EMOTION 31
Hannon, E. E., Soley, G., & Ullal, S. (2012). Familiarity Overrides Complexity in Rhythm
Perception: A Cross-Cultural Comparison of American and Turkish Listeners. Journal of
Experimental Psychology: Human Perception and Performance, 38, 543–548.
Hannon, E. E., & Trehub, S. E. (2005a). Metrical categories in infancy and adulthood.
Psychological Science, 16, 48–55.
Hannon, E. E., & Trehub, S. E. (2005). Tuning in to musical rhythms: Infants learn more readily
than adults. Proceedings of the National Academy of Sciences of the United States of
America, 102(35), 12639–12643. https://doi.org/10.1073/pnas.0504254102
Hansen, N. C., & Pearce, M. T. (2014). Predictive uncertainty in auditory sequence processing.
Frontiers in Psychology, 5. https://doi.org/10.3389/fpsyg.2014.01052
Huron, D. (2001). What is a musical feature? Music Theory Online, 7(4).
Huron, D. (2006). Sweet anticipation: Music and the psychology of expectation. Cambridge,
MA, US: The MIT Press.
Husain, G., Thompson, W. F., & Schellenberg, E. G. (2002). Effects of Musical Tempo and Mode
on Arousal, Mood, and Spatial Abilities. Music Perception: An Interdisciplinary Journal,
20(2), 151–171. https://doi.org/10.1525/mp.2002.20.2.151
Jones, M. R., & Boltz, M. (1989). Dynamic attending and responses to time. Psychological
Review, 96(3), 459–491. https://doi.org/10.1037/0033-295X.96.3.459
Jones, M. R., Boltz, M., & Kidd, G. (1982). Controlled attending as a function of melodic and
temporal context. Perception & Psychophysics, 32(3), 211–218.
https://doi.org/10.3758/BF03206225
EXPECTANCY AND MUSICAL EMOTION 32
Jones, M. R., Moynihan, H., MacKenzie, N., & Puente, J. (2002). Temporal Aspects of Stimulus-
Driven Attending in Dynamic Arrays. Psychological Science, 13(4), 313–319.
https://doi.org/10.1111/1467-9280.00458
Juslin, P. N., & Sloboda, J. A. (Eds.). (2001). Music and emotion: Theory and research (Vol.
viii). New York, NY, US: Oxford University Press.
Juslin, P. N., & Västfjäll, D. (2008). Emotional responses to music: the need to consider
underlying mechanisms. The Behavioral and Brain Sciences, 31(5), 559-575-621.
https://doi.org/10.1017/S0140525X08005293
Khalfa, S., Bella, S. D., Roy, M., Peretz, I., & Lupien, S. J. (2003). Effects of relaxing music on
salivary cortisol level after psychological stress. Annals of the New York Academy of
Sciences, 999, 374–376.
Koelsch, S., Fritz, T., & Schlaug, G. (2008). Amygdala activity can be modulated by unexpected
chord functions during music listening. Neuroreport, 19(18), 1815–1819.
https://doi.org/10.1097/WNR.0b013e32831a8722
Krumhansl, C. L., Louhivuori, J., Toiviainen, P., Järvinen, T., & Eerola, T. (1999). Melodic
Expectation in Finnish Spiritual Folk Hymns: Convergence of Statistical, Behavioral, and
Computational Approaches. Music Perception: An Interdisciplinary Journal, 17(2), 151–
195. https://doi.org/10.2307/40285890
Lerdahl, F. (1989). Atonal prolongational structure. Contemporary Music Review, 4(1), 65–87.
https://doi.org/10.1080/07494468900640211
Lerdahl, F., & Jackendoff, R. (1983). A Generative Theory of Tonal Music. MIT Press.
Mackintosh, N. J. (1975). A theory of attention: Variations in the associability of stimuli with
reinforcement. Psychological Review, 82(4), 276–298. https://doi.org/10.1037/h0076778
EXPECTANCY AND MUSICAL EMOTION 33
Meyer, L. (1956). Emotion and Meaning in Music. Unviersity of Chicago Press. Retrieved from
http://www.press.uchicago.edu/ucp/books/book/chicago/E/bo3643659.html
Narmour, E. (1991). The Top-down and Bottom-up Systems of Musical Implication: Building on
Meyer’s Theory of Emotional Syntax. Music Perception: An Interdisciplinary Journal,
9(1), 1–26. https://doi.org/10.2307/40286156
Palmer, C., & Krumhansl, C. L. (1987). Independent temporal and pitch structures in
determination of musical phrases. Journal of Experimental Psychology. Human
Perception and Performance, 13(1), 116–126.
Palmer, C., & Krumhansl, C. L. (1987). Pitch and temporal contributions to musical phrase
perception: Effects of harmony, performance timing, and familiarity. Perception &
Psychophysics, 41(6), 505–518. https://doi.org/10.3758/BF03210485
Pearce, J. M., & Hall, G. (1980). A model for Pavlovian learning: Variations in the effectiveness
of conditioned but not of unconditioned stimuli. Psychological Review, 87(6), 532–552.
https://doi.org/10.1037/0033-295X.87.6.532
Pearce, J. M., & Mackintosh, N. J. (2010). Two theories of attention: A review and a possible
integration. Attention and Associative Learning: From Brain to Behaviour, 11–39.
Pearce, M. T. (2005, December). The construction and evaluation of statistical models of
melodic structure in music perception and composition (doctoral). City University
London. Retrieved from http://openaccess.city.ac.uk/8459/
Pearce, M. T., Ruiz, M. H., Kapasi, S., Wiggins, G. A., & Bhattacharya, J. (2010). Unsupervised
statistical learning underpins computational, behavioural, and neural manifestations of
musical expectation. NeuroImage, 50(1), 302–313.
https://doi.org/10.1016/j.neuroimage.2009.12.019

EXPECTANCY AND MUSICAL EMOTION 34
Pearce, M. T., & Wiggins, G. A. (2006). Expectation in melody: The influence of context and
learning. Music Perception, 23(5), 377–405. https://doi.org/10.1525/mp.2006.23.5.377
Pelletier, C. L. (2004). The effect of music on decreasing arousal due to stress: a meta-analysis.
Journal of Music Therapy, 41(3), 192–214.
Prince, J. B., Thompson, W. F., & Schmuckler, M. A. (2009). Pitch and time, tonality and meter:
how do musical dimensions combine? Journal of Experimental Psychology. Human
Perception and Performance, 35(5), 1598–1617. https://doi.org/10.1037/a0016456
Rentfrow, P. J., & Gosling, S. D. (2003). The do re mi’s of everyday life: The structure and
personality correlates of music preferences. Journal of Personality and Social
Psychology, 84(6), 1236–1256. https://doi.org/10.1037/0022-3514.84.6.1236
Russell, J. A. (2003). Core affect and the psychological construction of emotion. Psychological
Review, 110(1), 145–172.
Saffran, J. R., Johnson, E. K., Aslin, R. N., & Newport, E. L. (1999). Statistical learning of tone
sequences by human infants and adults. Cognition, 70(1), 27–52.
https://doi.org/10.1016/S0010-0277(98)00075-4
Schellenberg, E. G. (1996). Expectancy in melody: tests of the implication-realization model.
Cognition, 58(1), 75–125. https://doi.org/10.1016/0010-0277(95)00665-6
Steinbeis, N., Koelsch, S., & Sloboda, J. A. (2006). The role of harmonic expectancy violations
in musical emotions: evidence from subjective, physiological, and neural responses.
Journal of Cognitive Neuroscience, 18(8), 1380–1393.
https://doi.org/10.1162/jocn.2006.18.8.1380

EXPECTANCY AND MUSICAL EMOTION 35
Thompson, W. F., Graham, P., & Russo, F. A. (2005). Seeing music performance: Visual
influences on perception and experience. Semiotica, 2005(156), 203–227.
https://doi.org/10.1515/semi.2005.2005.156.203
Trainor, L. J., & Trehub, S. E. (1992). A comparison of infants’ and adults’ sensitivity to Western
musical structure. Journal of Experimental Psychology: Human Perception and
Performance, 18(2), 394–402. https://doi.org/10.1037/0096-1523.18.2.394
Uhlig, M., Fairhurst, M. T., & Keller, P. E. (2013). The importance of integration and top-down
salience when listening to complex multi-part musical stimuli. NeuroImage, 77, 52–61.
https://doi.org/10.1016/j.neuroimage.2013.03.051
Vines, B. W., Krumhansl, C. L., Wanderley, M. M., & Levitin, D. J. (2006). Cross-modal
interactions in the perception of musical performance. Cognition, 101(1), 80–113.
https://doi.org/10.1016/j.cognition.2005.09.003
EXPECTANCY AND MUSICAL EMOTION 36
Tables
Table 1
Details of the datasets used in stimulus selection.
Dataset Description Number of
melodies
Mean
events/composition
2 Chorale soprano melodies harmonized by J.S.
Bach
100 46.93
3 Alsatian folk songs from the Essen Folk Song
Collection
91 49.40
4 Yugoslavian folk songs from the Essen Folk
Song Collection
119 22.61
5 Swiss folk songs from the Essen Folk Song
Collection
93 49.31
6 Austrian folk songs from the Essen Folk Song
Collection
104 51.01
10 German folk songs from the Essen Folk Song
Collection: ballad
687 40.24
15 German folk songs from the Essen Folk Song
Collection: kinder
213 39.40
18 British folk song fragments used in the
experiments of Schellenberg (1996)
8 18.25
23 Irish folk songs encoded by Daiman Sagrillo 62 78.5
EXPECTANCY AND MUSICAL EMOTION 37
Table 2
Details of the training set used to train IDyOM.
Dataset Description Number of
melodies
Mean
events/composition
0 Songs & ballads from Nova Scotia, Canada 152 56.26
1 Chorale melodies harmonized by J.S. Bach 185 49.88
7 German folk songs 566 58.46
EXPECTANCY AND MUSICAL EMOTION 38
Figures
a)
b)
Figure 1. Mean (a) pitch IC and (b) onset IC of each melody plotted by stimulus predictability
and modification, where original melodies are symbolized by empty symbols and artificial
melodies by full symbols.
EXPECTANCY AND MUSICAL EMOTION 39
Musicians Non-musicians E
xpec
tancy
a) b)
Aro
usa
l
c) d)
Val
ence
e) f)

EXPECTANCY AND MUSICAL EMOTION 40
Figure 2. Mean expectancy (a, b), arousal (c, d) and valence (e, f) ratings for each melody
for musicians (a, c, e) and non-musicians (b, d, f). Hollow shapes illustrate original melodies
while filled shapes illustrate artificial melodies.

EXPECTANCY AND MUSICAL EMOTION 41
Musical training Stimulus
modification
Stimulus
predictability for
original melodies
Stimulus
predictability for
modified melodies
Expec
tati
on
a) b) c) d)
Aro
usa
l
e) f) g) h)
Val
ence
i) j) k) l)
Figure 3. Box plots illustrating important mean comparisons between musicians and non-
musicians (a, e, i), original and modified melodies (b, f, j), stimulus predictability categories for
original (c, g, k) and modified (d, h, l) melodies for expectation (a, b, c, d), arousal (e, f, g, h) and
valence (i, j, k, l) ratings.

EXPECTANCY AND MUSICAL EMOTION 42
Participant MelodyID
Expec
tancy
a) b)
Aro
usa
l
c) d)
Val
ence
e) f)
Figure 4. Intercept (left) and slope (right) values of random effects on Participant and MelodyID
for expectancy, arousal and valence models. These show how each individual participant and
melody was modelled and illustrate the variance among participants and melodies.

EXPECTANCY AND MUSICAL EMOTION 43
Musicians Non-musicians
Melody 1 (PP) Melody 13 (UU) Melody 1 (PP) Melody 13 (UU)
Expec
tancy
a) b) c) d)
Aro
usa
l
e) f) g) h)
Val
ence
i) j) k) l)
Figure 5. Expectancy (a, b, c, d), arousal (e, f, g, h) and valence (i, j, k, l) ratings for single
randomly selected participants (6 musicians (a, b, e, f, i, j; participants 14, 35, 34, 18, 27, 7) and
6 non-musicians (c, d, g, h, k, l; participants 1, 10, 8, 33, 5, 37)) are plotted for Melodies 1 (a, c,
e, g, i, k) and 13 (b, d, f, h, j, l), examples of PP and UU categories respectively. Ratings
predicted by the model (teal) for those melodies for each of those participants only (single

EXPECTANCY AND MUSICAL EMOTION 44
extracts) are plotted alongside their actual ratings (pink). Residuals were too small to illustrate
on the same plot.
EXPECTANCY AND MUSICAL EMOTION 45
Appendix A
Table A1. Summary of 16 original melodies used in this experiment.
File name Dataset
of origin
Number
of events
Average
pitch
(60 =
midC)
Average
note
duration
(24 =
quarter)
Mean
pitch
IC
Mean
onset
IC
Stimulus
Predicta
bility
Kindr138 15 33 67.69 74.18 1.3624 .8962 PP
A162 18 21 70.23 27.42 1.4328 .8955 PP
Kindr151 15 51 66.05 22.82 1.5971 .8114 PP
Kindr162 15 19 68.36 26.52 1.5574 .9254 PP
Deut3480 10 19 72.89 36.94 2.4272 4.4488 PU
Jugos052 4 54 66.22 6.77 2.2543 3.7433 PU
I0511 23 53 66.83 11.67 2.0089 2.4660 PU
Deut3284 10 67 69.71 6.52 2.0913 2.5380 PU
I0533 23 39 67.76 11.79 5.6137 1.1401 UP
A120 18 35 64.05 17.31 5.2750 1.3358 UP
Oestr045 6 30 68.90 36.40 4.7200 1.1290 UP
Oestr046 6 35 64.40 32.22 4.6734 1.1983 UP
Deut3244 10 39 67.64 21.84 3.0216 4.7589 UU
Deut3206 10 52 68.67 22.15 2.9122 4.5098 UU
Deut3437 10 29 71.62 19.86 3.0114 4.3796 UU
Deut3524 10 38 72.76 15.15 2.8472 4.3009 UU

EXPECTANCY AND MUSICAL EMOTION 46
Appendix B
Table B1. CSTSA modelling of expectancy ratings for all melodies; coefficients for fixed width
95% CI’s and variance of random effects.
Predictor Coefficient 95% CI 95% CI
Fixed effects
Intercept .307 .251 .364
Time .0016 .0015 .0017
Musicianship .030 .014 .047
Pitch -.0022 -.0026 -.0019
IOI .0034 .0031 .0038
L1ratings .960 .953 .967
L2ratings -.065 -.073 -.058
L4ratings -.061 -.069 -.053
L5ratings .015 .006 .025
L6ratings .035 .023 .037
L15ratings .015 .012 .018
PitchIC -.263 -.309 -.217
L1pitchIC .486 .306 .666
L7pitchIC .123 .079 .167
L8pitchIC -.059 -.103 -.016
OnsetIC -.731 -.794 -.667
L1onsetIC .845 .769 .920
L2onsetIC -.181 -.240 -.123
L10onsetIC -.084 -.129 -.039
L12onsetIC .138 .092 .183
Predictor Variance - -
Random effects on
individuals
Intercept .0002
L1pitchIC .0004
Random effects on
melody ID
Intercept .019
L1pitchIC .245
Residual variance .421
Table B2. CSTSA modelling of arousal ratings for all melodies; coefficients for fixed width 95%
CI’s and variance of random effects.
Predictor Coefficient 95% CI 95% CI
Fixed effects
(Intercept) 1.98 -.072 4.03
Time .067 .064 .070
Predict2 -3.42 -5.77l -1.06
Predict3 -.504 -2.86 1.85
Predict4 -4.53 -6.88 -2.17
Pitch -.045 -.052 -.038
IOI -.030 -.037 -.024
L1ratings .952 .947 .957
L3ratings .011 .004 .017
L5ratings -.059 -.067 -.051

EXPECTANCY AND MUSICAL EMOTION 47
L6ratings .032 .025 .039
L15ratings .014 .011 .017
PitchIC -16.6 -17.7 -15.4
L1pitchIC 16.6 15.5 17.8
L6pitchIC 2.46 1.31 3.62
L7pitchIC 2.05 .707 3.39
L8pitchIC -2.14 -3.37 -.923
L10pitchIC 1.86 .633 3.08
L11pitchIC -4.43 -5.77 -3.10
L12pitchIC 4.91 3.57 6.25
L13pitchIC -1.95 -3.18 -.725
L15pitchIC 2.18 1.23 3.13
OnsetIC -11.4 -12.9 -9.83
L1onsetIC 72.4 48.2 96.6
L3onsetIC 6.96 5.26 8.66
L4onsetIC -8.38 -9.98 -6.77
L7onsetIC 1.55 .345 2.76
L10onsetIC -6.81 -8.12 -5.49
L12onsetIC 5.43 3.73 7.13
L13onsetIC 4.47 2.55 6.39
L14onsetIC -2.93 -4.83 -1.04
L15onsetIC 3.09 1.59 4.58
Predictor Variance - -
Random effects on
individuals
Intercept .474
L1onsetIC 2.94
Random effects on
melody ID
Intercept 13.5
L1onsetIC 4815.2
Residual variance 276.7
Table B3. CSTSA modelling of valence ratings for all melodies; coefficients for fixed width
95% CI’s and variance of random effects.
Predictor Coefficient 95% CI 95% CI
Fixed effects
(Intercept) 5.38 3.56 7.20
Time .037 .033 .042
Pitch -.091 -.102 -.081
IOI .167 .153 .181
L1ratings .929 .924 .934
L3ratings -.025 -.033 -.017
L4ratings -.033 -.042 -.023
L5ratings -.012 -.022 -.003
L6ratings .017 .008 .027
L7ratings .015 .007 .023
L9ratings .008 .003 .014
L15ratings .007 .004 .011
PitchIC -9.19 -10.6 -7.72
EXPECTANCY AND MUSICAL EMOTION 48
L1pitchIC 11.2 9.74 12.6
L5pitchIC 2.62 1.45 3.79
L8pitchIC -3.26 -4.72 -1.79
L9pitchIC 3.29 1.74 4.83
L11pitchIC -1.68 -3.22 -.15
L12pitchIC 2.91 1.47 4.83
L15pitchIC 1.28 .205 2.36
OnsetIC -20.0 -22.2 -17.9
L1onsetIC 48.5 29.7 67.3
L3onsetIC 4.05 1.92 6.18
L4onsetIC -4.02 -5.90 -2.13
L10onsetIC -5.35 -6.65 -4.05
L13onsetIC 3.59 2.32 4.86
Predictor Variance - -
Random effects on
individuals
(Intercept) .115
L1onsetIC .123
Random effects on
melody ID
(Intercept) 22.2
L1onsetIC 2878.7
Residual variance 439.9
EXPECTANCY AND MUSICAL EMOTION 49
Appendix C
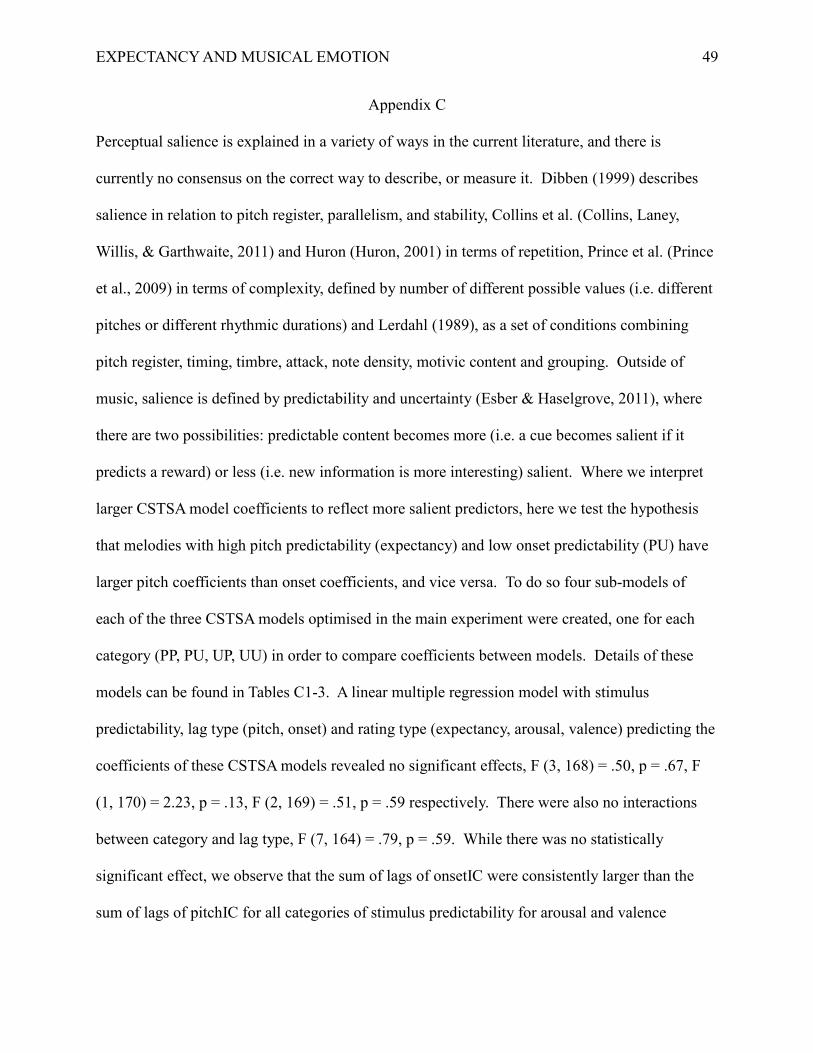
Perceptual salience is explained in a variety of ways in the current literature, and there is
currently no consensus on the correct way to describe, or measure it. Dibben (1999) describes
salience in relation to pitch register, parallelism, and stability, Collins et al. (Collins, Laney,
Willis, & Garthwaite, 2011) and Huron (Huron, 2001) in terms of repetition, Prince et al. (Prince
et al., 2009) in terms of complexity, defined by number of different possible values (i.e. different
pitches or different rhythmic durations) and Lerdahl (1989), as a set of conditions combining
pitch register, timing, timbre, attack, note density, motivic content and grouping. Outside of
music, salience is defined by predictability and uncertainty (Esber & Haselgrove, 2011), where
there are two possibilities: predictable content becomes more (i.e. a cue becomes salient if it
predicts a reward) or less (i.e. new information is more interesting) salient. Where we interpret
larger CSTSA model coefficients to reflect more salient predictors, here we test the hypothesis
that melodies with high pitch predictability (expectancy) and low onset predictability (PU) have
larger pitch coefficients than onset coefficients, and vice versa. To do so four sub-models of
each of the three CSTSA models optimised in the main experiment were created, one for each
category (PP, PU, UP, UU) in order to compare coefficients between models. Details of these
models can be found in Tables C1-3. A linear multiple regression model with stimulus
predictability, lag type (pitch, onset) and rating type (expectancy, arousal, valence) predicting the
coefficients of these CSTSA models revealed no significant effects, F (3, 168) = .50, p = .67, F
(1, 170) = 2.23, p = .13, F (2, 169) = .51, p = .59 respectively. There were also no interactions
between category and lag type, F (7, 164) = .79, p = .59. While there was no statistically
significant effect, we observe that the sum of lags of onsetIC were consistently larger than the
sum of lags of pitchIC for all categories of stimulus predictability for arousal and valence

EXPECTANCY AND MUSICAL EMOTION 50
models, while the sum of lags of pitchIC were slightly larger than the sum of lags of onsetIC in
the expectancy model. In conclusion, our hypothesis was not supported here, where salience
does not seem to be related to expectancy. However, this study was not designed to investigate
this question, which would be interesting to explore in a future study.
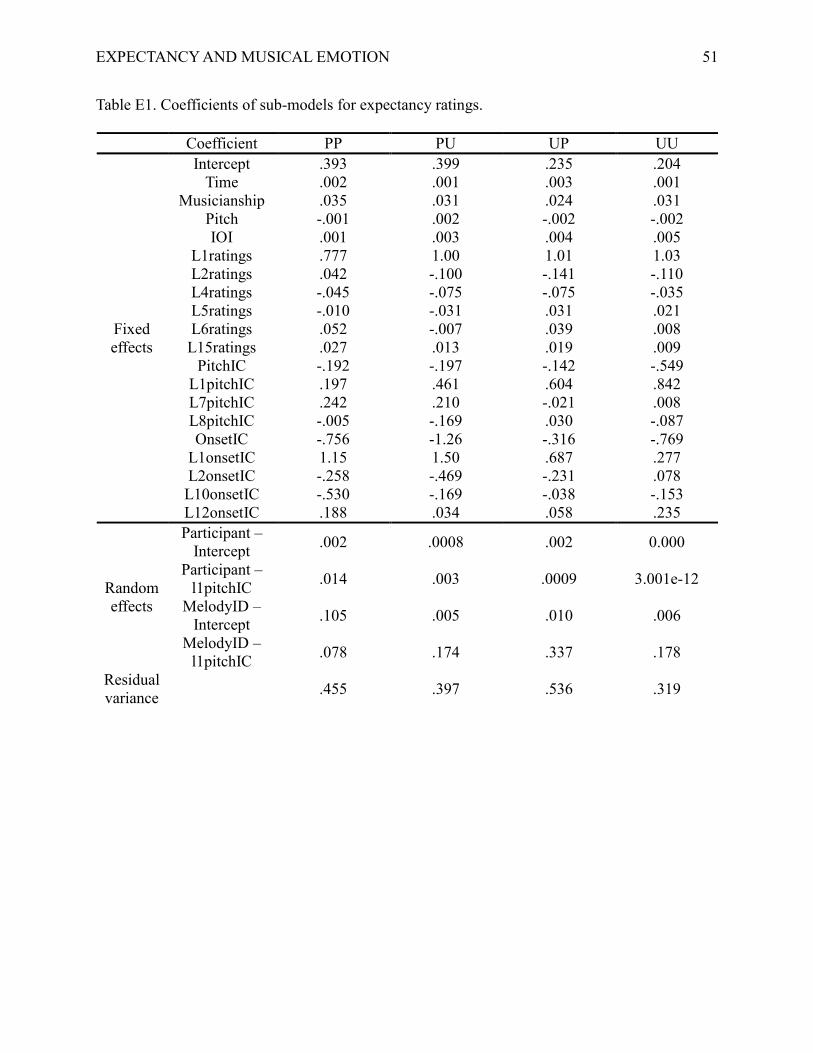
EXPECTANCY AND MUSICAL EMOTION 51
Table E1. Coefficients of sub-models for expectancy ratings.
Coefficient PP PU UP UU
Fixed
effects
Intercept .393 .399 .235 .204
Time .002 .001 .003 .001
Musicianship .035 .031 .024 .031
Pitch -.001 .002 -.002 -.002
IOI .001 .003 .004 .005
L1ratings .777 1.00 1.01 1.03
L2ratings .042 -.100 -.141 -.110
L4ratings -.045 -.075 -.075 -.035
L5ratings -.010 -.031 .031 .021
L6ratings .052 -.007 .039 .008
L15ratings .027 .013 .019 .009
PitchIC -.192 -.197 -.142 -.549
L1pitchIC .197 .461 .604 .842
L7pitchIC .242 .210 -.021 .008
L8pitchIC -.005 -.169 .030 -.087
OnsetIC -.756 -1.26 -.316 -.769
L1onsetIC 1.15 1.50 .687 .277
L2onsetIC -.258 -.469 -.231 .078
L10onsetIC -.530 -.169 -.038 -.153
L12onsetIC .188 .034 .058 .235
Random
effects
Participant –
Intercept .002 .0008 .002 0.000
Participant –
l1pitchIC .014 .003 .0009 3.001e-12
MelodyID –
Intercept .105 .005 .010 .006
MelodyID –
l1pitchIC .078 .174 .337 .178
Residual
variance
.455 .397 .536 .319

EXPECTANCY AND MUSICAL EMOTION 52
Table E2. Coefficients of sub-models for arousal ratings
Coefficients PP PU UP UU
Fixed
effects
Intercept -5.66 .772 -4.68 -3.45
Time .255 .040 .246 .058
Pitch -.027 -.024 -.104 -.002
IOI -.030 .002 -.124 -.001
L1ratings .870 .965 .894 .954
L3ratings .027 .010 .012 -.0006
L5ratings -.051 -.083 -.038 -.028
L6ratings .033 .047 .044 .019
L15ratings .053 .013 .028 .016
PitchIC -18.3 -12.7 -11.6 -20.5
L1pitchIC 19.8 8.85 14.5 24.1
L6pitchIC 9.35 1.42 -1.65 .329
L7pitchIC -2.64 3.32 8.12 2.05
L8pitchIC -.201 -3.68 -3.71 -4.12
L10pitchIC 6.03 .665 2.15 .081
L11pitchIC -10.0 -6.78 2.50 -1.29
L12pitchIC 6.54 8.64 -2.35 1.75
L13pitchIC .088 -7.88 3.12 -.454
L15pitchIC 3.69 .046 2.14 5.71
OnsetIC -24.7 -21.1 3.90 -7.01
L1onsetIC 78.4 91.46 123.5 17.4
L3onsetIC 10.2 1.84 10.5 4.73
L4onsetIC -15.0 -7.82 -7.92 -2.71
L7onsetIC -3.79 7.51 .017 -1.55
L10onsetIC -24.2 -1.00 -6.14 -1.82
L12onsetIC 13.5 -3.32 5.03 6.53
L13onsetIC 6.51 11.9 1.76 .479
L14onsetIC -3.12 -6.33 -4.64 -.819
L15onsetIC 1.30 1.28 5.12 2.40
Random
effects
Participant –
Intercept .449 1.17 .120 .724
Participant –
l1onsetIC .516 .086 .241 1.10
MelodyID –
Intercept 35.3 8.23 56.4 3.90
MelodyID –
l1onsetIC 2443.5 3846.0 11190.0 447.2
Residual
variance 368.1 225.3 323.7 186.2

EXPECTANCY AND MUSICAL EMOTION 53
Table E3. Coefficients of sub-models for valence ratings.
Coefficients PP PU UP UU
Fixed
effects
Intercept -2.42 9.68 1.35 -1.88
Time .169 .005 .174 .051
Pitch -.065 -.114 -.135 -.0001
IOI .176 .141 .235 .143
L1ratings .900 .946 .886 .925
L3ratings -.004 -.018 -.052 -.009
L4ratings -.024 -.015 -.054 -.029
L5ratings -.024 -.041 .023 -.015
L6ratings .021 .028 .0004 .017
L7ratings .002 .00009 .039 .004
L9ratings .017 .003 .026 .006
L15ratings .013 .005 .026 .018
PitchIC -8.42 -6.56 -7.56 -14.7
L1pitchIC 12.9 8.24 6.30 19.05
L5pitchIC 2.98 -.137 3.96 3.18
L8pitchIC -1.07 -3.18 -3.32 -8.26
L9pitchIC 3.10 5.09 1.15 5.82
L11pitchIC -.546 -7.44 2.52 -.533
L12pitchIC 4.25 1.02 2.46 2.62
L15pitchIC 1.71 -.696 2.30 2.92
OnsetIC -22.7 -24.0 -4.81 -21.2
L1onsetIC 49.1 80.7 81.4 6.13
L3onsetIC 17.6 3.28 .225 3.28
L4onsetIC -13.1 -.275 -1.83 -2.87
L10onsetIC -14.3 -4.66 -6.26 .210
L13onsetIC 7.75 6.75 -.153 -.945
Random
effects
Participant –
Intercept .030 .720 .108 .202
Participant –
l1onsetIC .147 .001 1.37 1.06
MelodyID –
Intercept 46.5 9.41 49.8 4.26
MelodyID –
l1onsetIC 2972.0 4176.0 5024.3 36.0
Residual
variance 519.6 375.9 712.1 251.5