many happy returns: school boards and pre-kindergarten patte barth, center for public education...
TRANSCRIPT

Many Happy Returns:School boards and pre-kindergarten
Patte Barth, Center for Public Education
Federation Presidents’ Retreat
August 16, 2008
The Center for Public Education

Agenda
• Why pre-K?
• School boards & pre-k
• CPE’s pre-k initiative
• Making pre-k work
• Federal advocacy
questions

Why pre-K?

Poor children start school behind their more affluent peers academically …
Source: NCES, America’s Kindergartners, Class of 1998-99, February 2000
8 7 6
27 27 27
0
80
reading math generalknowledge
welfare
no welfare
Per
cen
t of
stu
dent
s sc
orin
g in
to
p q
uart
ile
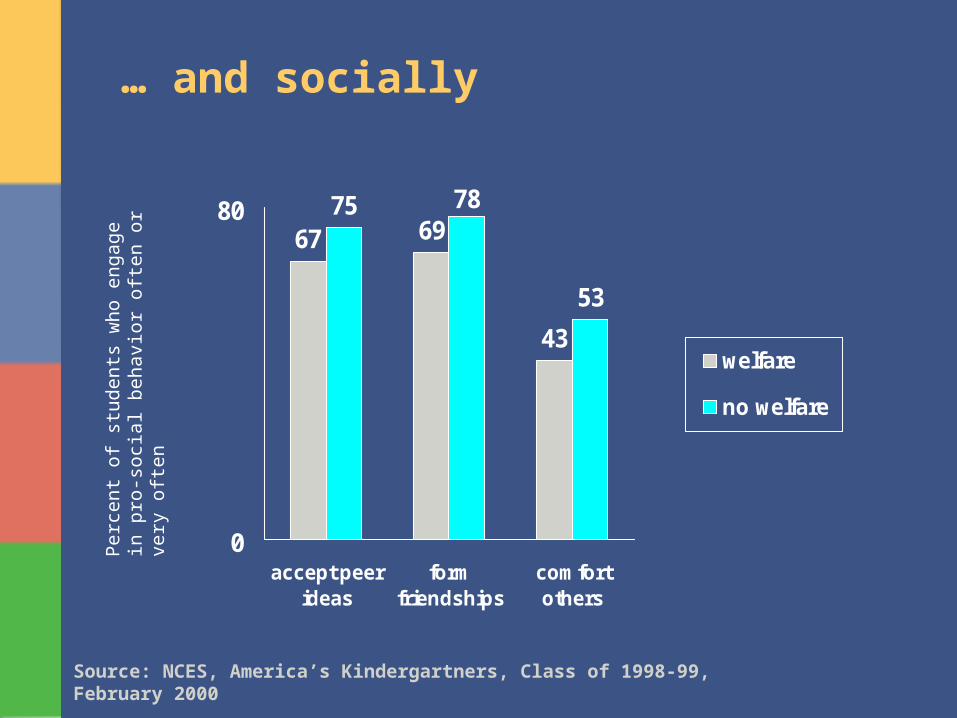
… and socially
Source: NCES, America’s Kindergartners, Class of 1998-99, February 2000
67 69
43
75 78
53
0
80
accept peerideas
formfriendships
comfortothers
welfare
no welfare
Per
cen
t of
stu
dent
s w
ho
eng
age
in p
ro-
soci
al b
ehav
ior
ofte
n or
ver
y of
ten
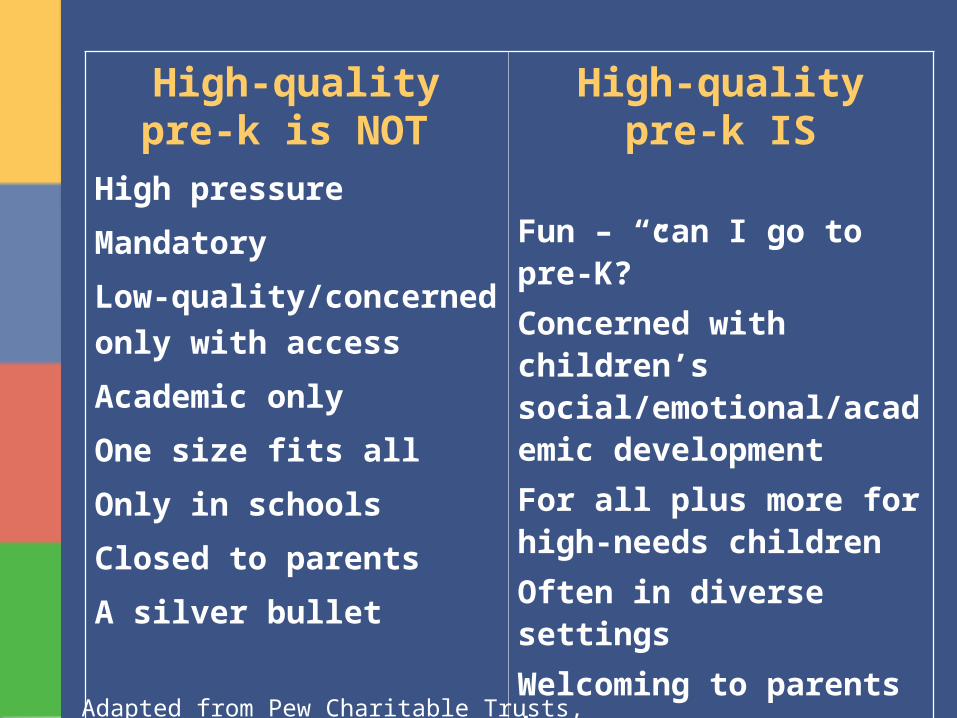
High-quality pre-k is NOT
High pressure
Mandatory
Low-quality/concerned
only with access
Academic only
One size fits all
Only in schools
Closed to parents
A silver bullet
High-quality pre-k IS
Fun – “can I go to pre-K?”
Concerned with children’s social/emotional/academic development
For all plus more for high-needs children
Often in diverse settings
Welcoming to parents too
Absolutely voluntary
Essential but not sufficient
Adapted from Pew Charitable Trusts, 2006

The benefits of pre-k convey to all children
Source: Cannon & Karoly, Who Is Ahead and Who Is Behind? RAND, 2007. Data from Gormley et al, 2005.
0.99
0.38
0.6
0.76
1.5
0.74
0.89
0.72
0.98
0.52
0.72
0
2
White Hispanic Black NativeAmerican
Appliedproblems
Letter-Word ID
Spelling
Effects of Tulsa Preschool Program on School Readiness by Race & Ethnicity
Eff
ect
Siz
e (g
ain
s)

The benefits of pre-k convey to all children
Source: Cannon & Karoly, Who Is Ahead and Who Is Behind? RAND, 2007. Data from Gormley et al, 2005.
0.45
0.29
0.81
1.04
0.630.65
0.97
0.54
0
2
free lunch reduced lunch non eligible
Appliedproblems
Letter-Word ID
Spelling
Effects of Tulsa Preschool Program on School Readiness by Family Income
Eff
ect
Siz
e (g
ain
s)

Short-term benefits
• More likely to score higher on math and
reading state tests in elementary school
• Less likely to be retained in grade
• Less likely to require special education
services
Sources: High Scopes/Perry Preschool, Abecedarian, Chicago Child-Parent Centers
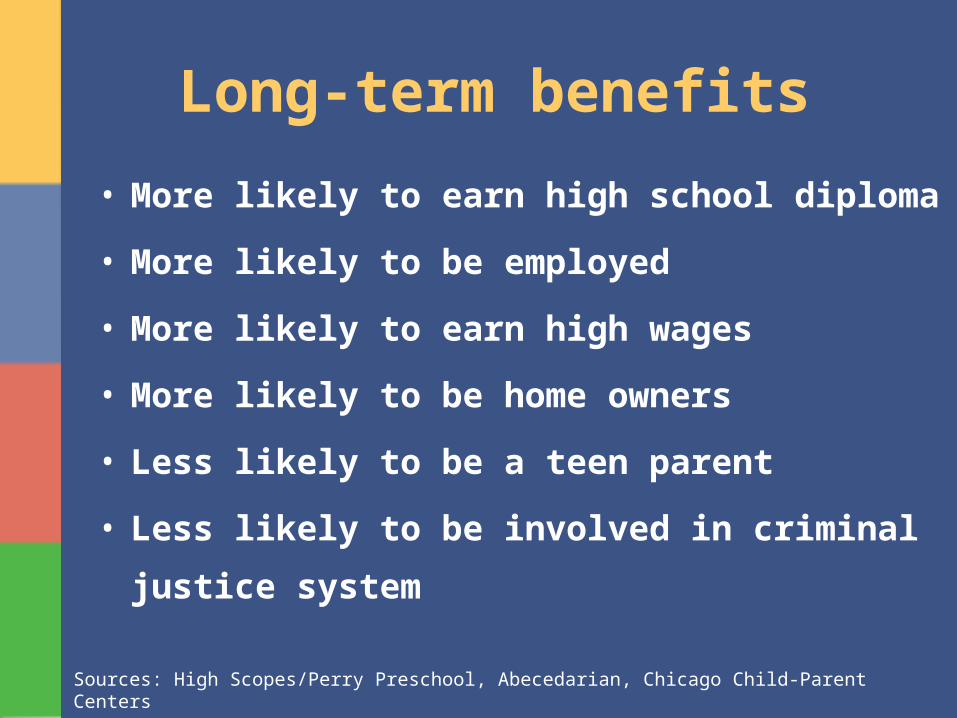
Long-term benefits
• More likely to earn high school diploma
• More likely to be employed
• More likely to earn high wages
• More likely to be home owners
• Less likely to be a teen parent
• Less likely to be involved in criminal justice
system
Sources: High Scopes/Perry Preschool, Abecedarian, Chicago Child-Parent Centers

And it adds up:Gains per $1 invested
2.363.78
7.14
16.14
0
18
Meta-analysis Abecedarian Chicago Centers High/Scope
SOURCE: CED, 2006
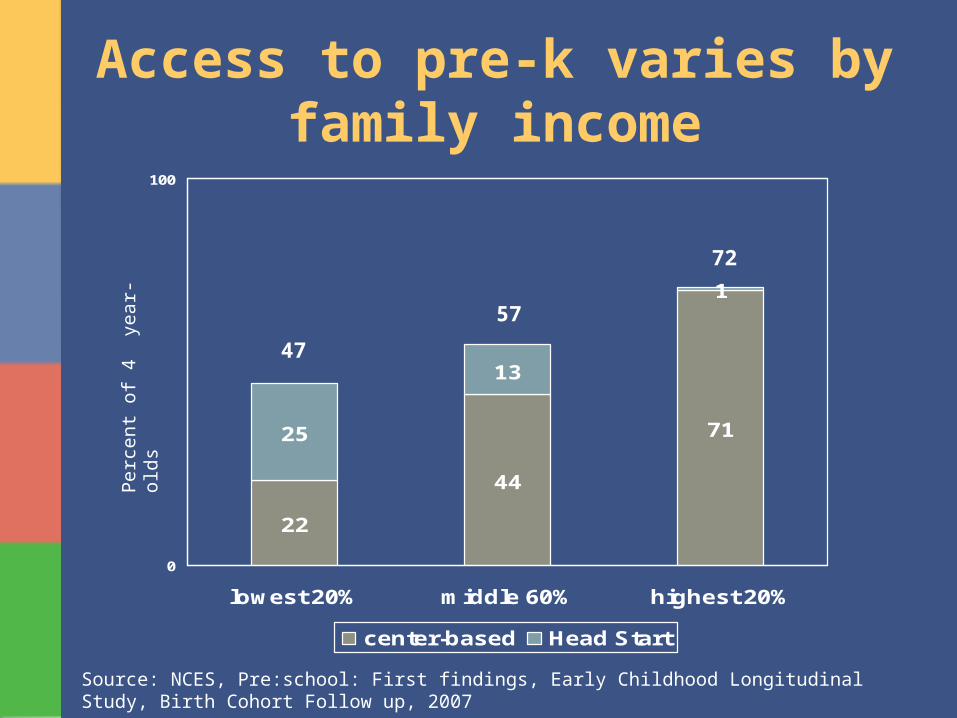
Access to pre-k varies by family income
Per
cen
t of
4
year
-old
s
Source: NCES, Pre:school: First findings, Early Childhood Longitudinal Study, Birth Cohort Follow up, 2007
22
44
7125
13
1
0
100
lowest 20% middle 60% highest 20%
center-based Head Start
47
57
72

Access to pre-k also varies by race & ethnicity
Per
cen
t of
4
year
-old
s
Source: NCES, Pre:school: First findings, Early Childhood Longitudinal Study, Birth Cohort Follow up, 2007
53
37 31
55
29
725
19
6
31
0
100
White Black Hispanic Asian NativeAmerican
center-based Head Start
60 62
50
61 60

School boards and pre-k

School board view:Why pre-k
75 72 71
45
0
100
promotes schoolreadiness
boosts studentachievement
narrows gaps saves $ in long-term
SOURCE: NSBA, school board survey 2006

School board view:Challenges to providing pre-K
79
2417 14
0
100
lack of resources finding qualifiedteachers
collaborating withprivate providers
lack of readinessstandards
SOURCE: NSBA, school board survey 2006

School board view:Impediments to starting pre-K
87
58
14 10 9
0
100
insufficientfunds
lack ofclassrooms
limited public-private
collaboration
lack ofcommunity
interest
lack ofqualified
providers
SOURCE: NSBA, school board survey 2006, views from districts that do not currently provide pre-k

CPE pre-k initiative
• Making pre-kindergarten a public priority
• Intensifying efforts in partner states: Kansas, Ohio, Texas. We hope to add Alabama and Kentucky
• Reaching out broadly to other states and nationally

Action in the partner states
• Kansas – holding broad-based
community meetings, working with the
governor, expanding pilot projects
• Ohio – outreach to members, making P-
12 case
• Texas – taking lead role in TX early ed
coalition, working to expand eligibility

Making pre-K work

Universal vs. Targeted
• Arguments for universal:
all children benefit – no one is denied access
broader base of support for program
• Arguments for targeted:
high-needs children benefit the most
costs less

Mixed delivery vs. Public school pre-k
• Arguments for mixed deliverymaximize community resourcesless threatening to private providers
• Arguments for public school pre-kless concern about quality controlless concern about “backdoor vouchers”

Full-day K vs. Pre-K
• Arguments for full-day K
schools already have the children
easier to find certified teachers
easier for working parents
• Arguments for pre-K
readiness gaps are present at age 5

A federal role
NSBA’s Pre-K Legislative Committee
• Advocates for federal pre-k agenda to include more investment in high-quality pre-k
• Includes over 300 NA, FRN and CUBE representatives at present
NSBA’s Federal Policy Recommendations
• New federal grant program to fund portion of costs to develop and expand voluntary quality preschool programs in local school districts.
• Key caveats:
– School district participation discretionary– Parent/student participation discretionary– Not at expense of K-12 funding– Doesn’t foster vouchers

NSBA’s Federal Policy Recommendations (cont.)
• Programs adopt developmentally appropriate early ed standards aligned with state’s K-12 standards.
• Require outside pre-k providers to collaborate with local districts.
• Encourage states to upgrade teacher certification / licensure systems to include BA & early ed training
NSBA’s Federal Policy Recommendations (cont.)
• Devote resources to districts to develop / implement joint training and professional development programs for early ed instructors.
• Tools / incentives to replicate effective models and improve program quality.
State trends in Pre-kAccess AND Quality

Access
• 38 states fund pre-k programs
• 22% of all 4-yr-olds enrolled in state pre-k – up from 14% in 2002
• 2/3 of children served are in public school settings
Source: NIEER, 2006 & 2007
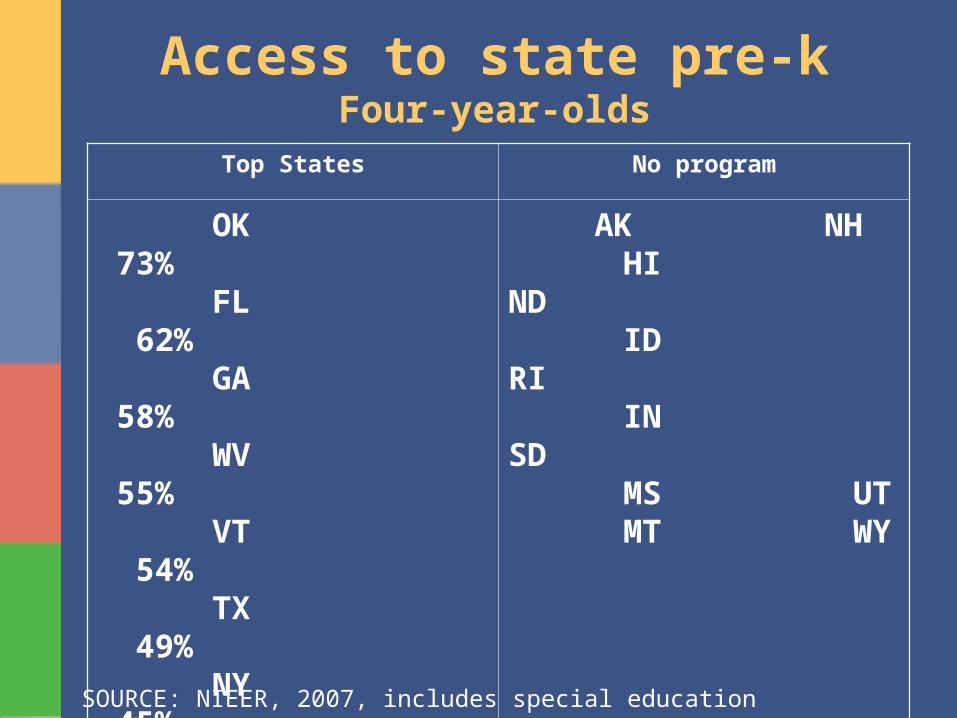
Access to state pre-kFour-year-olds
Top States No program
OK 73% FL 62% GA 58% WV 55% VT 54% TX 49% NY 45% WI 44% SC 44% MD 40%
AK NH HI ND ID RI IN SD MS UT MT WY
SOURCE: NIEER, 2007, includes special education students

Pre-k funding by state, FY09
Orange: increase Black: decrease Tan: Flat * inc. HeadStart or local only
Blue: Inc, expected White: no state pre-k Gray: no budget Map: Pre-K Now, 2008
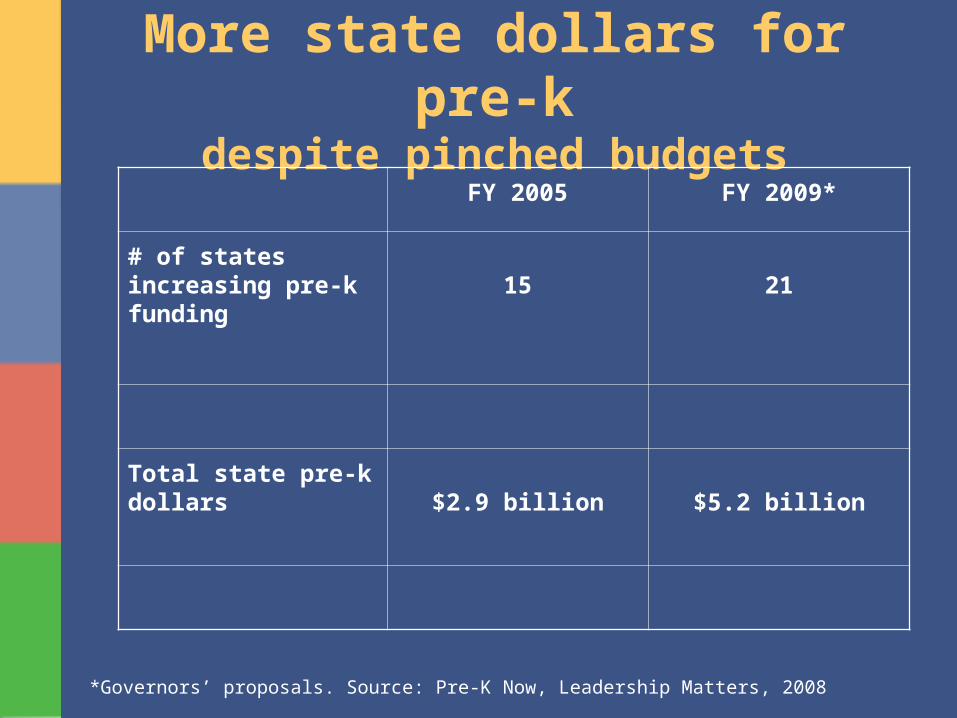
More state dollars for pre-kdespite pinched budgets
FY 2005 FY 2009*
# of states increasing pre-k funding 15 21
Total state pre-k dollars $2.9 billion $5.2 billion
*Governors’ proposals. Source: Pre-K Now, Leadership Matters, 2008

NIEER’s 10 quality indicators• Early learning standards• Lead teachers with B.A.• Lead teachers with early ed training• Ass’t teachers with CDA• Min. 15 hrs PD• Max. class size of 20• Min. staff-child ratio 1:10• Health support• Min. 1 meal• Site visits
Source: National Institute for Early Education Research

States meeting standards
• 2 states – AL and NC -- meet all 10 indicators
• 8 states – AR, IL, NJ, NM, OK, SC, TN & WA - met 9 quality indicators
Source: NIEER, 2007

Nationally…
• 22 states required lead teachers to have BA
• 33 states required class size ≤ 20
• 34 states required child/staff ratio 10:1 or better
Source: NIEER Yearbook 2007

Pre-K newsletter
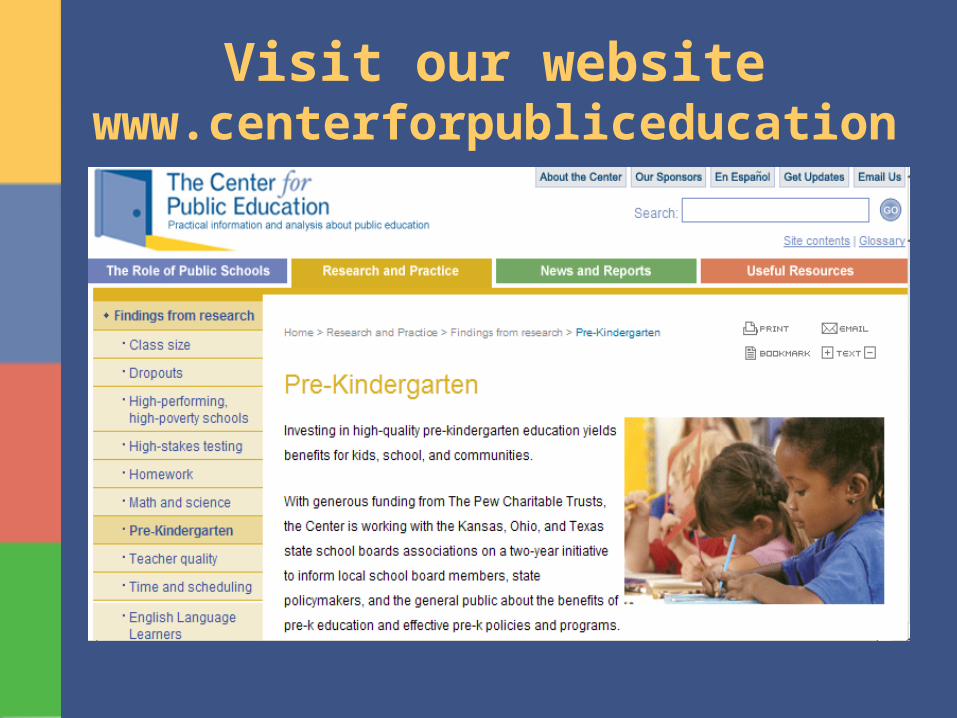
Visit our websitewww.centerforpubliceducation

questions?

For more information …
Center for Public Education www.centerforpubliceducation.org
or email me
Patte Barth, [email protected]