many research centers since several the recent
TRANSCRIPT

1. Introduction The engineering practice calls for any guidance for the design requirements on the robustness of structures (members and, of course, their connections) in recent years. These requirements should cover the effects of unexpected loads (explosions, seismic action in zones that are not a priori considered as seismically active, fire actions in the case of the failure of the counter-fire equipments, etc.). These requirements shall not guarantee that the construction will withstand all unexpected loads, however it should guarantee that these effects would be taken partially into account. Although the structures can be significantly deformed and they will have to be repaired or replaced, they will not cause the secondary damages by failing of themselves. The inevitable necessity for setting of these requirements is the detailed research program that has to be established and many experimental works that have to be carried out. This program was successfully started at many research centres. They concentrate their attention in recent years not only towards the monotonic tests but also towards the shock and cyclic tests. At the CTU Prague the research activities in this field focus, among others, on behaviour of the materially non-homogenous joints (column bases, carpentry joints). Till the year 2001, many of monotonic tests and several tests with repeated load were carried out [Wald, Sokol et al.]. From autumn 2001, another tests of cyclically loaded (low-cyclic loading) components of column base joint and timber joint were realised. The interest of these tests was to improve experimentally the knowledge concerning the behaviour of each component subjected to the repeated load. Especially the descending branch of the load-deformation curve will be later subjected to particular analysis. This paper refers only the experiment set-ups and results.
2. Review of Experiments Short review of experiments carried out at CTU Prague from September 2001 to September 2002 is presented here. The tested components were: • The concrete subjected to the local compressive repeated loading transferred through the
steel base plate. Load force is parallel to the direction of casting. No grout is used. • The concrete subjected to the local compressive repeated loading transferred through the
steel base plate. Load force is perpendicular to the direction of casting. No grout is used. • The concrete subjected to the local compressive repeated loading transferred through the
steel base plate. Load force is perpendicular to the direction of casting. The layer of the grout weaker than the concrete strength is used.
• The concrete subjected to the local compressive repeated loading transferred through the steel base plate. Load force is perpendicular to the direction of casting. The layer of the grout significantly stronger than the concrete strength is used.
• The cast-in threaded rod without the anchor head, sufficiently embedded in the concrete block is pulled out. Only the zero-to-tension low-cyclic load is applied.
• The T-stub fixed to the concrete block by two cast-in threaded rods with nuts is subjected to the zero-to-tension low-cyclic loading.

3. Set-up and Results
3.1. Concrete in compression, without grout, force parallel to casting
3.1.a General set-up The general set-up is depicted in Fig. 3.1.1. The cube made of the plain concrete was cast in June 2001. The test was performed on the upper horizontal surface of the cube (if looking at the cube that is in the same position as while casting). The top surface of the block was cleaned, moistened and a thin (in reality around 1mm) layer of a high strength grout was applied in its central part to smooth the surface. (“Top surface” means in this paper the upper horizontal surface of the block in the position while testing). The steel plate with nominal dimensions 200x100x10mm was placed on the fresh grout layer. The steel bar, nominally 10x10x220mm, was put on the plate. The cube was positioned under the loading “head” of the hydraulic actuator. The cylindrical “head” is joined to the actuator by articulation. The layer of plaster was made under the block to ensure the horizontal position of the top surface and good transfer of loads by the entire bottom surface to the laboratory floor. The actuator is fixed to the massive steel frame fastened to the laboratory floor. The load was thus transferred from the actuator to the cylindrical “head” and then to the steel bar and, by the steel plate, it is finally applied on the concrete surface.
Fig. 3.1.1 Set-up of tests C1/1, C2/1 and C3/1Three specimens of this type were tested and the tests are labelled C1/1, C2/1 and C3/1.
3.1.b Measurements During the test the inductive transducers measured the vertical displacement of 11
points. See Fig. 3.1.2 for the transducers position. I10, I11, I12, I13 were positioned at the corners of the top cube surface and they were placed on the little smooth cupreous plates glued on the concrete surface. These LVDTs measured displacements relatively to the laboratory floor. I14, I15, I18, I19 were at the corners of the top steel plate surface, they were connected to the little “brick” of aluminium
Fig. 3.1.2 Position of measuring devices for compression tests

glued on the steel plate. I16, I17 were connected to the steel bar 20mm from its ends. I20 (was not installed during tests C1/1 and C2/1) was placed on the little cantilever glued on the side of the steel cylindrical “head”, above I16. All I14 to I20 measured the displacement relatively to the concrete top surface edges.
The measured values of displacement and the force value in the actuator were recorded automatically by the UPM Hottinger Baldwin and a personal computer.
The test was controlled by the force. After setting of the required value of force, the values of displacements were recorded each 30s until the differences between previous and following values of all displacements became less than 1% of their previous value.
3.1.c Material characteristics Concrete blocks were made more than 120 days before the tests. The value 28.3 MPa
was found as the average strength measured on 6 concrete cubes with the nominal edge length equal to 150mm. The Young’s modulus according to ISO 6784 was determined as 23800 MPa. The strength test on the surface by the Smidt rebound hammer was performed and the strength of the external part of concrete block was determined as 24.3 MPa for C1/1, 29.5 MPa for C2/1 and 27.7 MPa for C3/1. The plate and the bar were made of S235 steel.
3.1.d Loading procedure The loading procedure shown in Fig. 3.1.3 was applied. The measurements were
recorded at the force levels marked by points in the diagram. At each level the measurement was repeated if necessary (see chap. 3.1.b) while the force value was hold. The actual loading procedure with repeated measurements is shown in Fig.3.1.4 for the test C1/1. Each point corresponds to one taken measurement of all installed transducers. The minimum value of the force was 10kN. This value was chosen arbitrarily and it should ensure that neither transducers nor the steel bar and the steel plate would not move after the unloading.
0100200300400500600700
0 200 400 600 800Time [s]
Forc
e [k
N]
Fig. 3.1.3 Loading procedure for compression tests C…/1

0
100
200
300
400
500
600
0 50 100 150 200 250 300
No. of measurement [-]
Load
forc
e [k
N]
Fig. 3.1.4 Actual loading procedure with all measurement points for C1/1 test
3.1.e Results Tests of three specimens C1/1, C2/1 and C3/1 with this set-up were carried out. As the loading force was increased, all three tests failed because of the eccentricity of the cylindrical „head“ placed on the steel bar and the non-homogeneity of concrete (the „head“ overturned), see Fig. 3.1.5. The position in loading procedure where each test failed is marked in Fig. 3.1.6
Fig. 3.1.5 Failure of compressive tests
0100200300400500600700
0 200 400 600 800Time [s]
Forc
e [k
N]
Fig. 3.1.6 Reached load at C…/1 test failure
C3/1
C2/1
C1/1
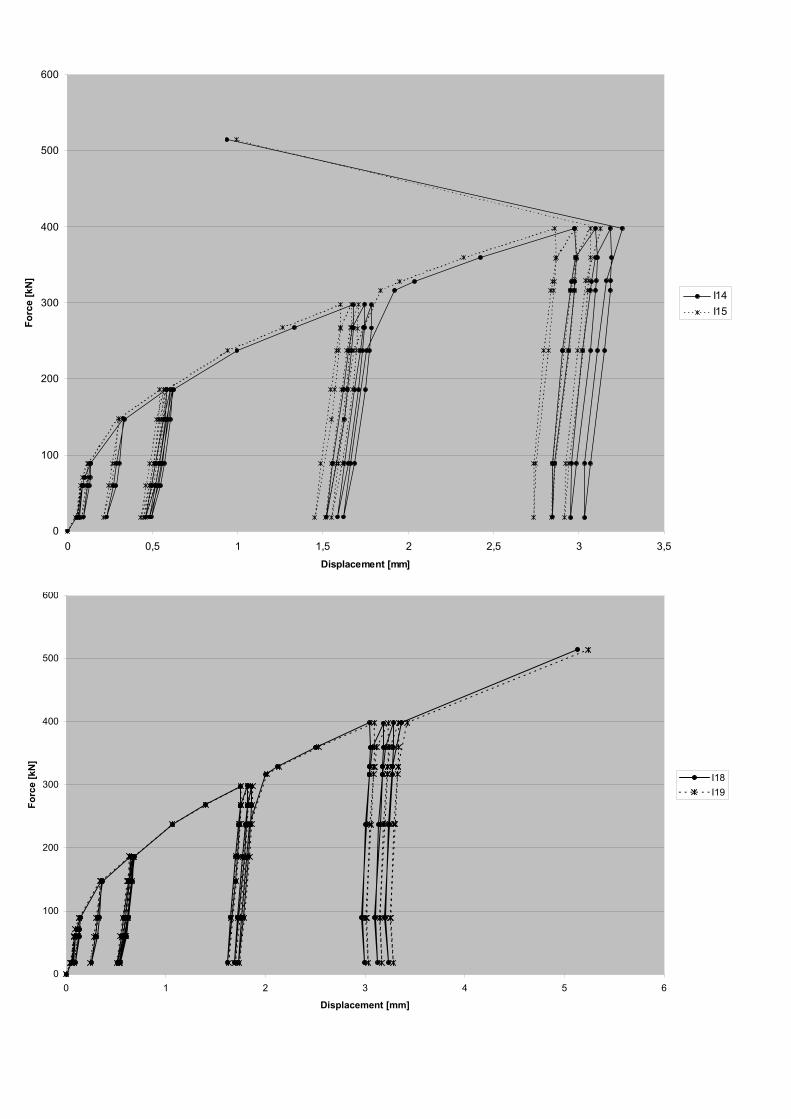
Fig. 3.1.7 Force-displacement relation of test C1/1 for measure devices I14, I15, I18, I19 placed on steel plate
0
100
200
300
400
500
600
0 1 2 3 4 5 6
Displacement [mm]
Forc
e [k
N]
I18I19
0
100
200
300
400
500
600
0 0,5 1 1,5 2 2,5 3 3,5Displacement [mm]
Forc
e [k
N]
I14I15

0
100
200
300
400
500
600
-0,18 -0,16 -0,14 -0,12 -0,1 -0,08 -0,06 -0,04 -0,02 0
Displacement [mm]
Forc
e [k
N]
I10I13
0
100
200
300
400
500
600
-0,18 -0,16 -0,14 -0,12 -0,1 -0,08 -0,06 -0,04 -0,02 0
Displacement [mm]
Forc
e [k
N]
I11I12
Fig. 3.1.8 Force-displacement relation of test C1/1 for measure devices I10, I11, I12, I13 placed on concrete cube corners

600
0
100
200
300
400
500
-3,5 -3 -2,5 -2 -1,5 -1 -0,5 0
Displacement [mm]
Forc
e [k
N]
I16I17
Fig. 3.1.9 Force-displacement relation of test C1/1 for measure devices I16, I17 placed on steel bar
100
200
300
400
500
600
Forc
e [k
N]
C1/1C2/1C3/1
0-3 -2,5 -2 -1,5 -1 -0,5 0
Displacement [mm]
Fig. 3.1.10 Force-displacement relation of test C1/1, C2/1 and C3/1 for the average of measure devices I16 and I17 {=(I16+I17)/2}

3.2. Concrete in compression, without grout, force perpendicular to casting
3.2.a General set-up The experiments were performed on the same cubes as the tests presented in the part 3.1., however, one of the vertical surfaces of the cube (if looking at the cube that is in the same position as while casting) was used. The cube was overturned in order to the tested surface was on the top while testing. The procedure of the specimen preparation was the same as for the test mentioned in part 3.1.
Fig. 3.2.1 Set-up of tests C1/2, C2/2 and C3/2
The tests on these three specimens were named C1/2, C2/2, C3/2. For the general set-up see Fig. 3.2.1
3.2.b Measurements The device I20 was installed for
all three tests. For other information see part 3.1.b. See Fig. 3.1.2 for positions of measuring devices.
3.2.c Material characteristics The concrete strengths measured
by the Smidt hammer are 29.1 MPa for C1/2, 31.33 MPa for C2/2 and 25.1 MPa for C3/2. Other values are the same as in the part 3.1.c.
3.2.d Loading procedure The loading procedure shown in Fig. 3.2.2 was applied. Only for C1/2 test one more
loading-unloading cycle was performed when the force had reached 520kN. The measurements were recorded at the force levels marked by the points in the diagram. At each level the measurement was repeated if necessary (see chap. 3.1.b) while the force value was hold. The actual loading procedure with repeated measurements is shown in Fig. 3.2.3 for the test C2/2. Each point corresponds to one taken measurement of all installed transducers. The minimum value of the force was approximately 15kN. This value was chosen arbitrarily and it should ensure that neither transducers nor the steel bar and the steel plate would not move after the unloading.

0100200300400500600700
0 200 400 600 800 1000 1200
Tim e [s ]
Forc
e [k
N]
Fig. 3.2.2 Loading procedure for compression tests C…/2, C…/3 and C…/4
3.2.e Results
0
100
200
300
400
500
0 50 100 150 200 250
No. of measurement [-]
Forc
e [k
N]
Fig. 3.2.3 Actual loading procedure with all measurement points for C2/2 test
Tests of three specimens C1/2, C2/2 and C3/2 with this set-up were carried out. As the loading force was increased, all three tests failed because of the eccentricity of the cylindrical „head“ placed on the steel bar and the non-homogeneity of concrete (the „head“ overturned), see Fig. 3.1.5. The position in loading procedure where each test failed is marked in Fig. 3.2.4
0100200300400500600
0 200 400 600 800 1000
Tim e [s ]
Forc
e [k
N]
Fig. 3.2.4 Reached load at C…/2 test failure
700
1200
C3/2 C2/2 C1/2

0
50
100
150
200
250
300
350
400
450
500
0 0,5 1 1,5 2 2,5 3
Displacement [mm]
Forc
e [k
N]
I18
I19
0
50
100
150
200
250
300
350
0 0,5 1 1,5 2 2,5 3
Displacement [mm]
Forc
e [k
N]
I14
I15
Fig. 3.2.5 Force-displacement relation of test C2/2 measure devices I14, I15, I18, I19 placed on steel plate
400
450
500

0
50
100
150
200
250
300
350
-0,14 -0,12 -0,1 -0,08 -0,06 -0,04 -0,02 0
Displacement [mm]
Forc
e [k
N]
I10
I13
0
50
100
150
200
250
300
350
400
450
500
-0,3 -0,25 -0,2 -0,15 -0,1 -0,05 0
Displacement [mm]
Forc
e [k
N]
I11
I12
Fig. 3.2.6 Force-displacement relation of test C2/2 for measure devices I10, I11, I12, I13 placed on concrete cube corners
400
450
500

0
50
100
150
200
250
300
350
400
450
500
-2,7 -2,2 -1,7 -1,2 -0,7 -0,2
Displacement [mm]
Forc
e [k
N]
I16
I17
Fig. 3.2.7 Force-displacement relation of test C2/2 for measure devices I16, I17 placed onsteel bar
0
100
200
300
400
-4 -3,5 -3 -2,5 -2 -1,5 -1 -0,5 0
Displacement [mm]
Forc
e [k
N]
C1/1C2/2C3/2
Fig. 3.2.8 Force-displacement relation of test C1/2, C2/2 and C3/2 for the average of measure devices I16 and I17 {=(I16+I17)/2}
500
600
700

3.3. Concrete in compression, weak grout, force perpendicular to casting
3.3.a General set-up The experiments were performed on the same cubes as the tests presented in parts 3.1 and 3.2, however, another of the vertical surfaces of the cube (if looking at the cube that is in the same position as while casting) was used. The cube was overturned in order to the tested surface was on the top while testing. The top surface of the block was cleaned, moistened and a 15mm thick layer of grout was applied in its central part. The plan view shape of the layer was rectangular and the grout over sized the steel plate by 50mm at each side. The steel plate with nominal dimensions 200x100x10mm was placed on the fresh grout layer. The steel bar nominally 10x10x220mm was put on the plate. The cube was positioned under the loading “head” of the hydraulic actuator. The layer of plaster was made under the block to ensure the horizontal position of the top surface and the good transfer of loads by the entire bottom surface to the laboratory floor. The load was thus transferred from the actuator to the cylindrical “head”, and then to the steel bar and by the steel plate it is finally applied on the grout layer and the concrete surface.
Fig. 3.3.1 Set-up of tests C1/3, C2/3 and C3/3Three specimens of this type were
tested and the tests were labelled C1/3, C2/3 and C3/3. For the general set-up see Fig. 3.3.1.
3.3.b Measurements For all information see part 3.2.b.See Fig. 3.1.2 for positions of measuring devices.
3.3.c Material characteristics The concrete strengths measured by the Smidt rebound hammer are 30.0 MPa for
C1/3, 29.5 MPa for C2/3 and 33 MPa for C3/3. The strength of the grout was determined by the normative tests on 3 beams of grout
40x40x150mm for each concrete cube. The results are sumarized in Tab 3.3.1. Other material characteristics are the same as in the part 3.1.c.

Tensile strength in
bending Compressive strength Density Test specimen [MPa] [MPa] [kg/m3]
C1/3 4.4 24.2 2169 C2/3 2.8 10.3 2150 C3/3 4 16.2 2110
Tab.3.3.1 Material characteristics of grout
3.3.d Loading procedure The loading procedure shown in Fig. 3.2.2 was applied. The measurements were
recorded at the force levels marked by points in the diagram. At each level the measurement was repeated if necessary (see chap. 3.1.b) while the force value was hold. The actual loading procedure with repeated measurements is shown in Fig.3.3.2 for the test C2/3. Each point corresponds to one taken measurement of all installed transducers. The minimum value of the force was approximately 15kN. This value was chosen arbitrarily and it should ensure that neither transducers nor the steel bar and the steel plate would not move after unloading.
0
100
200
300
400
500
0 50 100 150 200 250 300
No. of measurement [-]
Forc
e [k
N]
Fig. 3.3.2 Actual loading procedure with all measurement points for C2/3 test
3.3.e Results Tests of three specimens C1/3, C2/3 and C3/3 with this set-up were carried out. As the
loading force was increased, all three tests failed because of the eccentricity of the cylindrical „head“ placed on the steel bar and the non-homogeneity of concrete (the „head“ overturned), see Fig. 3.1.5. The position in loading procedure where each test failed is marked in Fig. 3.3.3.
0100200300400500600700
0 200 400 600 800 1000 1200
Tim e [s ]
Forc
e [k
N]
Fig. 3.3.3 Reached load at C…/3 test failure
C3/2
C2/3
C3/3

0
50
100
150
200
250
300
350
0 1 2 3 4 5 6 7 8
Displacement [mm]
Forc
e [k
N]
I14I15
0
50
100
150
200
250
300
350
400
450
500
0 1 2 3 4 5 6 7
Displacement [mm]
Forc
e [k
N]
I18I19
Fig. 3.3.4 Force-displacement relation of test C2/3 measure devices I14, I15, I18, I19 placed on steel plate
400
450
500

0
50
100
150
200
250
300
350
400
-0,14 -0,12 -0,1 -0,08 -0,06 -0,04 -0,02 0
Displacement [mm]
Forc
e [k
N]
I10I13
0
50
100
150
200
250
300
350
400
450
500
-0,16 -0,14 -0,12 -0,1 -0,08 -0,06 -0,04 -0,02 0
Displacement [mm]
Forc
e [k
N]
I11I12
450
500
Fig. 3.3.5 Force-displacement relation of test C2/3 for measure devices I10, I11, I12, I13 placed on concrete cube corners

500
0
50
100
150
200
250
300
350
400
450
-4,7 -4,2 -3,7 -3,2 -2,7 -2,2 -1,7 -1,2 -0,7 -0,2
Displacement [mm]
Forc
e [k
N]
I16I17
Fig. 3.3.6 Force-displacement relation of test C2/3 for measure devices I16, I17 placed on steel
100
150
200
250
300
350
400
450
500
Forc
e [k
N]
C1/3C2/3C3/3
0
50
-5 -4,5 -4 -3,5 -3 -2,5 -2 -1,5 -1 -0,5 0
Displacement [mm]
Fig. 3.3.7 Force-displacement relation of test C1/3, C2/3 and C3/3 for the average of measure devices I16 and I17 {=(I16+I17)/2}

3.4. Concrete in compression, strong grout, force perpendicular to casting
3.4.a General set-up The experiments were performed on the same cubes as the tests presented in parts 3.1, 3.2 and 3.3, however, another of the vertical surfaces of the cube (if looking at the cube that is in the same position as while casting) was used. The cube was overturned in order to the tested surface was on the top while testing. The specimen preparation procedure was the same as described in the part 3.3.a. One only difference is the grout strength.
Three specimens of this type were tested and the tests were labelled C1/4, C2/4 and C3/4. For the general set-up see Fig. 3.4.1
3.4.b Measurements For all information see part 3.2.b. See
Fig. 3.1.2 for positions of measuring devices.
3.4.c Material characteristics The concrete strengths measured by
the Smidt rebound hammer are 30.7 MPa for C1/4, 30.0 MPa for C2/4 and 32.7 MPa for C3/4.
The strength of the grout was determined by the normative tests on 3 beams of grout 40x40x150mm for each concrete cube. The results are sumarized in Tab 3.4.1. Other material characteristics are the same as presented in the part 3.1.c.
Fig. 3.4.1 Set-up of tests C1/4, C2/4 and C3/4
Tensile strength in
bending Compressive strength Density Test specimen [MPa] [MPa] [kg/m3]
C1/4 5.9 49.5 2203 C2/4 5.5 50.5 2205 C3/4 5.5 49.3 2206
Tab.3.3.1 Material characteristics of grout
3.4.d Loading procedure The loading procedure shown in Fig. 3.2.2 was applied. The measurements were
recorded at the force levels marked by points in the diagram. At each force level the measurement was repeated if necessary (see chap. 3.1.b) while the force value was hold. The

actual loading procedure with repeated measurements is shown in Fig.3.4.2 for the test C1/4. Each point corresponds to one taken measurement of all installed transducers. The minimum value of the force was approximately 15kN. This value was chosen arbitrarily and it should ensure that neither transducers nor the steel bar and the steel plate would not move after unloading.
0
100
200
300
400
500
600
0 50 100 150 200 250 300 350 400
No. of measurement [-]
Forc
e [k
N]
Fig. 3.4.2 Actual loading procedure with all measurement points for C1/4 test
3.4.e Results Tests of three specimens C1/4, C2/4 and C3/4 with this set-up were carried out. As the loading force was increased, all three tests failed because of the eccentricity of the cylindrical „head“ placed on the steel bar and the non-homogeneity of concrete (the „head“ overturned), see Fig. 3.1.5. The position in loading procedure where each test failed is marked in Fig. 3.4.3.
0100200300400500600700
0 200 400 600 800 1000 1200
Tim e [s ]
Forc
e [k
N]
C1/4C2/4 C3/4
Fig. 3.4.3 Reached load at C…/4 test failure

0
50
100
150
200
250
300
350
400
450
500
0 1 2 3 4 5 6 7
Displacement [mm]
Forc
e [k
N]
I14I15
0
50
100
150
200
250
300
350
400
450
500
550
600
0 1 2 3 4 5 6 7 8
Displacement [mm]
Forc
e [k
N]
I18I19
550
600
Fig. 3.4.4 Force-displacement relation of test C1/4 measure devices I14, I15, I18, I19 placed on steel plate

0
100
200
300
400
-0,14 -0,12 -0,1 -0,08 -0,06 -0,04 -0,02 0
Displacement [mm]
Forc
e [k
N]
I10I13
0
100
200
300
400
500
600
-0,2 -0,18 -0,16 -0,14 -0,12 -0,1 -0,08 -0,06 -0,04 -0,02 0
Displacement [mm]
Forc
e [k
N]
I11I12
Fig. 3.4.5 Force-displacement relation of test C1/4 for measure devices I10, I11, I12, I13 placed on concrete cube corners
500
600

0
100
200
300
400
500
600
-5 -4,5 -4 -3,5 -3 -2,5 -2 -1,5 -1 -0,5 0
Displacement [mm]
Forc
e [k
N]
I16I17
Fig. 3.4.6 Force-displacement relation of test C1/4 for measure devices I16, I17 placed on steel bar
0
50
100
150
200
250
300
350
400
450
500
-4 -3,5 -3 -2,5 -2 -1,5 -1 -0,5 0
Displacement [mm]
Forc
e [k
N]
C1/4C2/4C3/4
Fig. 3.4.7 Force-displacement relation of test C1/4, C2/4 and C3/4 for the average of measure devices I16 and I17 {=(I16+I17)/2}

3.5. Pull-out of anchor bolt
3.5.a General set-up The general set-up is
depicted in Fig. 3.5.1. The cube made of plain concrete was cast in June 2001. The threaded rod M20 was cast-in. The aluminium profile KNAUF UD75, put in the mould only fixed the rod in the right position and has no influence on the test. Two hydraulic jacks were placed on the plaster layer to ensure their vertical position and good transfer of reaction to the concrete block. The beam was constituted of two UPN 140 profiles (depth is 140mm) and stiffeners made of angels that were welded to UPNs above the jacks. The rod passed between the webs of UPNs. The load was transferred to the rod via the steel 20mm thick plate with drilled hole with the diameter 22mm and the nut threaded on the rod.
Fig. 3.5.1 Set-up of tests A1, A2 and A3
Three specimens of this type were tested and the tests were named as A1, A2 and A3.
3.5.b Measurements During the test inductive transducers measured the vertical displacement of 7 points.
See Fig. 3.5.2 for the transducers position. I10 measured the displacement of the end of the rod. I20 and I21 were placed on the small steel plate tight by two nuts M20. They measured the deformation of the threaded rod 56mm above the concrete surface. All other measuring devices, i.e. I22, I23, I24, I25, were placed on the little smooth cupreous plates glued on the concrete surface. All LVDTs measured displacements relatively to the concrete top surface edges.
The measured values of displacement and the force value in the jacks were recorded automatically by the UPM Hottinger Baldwin and a personal computer.
The test was controlled by the displacement measured by I10. After setting of the required value of displacement, the values of displacements were recorded each 30s until the differences between previous and following values of all displacements became less than 1% of their previous value.

3.5.c Material characteristics Concrete blocks were cast more than 120 days before the tests. The value 27 MPa was found as the average strength measured on 6 concrete cubes with the nominal edge length equal to 150mm. The Young’s modulus according to ISO 6784 was determined as 25300 MPa. The threaded rod was made of S235 steel.
3.5.d Loading procedure The loading procedure is shown in Fig. 3.5.3 for
the A1 test and in Fig. 3.5.4 for the tests A2 and A3. It was based on ECCS recommendation, however, because of the set-up, it was impossible to apply the compressive force and thus the rod is subjected only to the zero-to-tension forces. Therefore the requested displacement was reached while loading and, while unloading, some residual displacement remained and unloading branch was stopped when the value of the force had decreased
to 18kN approximately. This value was set arbitrarily and it should ensure that neither transducers nor the steel beam and the steel plate would not move after unloading. The ey value was estimated as 1mm for the end of the rod.
Fig. 3.5.2 Position of measuring devices for anchor bolt pull-out test
When the displacement approximately 15mm was reached, the measuring device I10 was removed to prevent its damage in the case of the rod failure. The test continued controlled by the force until the rod failure. The displacement of the rod end was furthermore measured by the calliper. These values are nevertheless only approximate. During the A3 test the failure seemed to occur under the concrete surface and all the transducers thus would be in potential danger of damage in the case of the rod failure. It was why the test was stopped at I10 displacement equal to 16mm and failure was not reached.
The measurements were recorded at the I10 displacement levels marked by points in
0
2
4
6
8
10
12
14
16
0 50 100 150 200 250 300 350Time [min]
Dis
plac
emen
t I10
[mm
]
Fig. 3.5.3 Loading procedure for anchor pull-out test A1

the diagram. At each level the measurement was repeated if necessary (see chap. 3.5.b) while the I10 displacement value was hold. The actual loading procedure with repeated measurements is shown in the Fig.3.5.5 for the test A1. Each point corresponds to one taken measurement of all installed transducers.
0
2
4
6
8
10
12
14
16
18
20
0 100 200 300 400 500 600Time [min]
Dis
plac
emen
t I10
[mm
]
Fig. 3.5.4 Loading procedure for anchor pull-out tests A2 and A3
0
24
68
10
1214
16
0 50 100 150 200 250 300
No. of measurement [-]
Dis
plac
emen
t I10
[mm
]
Fig. 3.5.5 Actual loading procedure with all measurement points for A1 test

3.5.e Results Tests of three specimens A1, A1 and A3 with this set-up were carried out. The failure
of A1 and A2 was caused by steel rod in tension. Test A3 was stopped before collapse, see part 3.5.d.
0
20
40
60
80
100
120
0 5 10 15 20 25 30
Displacem ent [m m ]
Forc
e [k
N]
Fig 3.5.6 Force-displacement relation of the measuring device I10 (end of the threaded rod) for the test A1

0
20
40
60
80
100
120
0 0,2 0,4 0,6 0,8 1 1,2 1,4 1,6 1,8 2
Displacement [mm]
Forc
e [k
N]
I20
I21
Fig. 3.5.7 Force-displacement relation of measuring devices I20 and I21 (on the steel plate fixed to the rod, 56mm above the concrete surface) for the test A1
0
20
40
60
80
100
120
140
-0,002 0 0,002 0,004 0,006 0,008 0,01
Displacement [mm]
Fig. 3.5.8 Force-displacement relation of measuring device I22 (on the concrete 60mm from the rod axis) for the test A1
0
20
40
60
80
100
120
140
0 0,005 0,01 0,015 0,02 0,025 0,03 0,035 0,04 0,045 0,05
Displacement [mm]
Forc
e [k
N]
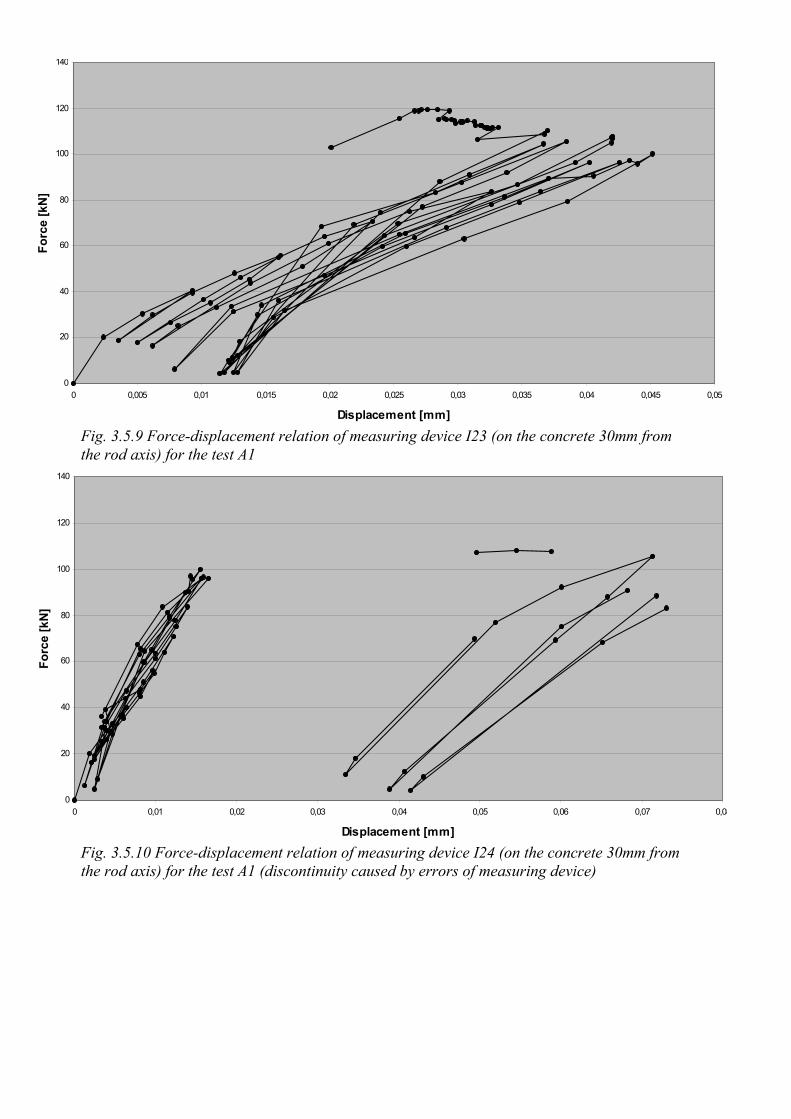
Fig. 3.5.9 Force-displacement relation of measuring device I23 (on the concrete 30mm from the rod axis) for the test A1
0
20
40
60
80
100
120
140
0 0,01 0,02 0,03 0,04 0,05 0,06 0,07 0,08
Displacement [mm]
Forc
e [k
N]
Fig. 3.5.10 Force-displacement relation of measuring device I24 (on the concrete 30mm from the rod axis) for the test A1 (discontinuity caused by errors of measuring device)

0
20
40
60
80
100
120
140
0 0,002 0,004 0,006 0,008 0,01
Displacement [mm]
Forc
e [k
N]
Fig. 3.5.11 Force-displacement relation of measuring device I25 (on the concrete 60mm from the rod axis) for the test A1
0
20
40
60
80
100
120
140
0 0,02 0,04 0,06 0,08 0,1 0,12
Displacement [mm]
Forc
e [k
N]
Fig. 3.5.12 Force-displacement relation of measuring device I22 (on the concrete 60mm from the rod axis) for the test A2
0
20
40
60
80
100
120
140
0 0,1 0,2 0,3 0,4 0,5 0,6 0,7 0,8
Displacement [mm]
Forc
e [k
N]
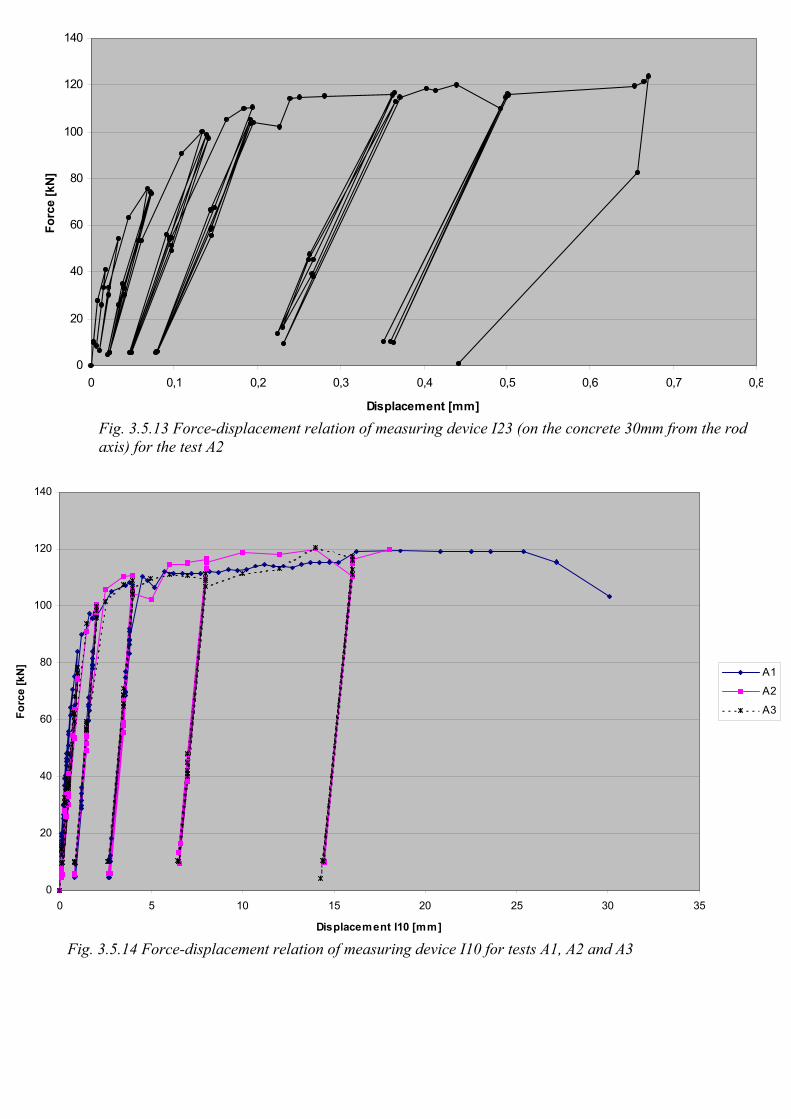
Fig. 3.5.13 Force-displacement relation of measuring device I23 (on the concrete 30mm from the rod axis) for the test A2
0
20
40
60
80
100
120
140
0 5 10 15 20 25 30 35
Displacement I10 [mm]
Forc
e [k
N]
A1
A2
A3
Fig. 3.5.14 Force-displacement relation of measuring device I10 for tests A1, A2 and A3

3.6. T-stub fixed to concrete block loaded in tension
3.6.a General set-up The general set-up is depicted
on the Fig. 3.6.1. The cube made of plain concrete was cast in June 2001. Two threaded rods M20, 540mm long were cast-in. The aluminium profile KNAUF UD75, put in the mould only fixed the rods in the right position and has no influence on the test. 4 hours after the casting the T-stub was positioned on the cube to its final position. The nuts were used just before the test. They were tightened to the torque of 40Nm. (This value was chosen as similar to the hand tightening. The torque was measured to ensure the same conditions to all bolts.) For the T-stub dimensions see Fig. 3.6.2. For the set-up it was necessary to extend the T-stub web. It was provided by welding the 15mm thick steel plate (No.11 in Fig. 3.6.1). To ensure the load transfer to the T-stub web the transversal steel plate P30x100-170 was welded on the top of No.11. Each of two hydraulic jacks were placed each on the concrete cylinder that was put into the plaster layer to ensure their vertical position and good transfer of reaction to the concrete block. The beam constituted of two UPN 140 profiles (depth is 140mm) and stiffeners made of angels were welded to UPNs above the jacks.
Fig. 3.6.1 Set-up of tests TC1, TC2 and TC3
Fig. 3.6.2 Set-up of tests TC1, TC2 and TC3
Before the test two bolts M20 with nuts were placed between the 30mm thick plate and the beam to provide partial articulation. Three specimens of this type were tested and the tests were labelled TC1, TC2 and TC3.

3.6.b Measurements During the test inductive transducers measured the vertical displacement of 9 points.
See Fig. 3.6.3 for the transducers position. I10 measured the displacement of the top surface of the 30mm thick plate welded to the extended T-stub web and it is placed on the smooth cupreous plate glued on the measured surface. I20 and I21 were placed on the little cantilevers made of aluminium L30x40x4-10 and glued on the T-stub web. Bottom surface of cantilevers was 5mm above the concrete surface. I23 and I24 were on the top of the bolts (threaded rods). All other measuring devices, i.e. I24, I25, I26, I27, were placed on the top surface of the T-stub flange in all four corners. All LVDTs measured displacements relatively to the concrete top surface edges.
The measured values of displacement and the force value in the jacks were recorded automatically by the UPM Hottinger Baldwin and a personal computer.
The test was controlled by displacement measured by I10. After setting of the required value of I10, the values of displacements were recorded each 30s until the differences between previous and following values of all displacements became less than 1% of previous value.
Fig. 3.6.3 Position of measuring devices for T-stub in tension test
3.6.c Material characteristics Concrete blocks were cast more than 120 days before the tests. The value 32 MPa was
found as the average strength measured on 6 concrete cubes with the nominal edge length equal to 150mm. The Young’s modulus according to ISO 6784 was determined as 27400 MPa. The threaded rods was made of S235 steel. The standard coupon tensile tests of the base material of T-stub were carried out (according to EN 10002-1). Two sets of 3 coupon were prepared from the T-stub flange in two directions perpendicular one to another. For the stress-strain relation in the direction perpendicular to T-sub web plane see Fig. 3.6.4. Average yield strength was determined as ReH = 272.4 MPa, average ultimate strength as Rm = 411.9 MPa, ductility (failure strain) A=32.7% and transversal contraction Z=67%. For another direction the values were following: ReH = 301.8 MPa, Rm = 412.1 MPa, A=36.8%, Z=65.5%.

Fig. 3.6.3 Position of measuring devices for T-stub in tension test
0,0
50,0
100,0
150,0
200,0
250,0
300,0
350,0
400,0
450,0
0,000 0,025 0,050 0,075 0,100 0,125 0,150 0,175 0,200 0,225 0,250 0,275 0,300 0,325 0,350
strain [-]
stre
ss [M
Pa] Specimen 1
Specimen 2Specimen 3
Fig. 3.6.4 Stress-strain relation of T-stub flange perpendicularly to web plane
3.6.d Loading procedure The loading procedure is shown in the Fig. 3.6.5 for the TC1 test (TC2 and TC3 tests
differs only in two more repetitions of the loading-unloading with peak value at 0,7mm). It was based on ECCS recommendation, however, because of the set-up, it was impossible to apply the compressive forces and thus the T-stub was subjected only to the zero-to-tension force. Therefore the requested displacement was reached while loading and, while unloading, some residual displacement remained and the unloading branch was stopped when the value of force decreased to 18kN approximately. This value was set arbitrarily and it should ensure that neither transducers nor the steel beam and the T-stub would not move after the unloading. The ey value was estimated as 1mm for the point measured by I10.
When the third measuring at the I10 value equal to 9mm was recorded, the measuring device I10 was removed to prevent its damage in the case of T-stub or bolt failure. The test continued controlled by the force until the bolt failure. The displacement of the rod end was furthermore measured by the calliper. These values are nevertheless only approximate. The measurements are recorded at the I10 displacement levels marked by points in the diagram. At each level the measurement was repeated if necessary (see chap. 3.6.b) while the I10 displacement value was hold. The actual loading procedure with repeated measurements is shown in the Fig. 3.6.6 for the test TC1. Each point corresponds to one taken measurement of all installed transducers.
0123456789
10
0 50 100 150 200 250 300 350 400
Time [s]
Dis
plac
emen
t I10
[mm
]
Fig. 3.6.5 Loading procedure for T-stub on concrete tension test TC1

0123456789
10
0 20 40 60 80 100 120 140 160 180 200
No. of measurement [-]
Dis
plac
emen
t I10
[mm
]
3.6.e Results
Fig. 3.6.6 Actual loading procedure with all measurement points for TC1 test
Tests of three specimens TC1, TC2 and TC3 with this set-up were carried out. However the failure of all tests was caused by steel rod (bolt) in tension, the large plastic deformation occured in T-stub.
0
2 0
4 0
6 0
8 0
1 0 0
1 2 0
1 4 0
1 6 0
1 8 0
0 5 1 0 1 5 2 0 2 5 3 0
Dis p la ce m e n t [m m ]
Forc
e [k
N]
Fig. 3.6.7 Force-displacement relation of the measuring device I10 for the test TC1, dashed line is the measurement by calliper

0-1 0 1 2 3 4 5 6 7 8 9 10
Displacement [mm]
20
40
60
80
100
120
140
160
180Fo
rce
[kN
]
I20
I21
Fig. 3.6.8 Force-displacement relation of the measuring device I20 and I21 (cantilevers on the sides of T-stub) for the test TC1
0
20
40
60
80
100
120
140
160
180
0 0,1 0,2 0,3 0,4 0,5 0,6
Displacement [mm]
Forc
e [k
N]
I22
I23
Fig. 3.6.9 Force-displacement relation of the measuring device I22 and I23 (bolts) for the test TC1

0
20
40
60
80
100
120
140
-0,25 -0,2 -0,15 -0,1 -0,05 0 0,05 0,1 0,15
Displacement [mm]
Forc
e [k
N]
I24
I25
Fig. 3.6.10 Force-displacement relation of the measuring device I24 and I25 (corners of T-stub flange) for the test TC1
0
20
40
60
80
100
120
140
-0,15 -0,1 -0,05 0 0,05 0,1 0,15
Displacement [mm]
Forc
e [k
N]
I26
I27
Fig. 3.6.11 Force-displacement relation of the measuring device I26 and I27 (corners of T-stub flange) for the test TC1

0
20
40
60
80
100
120
140
0 1 2 3 4 5 6 7 8 9 10
Displacement of I10 [mm]
Forc
e [k
N]
TC1
TC2
TC3
Fig. 3.6.12 Force-displacement relation of the measuring device I10 for the tests TC1, TC2 and TC3