map annual general meeting - assets.contentful.com · annual general meeting 19 may 2011....
TRANSCRIPT

MAp MAp Annual General Meeting
19 May 2011

DisclaimerDisclaimer
General Securities Warning
This presentation is not an offer or invitation for subscription or purchase of or a recommendation of securities. It does not take into account the investment objectives, financial situation and particular needs of the investor. Before making an investment in MAp, the investor or prospective investor should consider whether such an investment is appropriate to their particular investment needs, objectives and financial circumstances and consult an investment adviser if necessary.
Information, including forecast financial information, in this presentation should not be considered as a recommendation in Information, including forecast financial information, in this presentation should not be considered as a recommendation in relation to holding purchasing or selling shares, securities or other instruments in MAp. Due care and attention has been used in the preparation of forecast information. However, actual results may vary from forecasts and any variation may be materially positive or negative. Forecasts by their very nature, are subject to uncertainty and contingencies many of which are outside the control of MAp. Past performance is not a reliable indication of future performance.
Foreign OwnershipForeign Ownership
MAp advised on 9 May 2011 that its foreign ownership was 36.9%.
MAp is not a “Foreign Person” under the Airports Act 1996 for so long as foreign ownership of MAp remains below 40%. As such, MAp is not currently a Foreign Person.
The MAp constitutions set out the process for disposal of securities to prevent MAp from becoming a Foreign Person or to cure the situation where MAp becomes a Foreign Person (Foreign Ownership Situation). Where a Foreign Ownership Situation occurs or is likely to occur, MAp can require a foreign security holder (on a last in first out basis) to dispose of MAp stapled securities. MAp has the power to commence procedures to divest foreign security holders once the foreign ownership of MAp reaches 39.5% under the Foreign Ownership Divestment Rules that it has adopted. If the foreign security holder fails t di f it MA t l d iti MA ll th iti t th b t i bl bt i bl t th tito dispose of its MAp stapled securities, MAp may sell those securities at the best price reasonably obtainable at the time.
2
MAp Airports Limited ABN 85 075 295 760 AFSL 236875
DirectorsDirectors
MAp Airports Limited (MAPL) MAp Airports International Limited (MAIL)
• Max Moore-Wilton (Chairman)
• Trevor Gerber
• Bob Morris
• Jeffrey Conyers (Chairman)
• Sharon Beesley
• Stephen Ward
• The Hon Michael Lee
• John Roberts
• Stephen Ward
p
• Max Moore-Wilton
• Stephen Ward
• Kerrie Mather
3

AgendaAgenda
1. Chairman’s Address
2 CEO’s Report2. CEO s Report
3. Formal Proceedings
4. Refreshments
4

1. Chairman’s Address

MAp TodayMAp Today
MAp is one of the world’s largest private airport owners and operators
• Ownership of three major airports – Sydney, Copenhagen and Brussels
• Work closely with the airports’ management teams to improve services and facilities for airline partners and the 74 million passengers who use the airports each year, and to increase returns for investors
6

Recent Operating EnvironmentRecent Operating Environment
MAp’s Airports Have Been Resilient Despite Challenging Operating Conditions
• MAp delivered proportionate earnings growth throughout the GFC
• Proven traffic resilience and recovery – Sydney and Copenhagen now delivering traffic at above pre-GFC levels, Brussels delivering strong underlying growth
• Significant revenue protections – long term aeronautical charging agreements, minimum guarantees in retail operations
• Cost discipline
• Distribution fully covered by earnings, 91% covered by operating cash flow
• Strong balance sheet with surplus cash and no immediate refinancing needs
7

FY10 Performance HighlightsFY10 Performance Highlights
Outstanding Proportionate Earnings Growth
• FY10 proportionate earnings grew 19.3% to A$445.4m, supported by 6.9% traffic growth
• EPS of 23.9c (up 10.9%) despite entitlement offer dilution, ash cloud, flat/reducing aero charges in Europe and currency headwinds
• Statutory profit of $100.8m1
Key Highlights
• Total security holder return of 10.4% in 2010, versus ASX200 return of -2.5%
• Traffic growth at all three airports
A$1 9b S d fi i f th tf li t iti til D b 2012• A$1.9bn Sydney refinancing – no further portfolio maturities until December 2012
• Aeronautical charges agreements at Copenhagen and Brussels
• Opening of Sydney T1 Redevelopment and CPH Go
• Met commitment on incremental costs of internalisation
• 21cps regular distribution, fully covered by proportionate earnings
8
• 12.5cps special distribution of ASUR sale proceeds
1. Refer to http://www.mapairports.com.au/assets/Uploads/ASX-Release-MAp-Financial-Statements-24-February-2011.pdf for full statutory financial results
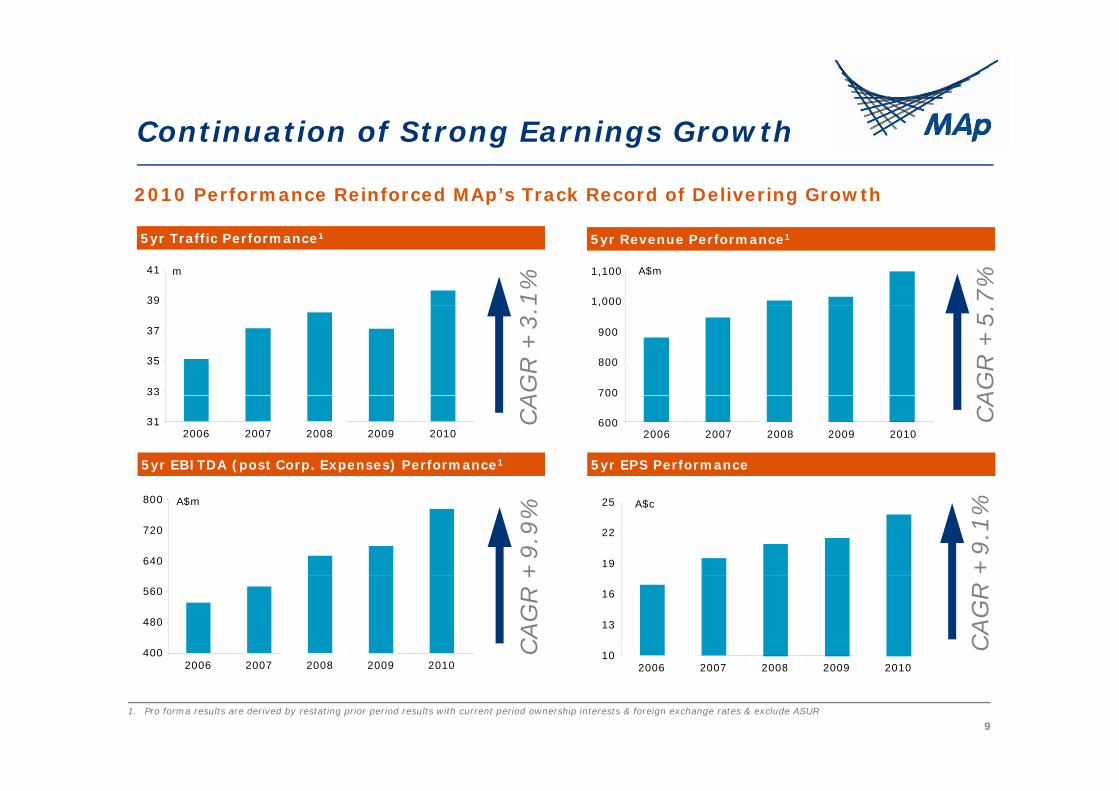
Continuation of Strong Earnings GrowthContinuation of Strong Earnings Growth
2010 Performance Reinforced MAp’s Track Record of Delivering Growth
5yr Revenue Performance15yr Traffic Performance1
1%
7%
m
39
41 A$m
1,000
1,100
AG
R +
3.
AG
R +
5.
33
35
37
700
800
900
,
5yr EBITDA (post Corp. Expenses) Performance1 5yr EPS Performance
CA CA
312006 2007 2008 2009 2010
600
700
2006 2007 2008 2009 2010
+9.
1%
+9.
9%A$m
640
720
800 A$c
19
22
25
CAG
R
CAG
R +
400
480
560
2006 2007 2008 2009 201010
13
16
2006 2007 2008 2009 2010
91. Pro forma results are derived by restating prior period results with current period ownership interests & foreign exchange rates & exclude ASUR
2006 2007 2008 2009 2010 2006 2007 2008 2009 2010

2. CEO’s Report

1Q11 Performance Update

Airport Highlights 1Q11Airport Highlights 1Q11
MAp’s Airports Delivered Pro Forma EBITDA Growth Above Traffic Growth
Financial Highlights
• Pro forma EBITDA growth of 3.8%; traffic growth of 2.7%
• Corporate expenses up just 2.6%Corporate expenses up just 2.6%
• Despite local currency EBITDA growth at each airport, FX movements led to an 8.6% drop in 1Q11 proportionate earnings
• Earnings per security of 4 9 cents• Earnings per security of 4.9 cents
• Cash balance of A$830m
Operational Highlights
• China became Sydney’s third largest inbound market
B l t ffi th f 6 7%• Brussels traffic growth of 6.7%
• Copenhagen commercial revenues growth
• New capex funding at Copenhagen, fully funding investment programme until March 2015
12

Sydney 1Q11Sydney 1Q11
Passenger Traffic from China Continues to Grow Rapidly
• EBITDA growth of 3.4%; 5.1% adjusted for non-recurring items
• China now third largest inbound market
Sydney Airport 1Q11 (vs pcp)1,2
+4.4%
+4.0%
+5.0%
• Retail revenue grew at 5% per passenger
• Central Terrace Building & taxi rank +1.5%
+3.4%
+1 0%
+2.0%
+3.0%
projects
• Strong outlook for demand & supply side passenger traffic drivers
+0.0%
+1.0%
Traffic Revenue EBITDA 2
131. Based on 100% Ownership and Local Currency2. Before specific items

Copenhagen 1Q11Copenhagen 1Q11
Copenhagen is A World Leader in the Uptake of New Technologies
• EBITDA growth of 2.7%; 6.2% adjusted for non-recurring items
• Implementation of new technologies for
Copenhagen Airports 1Q11 (vs pcp)1,2
+3 5%
+4.3%+4.0%
+5.0%
check-in and way finding
• Strong retail revenue growth
+3.5%
+2.7%
+1 0%
+2.0%
+3.0%
• Relaunch of car parking leisure product
• Well positioned for the future:+0.0%
+1.0%
Traffic Revenue EBITDA 2
— 3.2% aeronautical charges increase from April 2011
— Further long-haul traffic announcements
141. Based on 100% Ownership and Local Currency2. Before specific items

Brussels 1Q11Brussels 1Q11
Brussels is Benefiting From an Increasing Star Alliance Presence
• EBITDA growth of 6.7%
• Traffic growth of 6.7%; strong growth from the Star Alliance carriers
Brussels Airport 1Q11 (vs pcp)1,2
+6.7% +6.7%
+6.0%
+7.5%
• Opex initiatives including contract retenders
+4.1%
+1.5%
+3.0%
+4.5%
• Brussels outlook is excellent:
— 3.65% aeronautical charges increase from April 2011
+0.0%
+1.5%
Traffic Revenue EBITDA 2
— Further benefits of retendered contracts
151. Based on 100% Ownership and Local Currency2. Before specific items

Key Initiatives UpdateKey Initiatives Update
Major Projects are Continuing to Drive Growth at MAp’s Airports
Airport Recently Completed Work In Progress
Sydney •International Terminal Redevelopment
• Refinancing 2011-2012 Debt Maturities
• PC Inquiry
• Central Terrace Buildingg
• Qantas Seamless Transfer Facility
g
• T2 Wide-body Gates
• SKIES Remarketing Process
Copenhagen • CPH Go Terminal Development
• Reduced Minimum Connect Times
• Baggage Handling Capacity
• CADH Refinancing Process
• Revised Aeronautical Charges Agreement
Brussels • 5-year Aeronautical Charges Agreement • Connector Building Development
• Major Operating Expense Contract Retenders
• Development Plan for 2011-2016
• Gateway Tender Process
16

Sustainability UpdateSustainability Update
Key Initiatives Have Been Undertaken at Each Airport
Airport Initiative Summary
Sydney • Airport Environment Strategy approved by the Australian Government in 2010:
— Climate change & energy management
— Water & waste management
— Air quality
— Ground based noise
— Biodiversity & conservation managementBiodiversity & conservation management
Copenhagen • New waste removal plan for 2011–2014
• Nitrogen oxide charge for older aircraft types• Nitrogen oxide charge for older aircraft types
Brussels • Achieved Airports Council International “Reduction” rating
— Reduced CO2 emissions by over 10,000 tonnes in 2010
• Water treatment plant
171. Under the Airport Carbon Accreditation Initiative

Balance Sheet & Balance Sheet & Distributions

Balance Sheet Strength & DiversificationBalance Sheet Strength & Diversification
MAp Holds Approximately A$830m on its Balance Sheet
• Well-advanced refinancing arrangements for next maturity (Copenhagen Dec-12)
• No other maturities until October 2013 although exploring options for SKIES
Maturity Profile of Airport Debt (Based On 100% Ownership)1Maturity Profile of Airport Debt (Based On 100% Ownership)1
3.0 A$bn AverageMaturity
2.0
2.5
1.0
1.5
Sydney Copenhagen Brussels
0.0
0.5
2011 2012 2013 2014 2015 2016 2017 2018 2019 2020 2021 2022 2023+
191. Copenhagen includes CADH
Sydney Copenhagen Brussels
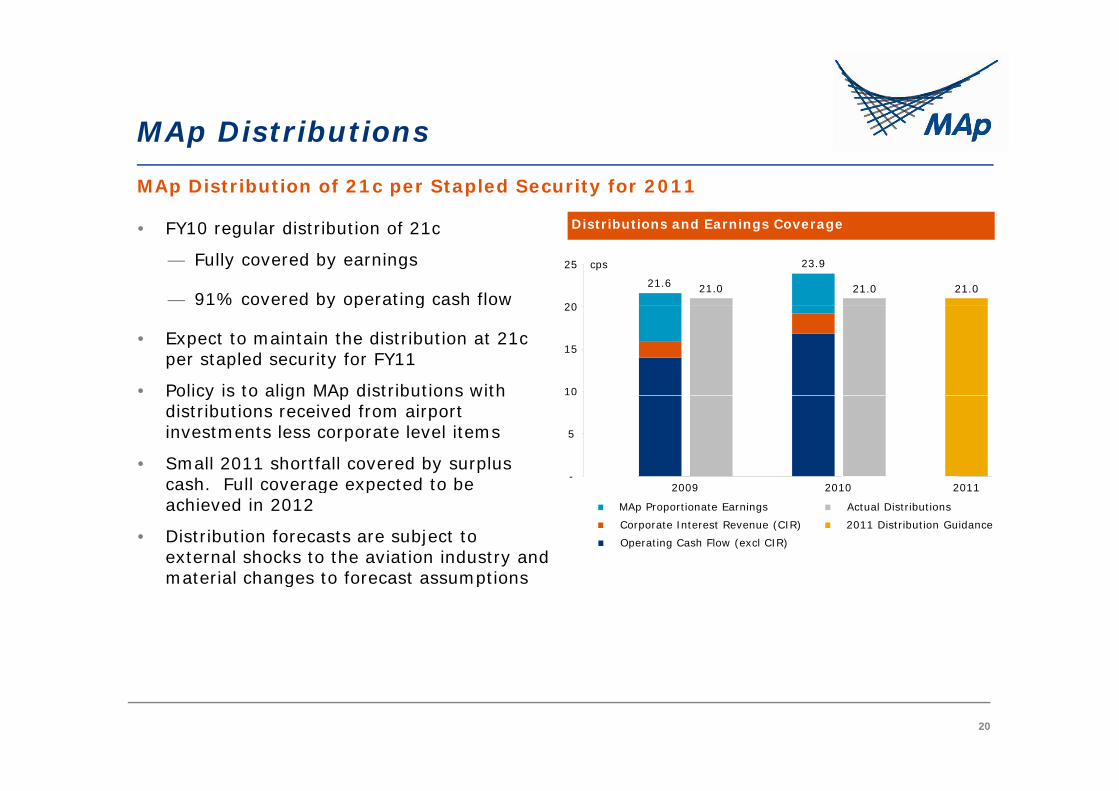
MAp DistributionsMAp Distributions
MAp Distribution of 21c per Stapled Security for 2011
• FY10 regular distribution of 21c
— Fully covered by earnings
— 91% covered by operating cash flow
Distributions and Earnings Coverage
21.6 21.0
23.9
21.0 21.0
20
25 cps
y p g
• Expect to maintain the distribution at 21c per stapled security for FY11
• Policy is to align MAp distributions with 10
15
20
Policy is to align MAp distributions with distributions received from airport investments less corporate level items
• Small 2011 shortfall covered by surplus cash Full coverage expected to be -
5
2009 2010 2011cash. Full coverage expected to be achieved in 2012
• Distribution forecasts are subject to external shocks to the aviation industry and material changes to forecast assumptions
2009 2010 2011
Operating Cash Flow (excl CIR)Corporate Interest Revenue (CIR)MAp Proportionate Earnings Actual Distributions
2011 Distribution Guidance
material changes to forecast assumptions
20

Traffic Growth & Capacity

Traffic - SupplyStructural Changes in Aviation MarketStructural Changes in Aviation Market
MAp’s Airports Will Benefit from Industry Change Driving Traffic Growth
• Aircraft Technology
• Liberalisation of Air Rights
• Low Cost Carrier Development
• Alliance Expansion & Airline Integration
22

Traffic – DemandInbound TrendsInbound Trends
Strong Growth is Expected From Key Inbound Markets
Inbound Trends
• Increased options for air travel
Market 2009-2020 Growth
2009 % of Australian Inbound Traffic
2020 % of Australian Inbound Traffic
China 8.5% 6.6% 10.6%
• Lower real airfares
• Relationship between income and air travel, driving growth in high population
Middle East 10.4% 1.9% 3.7%
India 8.9% 2.2% 3.8%
nations with lower levels of income
• China-specific:
Total 10.7% 18.1%
Source: Australian Government, Tourism Research Australia, Tourism Forecasting Committee, “Forecast 2010 Issue 2”, page 15
— High middle class population growth
— Rapidly increasing propensity to travel
— Expansion of cultural links
23
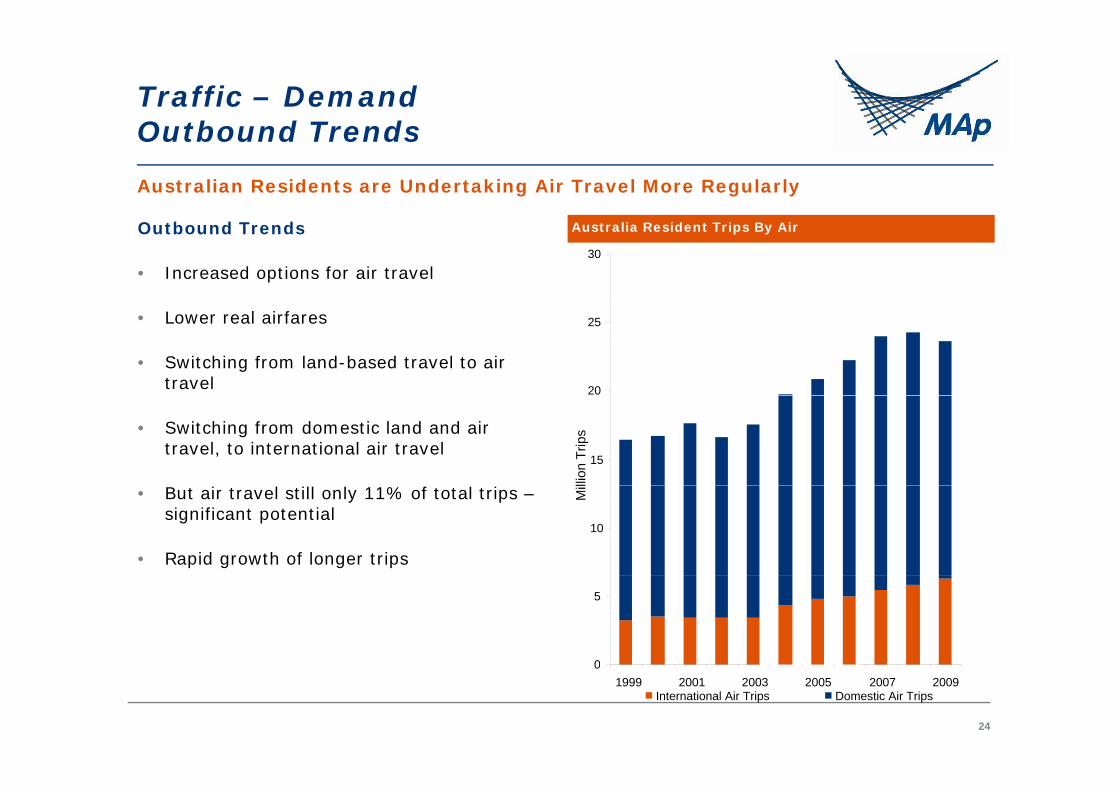
Traffic – DemandOutbound TrendsOutbound Trends
Australian Residents are Undertaking Air Travel More Regularly
Outbound Trends
• Increased options for air travel
Australia Resident Trips By Air
30
• Lower real airfares
• Switching from land-based travel to air travel 20
25
• Switching from domestic land and air travel, to international air travel
15
llion
Trip
s
• But air travel still only 11% of total trips –significant potential
• Rapid growth of longer trips
10
Mil
0
5
24
01999 2001 2003 2005 2007 2009
International Air Trips Domestic Air Trips
Sydney CapacitySydney Capacity
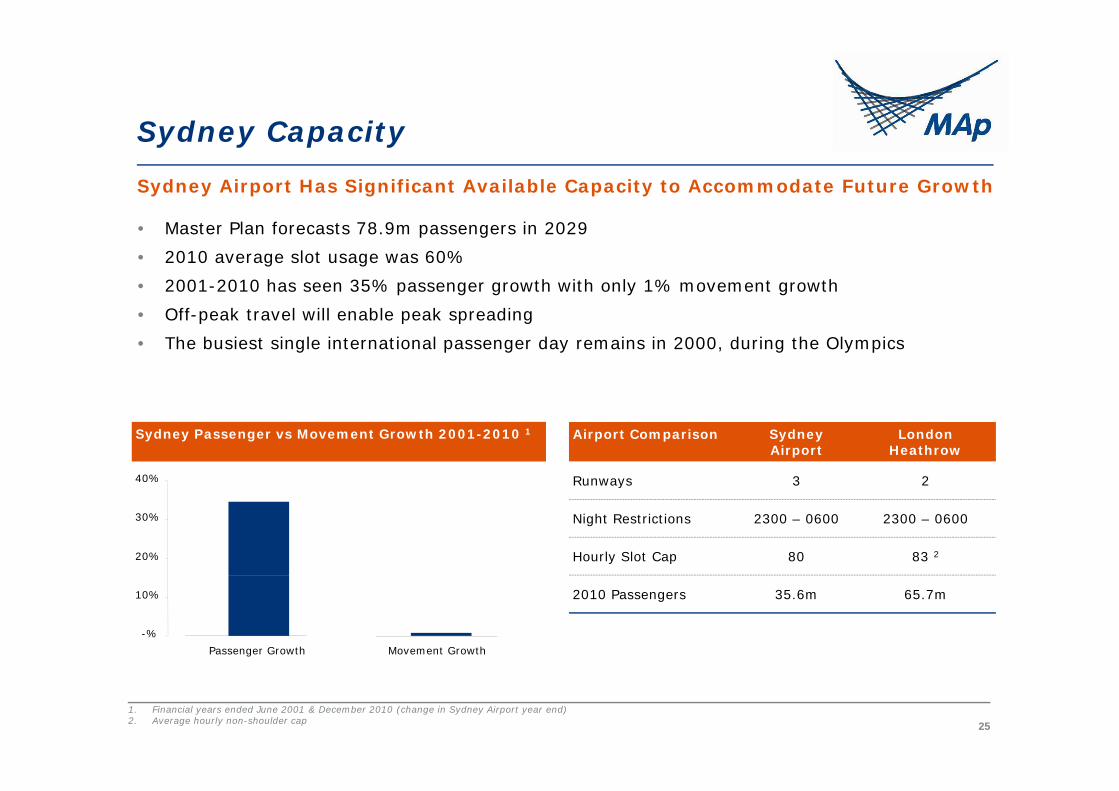
Sydney Airport Has Significant Available Capacity to Accommodate Future Growth
• Master Plan forecasts 78.9m passengers in 2029• 2010 average slot usage was 60%• 2001-2010 has seen 35% passenger growth with only 1% movement growth• Off-peak travel will enable peak spreading• The busiest single international passenger day remains in 2000, during the Olympics
Sydney Passenger vs Movement Growth 2001-2010 1
40%
Airport Comparison Sydney Airport
London Heathrow
Runways 3 2
20%
30%
Runways 3 2
Night Restrictions 2300 – 0600 2300 – 0600
Hourly Slot Cap 80 83 2
-%
10%
Passenger Growth Movement Growth
2010 Passengers 35.6m 65.7m
251. Financial years ended June 2001 & December 2010 (change in Sydney Airport year end)2. Average hourly non-shoulder cap

MAp Outlook
Positive OutlookPositive Outlook
Strong Organic Growth Opportunities Exist at Each of MAp’s Airports
• MAp’s outlook remains strong:
— Substantial traffic opportunities at each airport
— European airport aero charges increases
— Relaunch of retail and car parking businesses
— Opex savings projects
— No debt maturities until December 2012
• MAp focus on delivering positive outcomes on major business initiatives
27
3. Formal Proceedings

Summary of BusinessSummary of Business
• Receive MAp Airports International Limited audited financial statements
• Re-appoint KPMG as auditor
• Elect directors
29

Proxies ReceivedProxies Received
• Total number of MAp securities is 1,861,210,782
Resolution Valid Proxies Received
MAIL Resolution 1 1,197,611,167
MAIL Resolution 2 1,197,611,167
MAT2 Resolution 1 1,197,611,167
MAT2 Resolution 2 1,197,611,167
lMAT2 Resolution 3 1,197,611,167
30
MAIL Resolution 1MAIL Resolution 1
• To re-appoint KPMG as auditor of the Company and to authorise the directors to determine its remuneration
31

MAIL Resolution 2 & MAT2 Resolutions 1 3MAIL Resolution 2 & MAT2 Resolutions 1-3
• To re-elect Stephen Ward as a director of MAp Airports International Limited
• To approve the re-election of Bob Morris as a director of MAp Airports Limited by its shareholderLimited by its shareholder
• To approve the election of Stephen Ward as a director of MAp Airports Limited by its shareholder
• To approve the re-election of Michael Lee as a director of MAp Airports Limited by its shareholder
32

Voting CardsVoting Cards
MApMAp
NON VOTING
ADMISSION CARD VISITOR
MAp
SECURITYHOLDER/ADMISSION
CARD
SECURITYHOLDER/
PROXYHOLDER
ADMISSION &ADMISSION &
VOTING CARD
33
Questions

Proxy ResultsProxy Results
• Total number of MAp securities is 1,861,210,782
Resolution For Against Undirected Abstaing
MAIL Resolution 1 xx xx xx xx
MAIL Resolution 2 xx xx xx xx
MAT2 Resolution 1 xx xx xx xx
MAT2 Resolution 2 xx xx xx xx
lMAT2 Resolution 3 xx xx xx xx
35

Voting

Destruction of Proxy Forms & Destruction of Proxy Forms & Voting Papers
4. Refreshments

MAp MAp Annual General Meeting
19 May 2011