map of the 2010 greendale fault surface rupture ... ·...
TRANSCRIPT
Map of the 2010 Greendale Fault surface rupture, Canterbury, New Zealand: application to land use
planning1
P Villamora*, N Litchfielda, D Barrellb, R Van Dissena, S Hornblowc, M Quigleyc, S Levicka, W Riesa, B Duffyc, J Begga,
D Townsenda, T Stahlc, E Bilderbackc, D Noblec, K Furlongd and H Grante
aGNS Science, Lower Hutt, New Zealand; bGNS Science, Dunedin, New Zealand; cDepartment of Geological Sciences, University ofCanterbury, Christchurch, New Zealand; dPenn State University, University Park, USA; eEnvironment Canterbury, Christchurch, New Zealand
(Received 4 December 2011; final version received 10 March 2012)
Rupture of the Greendale Fault during the 4 September 2010, MW7.1 Darfield (Canterbury) earthquake produced a zone ofground-surface rupture that severely damaged several houses, buildings and lifelines. Immediately after the earthquake, surfacerupture features were mapped in the field and from digital terrain models developed from airborne Light Detection and Ranging(lidar) data. To enable rebuild decisions to be made and for future land use planning, a fault avoidance zone was defined for theGreendale Fault following the Ministry for the Environment guidelines on ‘Planning for the Development of Land on or Closeto Active Faults’. We present here the most detailed map to date of the fault trace and describe how this was used to define andcharacterise the fault avoidance zone for land use planning purposes.
Keywords: active fault; surface fault rupture map; fault avoidance zone; strike-slip fault; Darfield earthquake; Canterburyearthquake sequence; land use planning
Introduction
Rupture of the Greendale Fault during the 4 September
2010, MW7.1 Darfield (Canterbury) earthquake produced
a 29.590.5-km-long, 30 to 300-m-wide zone of ground-
surface rupture and deformation, involving 5.290.2 m
maximum horizontal, 1.4590.2 m maximum vertical and
2.590.1 m average net displacement (Quigley et al. 2010a,
2012) (Fig. 1). Information from the Greendale Fault
rupture has contributed significantly to calibrating interna-
tional and national fault scaling relationships (Quigley et al.
2012) and, together with seismic and geodetic data, has
helped define the complex rupture mechanism of the
Darfield earthquake (Beavan et al. 2010; Gledhill et al.
2010, 2011; Holden et al. 2011).As well as advancing the scientific knowledge of fault
rupture mechanics, the surface rupture data acquired is
essential for the recovery of the local community and future
planning. Deformation associated with ground-surface rup-
ture along the Greendale Fault severely damaged several
houses, buildings and infrastructure to the extent that they
need to be rebuilt or repaired (Quigley et al. 2010a,b; Van
Dissen et al. 2011). Our study aims to assist local authorities
in deciding where and what structures can be built orrepaired now that there is a known active fault in this area.
Specifically, we use field mapping, surveying, analysis ofaerial photographs and an airborne Light Detection andRanging (lidar) dataset of the 2010 surface rupture toprecisely locate the fault rupture and define the types ofsurface deformation associated with the rupture. We thenapply the guidelines for mitigating fault surface rupturehazard (Kerr et al. 2003) to define a fault avoidance zone(FAZ). These guidelines were established by a joint workinggroup of the New Zealand Society for Earthquake Engi-neering and the Geological Society of New Zealand underthe auspices of the Ministry for the Environment (MfE) toassist resource management planners to avoid and/ormitigate fault rupture hazard. Our FAZ mapping illustratesmajor elements of the MfE guidelines, and provides anexample of their application.
Geological setting
The Greendale Fault is situated near the outer edge of thebroad zone of deformation marking the boundary betweenthe Australian and Pacific Plates (Figs. 1A, 1B). In thecentral South Island, the Pacific Plate is moving west�southwest relative to the Australian Plate at c. 38 mmyr�1 (Wallace et al. 2007). Approximately 25% of the plateboundary deformation is distributed across numerousreverse and strike-slip faults within and east of the Southern
*Corresponding author. Email: [email protected]
1Supplementary data available online at www.tandfonline.com/10.1080/00288306.2012.680473. Supplementary File 1: Data supplementto Map of the 2010 Greendale Fault surface rupture, Canterbury,New Zealand: Application to land use planning.
New Zealand Journal of Geology and Geophysics
Vol. 55, No. 3, September 2012, 223�230
ISSN 0028-8306 print/ISSN 1175-8791 online
# 2012 The Royal Society of New Zealand
http://dx.doi.org/10.1080/00288306.2012.680473
http://www.tandfonline.com
Dow
nloa
ded
by [
Uni
vers
ity o
f C
ante
rbur
y] a
t 16:
11 0
9 O
ctob
er 2
012

Figure 1 A, Plate tectonic context of New Zealand. B, Location of Greendale Fault. C�I, Ground-surface rupture features mapped along theGreendale Fault. The basemap is a shaded hill relief produced from the lidar data.
224 P Villamor et al.
Dow
nloa
ded
by [
Uni
vers
ity o
f C
ante
rbur
y] a
t 16:
11 0
9 O
ctob
er 2
012
Alps (Norris & Cooper 2001; Pettinga et al. 2001), includingthe Greendale Fault.
The Greendale Fault lies in the Rakaia to Waimakaririsector of the Canterbury Plains. In the central part of theplains, the braided river beds of the Rakaia, Selwyn andWaimakariri rivers coalesced during the last ice age, betweenc. 28 kyr and c. 18 kyr ago (Forsyth et al. 2008 andreferences therein). During that time, alluvial deposits (theBurnham and Windwhistle Formations; Forsyth et al. 2008and references therein) accumulated to thicknesses of tensto hundreds of metres in some areas, burying, or at leastobscuring, the geomorphic expression of slow slip rate activefaults crossing the plains, in particular strike-slip faults, suchas the Greendale Fault. Estimated slip rates on active faultsin this part of Canterbury areBB 2 mm yr�1 (Pettingaet al. 2001; New Zealand Active Fault Database, http://data.gns.cri.nz/af/), consistent with the relatively low (c. 2mm yr�1) geodetic rate of deformation across the entireCanterbury Plains (Wallace et al. 2007). Also, seismicreflection studies prior to 2010 (e.g., Jongens et al. 2012)had not identified a subsurface expression of the GreendaleFault.
Fault mapping
Datasets used for fault mapping
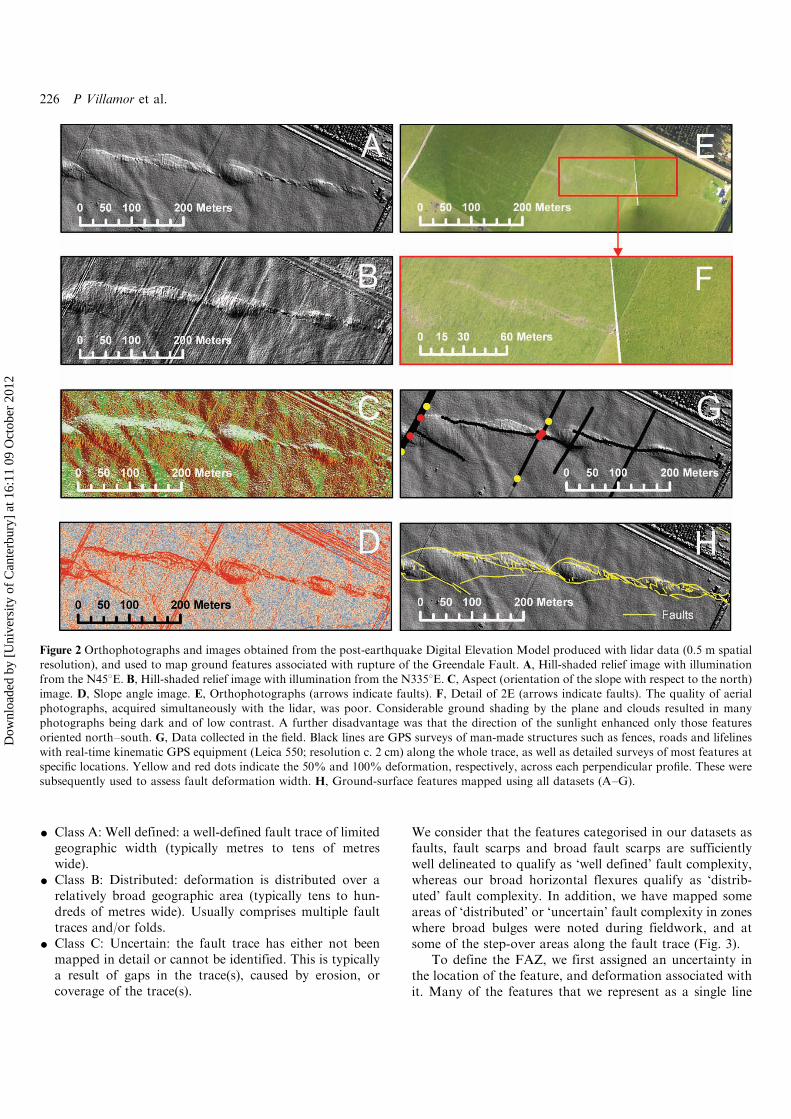
The datasets used in our fault mapping comprise detailedfield mapping, oblique aerial and ground-based photo-graphs (e.g., Barrell et al. 2011), and survey measurementsobtained during the weeks after the 4 September earthquake.We also used lidar images and corresponding aerial ortho-photographs acquired 1 week after the earthquake (seeexamples in Fig. 2).
Our field measurements (Quigley et al. 2010a, 2012) (e.g.,Fig. 2G) have been essential to assess the true width ofdeformation and fault extent that, in some cases, is notconstrained by the lidar data. We mapped as manyindividual faults and fissures as possible in a few areas toassess the types of structures in the deformation zone beforethey were removed by recovery operations. However, due torecovery having been rapid, only a small proportion of thethousands of Greendale Fault surface rupture deformationfeatures were accurately surveyed in the field. Instead, werelied upon the detailed aerial photography and lidarimagery to capture these features during subsequent desk-top mapping. The resolution of the airborne datasets andthe quality of the orthophotographs (Fig. 2) was not idealand thus features with displacementsB0.3 m are likely tohave been missed.
Fault features
We have classified the various mapped fault featuresaccording to their geomorphic expression as ‘faults’, ‘faultscarps’, ‘suspected faults’, ‘broad fault scarps’ and ‘broad
horizontal flexures’ (Figs. 1D�1I). The term ‘faults’ includesfeatures in which the ground was clearly opened such asfissures and strike-slip faults. The category ‘fault scarp’refers to vertical step-like warps of the ground surface.These steps, or changes in elevation, may be purely the resultof folding of the ground, or may include some folding inconjunction with discrete offsets along one or several faults.‘Suspected faults’ include fissures and faults that we notedduring the field mapping campaign, but did not examine indetail. Also within the ‘suspected fault’ category are subtlelineaments visible on the post-earthquake aerial photogra-phy or lidar imagery, but not obvious in the field. The‘broad fault scarp’ category includes very wide (tens ofmetres) or very subtle (amplitude of less than c. 1 m vertical)vertical bends in the ground surface. The ‘broad horizontalflexure’ refers to distributed horizontal shearing over a wideband without the presence of individual surface faults. Mostof these broad horizontal flexures were only revealed onaccount of human-constructed straight lines, such as roads,fences, etc., that were measurably bent.
The Greendale Fault surface rupture displays threesections of different geomorphic character (Figs. 1C�1I).The westernmost 7-km-long section is dominated by a single‘broad fault scarp’ that changes in trend from N1258E toE�W (Figs. 1C, 1I). Along the section from 7 to 23 km(Figs. 1E�1H), most of the features mapped as ‘faults’, as wellas some of the ‘fault scarps’, have three trends: N110�1308E,N161�1808E and N70�928E. Other fault scarps are eitherreverse faults or folds (N29�658E). Part of the deformationalong the eastern and central sections was expressed as a‘broad horizontal flexure’, as well as discrete faults and folds.The easternmost section (23�29 km) is defined uniquely by asingle ‘broad horizontal flexure’ (Figs. 1C, 1D).
Defining the fault avoidance zone
In the MfE guidelines (Kerr et al. 2003), the hazard posed byfault rupture is quantified using two parameters: (1) faultlocation (extent of deformation), and (2) the averagerecurrence interval of surface rupture faulting. In this study,we focus only on the fault location. Two concepts arerelevant for mapping the extent of the deformation, ‘faultavoidance zone’ (FAZ) and ‘fault complexity’. A FAZ isdefined in the MfE guidelines as ‘an area created byestablishing a buffer zone either side of the known faulttrace’. The MfE guidelines recommend a minimum bufferzone width of 20 m either side of the fault trace. Faultcomplexity refers to the width and distribution of thedeformed land defining the fault trace. The final FAZincludes the fault complexity area plus the 20 m setback. TheFAZ concept encompasses and allows for the avoidance ofminor distributed deformation in the vicinity of the fault.
The MfE guidelines recommend differing limitations onland development depending on the specific type of faultcomplexity. The fault complexity categories are given below:
Map of the 2010 Greendale Fault surface rupture, Canterbury, New Zealand 225
Dow
nloa
ded
by [
Uni
vers
ity o
f C
ante
rbur
y] a
t 16:
11 0
9 O
ctob
er 2
012
� Class A: Well defined: a well-defined fault trace of limitedgeographic width (typically metres to tens of metreswide).
� Class B: Distributed: deformation is distributed over arelatively broad geographic area (typically tens to hun-dreds of metres wide). Usually comprises multiple faulttraces and/or folds.
� Class C: Uncertain: the fault trace has either not beenmapped in detail or cannot be identified. This is typicallya result of gaps in the trace(s), caused by erosion, orcoverage of the trace(s).
We consider that the features categorised in our datasets asfaults, fault scarps and broad fault scarps are sufficientlywell delineated to qualify as ‘well defined’ fault complexity,whereas our broad horizontal flexures qualify as ‘distrib-uted’ fault complexity. In addition, we have mapped someareas of ‘distributed’ or ‘uncertain’ fault complexity in zoneswhere broad bulges were noted during fieldwork, and atsome of the step-over areas along the fault trace (Fig. 3).
To define the FAZ, we first assigned an uncertainty inthe location of the feature, and deformation associated withit. Many of the features that we represent as a single line
Figure 2 Orthophotographs and images obtained from the post-earthquake Digital Elevation Model produced with lidar data (0.5 m spatialresolution), and used to map ground features associated with rupture of the Greendale Fault. A, Hill-shaded relief image with illuminationfrom the N458E. B, Hill-shaded relief image with illumination from the N3358E. C, Aspect (orientation of the slope with respect to the north)image. D, Slope angle image. E, Orthophotographs (arrows indicate faults). F, Detail of 2E (arrows indicate faults). The quality of aerial
photographs, acquired simultaneously with the lidar, was poor. Considerable ground shading by the plane and clouds resulted in manyphotographs being dark and of low contrast. A further disadvantage was that the direction of the sunlight enhanced only those featuresoriented north�south. G, Data collected in the field. Black lines are GPS surveys of man-made structures such as fences, roads and lifelines
with real-time kinematic GPS equipment (Leica 550; resolution c. 2 cm) along the whole trace, as well as detailed surveys of most features atspecific locations. Yellow and red dots indicate the 50% and 100% deformation, respectively, across each perpendicular profile. These weresubsequently used to assess fault deformation width. H, Ground-surface features mapped using all datasets (A�G).
226 P Villamor et al.
Dow
nloa
ded
by [
Uni
vers
ity o
f C
ante
rbur
y] a
t 16:
11 0
9 O
ctob
er 2
012

Figure 3 Fault avoidance zones (FAZ) defined for the Greendale Fault. See text for description of the FAZ types. The FAZ for the GreendaleFault consists of an eastern section c. 300-m wide that is characterised by moderately distributed deformation. The central section of the FAZis narrower because many of the rupture features are well-defined. The western section is similar to the central section except for an uncertain
zone around the step-over feature between the Selwyn River and Coaltrack Road.
Map of the 2010 Greendale Fault surface rupture, Canterbury, New Zealand 227
Dow
nloa
ded
by [
Uni
vers
ity o
f C
ante
rbur
y] a
t 16:
11 0
9 O
ctob
er 2
012

actually have some width. For example a fault, in detail, isreally an array of interlocking small fractures over a zone upto several metres wide (e.g., Ando & Yamashita, 2007).Because of resolution limitations of the lidar and aerialphotographs, we consider that the locations of lines in ourdataset are, at best, accurate to only92 m, and in somecases, they may only be accurate to95 m. For this reason,we generated a 10-m-wide envelope of uncertainty aroundthe periphery of all our mapped ‘well-defined’ features. Thisenvelope allows for the uncertainty in the mapping, as wellas encompassing: (1) small features seen during the fieldcampaign but which were not resolvable in the aerialphotographs or lidar; and (2) broad deformation whichextended beyond the mapped faults and bulges. For thebroad scarps and broad horizontal flexures we used our fielddata to define the width of the deformation (e.g., Fig. 2G).After the location uncertainly zone was defined, we added20 m of recommended setback to each of our mappedfeatures to create the FAZ. Field measurements were thenused to check that our delineated FAZs are wide enough toencompass all the observed deformation.
Discussion and conclusion
Fault kinematics
From a kinematics perspective, the mapped surface rupturepresents typical tectonic structures associated with trans-pressional strike-slip faulting (e.g., Schreurs & Colletta 1998;Dooley et al. 1999). These features closely resemble thoseformed by sand box models (e.g., Dooley et al. 1999) andother historic strike-slip surface ruptures (Petersen et al.2011). The three geomorphic sections (Fig. 1C) are aconsequence of kinematic differences. The western 7-km-long section is a releasing bend, which suggests that theN1258E ‘broad scarp’ is an oblique normal and right lateralfault and the E�W one is a predominantly strike-slip faultwith an oblique reverse component (Duffy et al. 2011). Thesection from 7 to 23 km is very complex, displaying severalleft steps with corresponding push-up structures. Along thissection there are Riedel shears (N110�1308E), conjugateRiedel shears (N161�1808E), normal faults and fissures(N120�1408E) and some P thrusts (N70�928E). Other faultsscarps are either reverse faults or folds (N29�658E) com-monly associated with left steps. The eastern section isdefined by a single broad horizontal flexure that is amonocline with a vertical axis.
Application to other faults
Several lessons learnt from the Greendale Fault rupture anddetailed mapping can be used to aid in defining FAZs forother active faults. The lessons are particularly applicable tostrike-slip faults that have not ruptured for thousands totens of thousands of years, especially if they rupture throughsimilarly thick alluvial gravel-rich deposits. First, the
deformation widths mapped here provide an analogue for
uncertainty of deformation width that could be expectedelsewhere. Many of the mapped Greendale Fault features
will become progressively less visible because of natural
erosion, burial or human modification. However, thepotential location of deformation features needs to be
considered in fault avoidance maps. The geomorphic and
kinematic analyses documented here can be applied else-where to assess potential locations of obscured deformation
features, especially in areas of potential high fault complex-
ity such as step overs.Second, the true length of Greendale Fault surface
rupture was only discovered because of the quick scientific
response and careful field mapping. For example, theeastern section of the fault (Fig. 1) was only detected in
the field as it is not visible on lidar images or aerial
photographs. This implies that the length of fault rupturesthat are thousands to tens of thousands of years old is likely
to be underestimated. For those faults, assessment of the
potential fault length beyond what is observable is justified,not only for definition of FAZ (this study) but also when
earthquake magnitudes are derived from fault length
(Quigley et al. 2010a,b, 2012).Although detailed mapping of fresh surface ruptures is
essential to improve knowledge on fault rupture and inform
planners, not all features of the Greendale Fault rupture
could be mapped due to insufficient field time or resolu-tional limitations of airborne imagery. For future surface-
rupture earthquakes, in order to gain maximum knowledge
benefit, we strongly recommend acquiring traditional high-resolution, low-altitude stereo-paired aerial photography
immediately after the event, as well as higher altitude
orthophotograph coverage, lidar and satellite images (e.g.,Barnhart et al. 2011).
Land use planning
The precisely delineated FAZ in conjunction with the
recurrence interval of the fault is currently being used to
guide reinstatement of damaged buildings and he construc-tion of new buildings in the area deformed by the Greendale
Fault. A preliminary assessment suggests a recurrence
interval for the Greendale Fault of]8000 yr based onreview of pre-2010 aerial photography and lidar (Villamor et
al. 2011). Applying the MfE guidelines, construction of
residential buildings within the FAZ would be a permittedactivity, but critical facilities such as buildings with post-
emergency functions would be a non-complying activity andrequire resource consent (i.e., permission required for an
activity that might affect the environment, and that is not
allowed ‘as of right’ in the district or regional plan;http://www.legislation.govt.nz/act/public/1991/0069/latest/
DLM230265.html). On-going studies of the recurrence inter-
val of the fault may help to refine this further.
228 P Villamor et al.
Dow
nloa
ded
by [
Uni
vers
ity o
f C
ante
rbur
y] a
t 16:
11 0
9 O
ctob
er 2
012
We hope that the example of fault rupture hazard
mapping of the Greendale Fault presented in this paper
will help promote and inform similar hazard mapping of
other active faults in comparable settings elsewhere in New
Zealand. FAZ mapping, in combination with thoughtful
land use planning and engineering, not only facilitates life
safety, but also has the potential to improve post-event
functionality of important structures, including lifelines,
where the consequences of surface fault rupture can be
incorporated into resilient design (e.g., Honegger et al. 2004;
Bray & Kelson 2006; Faccioli et al. 2008).
Acknowledgements
We thank landowners for access to their properties and for sharing
information, as well as our many colleagues who contributed to the
field investigations, particularly Tim Mote, Simon Cox and
Richard Jongens. Peter Wood of the Ministry of Civil Defence &
Emergency Management and the Environment Canterbury GIS
team facilitated the acquisition and provision of the lidar data.
Monica Cabeza drafted some figures. We are grateful to Ursula
Cochran and Zane Bruce for reviews of an early version of this
manuscript, and to John Townend, Colin Amos and an anon-
ymous reviewer for useful journal reviews. This study was
supported by the Natural Hazards Research Platform, GNS
Science, Environment Canterbury and University of Canterbury.
References
Ando R, Yamashita T 2007. Effects of mesoscopic-scale faultstructure on dynamic earthquake ruptures: dynamic formationof geometrical complexity of earthquake faults. Journal ofGeophysical Research 112: B09303, doi:10.1029/20062006JB004612
Barnhart WD, Willis MJ, Lohman RB, Melkonian AK 2011.InSAR and optical constraints on fault slip during the 2010�2011 New Zealand earthquake sequence. Seismological Re-search Letters 82: 815�823.
Barrell DJA, Litchfield NJ, Townsend DB, Quigley M, VanDissen RJ, Cosgrove R, Cox SC, Furlong K, Villamor P,Begg JG, Hemmings-Sykes S, Jongens R, Mackenzie H,Noble D, Stahl T, Bilderback E, Duffy B, Henham H,Klahn A, Lang EMW, Moody L, Nicol R, Pedley K, SmithA 2011. Strike-slip ground-surface rupture (Greendale Fault)associated with the 4 September 2010 Darfield earthquake,Canterbury, New Zealand. Quarterly Journal of EngineeringGeology and Hydrogeology 44: 283�291, doi: 10.1144/1470-9236/11-034
Beavan J, Samsonov S, MotaghM,Wallace LM, Ellis SM, Palmer N2010. The Darfield (Canterbury) Earthquake: geodetic obser-vations and preliminary source model. Bulletin of the NewZealand Society for Earthquake Engineering 43: 228�235.
Bray JD, Kelson KI 2006. Observations of surface fault rupturefrom the 1906 earthquake in the context of current practice.Earthquake Spectra 22(S2): S69�S89.
Dooley T, McClay K, Bonora M 1999. 4D evolution of segmentedstrike-slip fault systems: applications to NW Europe. In:Fleet AJ, Boldy SAR eds. Petroleum geology of NorthwestEurope. Proceedings of the 5th Conference. PetroleumGeology. UK, Geological Society of London. Pp. 215�225.
Duffy B, Van Dissen R, Quigley M, Litchfield N, McInnes C,Leprince S, Barrell D, Stahl T, Bilderback E 2011. Co-seismicdisplacements from differencing and sub-pixel correlation ofmulti-temporal LiDAR and cadastral surveys: application tothe Greendale Fault, Canterbury, New Zealand. Proceedingsof the AGU Annual Meeting, San Francisco, CA, USA 5�9December 2011. EP51E-04.
Faccioli E, Anastasopoulos I, Gazetas G, Callerio A, Paolucci R2008. Fault rupture�foundation interaction: select case his-tories. Bulletin of Earthquake Engineering 6: 557�583,doi: 10.1007/s10518-008-9089-y
Forsyth PJ, Barrell DJA, Jongens R (compilers) 2008. Geology ofthe Christchurch area: scale 1:250,000. Lower Hutt, GNSScience. Institute of Geological & Nuclear Sciences. 1:250,000geological map 16. 67 p.�1 folded map.
Gledhill K, Ristau J, Reyners M, Fry B, Holden C, GeoNet-Team2010. The Darfield (Canterbury) earthquake of September2010: preliminary seismological report. Bulletin of the NewZealand Society for Earthquake Engineering 43: 215�221.
Gledhill K, Ristau J, Reyners M, Fry B, Holden C 2011. TheDarfield (Canterbury, New Zealand) Mw 7.1 earthquake ofSeptember 2010: a preliminary seismological report. Seismo-logical Research Letters 82: 378�386.
Holden C, Beavan J, Fry B, Reyners M, Ristau J, Van Dissen R,Villamor P, Quigley M 2011. Preliminary source model of theMw 7.1 Darfield earthquake from geological, geodetic andseismic data. Ninth Pacific Conference on Earthquake En-gineering, Building an Earthquake-Resilient Society, Paper164, 7 p. Auckland, New Zealand.
Honegger DG, Nyman DJ, Johnson ER, Cluff LS, Sorensen SP2004. Trans-Alaska pipeline system performance in the 2002Denali fault, Alaska, earthquake. Earthquake Spectra 20:707�738.
Jongens R, Barrel D, Campbel J, Pettinga J 2012. Faulting andfolding beneath the Canterbury Plains identified prior to the2010. New Zealand Journal of Geology and Geophysics. doi:10.1080/00288306.2012.674050
Kerr J, Nathan S, Van Dissen R, Webb P, Brunsdon D, King A2003. Planning for development of land on or close to activefaults: a guideline to assist resource management planners inNew Zealand. ME number 565. Ministry for the Environment.67 p.
Norris RJ, Cooper AF 2001. Late Quaternary slip rates and slippartitioning on the Alpine fault, New Zealand. Journal ofStructural Geology 23: 507�520.
Petersen MD, Dawson TE, Chen R, Cao T, Wills CJ,Schwartz DP, Frankel AD 2011. Fault displacement hazardfor strike-sip faults. Bulletin of the Seismological Society ofAmerica 101: 805�825.
Pettinga J, Yetton MD, Van Dissen RJ, Downes G 2001. Earth-quake source identification and characterisation for theCanterbury Region, South Island, New Zealand. Bulletin ofthe New Zealand Society for Earthquake Engineering 34:282�317.
Quigley M, Van Dissen R, Villamor P, Litchfield N, Barrell D,Furlong K, Stahl T, Duffy B, Bilderback E, Noble D,Townsend D, Begg J, Jongens R, Ries W, Claridge J,Klahn A, Mackenzie H, Smith A, Hornblow S, Nicol R,Cox S, Langridge R, Pedley K 2010a. Surface rupture of theGreendale fault during the Darfield (Canterbury) earthquake,New Zealand: Initial findings. Bulletin of the New ZealandSociety for Earthquake Engineering 43: 236�242.
Quigley M, Villamor P, Furlong K, Beavan J, Van Dissen R,Litchfield N, Stahl T, Duffy B, Bilderback E, Noble D,Barrell D, Jongens R, Cox S 2010b. Previously unknown faultshakes New Zealand’s South Island. EOS 91: 469�470.
Map of the 2010 Greendale Fault surface rupture, Canterbury, New Zealand 229
Dow
nloa
ded
by [
Uni
vers
ity o
f C
ante
rbur
y] a
t 16:
11 0
9 O
ctob
er 2
012

Quigley MC, Van Dissen R, Litchfield N, Villamor P, Duffy B,Barrell D, Furlong K, Stahl T, Bilderback E, Noble D 2012.Surface rupture during the 2010 Mw 7.1 Darfield (Canterbury)earthquake: implications for fault rupture dynamics andseismic-hazard analysis. Geology 40: 55�58, doi: 10.1130/G32528.1
Schreurs G, Colletta B 1998. Analogue modeling of faulting inzones of continental transpression and transtension. In:Holdsworth RE, Strachan RA, Dewey JF eds. Continentaltranspessional and transtensional tectonics. Geological So-ciety of London, Special Publication, 135. Pp. 59�79.
Van Dissen R, Barrell D, Litchfield N, King A, Quigley M,Villamor P, Furlong K, Mackenzie H, Klahn A, Begg J,Townsend D, Stahl T, Noble D, Duffy B, Bilderback E,Jongens R, Cox S, Langridge R, Ries W, Dhakal R, Smith A,Nicol R, Pedley K, Henham H, Hunter R 2011. Surface
rupture displacement on the Greendale Fault during the Mw7.1 Darfield (Canterbury) earthquake, New Zealand, and itsimpact on man-made structures. Ninth Pacific Conference onEarthquake Engineering, Building an Earthquake-ResilientSociety, Paper 186, 8 p. Auckland, New Zealand
Villamor P, Barrell, DJA, Litchfield NJ, Van Dissen, RJ,Hornblow S, Levick, SR 2011 Greendale Fault: investigationof surface rupture characteristics for fault avoidance zonation.GNS Science consultancy report 2011/121, Technicalreport/Environment Canterbury R11/25. 52 p. http://ecan.govt.nz/publications/Reports/fault-final-report-greendale.pdf(accessed 11 February 2012).
Wallace LM, Beavan J, McCaffrey R, Berryman K, Denys P 2007.Balancing the plate motion budget in the South Island, NewZealand using GPS, geological and seismological datas.Geophysical Journal International 168: 332�352.
230 P Villamor et al.
Dow
nloa
ded
by [
Uni
vers
ity o
f C
ante
rbur
y] a
t 16:
11 0
9 O
ctob
er 2
012