mapping and qtl
DESCRIPTION
Mapping and QTLTRANSCRIPT
Utilization of Molecular Markers for PGRFA Characterization and Pre-Breeding for Climate Changes Aug. 31st- Sept. 4th, 2014

From genotype to phenotype


Linkage
• Loci that are close enough together on the same chromosome to deviate from independent assortment are said to display genetic linkage

Crossover

Co-dominant Marker
P1 P2 1 2 3 4 5 6 7 8 9 10 11 12 13 14

Dominant Marker P1 P2
1 2 3 4 5 6 7 8 9 10 11 12 13 14
P1 P2 1 2 3 4 5 6 7 8 9 10 11 12 13 14


QTL mapping
• genotype and phenotype individuals • look for statistical correlation between
genotype and phenotype

Genetic Linkage maps
Genetic Linkage maps (also called meiotic maps) rely
on the naturally occurring process of recombination
for determination of the relative order, and distances
between polymorphic markers.
The statistical analysis of the segregating data is then
used to convert the recombination fraction into an
additive unit of distance measured in centiMorgan
(cM), with 1 cM representing a 1% probability that
a recombination has occurred between two markers
on a single chromosome.
Several linkage maps based on intraspecific crosses between upland
cottons have been reported (Shappley et al. 1998, Ulloa
and Meredith 2000, Zuo et al. 2000, Ulloa et al. 2002), but all the maps
were characterized with low marker coverage of the
genome. As molecular polymorphism is limited within ( G. hirsutum L).
Therefore, in this study we are interested to using interspecific hybrids
between G. hirsutum L. and G. barbadense L., as an efficient source for
polymorphism.

4 . Selection of parental varieties
The cotton map will be developed from an interspecific cross between
G. barbadense and G. hirsutum. Polymorphic parental varieties will be
selected among previous studied genotypes.
These parental varieties will be crossed to obtain the F1 generation.
5 . Generation of segregating population
An F1 plant will be selfed to generate the F2 segregating population.
The DNA of the different individual plants representing the F2 population
will be analyzed using the different marker types ( SSR and AFLP ).
The pattern of inheritance of these genetic markers among the F2
Individuals will be examined.
1 . Selection of cotton accessions among the collection available at the
Cotton Research Institute (CRI)
2 . Isolation and purification of genomic DNA from the different accessions.
3 . Fingerprinting of cotton accessions using different molecular markers
(AFLP , SSR and ISSR).

7 . Bulked Segregant Analysis
To rapidly find markers closely linked to the trait of interest
(earliness ), two bulked samples will be prepared for the trait.
Screening for differences between the pooled DNA samples for
the trait will be performed using the different molecular markers.
6 . Screening of Morphological Traits
Morphological trait of interest particularly date of flowering will be
scored for the individual plants of the segregating population.
8 . Analysis of Segregation and Map construction
The segregation of all the studied markers ( molecular and
Morphological ) will be analyzed among the F2 individuals.
The goodness of fit to the expected 3:1 Mendelian ratio for
each segregating locus will be tested by chi-square test and
the linkage analysis between loci determined according to
the maximum likelihood method.
The linkage map will be constructed using the MAPMAKER
version 2.0 software.


Marker Distance
Lin
e 1
Lin
e 2
Lin
e 3
Lin
e 4
Lin
e 5
Lin
e 6
Lin
e 7
Lin
e 8
Lin
e 9
Lin
e 1
0
Lin
e 1
1
Lin
e 1
2
Lin
e 1
3
Lin
e 1
4
Lin
e 1
5
Lin
e 1
6
_3_0363_ 0 A B B A A A B A B B A B B B B B
_1_1061_ 0.8 A B B A A A B A B B A A A B B A
_3_0703_ 1.5 B A A B B B A B A A B B B B B B
_1_1505_ 1.5 B A A B B B A B A B B B B B B B
_1_0498_ 1.5 B B B B B B B B B B B B B B B A
_2_1005_ 3.8 A B B A A A B A B A A B B B B B
_1_1054_ 3.8 A A A A A A A A A B A A A A A A
_2_0674_ 6 A B B A A A B A B A A A A A A B
_1_0297_ 8.8 A A B B B B B A A A A A A A A B
_1_0638_ 10.7 A A B B B B B A A B A A A A A A
_1_1302_ 11.4 B A A A B B A A A B A B B B B A
_1_0422_ 11.4 B A A A B B A A A B A B B B B A
_2_0929_ 15.3 A B B B A A B B B A B A A A A B
_3_1474_ 15.4 A B B B A A B B B A B A A A A A
_1_1522_ 17.3 A B B B A A B B B A B A A A A A
_2_1388_ 17.3 A A A A A A A A A A A A A A A A
_3_0259_ 18.1 B B B B B B B B B B B A A A A A
_1_0325_ 18.1 B B B B B B B B B B B A A A A A
_2_0602_ 20.8 A A B A A A A B A B A A A A A A
_1_0733_ 23.9 B B B B B B B B B B B A A A A A
_2_0729 23.9 B B B B B B B B B B B A A A A A
_1_1272_ 23.9 A B B B A A B B B B B B B B B B
_2_0891_ 26.1 A A A A A A A A A B A A A A A A
_2_0748_ 26.6 B B B B B B B B B A B B B B B B
_3_0251_ 27.4 A B A A A B A A A B A A A B A A
_1_0997_ 35.5 B B A A A B B B B B B B B B B B
_1_1133_ 41.8 B B A A A B B B B A B A A A A A
_2_0500_ 42.5 A A A A A A A A A B A B B B B B
_3_0634_ 43.3 B B B B B B B B B A B A A A A A
0
10
5 Disease severity

Application of QTL Mapping in Crop Improvement

Introduction
Drought is one of the most common
abiotic stressor limiting crops productivity
throughout the world.
Therefore, breeding and selection for high-
yielding crops under drought stress is a
major objective of crop breeders working
under unfavorable environments.

The construction of a molecular linkage map represents the
first step in the genetic dissection of a target trait of interest.
Both, genetic linkage maps and QTL maps are useful in durum
wheat improvement because they provide useful tools for
studying genome structure, evolution, identifying or
manipulating chromosome segments QTL (quantitative trait
loci) controlling important agronomic traits.

Objectives
1. To develop a QTL map of Egyptian durum wheat through the
application of different DNA markers (SSR, RAPD, AFLP,
EST and SCoT) and an F2 segregating population obtained
from an intraspecific cross between two durum varieties
(Baniswif-1 and Souhag-2).
2. To tag QTLs controlling yield and drought tolerance-related
traits: root length, plant height, spike length, number of
branches/plant, number of spike/plant, number of
spikelets/spike, number of kernel/spike, thousand kernel
weight, fresh weight, dry weight and total amino acids.

Mapping Population used (F2, RIL, DH, BC, ….)
Type of markers employed (AFLP, SSR, EST, SNP, DArT, ……)
Percentage of Genome Coverage
Traits of Interest (QTL Results)

Mapping population
Methodology
Two polymorphic varieties (Baniswif -1 and Sohag-2) were selected
among the germplasm available at Wheat Research Dept., Crop
Research Institute, ARC, Egypt.
These two varieties were used to develop an F2 mapping population
comprising 76 plants from the intraspecific cross.

The parents and F2 plants were grown in the year 2009 at one of the Agricultural
Genetic Engineering Research Institute experimental fields.
The F2 plants were grown in two replicates in a randomized complete block design.

Trait measurements
Data for:
- Root length, plant height as described by De Vita et al., 2007.
- Number of spikelets/spike, number of kernel/spike and thousand
kernel weight as described by Nacite et al., 1992.
- Spike length, number of branches/plant, number of spike/plant as
described by Diab et al., 2007.
- Fresh weight, dry weight and total amino acids as described by
Abebe et al., 2003.

DNA isolation
DNA was isolated from the two parents and the 76 F2 plants using DNAeasy
Plant Mini Kit (Qiagen, Santa Clarita, CA).
DNA markers
A preliminary screen of polymorphism between the two parental
genotypes was performed using 42 RAPD, 56 SSR, 32 AFLP, 20 EST and 26
SCoT primers and/or primer combinations.
Only 1 RAPD, 15 SSR, 11 AFLP and 10 SCoT primers revealed discernible
polymorphic patterns.
Therefore, analysis of segregation among the 76 F2 individuals was
performed using these polymorphic primers and/or primer combinations.

RAPD amplification was performed as described by Williams et al. (1990)
with minor modifications.
RAPD analysis
RAPD profile of the two parental genotypes as revealed by different primers
M P1 P1 P2 P2 P1 P1 P2 P2 P1 P1 P2 P2 P1 P1 P2 P2 M P1 P1 P2 P2 P1 P1 P2 P2 P1 P1 P2 P2 P1 P1 P2 P2 P1 P1 P2 P2

SSR analysis
SSR analyses was performed as described by Hussein et al. (2003).
Table : SSR Primer name, primer sequence and Chromosome.

SSR profile of the two parental genotypes as revealed by different
primers
M P1 P1 P2 P2 P1 P1 P2 P2 P1 P1 P2 P2 P1 P1 P2 P2 P1 P1 P2 P2 P1 P1 P2 P2 P1 P1 P2 P2 P1 P1 P2 P2

EST analysis EST analyses were performed as described by Adawy (2007).
Table : EST primer code, gene name, primer sequences and expected PCR product.

EST profiles of the two parental genotypes as revealed by different primers

AFLP analysis
AFLP analyses was performed
using 11 AFLP primer
combinations according to the
protocol of Vos et al. (1995) with
minor modifications.
AFLP® Analysis System II
(Invitrogen, USA) was employed .
AFLP profile of the two parental genotypes as revealed by different primer combinations

Table : AFLP primer combination sequences
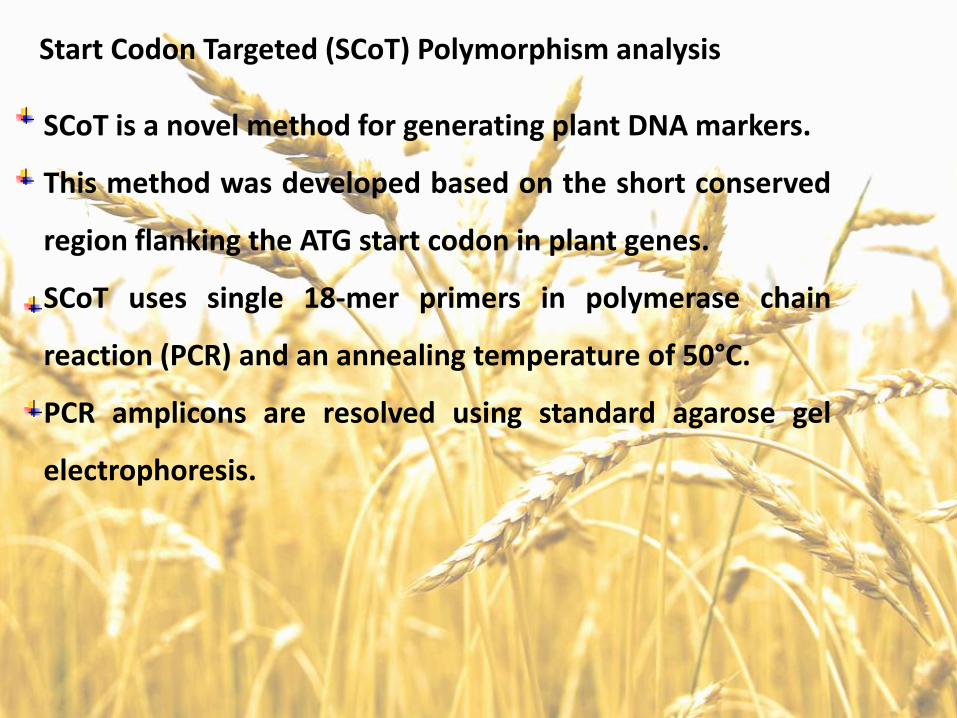
Start Codon Targeted (SCoT) Polymorphism analysis
SCoT is a novel method for generating plant DNA markers.
This method was developed based on the short conserved
region flanking the ATG start codon in plant genes.
SCoT uses single 18-mer primers in polymerase chain
reaction (PCR) and an annealing temperature of 50°C.
PCR amplicons are resolved using standard agarose gel
electrophoresis.

SCoT Analysis
SCoT analyses were
performed as described
by Collard and Mackil
(2009).
Table : SCoT primers and their sequences

SCoT profiles of the two parental genotypes as revealed by different
primers
M P1 P1 P2 P2 P1 P1 P2 P2 P1 P1 P2 P2 P1 P1 P2 P2 P1 P1 P2 P2 P1 P1 P2 P2 P1 P1 P2 P2

Genetic linkage map construction and QTL detection
The markers that showed polymorphism between the parental lines were
used to construct the genetic linkage map.
Linkage analysis and map construction were performed by using Map
Manager QTX V1.4 (Manly and Cudmore, 1997) using the Kosambi
function with a minimum LOD score of 3.0 followed by ripple command
for each linkage group to check the final order of markers.
The association between phenotype and genotype was investigated using
single point analysis (SPA), using QTL cartographer (Wang, et al. 2004).
Significance levels of 5%, 1%, 0.1% and 0.01% were used to declare a QTL.

Trait measurements
Results
Phenotypic and physiological data
of root length, plant height, spike
length, number of branches/plant,
number of spike/plant, number of
spikelets/spike, number of
kernel/spike, thousand kernel
weight, fresh weight, dry weight
and total amino acids traits for the
76 F2 plants derived from the
intercross between Baniswif-1 and
Sohag-2.

Trait measurements
Phenotypic and physiological data
of root length, plant height, spike
length, number of branches/plant,
number of spike/plant, number of
spikelets/spike, number of
kernel/spike, thousand kernel
weight, fresh weight, dry weight
and total amino acids traits for the
76 F2 plants derived from the
intercross between Baniswif-1 and
Sohag-2.

Statistics and normality test of traits
The Mean, Variance, Standard
Deviation, Coefficient of Variation,
Skewness and Kurtosis values for
root length, plant height, spike length,
number of branches/plant, number of
spike/plant, number of spikelets/spike,
number of kernel/spike, thousand
kernel weight, fresh weight, dry weight
and total amino acids are presented
in Figure.

All traits showed normal
distribution and large
amount of variation.
High kurtosis value were
observed for No. of Kernel/
spike (NKS) and Total Amino
Acids (TAA) and a large
skewness value was
obtained for No. of Kernel/
spike (NKS)

Primer, sequence, number of total bands and polymorphic bands as revealed by RAPD analysis.
RAPD patterns of the
two parents and F2
individuals derived
from the cross
BaniSwif-1 and
Sohag-2 as revealed
by primer OP-C4. M
is the standard DNA
marker 100 bp
ladder, P1 (cv. Bani
Swif -1) and P2 (cv.
Sohag-2).
RAPD analysis
M P1 P1 P2 P2 F2 individulas

Primer code, Primer
name, primer sequence,
chromosome and
marker size as detected
by SSR
SSR analysis

SSR patterns of the two parents and F2 individuals derived from the cross BaniSwif
-1 and Sohag-2 as revealed by primer S8. M is the standard DNA marker 100 bp
ladder, P1 (cv. BaniSwif -1) and P2 (cv. Sohag-2).

Primer combinations, selective nucleotides, number of total bands, polymorphic bands
and percentage of polymorphism as detected by AFLP primer combinations.
AFLP analysis

AFLP patterns of the two parents and F2 individuals derived from the cross Baniswif -1 and Sohag-2 as revealed by primercomb. 3/6. M is the standard DNA marker 100bp ladder, P1 (cv. Baniswif -1) and P2 (cv. Sohag-2).

SCoT analysis
Primer name, primer sequence, number of total bands, polymorphic bands and
percentage of polymorphism as detected by SCoT

SCoT patterns of the two parents and F2 individuals derived from the cross Baniswif -1 and Sohag-2 as revealed by primer S4. M is the standard DNA marker 100bp ladder, P1 (cv. Baniswif -1) and P2 (cv. Sohag-2).

Distribution of molecular
markers, assignment and
centiMorgan (cM)
coverage across the 14
linkage groups of the
genetic map used in QTL
mapping.

Molecular linkage groups of durum wheat (intercross between Baniswif-1 and Sohag-2) showing positions of QTL influencing root length, plant height, spike length, number of branches/plant, number of spike/plant, number of spikelets/spike, number of kernel/spike, thousand kernel weight, fresh weight, dry weight and total amino acids. Map distances between adjacent markers are in cM
` `

All 56 SSR primer pairs preliminary
screened on the two parents, were
previously mapped on the durum
wheat chromosomes.
However, only 15 SSRs primers
revealed polymorphic patterns
between the two parents. These
primer pairs were applied to the F2
individuals.
Assignment of linkage groups
to the chromosomes
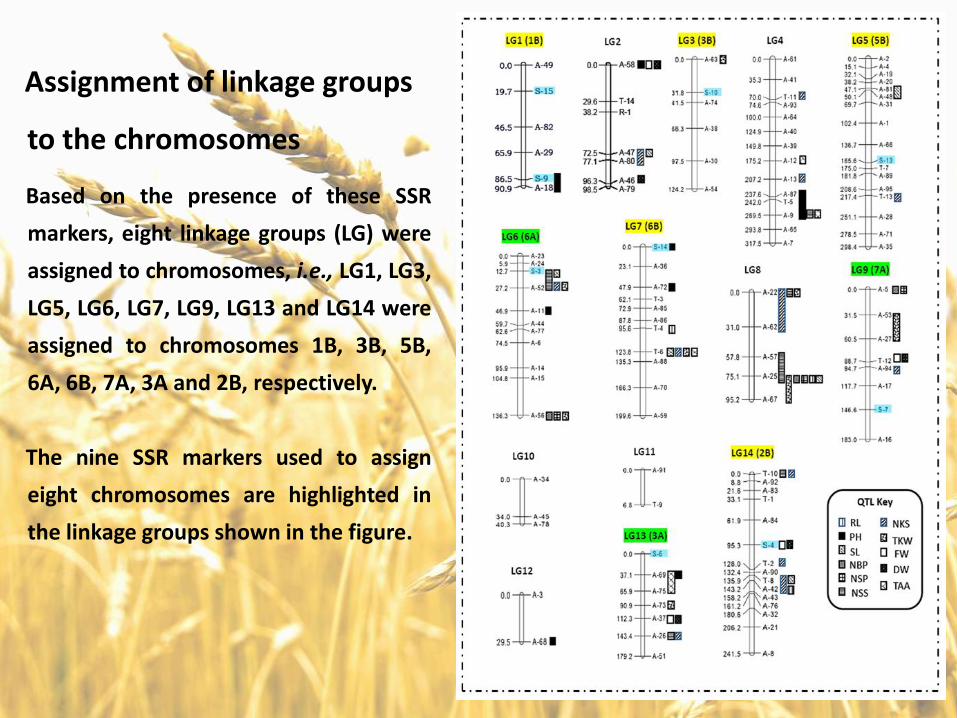
Based on the presence of these SSR
markers, eight linkage groups (LG) were
assigned to chromosomes, i.e., LG1, LG3,
LG5, LG6, LG7, LG9, LG13 and LG14 were
assigned to chromosomes 1B, 3B, 5B,
6A, 6B, 7A, 3A and 2B, respectively.
The nine SSR markers used to assign
eight chromosomes are highlighted in
the linkage groups shown in the figure.
Assignment of linkage groups
to the chromosomes

QTL analysis
A total of 74 QTL at significance
level of 5%, 1%, 0.1% and 0.01%
have been identified for the 11 traits
on twelve linkage groups (1, 2, 3, 4,
5, 6, 7, 8, 9, 12, 13 and 14).
Among these QTLs, 3 QTL for RL, 11
QTL for PH, 7 QTL for SL, 3 QTL for
NBP, 3 QTL for NSP, 8 QTL for NSS,
15 QTL for NKS, 10 QTL for TKW,
4 QTL for FW, 5 QTL for DW and 5
QTL for TAA were identified.
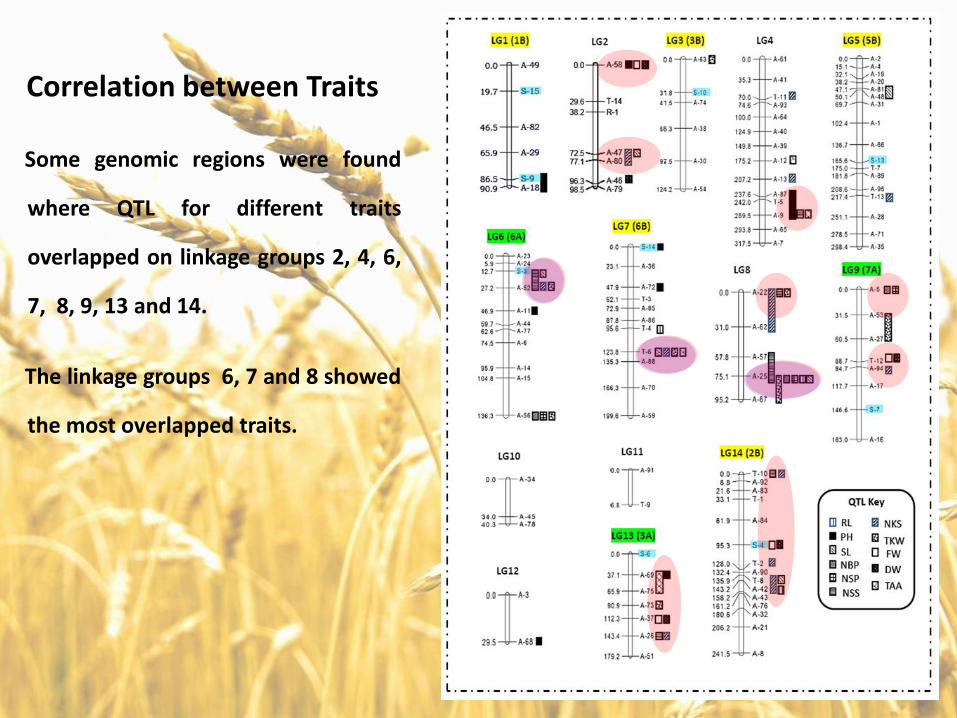
Some genomic regions were found
where QTL for different traits
overlapped on linkage groups 2, 4, 6,
7, 8, 9, 13 and 14.
The linkage groups 6, 7 and 8 showed
the most overlapped traits.
Correlation between Traits

For example, QTL for spike length,
number of branches/plant, number
of spike/plant, number of
spikelets/spike and thousand kernel
weight were mapped to the same
chromosomal location.
Similarly, QTL for spike length, number
of kernel/spike, thousand kernel
weight and total amino acids were
mapped to identical genomic region.

Correlation between traits Correlation coefficient among Root Length, Plant height, Spike length, Number of branches/plant, Number of
spike/plant, Number of spikelets/spike, Number of Kernel/spike, Thousand kernel weight, Fresh Weight, Dry
Weight and Total Amino Acids traits in F2 segregating population.
Positive correlation
Negative correlation
No correlation
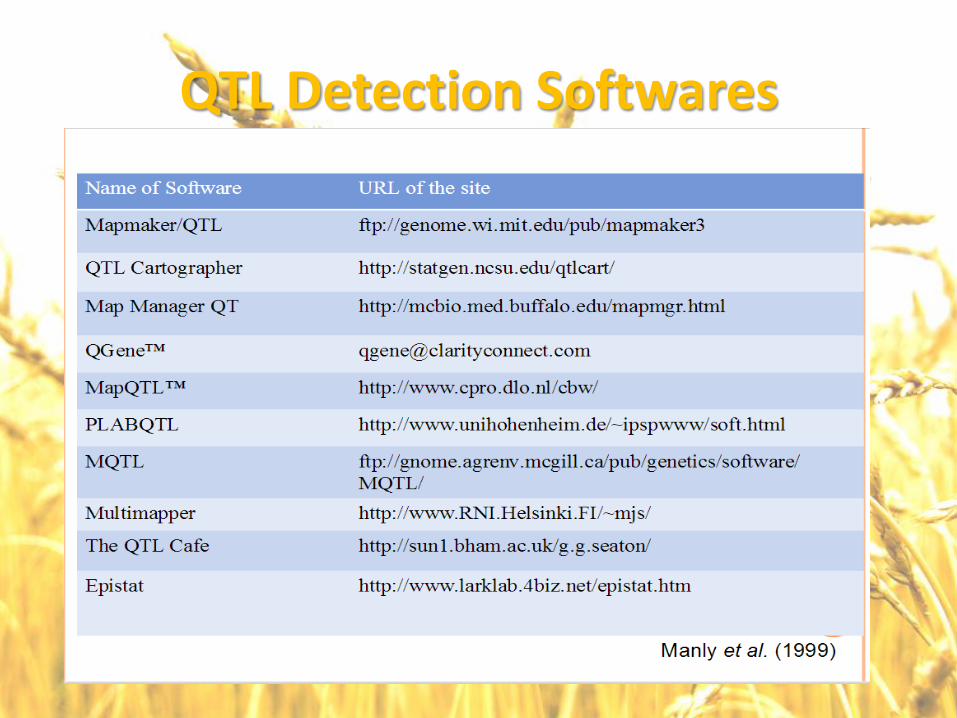
QTL Detection Softwares

Conclusion A genetic map comprising 114 molecular markers located on 14
linkage groups and spanning a total of 2040.9cM, was constructed.
This map was useful in detecting 74 significant QTLs related to high
productivity and drought tolerance (including : root length, plant
height, spike length, number of branches/plant, number of
spike/plant, number of spikelets/spike, number of kernel/spike,
thousand-kernel weight, fresh weight, dry weight and total amino
acids), and promises to provide a better understanding of the durum
wheat crop and enhancing breeding programs through MAS.
On the other hand, the constructed linkage map contains RAPD, SSR,
SCoT and AFLP markers that were not mapped collectively in any
other durum wheat maps.
