mapping and testing internet of things platforms for the
TRANSCRIPT

Topias Katajamäki
Mapping and Testing Internet of Things Platforms for the Intelligent Maintenance of the Electrical Distribution Network
Vaasa 2021
School of Technology and Innovations Master’s thesis in Smart Energy Programme

2
UNIVERSITY OF VAASA School of Technology and Innovations Author: Topias Katajamäki Title of the Thesis: Mapping and Testing Internet of Things Platforms for the Intelli-
gent Maintenance of the Electrical Distribution Network Degree: Master of science (technology) Programme: Smart Energy Supervisor: Hannu Laaksonen Year: 2021 Number of pages: 100
ABSTRACT: New technologies are crucial in the changing energy sector and the electricity network. The cli-mate change and increasing dependence upon electricity are two main factors in this context. Consequently, there is a need to develop the reliability and quality of the electricity distribution system. The study was carried out in cooperation with Vaasan Sähköverkko. They wanted to explore and pilot possible alternatives to internet of things (IoT) technologies to be used in pre-dictive maintenance of the electricity distribution network. The purpose of this study was to examine the features expected from good IoT platforms. Central to this study, was to demon-strate that IoT solutions could be built on these platforms in their operating environments con-nected to the distribution system. Internet of things platforms are a set of integrated software capabilities. The compared platforms in this study were M-Files, IoT-Ticket, Microsoft Azure, Amazon Web Services and Google Cloud Platform. When comparing the selected IoT platforms, data related to different features was collected by implementing four practical cases. The first case was monitoring air conditions at Vaasa primary substation using a Ruuvitag sensor. The second case was use CoreTec and CoreSense to import condition monitoring data from the power transformer at Purola primary substation. The third example was import measurement and status data from the DC system at Alskat primary sub-station to IoT platforms. In the final case, data was retrieved from MicroSCADA Historian to a comma separated value file and exported to IoT platforms using either the representational state transfer application programmable Interface (REST API) or a Python software development kit. The results of this study demonstrate that it is possible to install of IoT technology on signif-icantly different platforms. M-Files was the IoT platform with largest amount of open questions still remaining. IoT-Ticket appeared to be the easiest option for installation and end use. If an organization were to choose Microsoft Azure, Amazon Web Services or Google Cloud Platform, they would need to find reliable partners to develop the platforms with end users. During this study, it became evident that IoT technology is relatively evolved and organizations should begin using to use it with a low threshold if suitable applications are found. For example, predictive maintenance can be considered as a particularly suitable option for the IoT platform further utilization by a distribution system operator.
KEYWORDS: Internet of things, Platform, Electrical distribution network, Predictive mainte-nance

3
Contents
1 Introduction 10
1.1 Background 11
1.2 The scope of the research 12
1.3 Research goals and questions 13
1.4 Structure 13
2 Distribution Network Maintenance and IoT Solutions 14
2.1 Maintenance strategies 15
2.2 IoT 19
2.2.1 Physical devices 21
2.2.2 Telecommunication and communication protocols 24
2.3 IoT Platform 26
2.4 IoT solutions in electrical distribution network 27
2.4.1 Examples in the primary substations 28
2.4.2 Examples in the distribution network 37
2.4.3 Examples related to data from SCADA 39
3 Research and IoT Platform Selection Methodology 43
3.1 Selection of platforms 43
3.2 Data collection 45
3.3 The data analysis 50
4 IoT Platforms Comparison Results 52
4.1 M-Files 52
4.1.1 Protocols and APIs 55
4.1.2 Scalability and flexibility 56
4.1.3 Pricing model 56
4.1.4 Security 56
4.1.5 User experience 58
4.1.6 The need for expertise in platform maintenance 65
4.2 IoT-Ticket 65
4
4.2.1 Protocols and APIs 66
4.2.2 Scalability and flexibility 68
4.2.3 Pricing model 68
4.2.4 Security 69
4.2.5 User experience 71
4.2.6 The need for expertise to maintain the platform 75
4.3 Azure, AWS and GCP 76
4.3.1 Protocols and APIs 78
4.3.2 Scalability and flexibility 80
4.3.3 Pricing model 80
4.3.4 Security 81
4.3.5 User experience 84
4.3.6 The need for expertise in platform maintenance 94
5 Discussion of Comparison Results 96
5.1 Limitations 98
6 Conclusion 99
References 101
Figures Figure 1. Information of the VSV’s distribution network. 12
Figure 2. The self-evolving maintenance scheduler approach (modified from Bangalore
& Tjernberg 2016) 14
Figure 3. The most well-known maintenance strategies (Ramamurthy et al. 2017). 15
Figure 4. An example time-based maintenance plan for primary substation components
(Vaasan Sähköverkko Oy. 2020b). 16
Figure 5. Differences between IIoT and IoT of consumers (Collin & Saarelainen, 2016).
19
Figure 6. IoT technology stack (Wortmann & Flüchter, 2015). 20
Figure 7. Technology stack (Collin & Saarelainen, 2016). 21
Figure 8. The role of the gateway in an IoT system (Kang et al. 2017). 23
5
Figure 9. The three dimensions of communication networks (Collin & Saarelainen, 2016).
24
Figure 10. A smart city system with the topics of this study highlighted in blue (Lau et al.
2019). 27
Figure 11. The 110 kV side of the primary substation (Vaasan Sähköverkko Oy. 2021a).
28
Figure 12. The 20 kV side of the primary substation (Vaasan Sähköverkko Oy. 2021a). 29
Figure 13. The online oil analyzer of the power transformer (Eronen, 2016). 30
Figure 14. A flowchart of the online gas density monitoring system in a 110 kV circuit
breaker (ABB. 2018). 32
Figure 15. A Flowchart of the online thermal imaging system (Unseen Technologies Oy.
2019). 33
Figure 16. An example of online thermal imaging of a disconnector (Unseen Technologies
Oy. 2019). 34
Figure 17. An example of online thermal imaging of an instrument transformer (Unseen
Technologies Oy. 2019). 34
Figure 18. Thermal imaging of the current transformer in Ristinummi primary substation
(Etab Electric Oy. 2019). 35
Figure 19. The structure of intelligent maintenance in a primary substation DC system
(Huang et al. 2017). 36
Figure 20. Frequency analysis of a corona discharge in a secondary substation (Niemi,
2019). 38
Figure 21. Cable cabinets damaged due to tilting (Vaasan Sähköverkko Oy. 2020a). 39
Figure 22. The view of Alskat primary substation in the SCADA system (Vaasan
Sähköverkko Oy. 2021b). 40
Figure 23. Data flow from SCADA to a Historian server (Rantonen, 2020). 41
Figure 24. The ANN-based condition monitoring model based on SCADA data (Bangalore
& Tjernberg 2016). 41
Figure 25. A flowchart of the methodology used in this study. 43
Figure 26. The practical cases used for collecting research data. 46

6
Figure 27. An overview of the Raspberry Pi 4 (Raspberry Pi Foundation. 2021). 48
Figure 28. The example related to the Vaasa primary substation case. 49
Figure 29. The IoT reference architecture in M-Files. 52
Figure 30. An example metadata structure in M-Files. (M-Files Corporation. 2021a) 53
Figure 31. The metadata structure in M-Files configured as an IoT platform. 54
Figure 32. The procedure for updating the encryption status of existing files (M-Files
Corporation. 2020). 57
Figure 33. M-Files and federated authentication system. (M-Files Corporation. 2021a)
58
Figure 34. The general view of the M-Files. 59
Figure 35. The M-Files view related to gateways in the IoT system. 60
Figure 36. The M-Files view related to measurements from the IoT devices. 61
Figure 37. A map view for the end user in the Power BI application. 62
Figure 38. The dashboard of the Vaasa substation in the end user application in Power
BI. 63
Figure 39. The mobile layout of the dashboard in Power BI. 64
Figure 40. The reference architecture in IoT-Ticket (Wapice. 2021c). 66
Figure 41. Communication methods for IoT device in IoT-Ticket. 67
Figure 42. An IoT device software update received via IoT-Ticket. 70
Figure 43. The structure of the IoT system in the IoT-Ticket. 71
Figure 44. Metadata of the device in IoT-Ticket. 72
Figure 45. The data tags view in IoT-Ticket. 72
Figure 46. The map view in the IoT-Ticket dashboard. 73
Figure 47. The dashboard of the Purola substation in IoT-Ticket. 73
Figure 48. The data-flow editor in IoT-Ticket. 74
Figure 49. The mobile layout of the dashboard in IoT-Ticket. 75
Figure 50. The IoT reference architecture in Azure (Microsoft. 2021c). 76
Figure 51. The IoT reference architecture in AWS cloud (Amazon Web Services. 2021c).
77
Figure 52. The IoT reference architecture in GCP (Google Cloud. 2021d). 78
7
Figure 53. Location selection of the cloud service in AWS. 82
Figure 54. The home view in Azure. 84
Figure 55. The AWS Management Console. 85
Figure 56. The home view in GCP. 85
Figure 57. IoT devices in Azure IoT Hub. 86
Figure 58. IoT devices in AWS IoT Core. 87
Figure 59. IoT devices in Google Cloud IoT Core. 87
Figure 60. The Stream Analytics service in Azure. 88
Figure 61. IoT rules in AWS. 88
Figure 62. Device events in GCP’s Pub/Sub service. 89
Figure 63. The dataflow job in GCP. 90
Figure 64. The dashboard in Amazon QuickSight. 91
Figure 65. The map view in the Google Datastudio dashboard. 92
Figure 66. The image related to data from SCADA Historian shown in Google Data Studio.
93
Figure 67. The role of an IoT platform in a comprehensive system architecture. 100
Tables Table 1. A comparison of communication protocols and APIs (Microsoft. 2021b, Amazon
Web Services. 2021d, Google Cloud. 2021c). 79
Table 2. A comparison of Azure, AWS and GCP security elements (Yu et al. 2019). 83
Table 3. The number of potential developer partners by platform in Finland (Ite Wiki.
2021). 94
Table 4. Summary from platform comparisons. 97
8
Abbreviations AMQP Advanced Message Queuing Protocol ANN Artificial Neural Network AWS Amazon Web Services CBM Condition-based maintenance CSV Comma Separated Value DSO Distribution System Owner GCP Google Cloud Platform HMI Human Machine Interface HV High Voltage IIoT Industrial Internet of Things IoT Internet of things LAN/WLAN Local Area Network/Wireless LAN LoRaWAN Long-Range Wide Area Network LV Low Voltage MV Medium Voltage MQTT Message Queuing Telemetry Transport NoSQL Not only Structured Query Language PAN/WPAN Personal Area Network/Wireless PAN PdM Predictive maintenance PvM Preventive maintenance RBM Risk-based maintenance REST API Representational State Transfer Application Programmable Interface
9
RM Reactive maintenance Rpi Raspberry Pi RxM Prescriptive maintenance SCADA Supervisory Control and Data Acquisition SDK Software Development Kit SQL Structured Query Language TSO Transmission System Owner VSV Vaasan Sähköverkko Oy WAN/WWAN Wide Area Network/Wireless WAN
10
1 Introduction
New technologies are crucial in the changing energy sector and the electricity network.
In this context there are two main factors. The first is climate change, or environmental
issues, which has resulted in the need for large-scale integration of renewable, low emis-
sion (CO2) energy sources in high voltage (HV), medium voltage (MV) and low voltage
(LV) networks. It has also resulted in the need to improve the efficiency of the entire
energy system. The second factor is increasing dependence upon electricity. Conse-
quently, there is a requirement to develop the reliability and quality of the electricity
supply (Laaksonen, 2020).
You (2017) cites several causes of electrical component failure: corrosion, fatigue, wear,
overload, vibration, and shock. However, these failure mechanisms are monitored and
predicted before the components breaks down.
From this changing environment, the term “smart grid” has emerged. Laaksonen (2020)
observes that smart grids have different explanations depending on who defines them:
- European Technology Platform:
o "A Smart Grid is an electricity network that can intelligently integrate the
actions of all users connected to it – generators, consumers and those that
do both – in order to efficiently deliver sustainable, economic and secure
electricity supplies.”
- European energy regulators:
o “Smart grid is an electricity network that can cost efficiently integrate the
behavior and actions of all users connected to it – generators, consumers
and those that do both – in order to ensure economically efficient, sus-
tainable power system with low losses and high levels of quality and se-
curity of supply and safety.”
- The US National Institute of Standards and Technology (NIST):
o “The term ’Smart Grid’ refers to a modernization of the electricity delivery
system so it monitors, protects and automatically optimizes the operation
11
of its interconnected elements – from the central and distributed genera-
tor through the high-voltage network and distribution system, to indus-
trial users and building automation systems, to energy storage installa-
tions and to end-use consumers and their thermostats, electric vehicles,
appliances and other household devices.”
What these definitions have in common is that, in the future, a smart grid will be secure,
reliable, efficient and sustainable. In addition, it integrates an array of local and regional
generation technologies and enables developed electricity markets. The following chap-
ters demonstrate what intelligent maintenance means in a smart grid and how internet
of things (IoT) technology relates to it.
1.1 Background
The study was carried out in cooperation with Vaasan Sähköverkko (VSV). The study con-
cept emerged with Vaasan Sähkö’s corporate strategy in 2019. One of the topics that
surfaced was the use of IoT in electricity networks. Following the strategy’s completion,
the use of IoT was further discussed and the outcome was to map out a way for IoT to
be used in predictive maintenance (PdM). Initially, VSV wanted to explore and pilot pos-
sible alternatives to this technology before acquiring a vast system. The reason for the
system’s extent is demonstrated in Figure 1, which shows VSV’s assets.

12
Figure 1. Information of the VSV’s distribution network.
Most distribution system owners (DSOs) do not have the same data collection opportu-
nities as a transmission system owner (TSO) because there are fewer assets. As Figure 1
shows, however, VSV has 20 primary substations, with numerous data collection possi-
bilities. In addition, VSV has numerous distribution transformers with the potential to
add individual IoT devices and produce PdM data, particularly in cable network’s second-
ary substations.
1.2 The scope of the research
This study focused on utilizing IoT platforms in PdM for the electrical distribution net-
work. The aim was to introduce five different IoT platforms and to implement four dif-
ferent practical examples of how data can be generated for these platforms. The data
could also have been simulated. However, the study aim was to practically demonstrate
how data, from places, such as substations and supervisory control and data acquisition
system (SCADA), could be generated for platforms. Had the objective been to create a
system capable of identifying potential failures based on machine learning, the research
would have required information about cases where the distribution system status was

13
stable and those where failures had occurred. Since gathering this data is a lengthy pro-
cess, this study did not focus on developing machine learning algorithms for platforms.
Instead, the study identified platform data collection methods, data visualization solu-
tions, and machine learning possibilities, data security, user experience and pricing mod-
els were explored.
1.3 Research goals and questions
Knud (2019) observes that there are 620 different IoT platforms on the market. Conse-
quently, there is scope for choice, and an organization must carefully consider which
platform might benefits its business. The purpose of this study was to address this quan-
tity problem by examining the features expected of good platforms. Central to this study,
was to demonstrate that IoT solutions could be built on these platforms in their operat-
ing environments within the distribution system. These solutions may also be available
to VSV following the research and IoT platform selection.
1.4 Structure
Following the introduction, Chapter 2 explores the theoretical background of mainte-
nance strategies, IoT and IoT platforms, and gives practical examples of IoT and PdM
within the distribution network. The topics discussed are based on previous research
and the available literature. Chapter 3 discusses the methodology used in this study and
its practical implementation. Chapter 4, presents the results by platform and feature.
Chapter 5 is reserved for the discussion section. Finally, Chapter 6 discusses the main
findings of the study.
14
2 Distribution Network Maintenance and IoT Solutions
Maintenance is vital for the reliability of a distribution network. If a component breaks,
its effects can vary significantly according to the type of component. A primary substa-
tion, for example, largely has components that, were they to fail, could impact electricity
distribution and affect a considerable number of customers. A long-term interruption in
electricity supply, would result in the DSO having to pay its customers standard compen-
sation in accordance with the Electricity Market Act. Moreover, unexpected outages neg-
atively impact the reasonable rate of return (Energiavirasto, 2018).
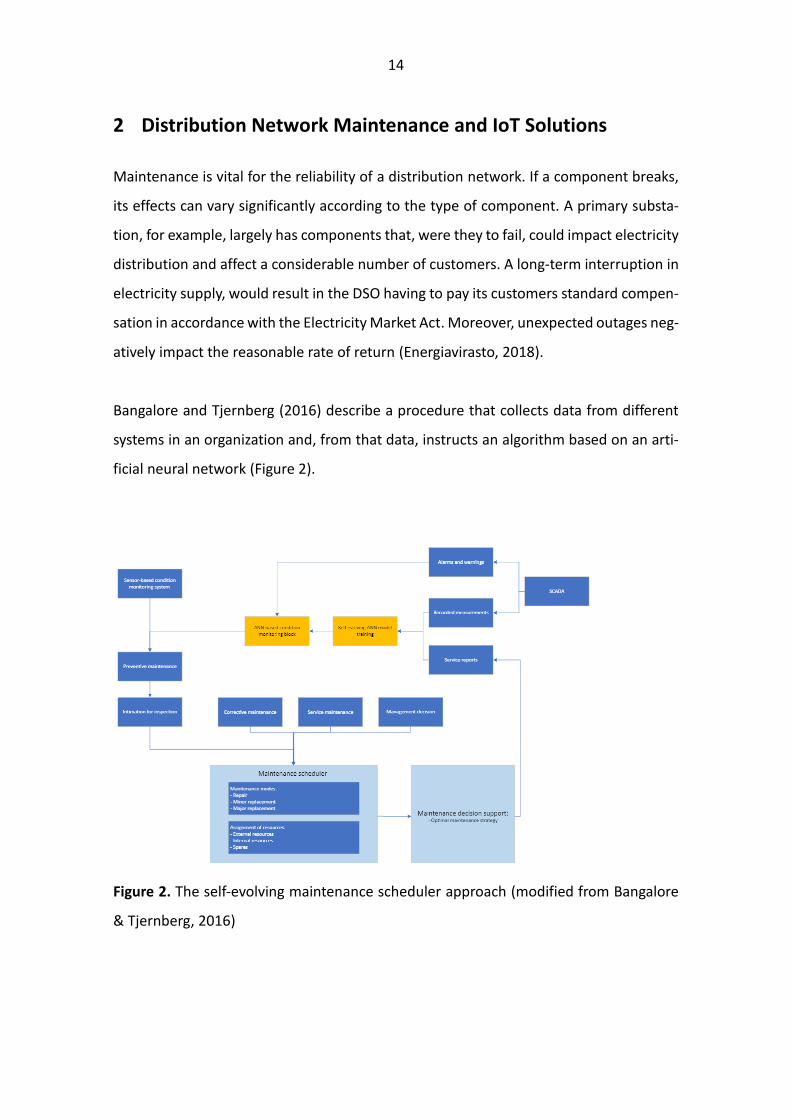
Bangalore and Tjernberg (2016) describe a procedure that collects data from different
systems in an organization and, from that data, instructs an algorithm based on an arti-
ficial neural network (Figure 2).
Figure 2. The self-evolving maintenance scheduler approach (modified from Bangalore
& Tjernberg, 2016)
15
The outcome allows the system to schedule the appropriate maintenance times and re-
serve the necessary maintenance resources (Bangalore & Tjernberg 2016). Hence, the
following chapters explore the tools and methods required to build such a system.
2.1 Maintenance strategies
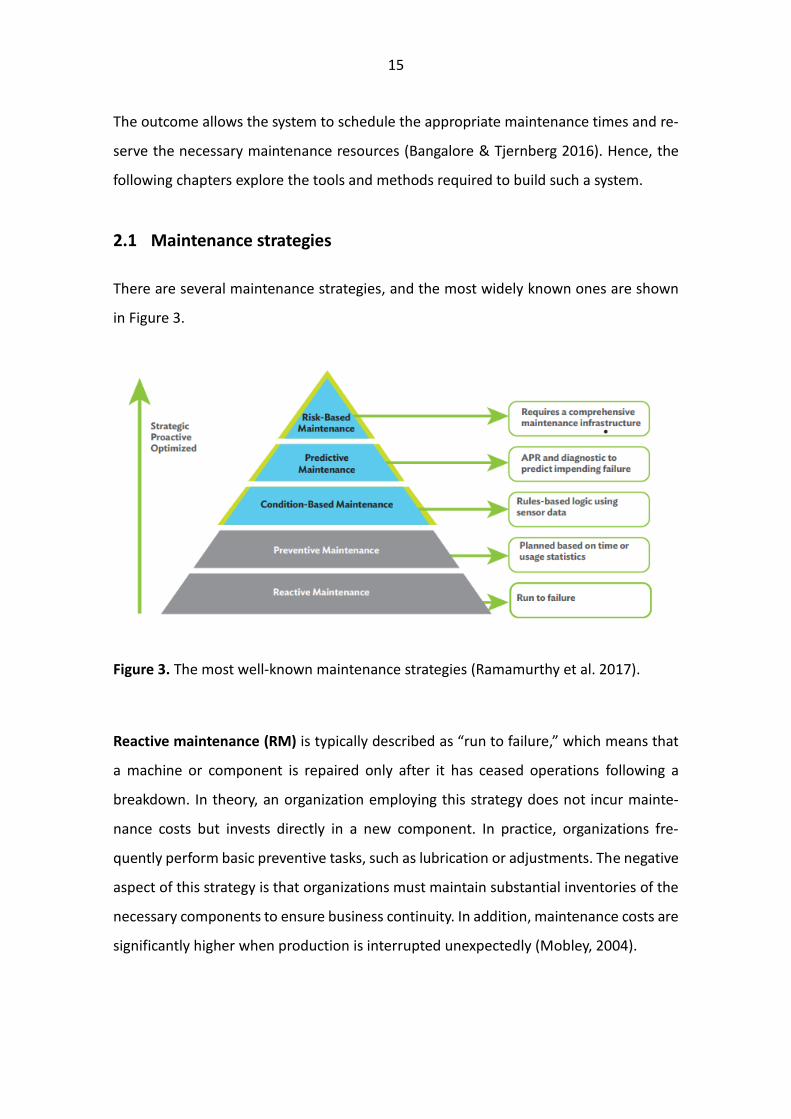
There are several maintenance strategies, and the most widely known ones are shown
in Figure 3.
Figure 3. The most well-known maintenance strategies (Ramamurthy et al. 2017).
Reactive maintenance (RM) is typically described as “run to failure,” which means that
a machine or component is repaired only after it has ceased operations following a
breakdown. In theory, an organization employing this strategy does not incur mainte-
nance costs but invests directly in a new component. In practice, organizations fre-
quently perform basic preventive tasks, such as lubrication or adjustments. The negative
aspect of this strategy is that organizations must maintain substantial inventories of the
necessary components to ensure business continuity. In addition, maintenance costs are
significantly higher when production is interrupted unexpectedly (Mobley, 2004).
16
Preventive maintenance (PvM) is a time-based maintenance strategy. This means that
the component is serviced after a number of years or when it has accumulated a prede-
termined number of operating hours. A database of component failures is maintained,
and this can be used to determine the average failure time and provide input to the
maintenance plan. A database of component failures is maintained and can be used to
determine the average failure time and provide input to the maintenance plan. Alterna-
tively, the specified service intervals may be based on the component manufacturer’s
maintenance instructions (Mobley, 2004).
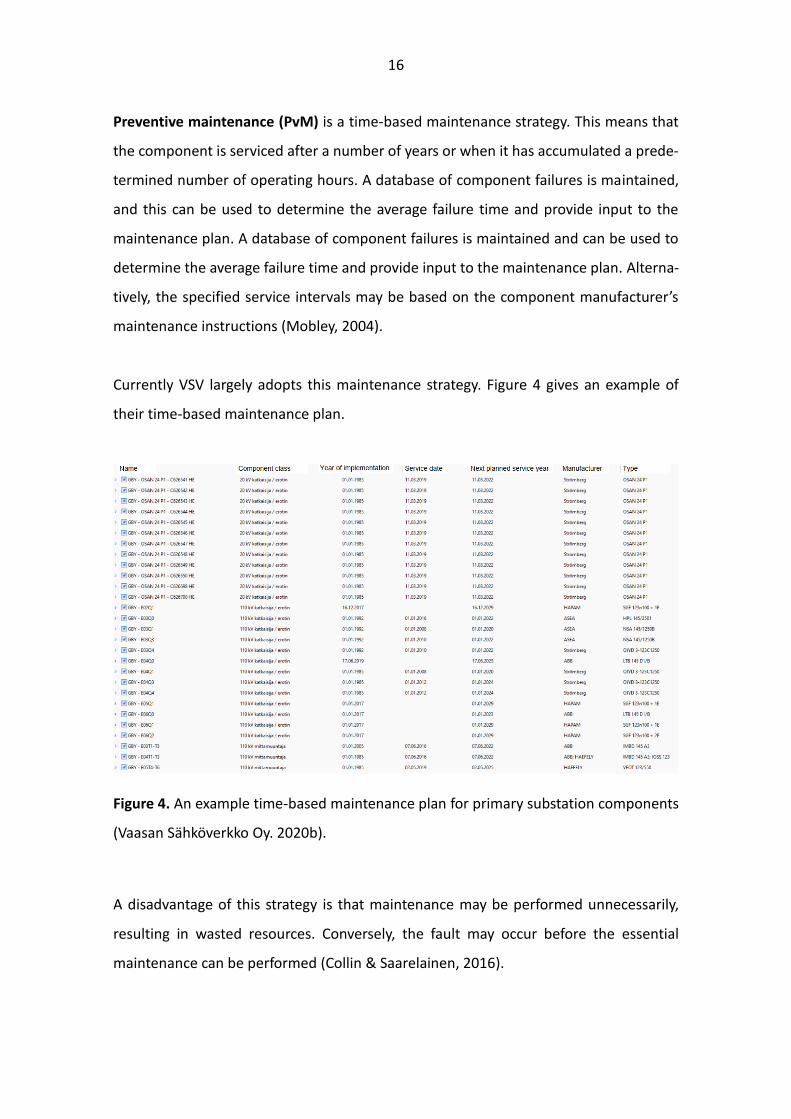
Currently VSV largely adopts this maintenance strategy. Figure 4 gives an example of
their time-based maintenance plan.
Figure 4. An example time-based maintenance plan for primary substation components
(Vaasan Sähköverkko Oy. 2020b).
A disadvantage of this strategy is that maintenance may be performed unnecessarily,
resulting in wasted resources. Conversely, the fault may occur before the essential
maintenance can be performed (Collin & Saarelainen, 2016).

17
Condition-based maintenance (CBM), as the name implies, is a maintenance strategy
that uses sensors and other measurement techniques to monitor the condition of com-
ponents. The system recognizes the limit values, and if they are exceeded them, the sys-
tem issues an alarm to the personnel monitoring its status (Ramamurthy et al. 2017,
Bangalore and Tjernberg 2016, Lappi, 2019). Alternatively, this maintenance strategy
may be implemented when an oil analysis is performed on a power transformer and,
based on the results, it is decided that maintenance should be carried out. Without the
oil analysis, maintenance would be carried out according to the annual program (Banga-
lore & Tjernberg, 2016).
Predictive maintenance (PdM), according to Collin and Saarelainen (2016), is the appli-
cation with the most opportunities in IoT technology, because it directly impacts a com-
pany’s profitability. They largely attribute this to efforts to increase productivity by im-
proving equipment utilization, reducing unexpected production interruptions, and short-
ening planned maintenance outages. As PdM consists of remote monitoring, manage-
ment, optimization and system updates, analytics are required to determine anomalies
in the measurement data. It is clear that the PdM needs analytics to determine anoma-
lies from the measurement data. Therefore, the key idea is to detect information from
the data that predicts component breakdown.
Schmidt and Wang (2016) list challenges, which related to the PdM: context data utiliza-
tion, knowledge management, uncertainty management, and systematic approach. The
first challenge is analyzing external environmental variables, such as the effects of minor
maintenance or inspection data on the overall picture, where measurement data is also
available. Understanding the whole picture allows factors contributing to component
failure to be identified. The second issue relates to knowledge management, which is an
integral part of PdM. The information must be managed in so that it can be stored in vast
quantities and create visual dashboards that benefit the end users. The third challenge
is closely related to the second, since a substantial amount of data is required to create
18
accurate machine learning algorithms from it. The final problem is that there is no sys-
tematic approach to designing and implementing of a PdM system. Consequently, organ-
izations must employ agile development methods to create them, if they are unwilling
to invest in a ready-made system (Schmidt & Wang, 2016, Collin & Saarelainen, 2016).
Risk-based maintenance (RBM), according to Ramamurthy et al. (2017), is a system in
which:
“decision about maintenance of an asset is also based on optimizing the use of
maintenance of resource across all assets. In this approach, the risk of failure is used
as the metric to allocate maintenance resources. Risk here means the product of prob-
ability of failure and the economic consequences of failure.”
This approach was recognized long before IoT technology based PdM became more
widely discussed. Sekita’s (2019) study shows that the using IoT technology to create a
risk-based maintenance system delivers significant added value by providing more infor-
mation about the assets to be maintained. Hence it provides a better basis for risk as-
sessments.
In the future, combining these perspectives may produce a maintenance system with
significantly reduced human input. However, the numerous issues involved in replacing
humans with a system feature are not currently addressed at the larger scale. As such,
the maintenance systems in this study may be referred to as decision support systems
(DSSs).
Prescriptive maintenance (RxM) is one of the latest concepts to become recognized
among maintenance strategies. Digitalization is the most significant factor behind this
model. It extends the concept of PdM to include actions that are strictly necessary to
prevent failure. The suggested actions are based on historical and real-time data. The
differences between PdM and RxM may be summarized by the fact that PdM answers
19
the question, “What will happen when?” Alternatively, RxM asks, “How can we control
the occurrence of a specific event?” (Nemeth et al. 2018 and Liu et al. 2019).
2.2 IoT
Internet of Things refers to heterogeneous items connected to the internet. This means
that all devices have a unique identifier and are connected to the internet using standard
communication protocols. Devices transmit data to systems where it can be stored, an-
alyzed, and processed using machine learning algorithms (Collin & Saarelainen, 2016,
Tarkoma and Weiss, 2013).
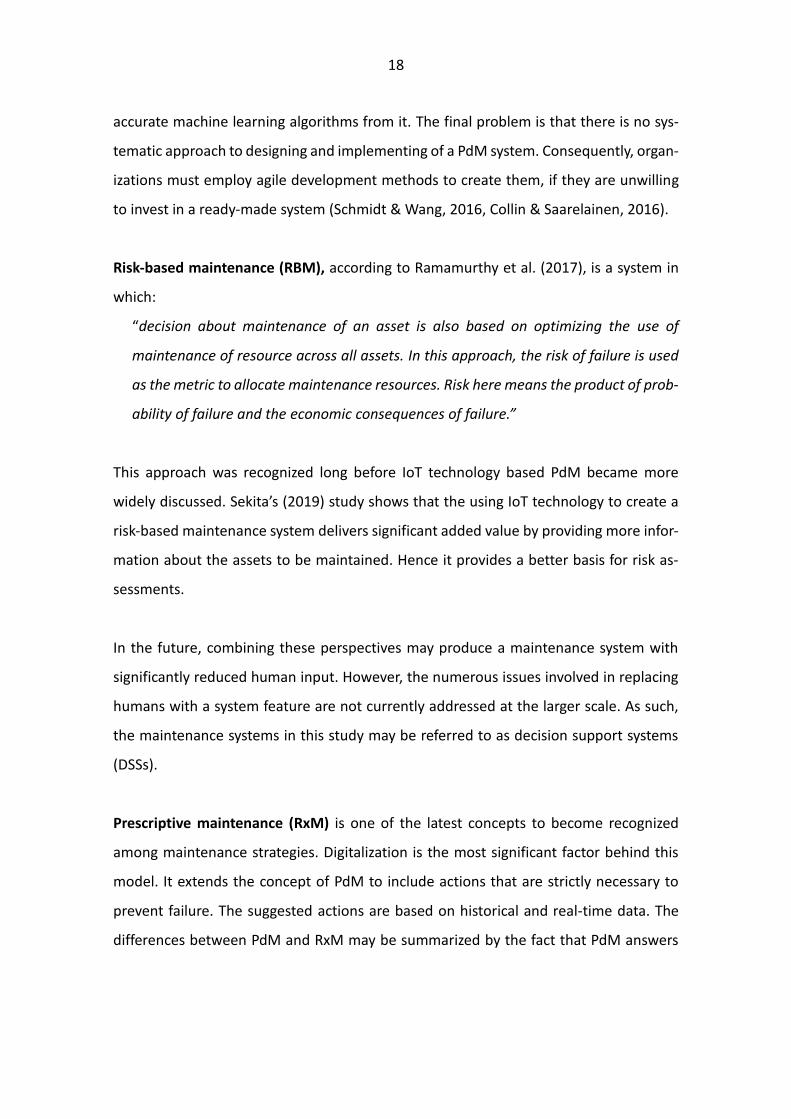
Collin and Saarelainen (2016) describes IoT as a superior concept and with subtypes such
as industrial internet of things (IIoT) and IoT of consumers. These subtypes are illustrated
in Figure 5.
Figure 5. Differences between IIoT and IoT of consumers (Collin & Saarelainen, 2016).
As shown in Figure 5, IIoT refers to a heavy industry-scale system and IoT of consumers
(shown on the right) describes a lighter system such as a smartwatch or smart phone.
This study focuses on IIoT.
20
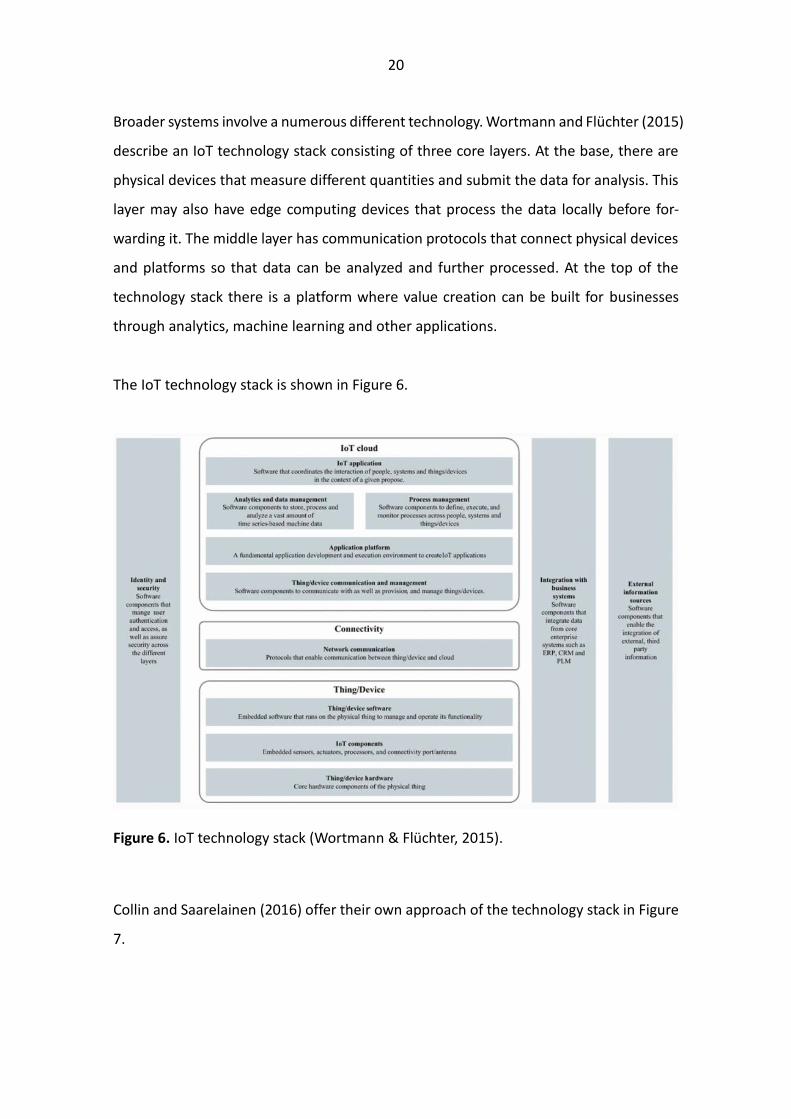
Broader systems involve a numerous different technology. Wortmann and Flüchter (2015)
describe an IoT technology stack consisting of three core layers. At the base, there are
physical devices that measure different quantities and submit the data for analysis. This
layer may also have edge computing devices that process the data locally before for-
warding it. The middle layer has communication protocols that connect physical devices
and platforms so that data can be analyzed and further processed. At the top of the
technology stack there is a platform where value creation can be built for businesses
through analytics, machine learning and other applications.
The IoT technology stack is shown in Figure 6.
Figure 6. IoT technology stack (Wortmann & Flüchter, 2015).
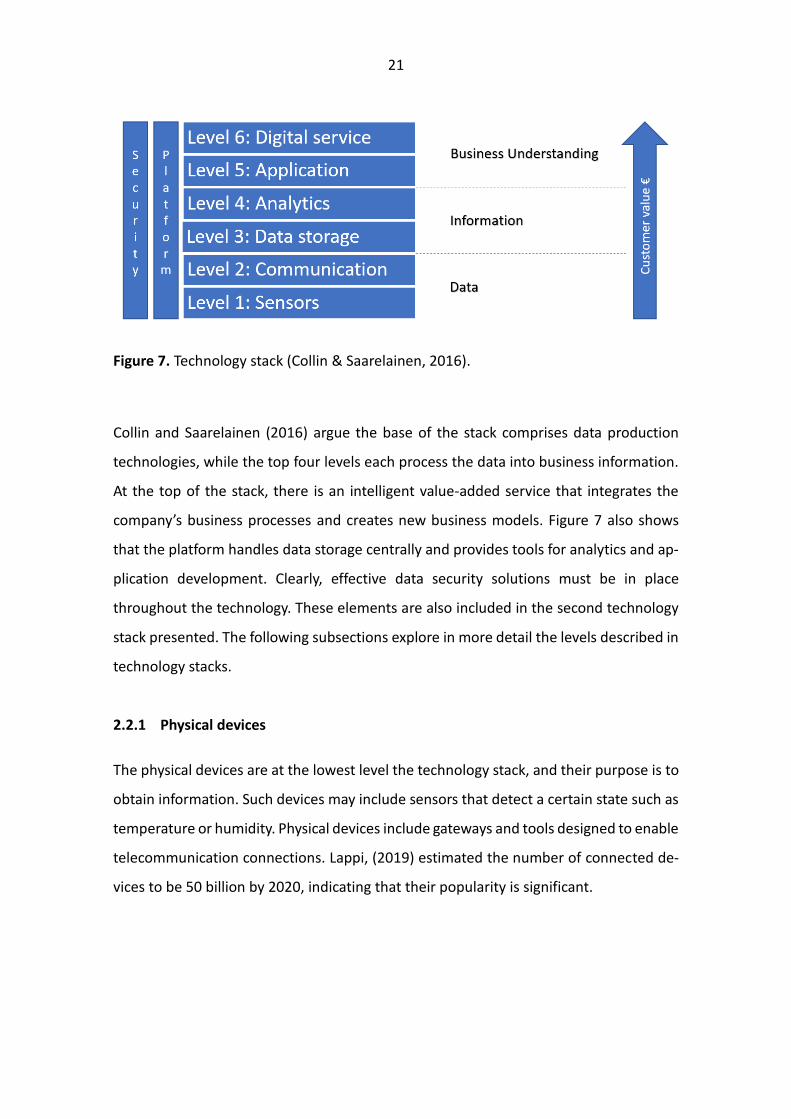
Collin and Saarelainen (2016) offer their own approach of the technology stack in Figure
7.
21
Figure 7. Technology stack (Collin & Saarelainen, 2016).
Collin and Saarelainen (2016) argue the base of the stack comprises data production
technologies, while the top four levels each process the data into business information.
At the top of the stack, there is an intelligent value-added service that integrates the
company’s business processes and creates new business models. Figure 7 also shows
that the platform handles data storage centrally and provides tools for analytics and ap-
plication development. Clearly, effective data security solutions must be in place
throughout the technology. These elements are also included in the second technology
stack presented. The following subsections explore in more detail the levels described in
technology stacks.
2.2.1 Physical devices
The physical devices are at the lowest level the technology stack, and their purpose is to
obtain information. Such devices may include sensors that detect a certain state such as
temperature or humidity. Physical devices include gateways and tools designed to enable
telecommunication connections. Lappi, (2019) estimated the number of connected de-
vices to be 50 billion by 2020, indicating that their popularity is significant.
22
Collin and Saarelainen (2016) describe a sensor as a “device which principle of operation
is to convert information into an electronic form about a phenomenon that is not inher-
ently electronic. A phenomenon can be a physical or chemical condition or event in na-
ture.” They list the most recognized sensor categories as follows:
- Acceleration, speed, position
- Temperature, humidity
- Gas / liquid pressure level or flow
- Chemical property / composition
- Vibration
- Resistance, energy consumption, other electronic features
- Radiation (visible light, infrared and ultraviolet radiation)
- Brightness, intimacy
- Biometry (fingerprint, iris)
- Volume
Sensors using Bluetooth or Radio Frequency Identification (RFID) technology do not
transmit data directly from a sensor to an IoT platform for further analysis. Therefore, a
gateway is required to receive the data and forward it to the IoT platform. This may be
achieved using, the representational state transfer application programmable interface
(REST API) or the message queuing telemetry transport (MQTT) protocol.
Kang et al. (2017) observe that the main purpose of the gateway is to connect data gen-
erators to the Internet and thereby enhance device management via two-way commu-
nication. Data is received and forwarded to the IoT platform. Update packets may also
be transmitted to the data generators via the gateway, optimizing their data security or
performance.
To optimize the amount of data storage on the IoT platform or the performance and
latency of the IoT system, edge computing technology is typically used. This occurs in the
23
gateway, where an algorithm performs functions. If deviations occur, the gateway can
forward them to the IoT platform (Morabito et al. 2018).
Collin and Saarelainen (2016) also list the following benefits of gateways:
- Local raw data filtering reduces the amount of traffic, which saves money and
reduces the risk of network congestion.
- Filtering the raw data can more easily highlight anomalies.
- Data can be stored locally, so that interruptions in the communication connection
do not cause data loss.
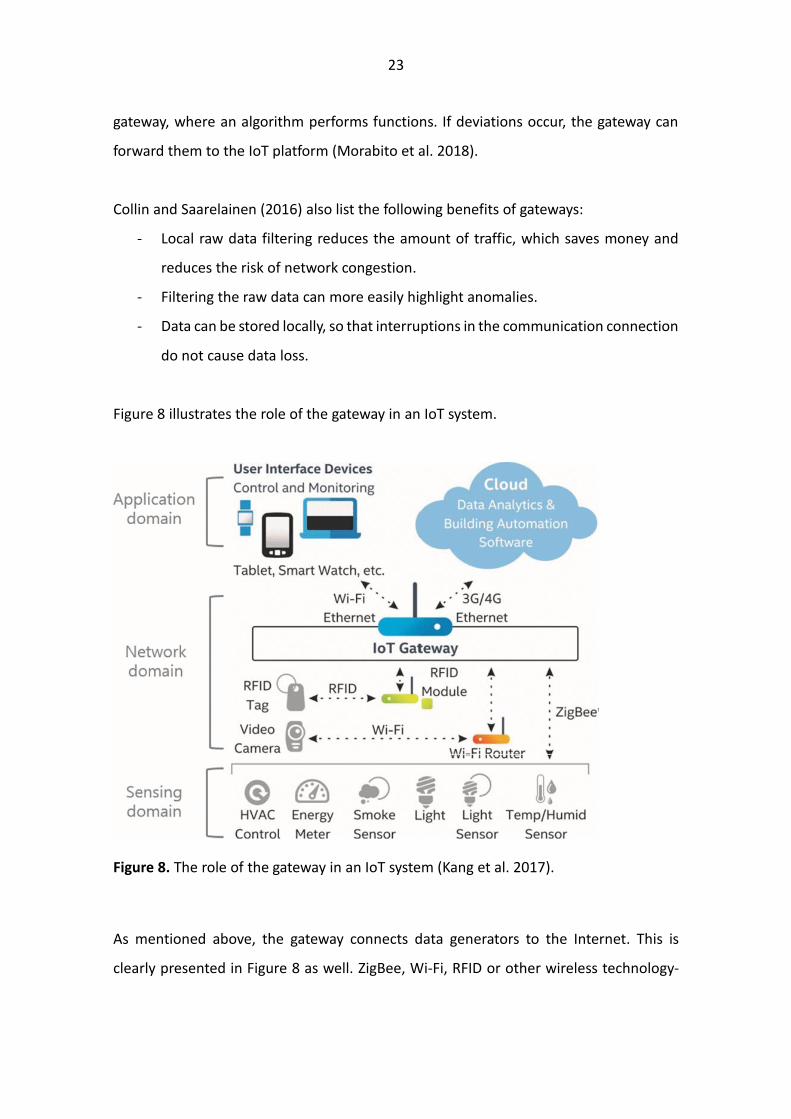
Figure 8 illustrates the role of the gateway in an IoT system.
Figure 8. The role of the gateway in an IoT system (Kang et al. 2017).
As mentioned above, the gateway connects data generators to the Internet. This is
clearly presented in Figure 8 as well. ZigBee, Wi-Fi, RFID or other wireless technology-
24
based data generators could all be connected to the gateway. Then a received data could
be forwarded to the IoT platform via 4G or ethernet protocols. Telecommunication and
communication protocols are presented in more detail in following subsection.
2.2.2 Telecommunication and communication protocols
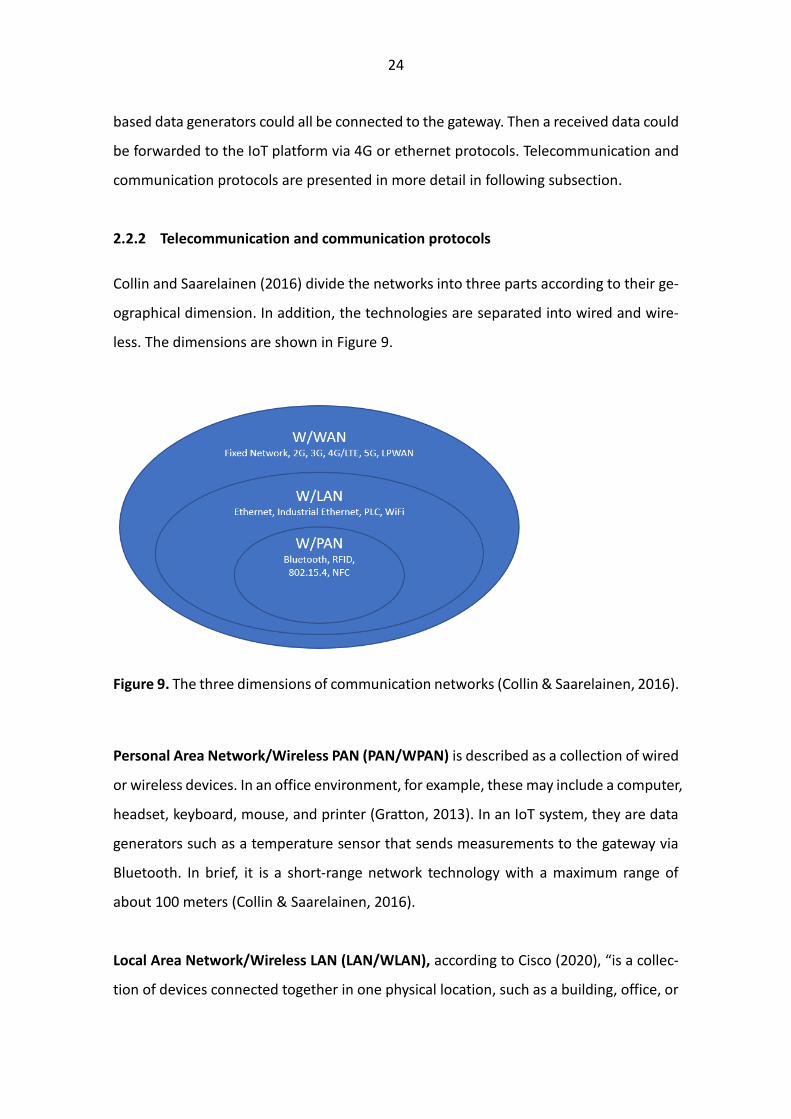
Collin and Saarelainen (2016) divide the networks into three parts according to their ge-
ographical dimension. In addition, the technologies are separated into wired and wire-
less. The dimensions are shown in Figure 9.
Figure 9. The three dimensions of communication networks (Collin & Saarelainen, 2016).
Personal Area Network/Wireless PAN (PAN/WPAN) is described as a collection of wired
or wireless devices. In an office environment, for example, these may include a computer,
headset, keyboard, mouse, and printer (Gratton, 2013). In an IoT system, they are data
generators such as a temperature sensor that sends measurements to the gateway via
Bluetooth. In brief, it is a short-range network technology with a maximum range of
about 100 meters (Collin & Saarelainen, 2016).
Local Area Network/Wireless LAN (LAN/WLAN), according to Cisco (2020), “is a collec-
tion of devices connected together in one physical location, such as a building, office, or
25
home.” The size of an LAN largely depends on its intended use, be it at home, in business,
or in an educational institution. Its maximum data transfer rate may reach tens of giga-
bits per second (Cisco, 2020, Collin & Saarelainen, 2016).
Wide Area Network/Wireless WAN (WAN/WWAN) is a network covering an extensive
area. This may include a connection across a city, regional or national border. The data
transmitted by this network may be hundreds of megabits per second, although the
throughput decreases significantly as the transmission distance and packet loss rate in-
crease (Zhang et al. 2012, Collin & Saarelainen, 2016).
As shown in Figure 8, all three networks are required in a large-scale IoT system. Data
generators typically send data over the WPAN to the IoT gateway, and the gateway for-
wards it over the WWAN to the cloud where the IoT platform is located. In addition,
surveillance cameras may be connected to the IoT gateway via WLAN.
In the following section, several data transfer standards are presented. These standards
have also been used in the practical part of this study.
Modbus is an application layer messaging protocol that provides client-server commu-
nication for a range of uses. This standard has been a widely used in the industry since
1979, due to its simplicity and transparency. However, it has presented significant chal-
lenges to current cybersecurity issues (Hersent et al. 2012). Collin and Saarelainen (2016)
observe that if Modbus is not used via a VPN tunnel, data security is entirely absent.
Modbus exists in both serial interface and ethernet formats.
HTTP messages are a method of data exchange between a server and a client. There are
two types of messages. Requests are messages sent by a client to perform an action on
a server, and responses are answers from the server (HTTP Messages - HTTP | MDN,
2021).
26
Message queuing telemetry transport (MQTT) is a good option when a lighter commu-
nication protocol is required. It is particularly suitable in situations where many devices
need to exchange data over the internet in close to real time, while consuming minimum
network bandwidth. This situation occurs almost invariably in the IoT world (Hillar, 2018).
The MQTT protocol is based on a publish-subscribe pattern, which Hillar (2018) describes
as follows:
“A message published by a client is decoupled from the other client or clients that
receive message. The clients do not know about the existence of the other clients. A
client can publish messages of a specific type and only the clients that are interested
in that specific type of message will receive the published messages”.
The MQTT protocol is supported by most IoT platforms and the practical element of this
study included testing this protocol on different platforms.
2.3 IoT Platform
Figures 6 and 7 illustrate technology stacks related to the IoT. These descriptions may
also be applied to the IoT platform structure. Ravulavaru (2018) comments, “In a nutshell,
IoT Platforms are support software that connect smart devices and the entities that use
the data from these smart devices.”
Gartner (2021) defines IIoT platforms as a set of integrated software capabilities. These
facilities allow organizations to improve asset management and decision-making. As pre-
viously stated in this study, these systems may also be referred to DSSs.
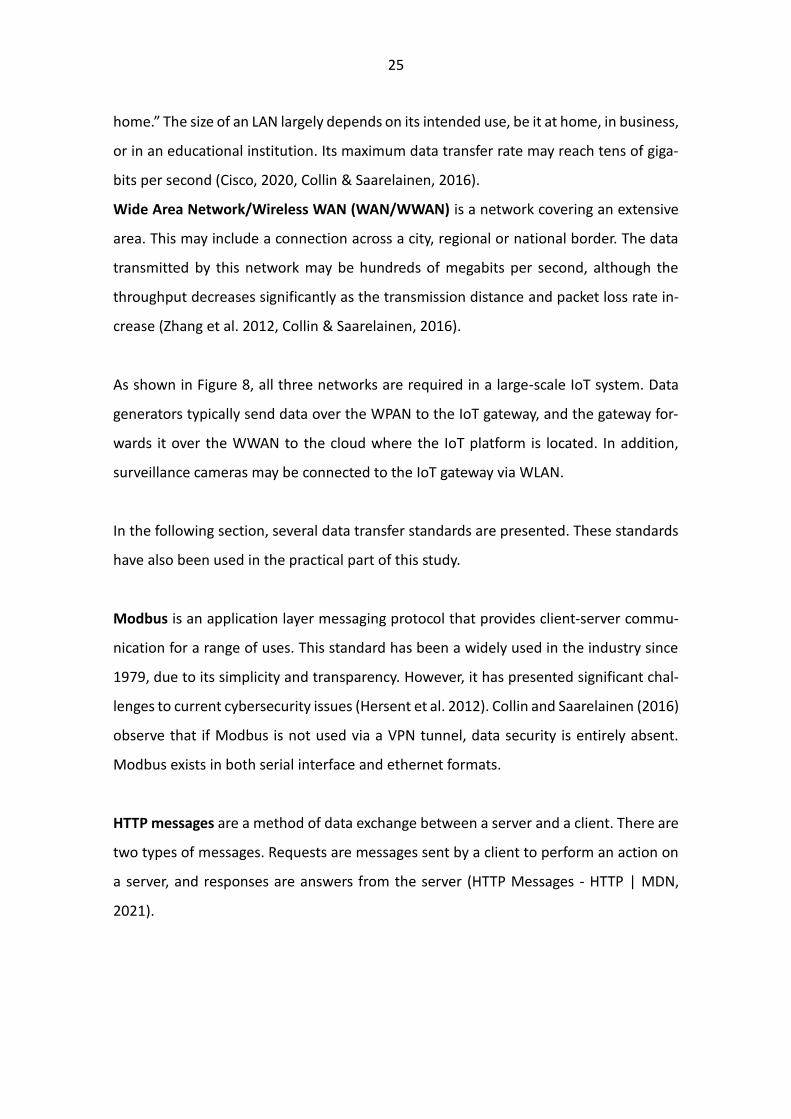
Chapter 1 discussed the need for improvements the reliability and quality of electricity
distribution. Lau et al (2019) present a vision of a smart city that could meet these chal-
lenges in the future (Figure 10). Highlighted in blue, are the topics explored in this study.
27
Figure 10. A smart city system with the topics of this study highlighted in blue (Lau et al.
2019).
As shown in Figure 10, platforms, communication technology and APIs play a significant
role in this system. In this study the REST API and software development kit (SDK) were
used to transfer data from sensors to platforms. The REST API is a set of protocols for
building and integrating application software. Its function is to exchange information be-
tween a client and the server (i.e., the server receives the query and forwards a response
to the client). The REST API may also be described a design style that works with the
HTTP protocol (Fielding, 2000). The SDK is a set of application development tools that
may be installed in a single package and may include APIs, documentation, libraries, test-
ing and analysis kits, or the MQTT protocol (Red Hat. 2021).
2.4 IoT solutions in electrical distribution network
This section provides examples of the solutions to PdM and IoT in the electrical network.
28
2.4.1 Examples in the primary substations
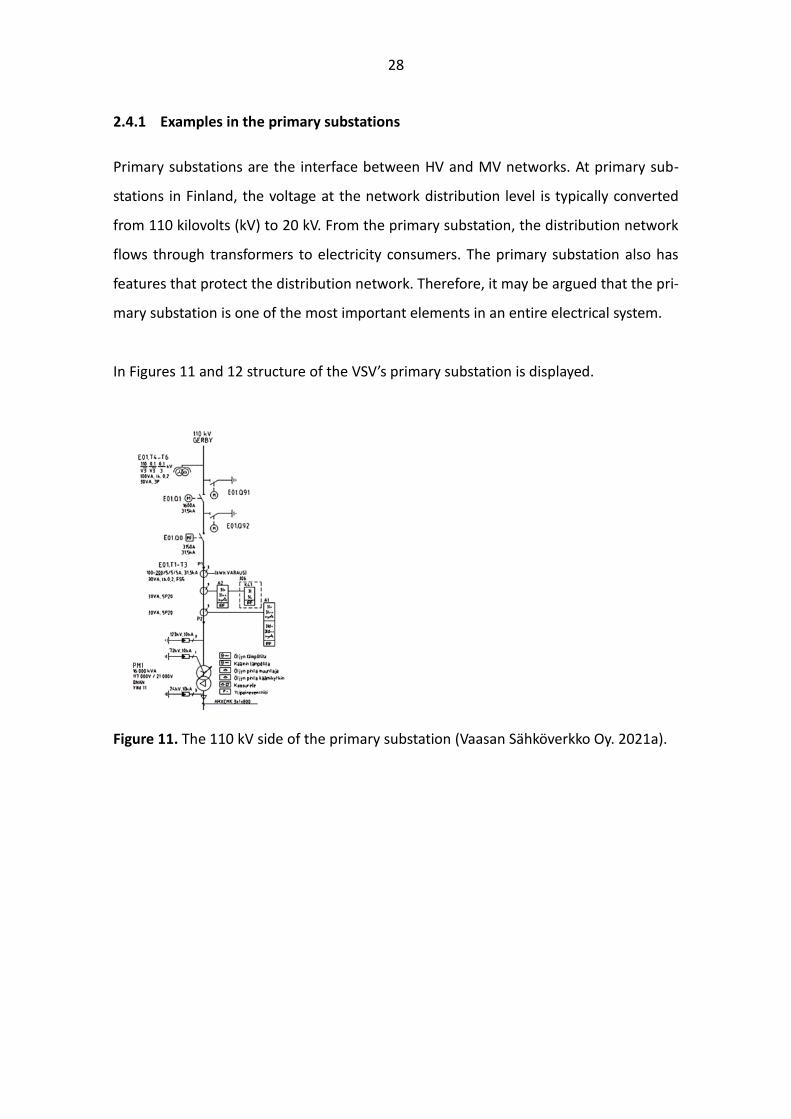
Primary substations are the interface between HV and MV networks. At primary sub-
stations in Finland, the voltage at the network distribution level is typically converted
from 110 kilovolts (kV) to 20 kV. From the primary substation, the distribution network
flows through transformers to electricity consumers. The primary substation also has
features that protect the distribution network. Therefore, it may be argued that the pri-
mary substation is one of the most important elements in an entire electrical system.
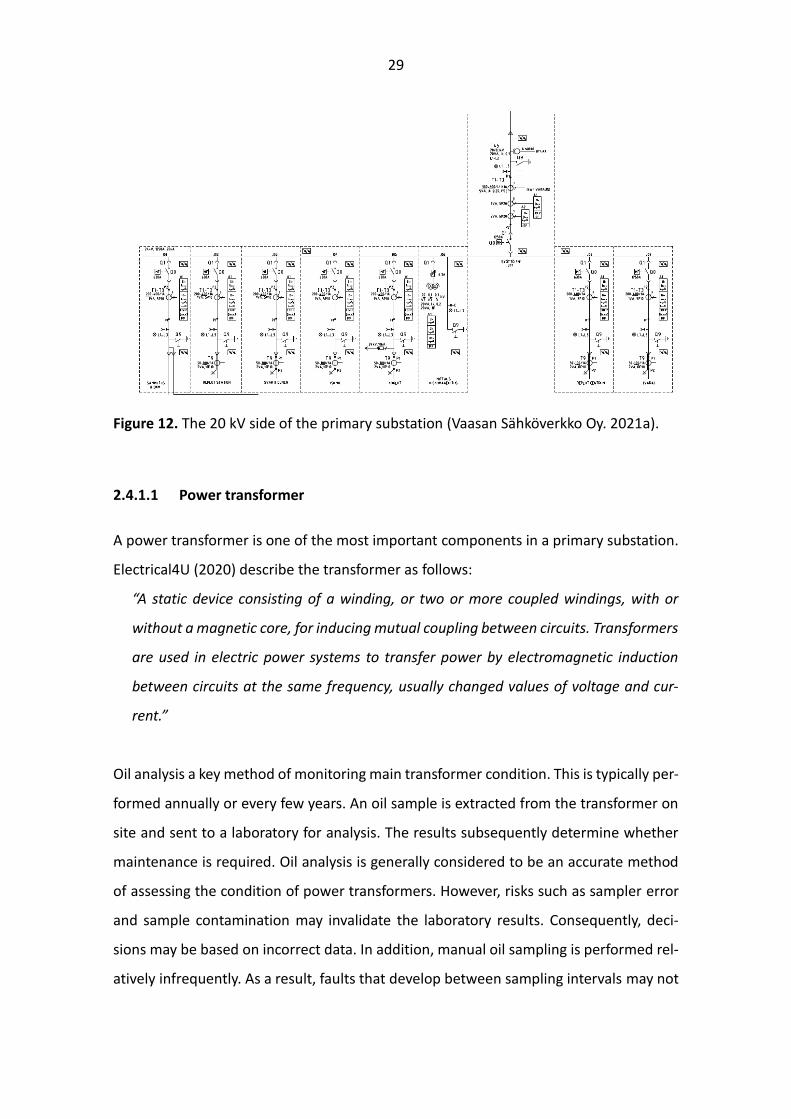
In Figures 11 and 12 structure of the VSV’s primary substation is displayed.
Figure 11. The 110 kV side of the primary substation (Vaasan Sähköverkko Oy. 2021a).
29
Figure 12. The 20 kV side of the primary substation (Vaasan Sähköverkko Oy. 2021a).
2.4.1.1 Power transformer
A power transformer is one of the most important components in a primary substation.
Electrical4U (2020) describe the transformer as follows:
“A static device consisting of a winding, or two or more coupled windings, with or
without a magnetic core, for inducing mutual coupling between circuits. Transformers
are used in electric power systems to transfer power by electromagnetic induction
between circuits at the same frequency, usually changed values of voltage and cur-
rent.”
Oil analysis a key method of monitoring main transformer condition. This is typically per-
formed annually or every few years. An oil sample is extracted from the transformer on
site and sent to a laboratory for analysis. The results subsequently determine whether
maintenance is required. Oil analysis is generally considered to be an accurate method
of assessing the condition of power transformers. However, risks such as sampler error
and sample contamination may invalidate the laboratory results. Consequently, deci-
sions may be based on incorrect data. In addition, manual oil sampling is performed rel-
atively infrequently. As a result, faults that develop between sampling intervals may not
30
be detected, increasing the risk of unexpected defects in the power transformer (Eronen,
2016).
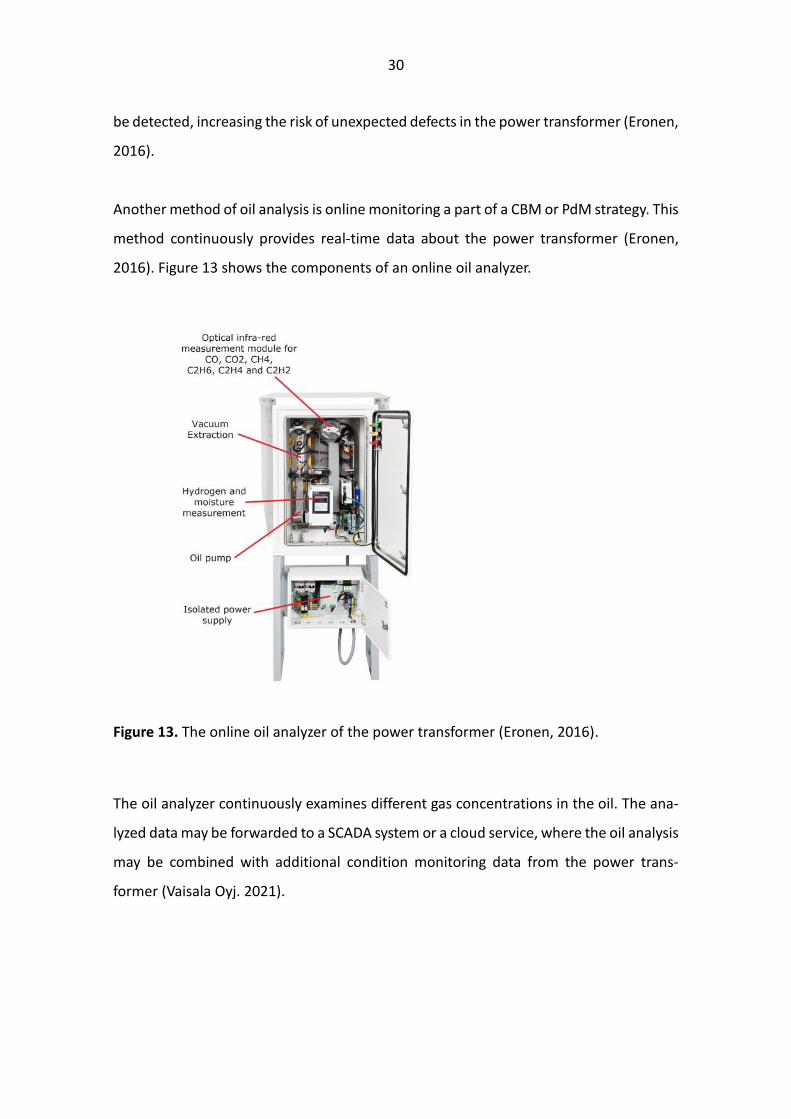
Another method of oil analysis is online monitoring a part of a CBM or PdM strategy. This
method continuously provides real-time data about the power transformer (Eronen,
2016). Figure 13 shows the components of an online oil analyzer.
Figure 13. The online oil analyzer of the power transformer (Eronen, 2016).
The oil analyzer continuously examines different gas concentrations in the oil. The ana-
lyzed data may be forwarded to a SCADA system or a cloud service, where the oil analysis
may be combined with additional condition monitoring data from the power trans-
former (Vaisala Oyj. 2021).

31
2.4.1.2 Circuit breakers
A circuit breaker is used to control the electrical system or to disconnect a faulty part of
the operating network. There are two operating modes. In the first mode, the circuit
breaker conducts the load current with the lowest possible losses. In the breaking mode,
it switches the conductor to insulation. Although the circuit breaker isolates the defec-
tive part of the electrical system, its contacts do not provide a reliable opening distance
as in a disconnector (Elovaara & Haarla, 2011).
Circuit breakers with a voltage of 110 kV use SF6 gas as an arc extinguishing agent. SF6
gas density is monitored at each primary substation inspection visit, several times a year.
Visual inspection of SF6 gas pressure has the same disadvantage as manual oil analysis
in a power transformer (i.e., potential failures may not be detected early enough).
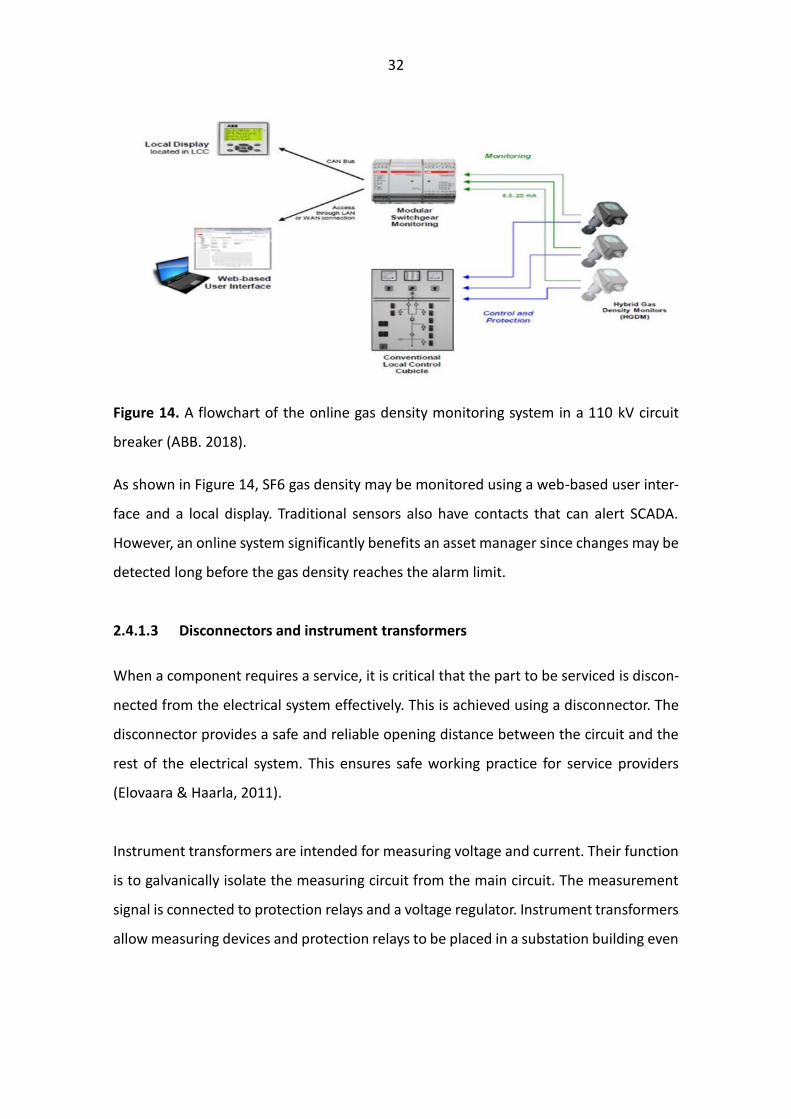
As with a power transformer, a circuit breaker also has an online system for monitoring
SF6 gas density in real time using either SCADA or a cloud service. Figure 14 provides a
flowchart of the online gas density monitoring system in a 110 kV circuit breaker (ABB.
2018).
32
Figure 14. A flowchart of the online gas density monitoring system in a 110 kV circuit
breaker (ABB. 2018).
As shown in Figure 14, SF6 gas density may be monitored using a web-based user inter-
face and a local display. Traditional sensors also have contacts that can alert SCADA.
However, an online system significantly benefits an asset manager since changes may be
detected long before the gas density reaches the alarm limit.
2.4.1.3 Disconnectors and instrument transformers
When a component requires a service, it is critical that the part to be serviced is discon-
nected from the electrical system effectively. This is achieved using a disconnector. The
disconnector provides a safe and reliable opening distance between the circuit and the
rest of the electrical system. This ensures safe working practice for service providers
(Elovaara & Haarla, 2011).
Instrument transformers are intended for measuring voltage and current. Their function
is to galvanically isolate the measuring circuit from the main circuit. The measurement
signal is connected to protection relays and a voltage regulator. Instrument transformers
allow measuring devices and protection relays to be placed in a substation building even
33
when the instrument transformers are located at an outdoor switchyard (Elovaara &
Haarla, 2011).
Disconnectors are typically monitored and serviced in accordance with a PvM strategy.
Maintenance and testing require an interruption in the electricity supply. Current paths
and transient resistance are tested during maintenance. A thermal imager may be used
to monitor increased temperature caused by transition resistance and to determine the
need for maintenance (Unseen Technologies Oy. 2019). Generally, primary substation
and distribution network components are thermally imaged once a year. Therefore,
faults that develop between imaging intervals may not be detected, increasing the risk
of unexpected defects in the instrument transformers or disconnectors.
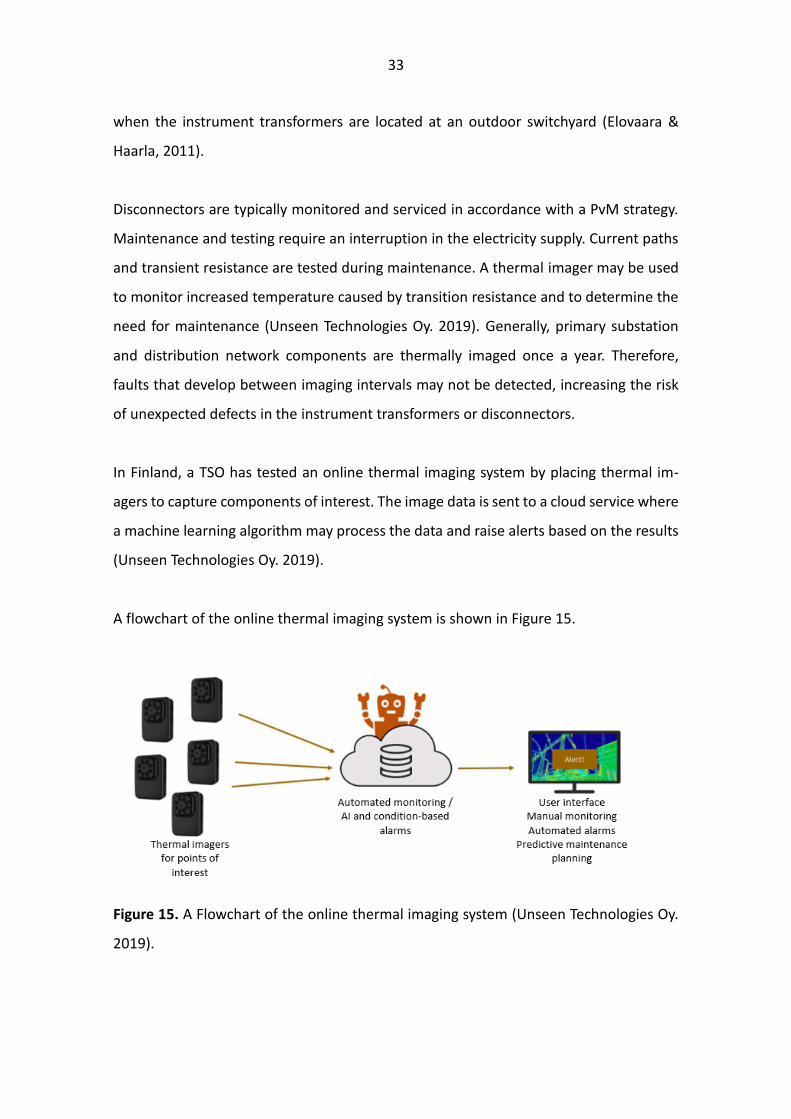
In Finland, a TSO has tested an online thermal imaging system by placing thermal im-
agers to capture components of interest. The image data is sent to a cloud service where
a machine learning algorithm may process the data and raise alerts based on the results
(Unseen Technologies Oy. 2019).
A flowchart of the online thermal imaging system is shown in Figure 15.
Figure 15. A Flowchart of the online thermal imaging system (Unseen Technologies Oy.
2019).

34
Figures 16 and 17 give examples of the results that may be achieved using an online
thermal imaging system.
Figure 16. An example of online thermal imaging of a disconnector (Unseen Technologies
Oy. 2019).
Figure 17. An example of online thermal imaging of an instrument transformer (Unseen
Technologies Oy. 2019).
Figures 16 and 17 clearly demonstrate where the loaded components are warmer than
the ambient temperature. In addition, the images on the right have been formed into
pixel squares to facilitate the use of an algorithm and machine learning for automatic
fault location.

35
Figure 18 shows that the manual thermal imager has detected the correct fault in the
current transformer at VSV’s primary substation.
Figure 18. Thermal imaging of the current transformer in Ristinummi primary substation
(Etab Electric Oy. 2019).
2.4.1.4 DC systems
A DC system is part of the primary substation’s auxiliary electrical structure. The DC sys-
tem acts as the primary substation’s DC voltage supply for secondary appliances, such as
remote control and protection devices, when DC is not available through the primary
substation’s self-operating system. This ensures safe operation in the primary substation
(Niemi, 2019).
Battery condition is monitored during visual inspections several times a year and by im-
pedance measurements every 1-2 years. These maintenance procedures are sufficient
to assess any battery deterioration. However, sudden faults cannot be regulated by this
principle (Niemi, 2019).
Currently, battery chargers have intelligent controllers that provide substantial infor-
mation about the DC system. Huang et al. (2017) provide the following examples:
- Current and voltage measurements

36
- The resistance of each battery cell
- The state of battery charge
This type of monitoring system is shown in Figure 19.
Figure 19. The structure of intelligent maintenance in a primary substation DC system
(Huang et al. 2017).
Huang et al. (2017) conclude that intelligent technology in a primary substation’s DC sys-
tem improves the level of maintenance automation, reducing the inspection and mainte-
nance workload by 50%.
37
2.4.1.5 Buildings
A primary substation building primarily houses 20 kV switchgear, control and protection
components, and auxiliary electrical systems such as the DC system. The power trans-
former may also be located in the primary substation building.
The temperature in a primary substation building is crucial factor since the building also
contains protection relays, which are critical components of the electrical network.
Sihtola (2014) observes that an internal temperature above 20 °C effectively reduces
the life of a protection relay and has energy efficiency implications. Therefore, it is im-
portant to monitor the temperature in a primary substation building. Currently, wireless
temperature sensors send data via Bluetooth to a gateway, which subsequently trans-
mits the data to a cloud service for analysis (Ruuvi, 2021).
2.4.2 Examples in the distribution network
This subsection provides examples that can be used in the distribution network.
2.4.2.1 Secondary substation
A secondary substation follows the same principles as the previously discussed primary
substation, albeit at a lower voltage level and therefore on a smaller scale. The basic
components of a secondary substation are medium voltage switchgear, distribution
transformer, and low voltage switchgear (ABB. 2000).
The components of a secondary substation may be subject to partial discharges. These
are electrical discharges that occur when the strength of an electrical field exceeds the
that of an insulating material. A partial discharge is not the same thing as a breakthrough,
since it does not close electrode spacing. Over time, electrical discharges form a woody
erosion mark known as “electric wood” as they pass through the material. This erosion
may eventually cause a breakthrough that requires substantial maintenance (Teräväinen,
2019).

38
Temperature, sound and brightness may be used to detect partial and corona discharges.
A temperature sensor mounted on the terminals, or a thermal imager, may detect a rise
in temperature caused by partial discharges. Partial discharges may also produce noise
distinguishable by sound spectrum analysis (Niemi, 2019).
The frequency analysis of a corona discharge is shown in Figure 20.
Figure 20. Frequency analysis of a corona discharge in a secondary substation (Niemi,
2019).
2.4.2.2 Cable cabinet
A cable cabinet houses a branch of a low voltage cable network and its associated com-
ponents. It may also be used in the internal distribution network of a multi-building es-
tate and as part of a pole-mounted secondary substation. Through cable cabinet, most
consumers receive their domestic electricity supply (ABB. 2000).
39
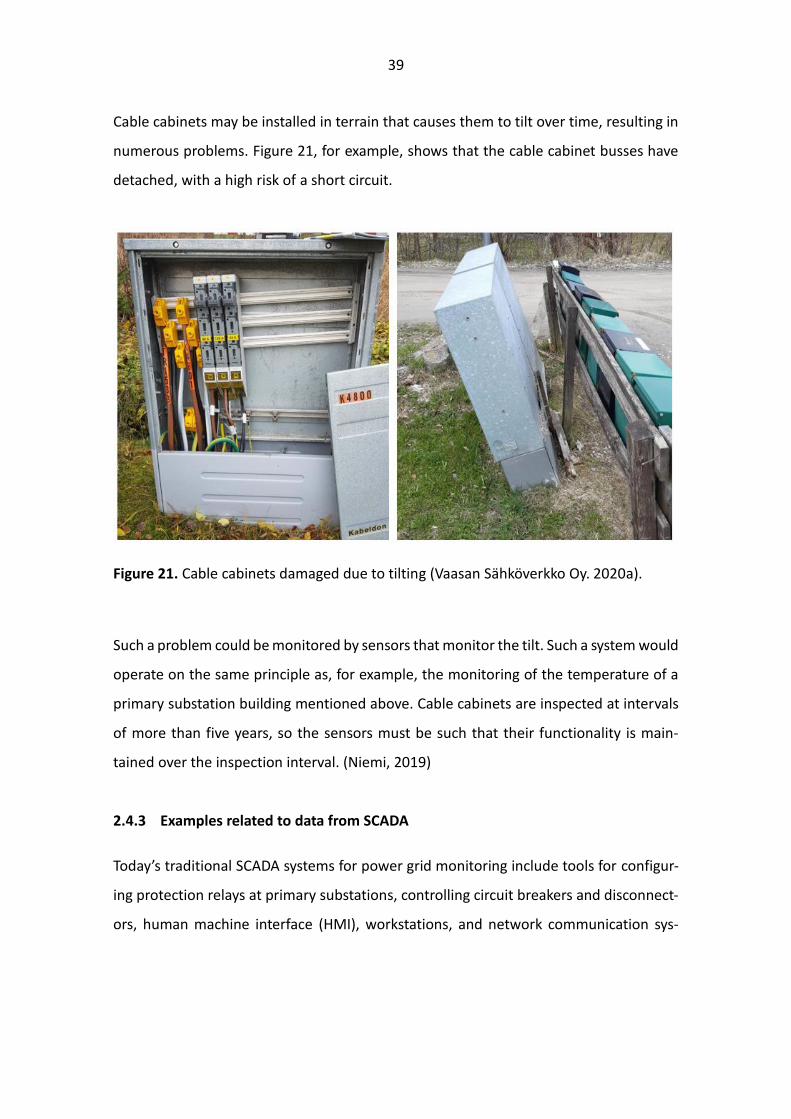
Cable cabinets may be installed in terrain that causes them to tilt over time, resulting in
numerous problems. Figure 21, for example, shows that the cable cabinet busses have
detached, with a high risk of a short circuit.
Figure 21. Cable cabinets damaged due to tilting (Vaasan Sähköverkko Oy. 2020a).
Such a problem could be monitored by sensors that monitor the tilt. Such a system would
operate on the same principle as, for example, the monitoring of the temperature of a
primary substation building mentioned above. Cable cabinets are inspected at intervals
of more than five years, so the sensors must be such that their functionality is main-
tained over the inspection interval. (Niemi, 2019)
2.4.3 Examples related to data from SCADA
Today’s traditional SCADA systems for power grid monitoring include tools for configur-
ing protection relays at primary substations, controlling circuit breakers and disconnect-
ors, human machine interface (HMI), workstations, and network communication sys-
40
tems as a complete integrated system. Each component to be modeled requires pro-
gramming and configuration to cause alarms and status information to enter the system.
(McCrady, 2013)
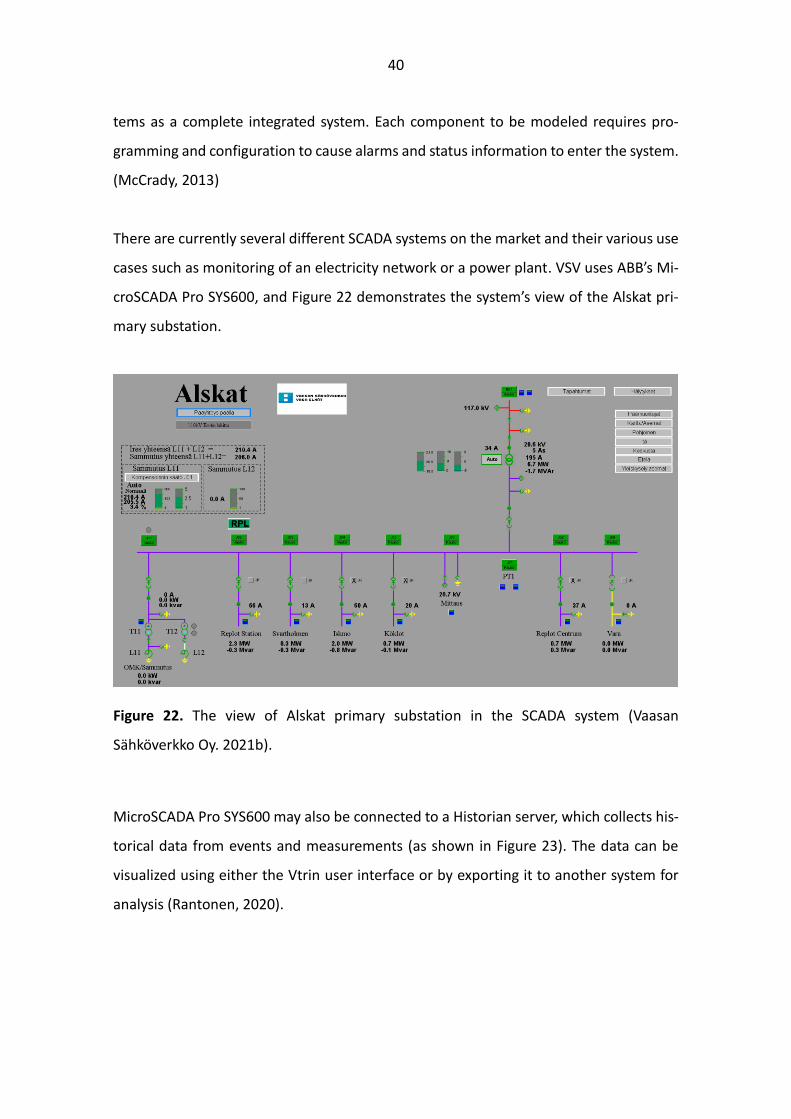
There are currently several different SCADA systems on the market and their various use
cases such as monitoring of an electricity network or a power plant. VSV uses ABB’s Mi-
croSCADA Pro SYS600, and Figure 22 demonstrates the system’s view of the Alskat pri-
mary substation.
Figure 22. The view of Alskat primary substation in the SCADA system (Vaasan
Sähköverkko Oy. 2021b).
MicroSCADA Pro SYS600 may also be connected to a Historian server, which collects his-
torical data from events and measurements (as shown in Figure 23). The data can be
visualized using either the Vtrin user interface or by exporting it to another system for
analysis (Rantonen, 2020).
41
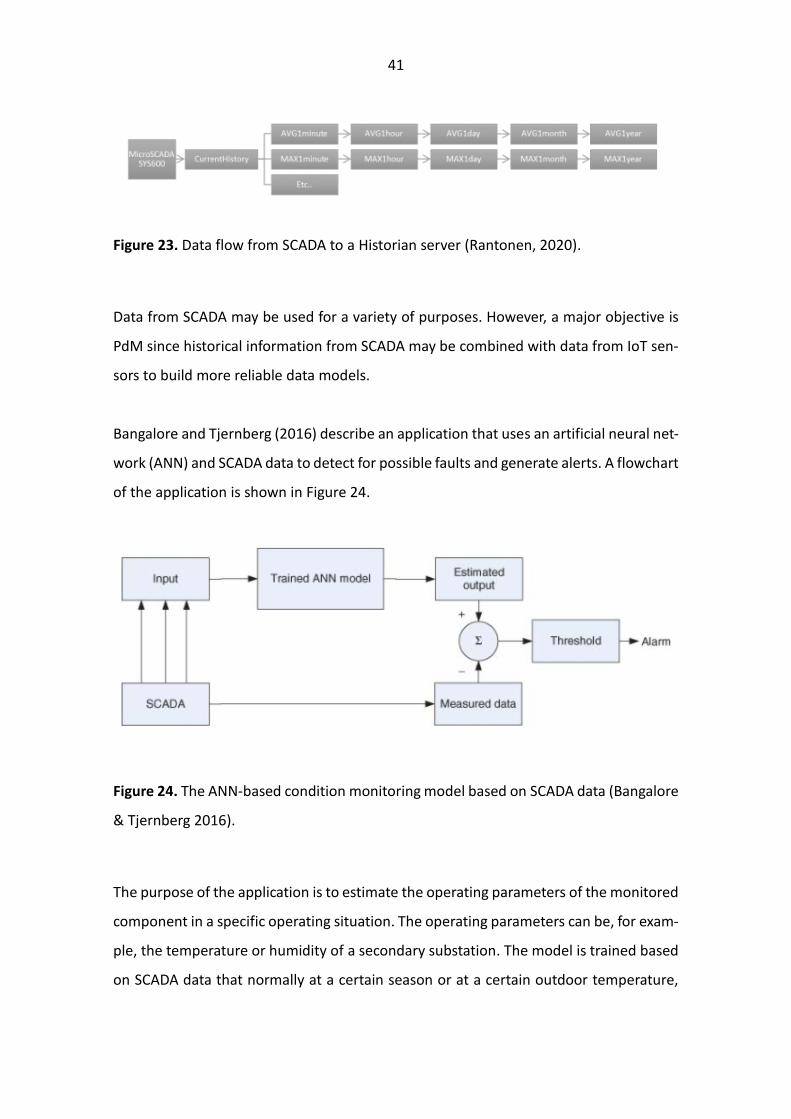
Figure 23. Data flow from SCADA to a Historian server (Rantonen, 2020).
Data from SCADA may be used for a variety of purposes. However, a major objective is
PdM since historical information from SCADA may be combined with data from IoT sen-
sors to build more reliable data models.
Bangalore and Tjernberg (2016) describe an application that uses an artificial neural net-
work (ANN) and SCADA data to detect for possible faults and generate alerts. A flowchart
of the application is shown in Figure 24.
Figure 24. The ANN-based condition monitoring model based on SCADA data (Bangalore
& Tjernberg 2016).
The purpose of the application is to estimate the operating parameters of the monitored
component in a specific operating situation. The operating parameters can be, for exam-
ple, the temperature or humidity of a secondary substation. The model is trained based
on SCADA data that normally at a certain season or at a certain outdoor temperature,

42
the secondary substation has a certain temperature. If the measured value deviates from
the value predicted by model, it can generate an alarm to SCADA. (Bangalore & Tjernberg,
2016)
43
3 Research and IoT Platform Selection Methodology
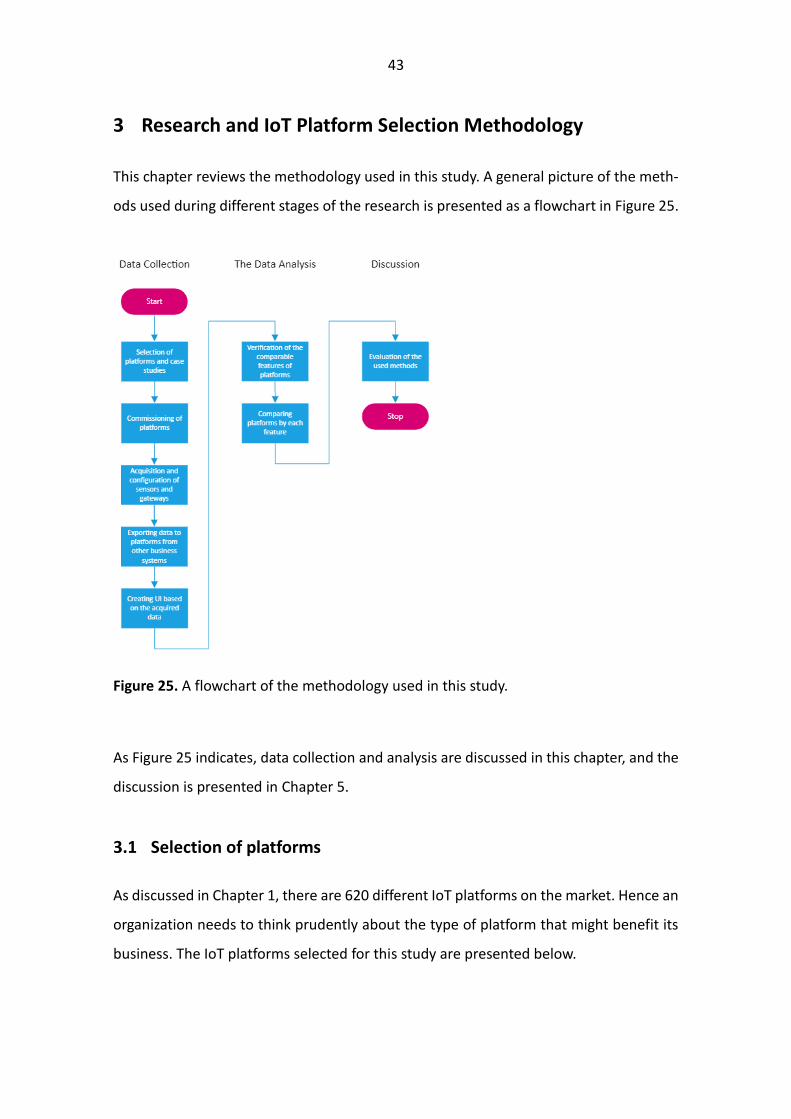
This chapter reviews the methodology used in this study. A general picture of the meth-
ods used during different stages of the research is presented as a flowchart in Figure 25.
Figure 25. A flowchart of the methodology used in this study.
As Figure 25 indicates, data collection and analysis are discussed in this chapter, and the
discussion is presented in Chapter 5.
3.1 Selection of platforms
As discussed in Chapter 1, there are 620 different IoT platforms on the market. Hence an
organization needs to think prudently about the type of platform that might benefit its
business. The IoT platforms selected for this study are presented below.
44
M-Files was the first choice for this study, since the platform in is already in use at VSV
for document management and primary substation maintenance planning. M-Files is a
document and information management system capable of managing large-scale busi-
ness processes through numerous automated workflows. In addition, there are options
for managing access rights, modifying data security settings and integrating into other
systems. It also has good APIs, such as the REST API, which was also used to generate
data for the platform in this study (M-Files Corporation. 2021b).
IoT-Ticket was also a natural choice for this study, as it is a platform developed by VSV’s
IT partner Wapice. It is a web-based system that uses the drag and drop method to build
a visual interface for the user. As such, it does not necessarily require any lines of coding.
Data for the platform is generated along a several different paths. However, this study
used the platform’s REST API (Wapice. 2021a).
Microsoft Azure (later Azure) is one of the most recognized IoT platforms on the market
and is one of the services provided by Azure. Information transmitted by IoT devices
through Microsoft Azure is readily accessible in other services included in Azure. The
main purpose of this service is to enable devices to be connected to a cloud service so
that they may be registered and managed. In addition, data may be routed to a database
or directly to a Power BI dataset and analyzed using Power BI (Microsoft. 2021a).
Amazon Web Services (AWS) is a platform of the same scale as Azure and the main pur-
pose is quite similar to Azure. Therefore, data generated through this service is also read-
ily available in other Amazon cloud services (Amazon Web Services. 2021f).
Google Cloud Platform (GCP) is in the same class as Microsoft Azure and AWS. Its main
purpose is also similar (Google Cloud. 2021b).
In summary, M-Files and IoT-Ticket are not as globally recognized as Azure, AWS and GCP.
However, an interesting aspect of this study is how they perform alongside the market
45
giants. Although the services provided by the last three platforms are similar, they differ
somewhat on closer inspection. These differences are explored in Chapter 4.
3.2 Data collection
In this study, data related to features was collected by implementing four practical cases
for the IoT platforms. The first example involved monitoring conditions at Vaasa primary
substation using a Ruuvitag sensor, which measures temperature, humidity, and air pres-
sure (Ruuvi. 2021).
The next case used CoreTec and CoreSense to import condition monitoring data from a
power transformer at Purola primary substation. CoreTec measures power transformer
load, oil temperature and ambient temperature. It also uses condition monitoring data
to calculate aging in the power transformer. CoreSense continuously analyzes the power
transformer oil using a similar principle to that presented in subsection 2.4.1.1 (ABB.
2021a & ABB. 2021b).
The third example imported measurement and status data from the DC system at Alskat
primary substation to IoT platforms. The data was obtained using a battery charger con-
troller, which measures, system voltage and current (Alpha Technologies Ltd. 2016.).
In the final case, data was retrieved from MicroSCADA Historian to a comma separated
value (CSV) file and exported to IoT platforms using either the REST API or a Python SDK.
All the cases are illustrated in Figure 26.

46
Figure 26. The practical cases used for collecting research data.
The practical examples create a general view of the way information is generated for IoT
platforms, how data is processed and analyzed, the security solutions available, and the
pricing methods available for the different platforms.
Since there are numerous cases involving the use of such platforms, it was important to
consider similar studies to provide a holistic view of their effectiveness and any problem
areas. In particular, it was important to assess the features previously identified as the
most relevant.
The practical cases were carried out in a way that did not interfere with the primary
substation components in use. The telecommunication connections to the IoT platforms
were built so that each device had its own 4G router, avoiding any changes to the primary
substation’s existing connections. Lappi (2019) argues that a power system’s private net-
work must be secure and reliable, since connecting it to commercial IoT platforms could
pose significant threats to society. Lappi (2019) further argues that connecting SCADA
directly to IoT platforms would continually pose the same threats. Therefore, integration
between IoT platforms and the SCADA Historian system was not performed in this study.
Instead, the data was retrieved in a CSV file and exported to IoT platforms via a separate
device using either the REST API or Python SDK.

47
In addition to ensuring the consistent operation of the electricity system, the practical
cases were implemented in a way would minimize costs. Ahmad et al. (cited in Lappi,
2019) states that “in industrial applications the challenge with continuous online moni-
toring is often the cost of special monitoring devices and solutions.” Lappi also notes that
this same problem may occur for a TSO due of the large number of devices to be moni-
tored. For example, if VSV were to introduce a PdM application not only in the primary
substations but also in the distribution network with its secondary substations and cable
cabinets, the number of devices to be monitored would also increase exponentially. Con-
sequently, this aspect is also relevant to the DSO.
Although efforts were made to minimize the costs of practical cases the purchase of de-
vices (three Raspberry Pi 4 Model B with necessary accessories, and three 4G router)
were necessary to automatically transfer data to IoT platforms.
The Raspberry Pi (Rpi) is a computer with a single circuit board and is best known for its
use in IoT systems and for learning coding skills. Its numerous features and applications
make it is relatively cost-effective, particularly for lightweight IoT systems. Hence, it is
also ideal for this study (Raspberry Pi Foundation. 2021).
Figure 27 gives an overview of the Raspberry Pi 4.

48
Figure 27. An overview of the Raspberry Pi 4 (Raspberry Pi Foundation. 2021).
Information may be generated for IoT platforms in numerous ways. When using a device
such as the Rpi as a gateway, the data must first reach the gateway. Figure 24 illustrates
the solution to this. In two of the cases, the Modbus TCP bus was used and Ruuvitag
forwarded the condition monitoring data from Vaasa primary substation building to the
gateway via Bluetooth. Subsequently, two options for transferring the data to the IoT
platforms were considered.
The first option used Python programming language, which has good libraries for man-
aging the HTTP requests and the SDKs for the three largest platforms. This option was
ultimately tested in the fourth example, which transferred SCADA Historian data to the
IoT Platforms.
The second option used Node-RED software, which is a programming tool with a visual
interface and ready-made function blocks that can be wired together. Therefore, it is also
described as a “low-code programming for event-driven applications.” (OpenJS Founda-
tion. 2021)
49
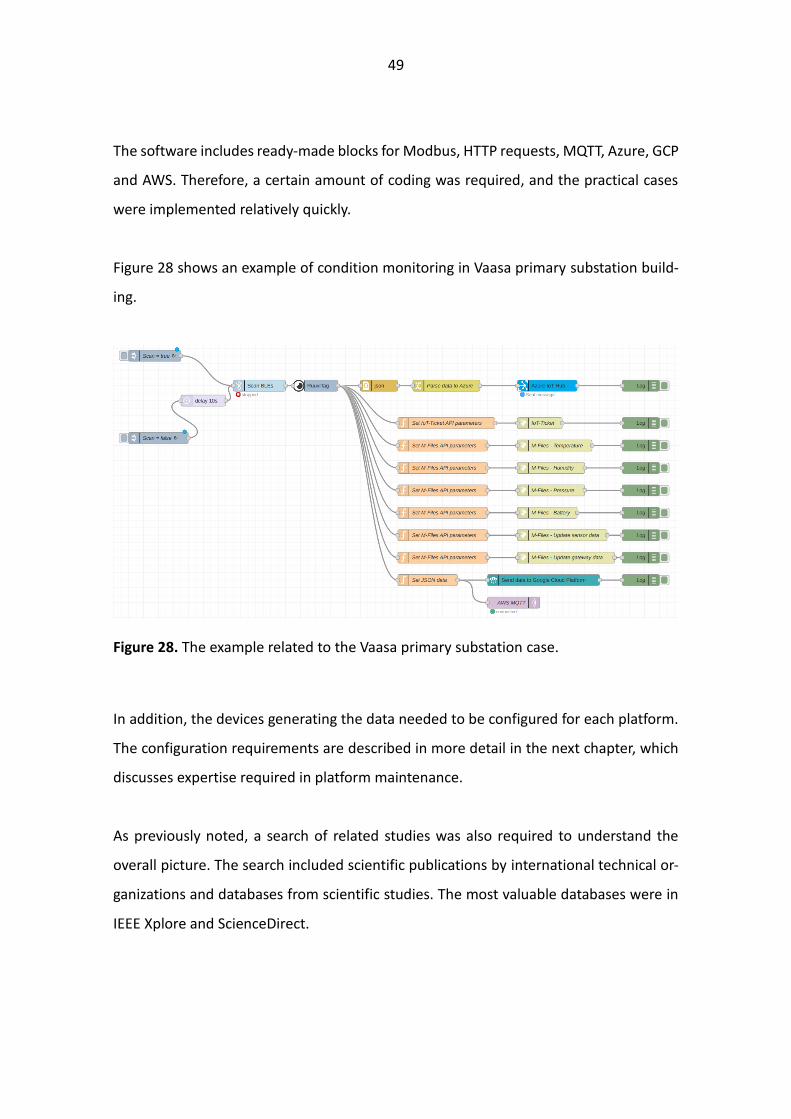
The software includes ready-made blocks for Modbus, HTTP requests, MQTT, Azure, GCP
and AWS. Therefore, a certain amount of coding was required, and the practical cases
were implemented relatively quickly.
Figure 28 shows an example of condition monitoring in Vaasa primary substation build-
ing.
Figure 28. The example related to the Vaasa primary substation case.
In addition, the devices generating the data needed to be configured for each platform.
The configuration requirements are described in more detail in the next chapter, which
discusses expertise required in platform maintenance.
As previously noted, a search of related studies was also required to understand the
overall picture. The search included scientific publications by international technical or-
ganizations and databases from scientific studies. The most valuable databases were in
IEEE Xplore and ScienceDirect.

50
Keywords used in the information search were “IoT platform” and “comparison.” The
search included publications from 2015-2021 in line with rapidly evolving technology
and recent research.
3.3 The data analysis
The usability of IoT platforms is assessed using the following features:
- Protocols and APIs
- Scalability and flexibility
- Pricing model
- Security
- User experience
- The need for expertise in platform maintenance
These features were selected due to VSV’s interest in them. They were also selected be-
cause the most recognized and efficient protocols (notably MQTT and HTTP) and their
simple upgrades were necessary for the platform. In addition, data flow through the pro-
tocols must be at a bandwidth high enough to prevent any delay in transmission. Scope
for expansion is also beneficial, since an organization may not identify all the applications
available to the platform during the early stages implementation. Since these may ap-
pear over time, the platform must be scaled as needed. In addition, flexibility is required
to keep pace with rapid changes in technology and market demand. Moreover, flexibility
and scalability in new operating environments is provided by modern API technologies,
which the platform must support so that other business systems may be integrated into
the IoT system (Ullah et al. 2020).
When acquiring something new, cost is invariably a significant factor. Therefore, price
was one of the comparison factors used in this study. Platforms with different features
and functions make price comparison challenging. Therefore, cost was assessed using a
pricing model rather than annual costs, for example (Ullah et al. 2020).
51
Although IoT data, such as customer information, is not vital for an organization, the IoT
platform will not be used to control any power grid components, as in SCADA. Neverthe-
less, security concerns are paramount, since new uses may arise and security must not
be hindered by development (Ullah et al. 2020).
For an application or service to be used optimally and generate a return on its invest-
ment, it must be attractive and simple to use. Therefore, user experience is a significant
factor (Ullah et al. 2020). Manageability should also extend to administrator level where
the platform is maintained and developed as required by maintenance experts. It is in-
efficient for an organization to recruit specialists to implement each development pro-
posal. Each of these features will be examined in the next chapter.
52
4 IoT Platforms Comparison Results
This chapter presents the study results and the IoT reference architecture of the plat-
forms. In addition, it compares different platforms based on the features discussed in
the previous chapter. User experience will be compared with the aid of images to sup-
port the discussion.
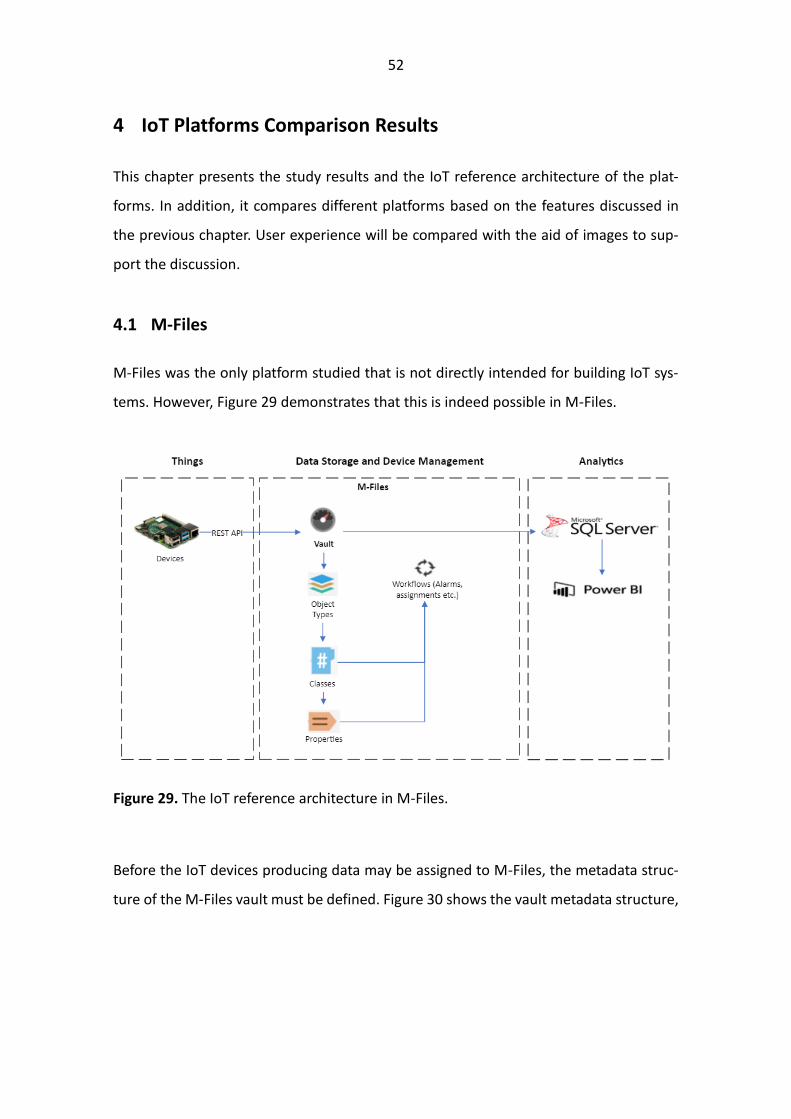
4.1 M-Files
M-Files was the only platform studied that is not directly intended for building IoT sys-
tems. However, Figure 29 demonstrates that this is indeed possible in M-Files.
Figure 29. The IoT reference architecture in M-Files.
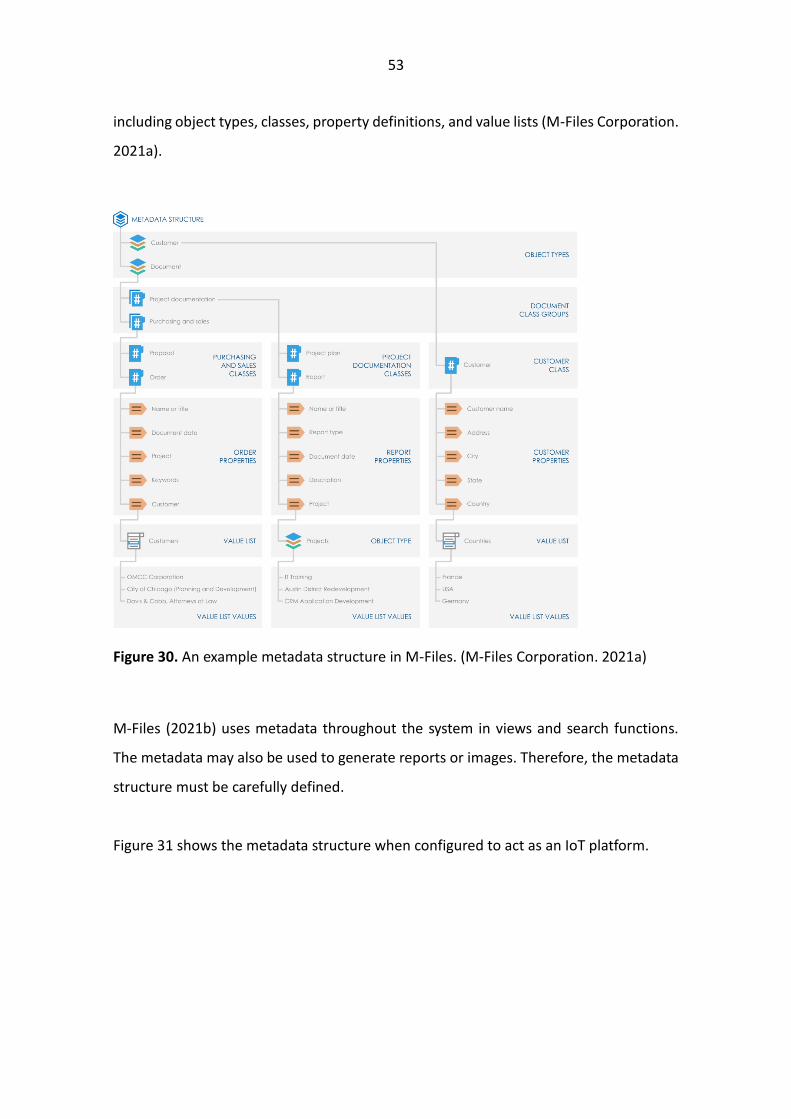
Before the IoT devices producing data may be assigned to M-Files, the metadata struc-
ture of the M-Files vault must be defined. Figure 30 shows the vault metadata structure,
53
including object types, classes, property definitions, and value lists (M-Files Corporation.
2021a).
Figure 30. An example metadata structure in M-Files. (M-Files Corporation. 2021a)
M-Files (2021b) uses metadata throughout the system in views and search functions.
The metadata may also be used to generate reports or images. Therefore, the metadata
structure must be carefully defined.
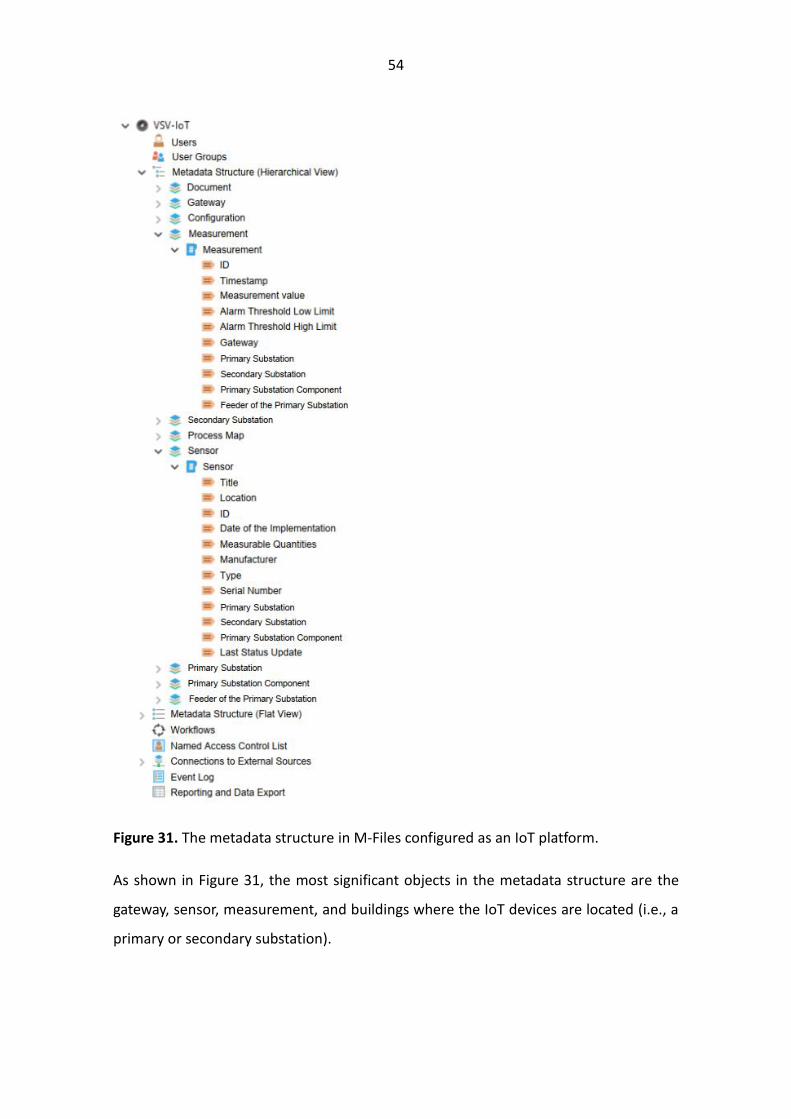
Figure 31 shows the metadata structure when configured to act as an IoT platform.
54
Figure 31. The metadata structure in M-Files configured as an IoT platform.
As shown in Figure 31, the most significant objects in the metadata structure are the
gateway, sensor, measurement, and buildings where the IoT devices are located (i.e., a
primary or secondary substation).

55
It also valuable in M-Files to create workflows that help manage the entire system. The
workflow may include gateway or sensor status monitoring, which detects timestamps
when information about IoT devices is received. If nothing has been received, a prede-
termined user receives an email alert.
Data generated by IoT devices is likely to be visual so that end users gain a better under-
standing of the system’s condition. The M-Files reporting module may be used to define
a dataset exported to a separate structured query language (SQL) database. Subse-
quently, the dataset may be retrieved by Power BI, where the data is analyzed and used
to create dashboards (M-Files Corporation. 2021a).
4.1.1 Protocols and APIs
M-Files, like most IoT platforms, does not support the MQTT protocol. Ullah et al. (2020)
argue that is a negative factor since MQTT is a light protocol and communication be-
tween devices and the platform is therefore more efficient. M-Files supports the HTTP
protocol, which is used to build communication. Although its performance is not as effi-
cient as MQTT (Al-Fuqaha et al. 2015), HTTP is cited as widely used compared to other
IoT platforms (Ullah et al. 2020, Guth et al. 2016, Agarwal & Alam, 2018).
Furthermore, M-Files has an ActiveX/COM API with supported programming languages,
including VB.NET, C#, Visual Basic, VBScript and C++. In addition, M-Files includes a REST
API named M-Files Web Service API (M-Files Corporation. 2021a). In this study, the latter
was tested for receiving messages from IoT devices on the platform.
In addition to the REST API, M-Files has comprehensive options for integration with other
systems. The content replication tool, for example, may be used to import additional
maintenance data to the IoT platform. As shown in the metadata structure (Figure 31),
it is desirable to link measurements, sensors and gateways to primary substations. There-
fore, it is useful to automatically bring these components to the platform from their data
source locations. VSV stores maintenance planning for primary substations in M-Files,

56
and the quickest way for primary substation data to reach the IoT platform is to import
it from VSV’s existing vault using a content replication module. This module is used to
synchronize data between different vaults (M-Files Corporation. 2021a).
4.1.2 Scalability and flexibility
M-Files was implemented at VSV in 2017 to manage primary substation documentation.
Currently, most of VSV’s documents are managed there. In addition, several workflows
related to business processes have been built. Based on this example, M-Files scales
from a small system to a large entity.
The metadata structure in M-Files may be modified after implementation. However,
when installing the system, is important to define it as precisely as possible. Nevertheless,
it is a reasonably flexible platform. Problems of scalability and flexibility occur since M-
Files is built on top of the SQL database. Collin and Saarelainen (2016) observe that SQL
databases may encounter problems with speed and scalability and that it is preferable
to build IIoT applications based on a not only structured query language (NoSQL) data
warehouse. Therefore, miscellaneous data may be transferred to the same database on
the platform without the need to organize it into different compartments.
4.1.3 Pricing model
As previously discussed, M-Files was selected for this study partly because it was already
in use at VSV. In this case, should VSV chose M-Files as its IoT platform, there would be
no system acquisition. Since M-Files does not publicize pricing information concerning
their system, costs are typically based on an agreement between the subscriber and the
supplier.
4.1.4 Security
To maintain security in M-Files, it is advisable to implement the IoT platform in a separate
vault. This prevents business-critical information and documents being stored in the

57
vault connected to IoT devices via the REST API. In addition, the username defined in the
REST API must be different from that is used in the other vaults. M-Files has particularly
comprehensive features for managing user permissions, and automatic security settings
may be defined in the vaults. However, when IoT data is solely related to PdM and not
customers, it is not essential to define specific user security settings (M-Files Corporation.
2021a).
Connections between the M-Files server and clients are encrypted using the Secure
Sockets Layer (SSL) or Transport Layer Security (TLS). These features encrypt data sent
by IoT devices to the M-Files server (M-Files Corporation. 2021a, Oppliger. 2016).
The M-Files SQL database may be encrypted using the system’s default function, which
uses the AES-256 encryption algorithm. If the default feature is enabled after system
implementation, previously created data or documents must be updated. This procedure
is illustrated in Figure 32 (M-Files Corporation. 2020).
Figure 32. The procedure for updating the encryption status of existing files (M-Files Cor-
poration. 2020).
In M-Files, it is possible to use federated verification to define an authentication system
outside M-Files. Figure 33 demonstrates the authentication process in a flowchart (M-
Files Corporation. 2021a).

58
Figure 33. M-Files and federated authentication system. (M-Files Corporation. 2021a)
Authentication may also be carried out using vault specific credentials or Windows log-
in. Therefore, an organization has a may options for selecting the most appropriate au-
thentication method for its users (M-Files Corporation. 2021a).
A significant security concern is managing updates to IoT devices, since their operating
systems may need to be updated using either remote connections or automated pro-
cesses. M-Files does not have an interface for sending update packages to devices that
would be installed according to a predefined process. However, in M-Files, device-spe-
cific views may be defined and referred to as update packages. In this case, the IoT gate-
way must be intelligent enough query, through the REST API, whether a new update
package has been released to its view and if so, start the update process.
Finally, since M-Files operates in accordance with the ISO 27001 security management
system, there are both internal and external audits related to product security issues.
4.1.5 User experience
M-Files has been used in VSV since 2017, hence user experience may be positive if the
IoT platform is based on the same application already in use. Constantly digitizing pro-
cesses means having to absorb new information and learning to use new applications. It
59
is therefore beneficial if the new application does not need to be learnt. An advantage
of M-Files is its clear user interface and the ability to customize it to the user’s require-
ments.
On the negative side, the metadata structure must be configured with M-Files admin-
istration tools. Subsequently, the IoT devices must be configured with M-Files desktop
or web client before data analysis is completed using Power BI. User experience would
be improved if these functions could be completed in one location. Conversely, some
end users simply require the Power BI application to obtain all the information necessary
to support decision-making. Only system developers need to use all the applications dis-
cussed in Figure 29.
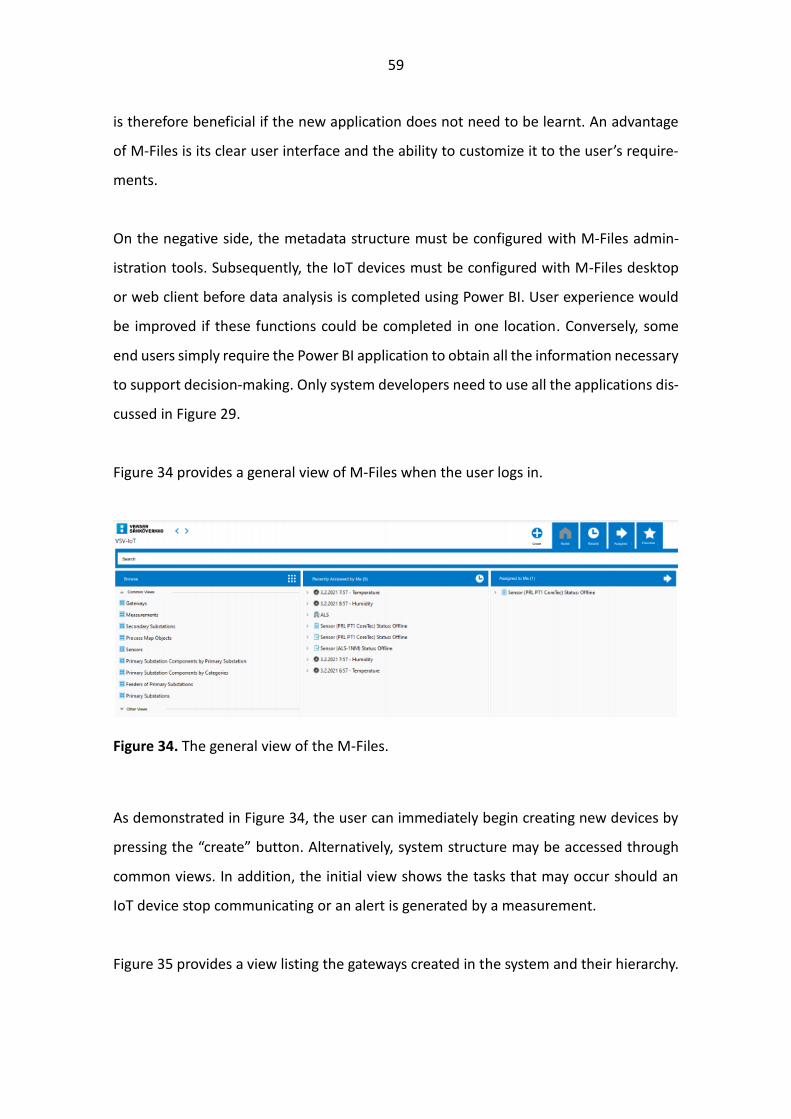
Figure 34 provides a general view of M-Files when the user logs in.
Figure 34. The general view of the M-Files.
As demonstrated in Figure 34, the user can immediately begin creating new devices by
pressing the “create” button. Alternatively, system structure may be accessed through
common views. In addition, the initial view shows the tasks that may occur should an
IoT device stop communicating or an alert is generated by a measurement.
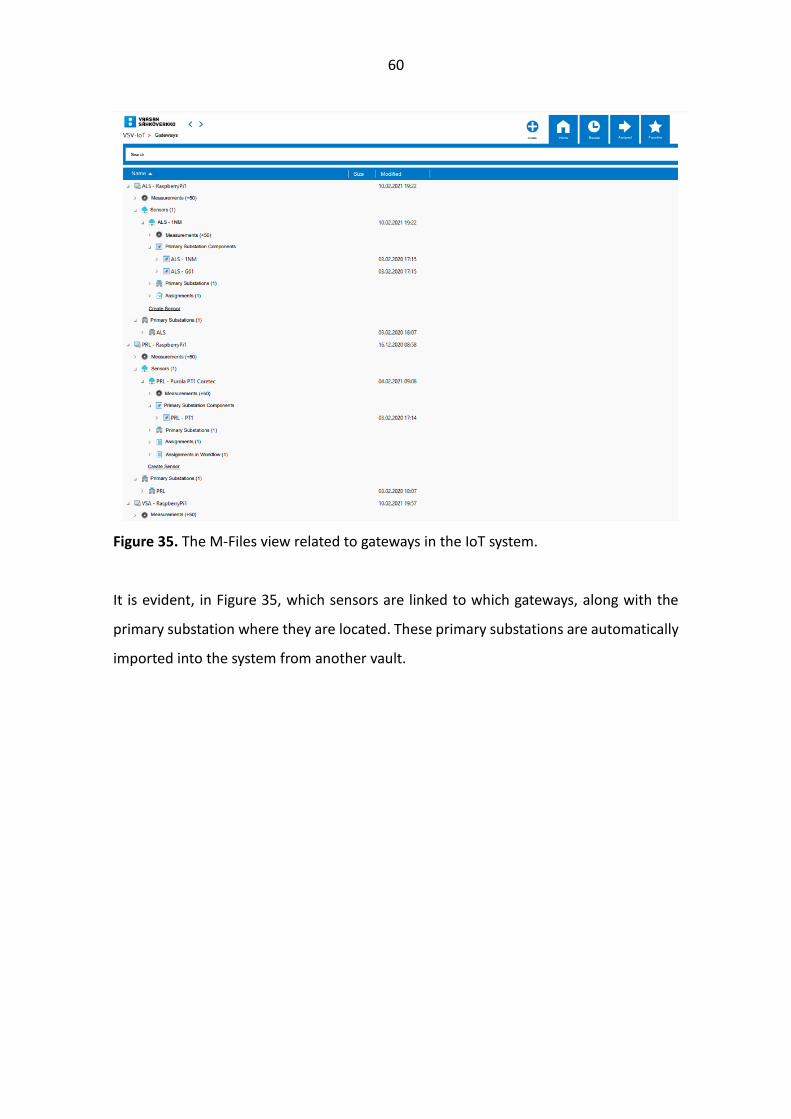
Figure 35 provides a view listing the gateways created in the system and their hierarchy.
60
Figure 35. The M-Files view related to gateways in the IoT system.
It is evident, in Figure 35, which sensors are linked to which gateways, along with the
primary substation where they are located. These primary substations are automatically
imported into the system from another vault.

61
Figure 36 demonstrates a view with measured values from different IoT devices.
Figure 36. The M-Files view related to measurements from the IoT devices.
From Figure 36, it is readily apparent that this view provides no additional value for the
end user. However, visually presenting the data may support decision-making regarding
possible maintenance actions.
Figure 29 shows that the data in the M-Files system is exported to a separate SQL data-
base, where it is subsequently retrieved by Power BI for more extensive analysis.
Power BI is a Microsoft product designed to visualize exported data to support decision-
making. In 2020, Microsoft was recognized for the thirteenth consecutive year as a
leader in the Gartner Magic Quadrant for Analytics and Business Intelligent Platforms
(Microsoft. 2021f).
62
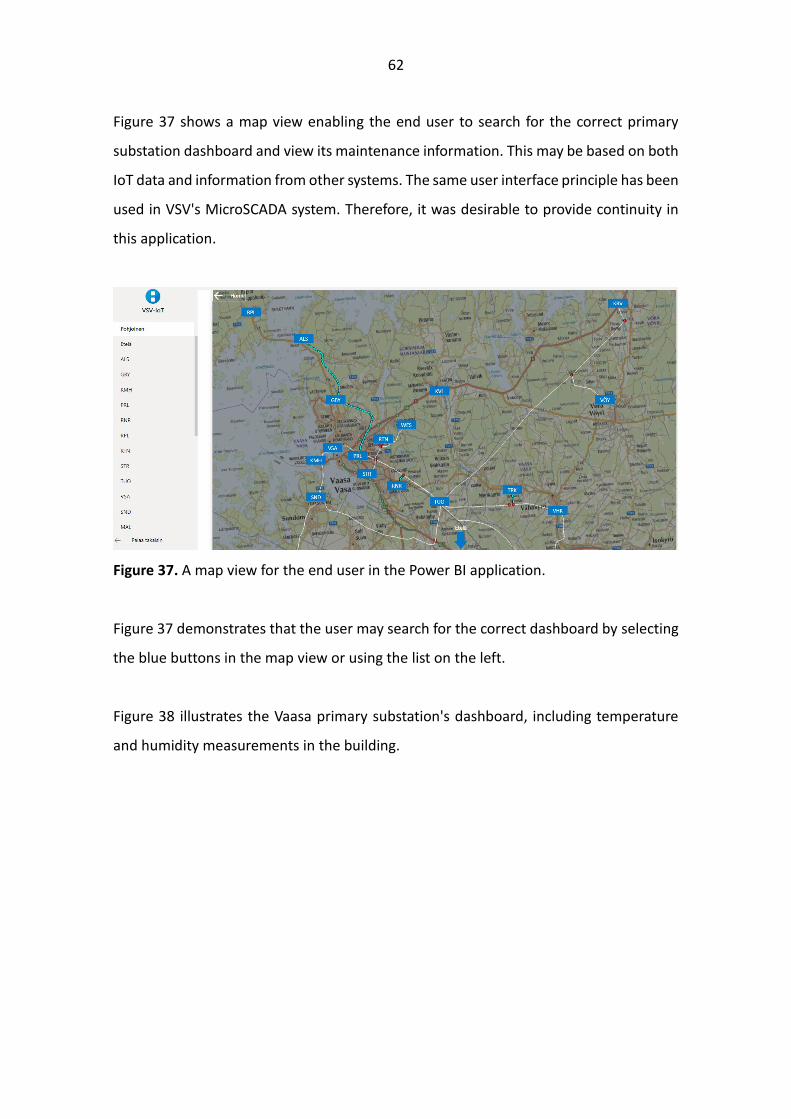
Figure 37 shows a map view enabling the end user to search for the correct primary
substation dashboard and view its maintenance information. This may be based on both
IoT data and information from other systems. The same user interface principle has been
used in VSV's MicroSCADA system. Therefore, it was desirable to provide continuity in
this application.
Figure 37. A map view for the end user in the Power BI application.
Figure 37 demonstrates that the user may search for the correct dashboard by selecting
the blue buttons in the map view or using the list on the left.
Figure 38 illustrates the Vaasa primary substation's dashboard, including temperature
and humidity measurements in the building.

63
Figure 38. The dashboard of the Vaasa substation in the end user application in Power
BI.
Figure 38 shows that the dashboard provides a more detailed location of the primary
substation, in addition to temperature and humidity measurements. The main diagram
button allows the user to view an illustration of the primary substation. It should be
noted that these are examples only. When implementing a system in an entire organiza-
tion, it is vital to design the dashboards collaboratively.
End users are likely to use Power BI in their own computer browsers. However, it is ben-
eficial to build the dashboard so that it may be optimized for smart devices. Figure 39
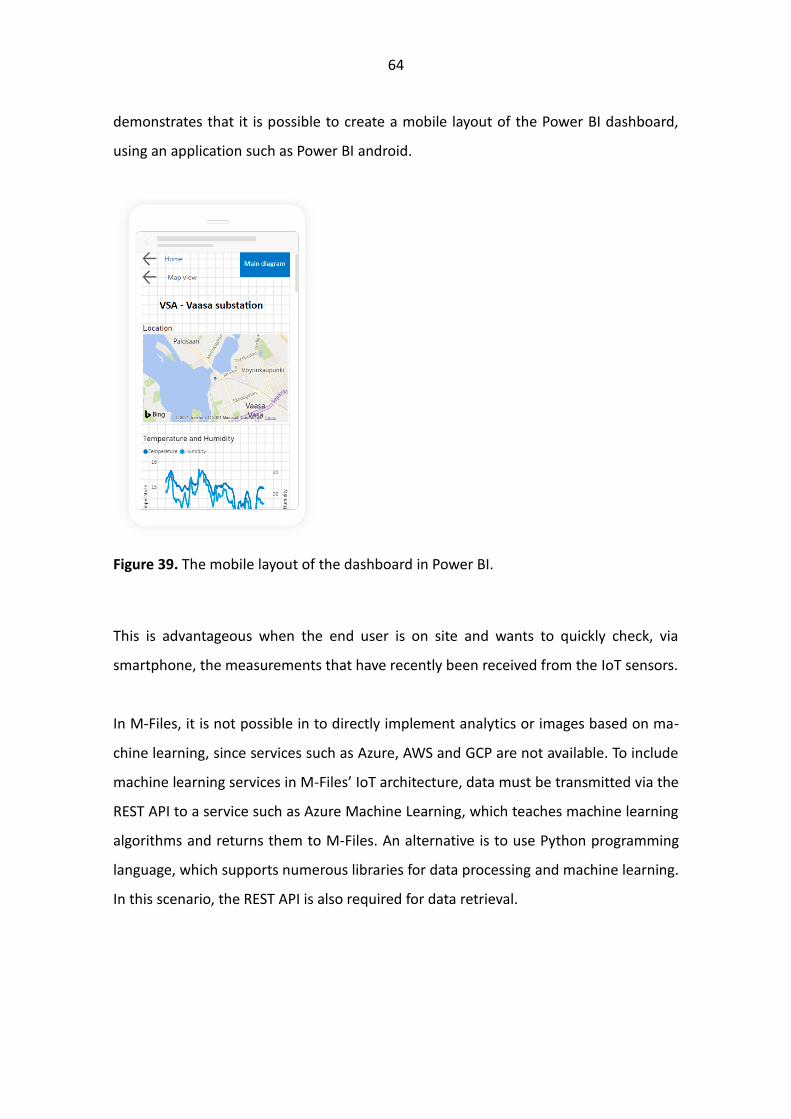
64
demonstrates that it is possible to create a mobile layout of the Power BI dashboard,
using an application such as Power BI android.
Figure 39. The mobile layout of the dashboard in Power BI.
This is advantageous when the end user is on site and wants to quickly check, via
smartphone, the measurements that have recently been received from the IoT sensors.
In M-Files, it is not possible in to directly implement analytics or images based on ma-
chine learning, since services such as Azure, AWS and GCP are not available. To include
machine learning services in M-Files’ IoT architecture, data must be transmitted via the
REST API to a service such as Azure Machine Learning, which teaches machine learning
algorithms and returns them to M-Files. An alternative is to use Python programming
language, which supports numerous libraries for data processing and machine learning.
In this scenario, the REST API is also required for data retrieval.
65
4.1.6 The need for expertise in platform maintenance
Regarding M-Files, VSV is in a good position, since it already has expertise in the use and
development of its system. Coding skills are not required to develop the basics of M-
Files, such as defining a structure and creating simple workflows. Therefore, it is easier
to train in-house experts.
The developer of M-Files, M-Files Corporation, has grown into a large company and will
therefore have support available for system development, such as customizations that
are not possible with basic tools. However, complex customizations should be avoided,
since they are potentially difficult to maintain. Consequently, while the need for skills
does not decrease, there is no immediately requirement to train or acquire more experts.
4.2 IoT-Ticket
IoT-Ticket was acquired for testing in this study through VSV’s IT partner and platform
developer Wapice. IoT-Ticket is a cloud-based platform that is quick to install. Its archi-
tecture is illustrated in Figure 40.
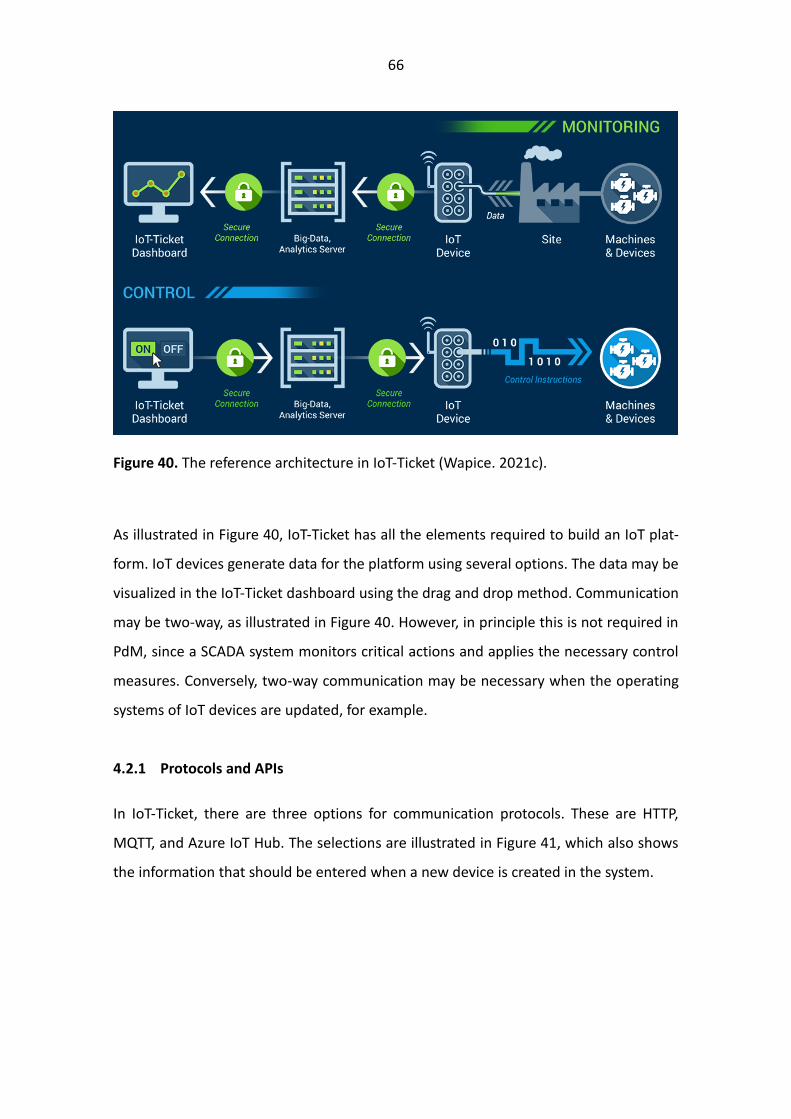
66
Figure 40. The reference architecture in IoT-Ticket (Wapice. 2021c).
As illustrated in Figure 40, IoT-Ticket has all the elements required to build an IoT plat-
form. IoT devices generate data for the platform using several options. The data may be
visualized in the IoT-Ticket dashboard using the drag and drop method. Communication
may be two-way, as illustrated in Figure 40. However, in principle this is not required in
PdM, since a SCADA system monitors critical actions and applies the necessary control
measures. Conversely, two-way communication may be necessary when the operating
systems of IoT devices are updated, for example.
4.2.1 Protocols and APIs
In IoT-Ticket, there are three options for communication protocols. These are HTTP,
MQTT, and Azure IoT Hub. The selections are illustrated in Figure 41, which also shows
the information that should be entered when a new device is created in the system.

67
Figure 41. Communication methods for IoT device in IoT-Ticket.
Based on Figure 41, IoT-Ticket supports the two most important protocols (MQTT, and
HTTP based REST API) for IoT systems, as defined by Ullah et al. (2020). It is also possible
to build communication between the platform and the IoT devices via Azure IoT Hub.
This allows an organization to benefit from the features in both platforms. Azure IoT Hub
is discussed in more detail in Section 4.3.
To use the protocols described above, the platform must have an API or SDK. IoT-Ticket
has REST Clients, which are listed as follows (Wapice. 2021b):
- C# REST Client
- Java REST Client
- Linux C++ Client
- Python Client
- Qt Client
In this study, IoT-Ticket’s REST API was tested in Node-RED (Figure 26) as well as using
the Python requests libraries.
In early 2021, Wapice and HiQ announced that they have jointly produced a library that
allows the FRENDS integration platform to be seamlessly connected to IoT-TICKET, as a
new data source. This enables efficient and fast integration of IoT-Ticket and other busi-
ness systems (Wapice. 2021b). This is significant for VSV, as they have used FRENDS since
2020.
68
4.2.2 Scalability and flexibility
IoT-Ticket may be used in Wapice's private cloud or in commercial storage such as Azure,
AWS or IBM Softlayer. As a cloud-based service, its scalability and flexibility are evident,
since data storage capacity may be readily increased in remote storage (Wapice. 2021a).
The previous chapter introduced the protocol and API options in IoT-Ticket. Based on
their number, it is apparent that IoT-Ticket readily adapts to numerous operating envi-
ronments and situations.
4.2.3 Pricing model
Wapice is offering IoT ticket as a pilot project in which an IoT application is implemented
for the customer's needs, including all stages from data acquisition to visualization and
user interface. This gives the customer an idea of the platform’s operation. However, a
long-term contract is not signed at this stage (Wapice. 2019).
If the customer wants to continue with the application in question for production use,
then the costs consist of a fixed annual cost of using the platform, an annual cost based
on the number of connected IoT-devices, and a developer license cost per piece. (Wapice.
2019)
Additional platform features, such as Big Data Analytics, are ordered separately and were
not tested in the practical part of this study (Wapice. 2019).
In the pricing model presented above, it is assumed that the application runs in Wapice’s
own cloud. The pricing model must be negotiated on a case-by-case basis if the customer
requires an alternative solution, such as IoT-Ticket operating in Azure.

69
4.2.4 Security
Wapice (2021d) lists authentication among the main security functions on its platform.
The authentication server may be integrated with the customer's own authentication
services, such as Azure AD with Multi-factor Authentication (MFA). In addition, access
controls may be set on a group basis so that end users and developers have different
permissions. Database security has been considered by separating relational and time
series data into separate systems.
As previously noted, device-to-cloud communication may be implemented using the
REST API, which uses the Basic Authentication method. If the MQTT protocol is used,
devices are identified by digital certificates. In both cases, communication is encrypted
with SSL.
IoT-Ticket automatically performs security inspections and like Wapice, operates in ac-
cordance with the ISO 27001 security management system. Both have internal and ex-
ternal audits related to system security issues.
A beneficial feature of IoT-Ticket is a function that sends an update package to the de-
vice, enabling it to start the update process. This function is demonstrated in Figure 42.

70
Figure 42. An IoT device software update received via IoT-Ticket.
The upgraded device is ultimately responsible for ensuring the update process is per-
formed correctly. The update process may also be monitored in IoT-Ticket, provided the
required status information is imported from the device to IoT-Ticket for inspection.
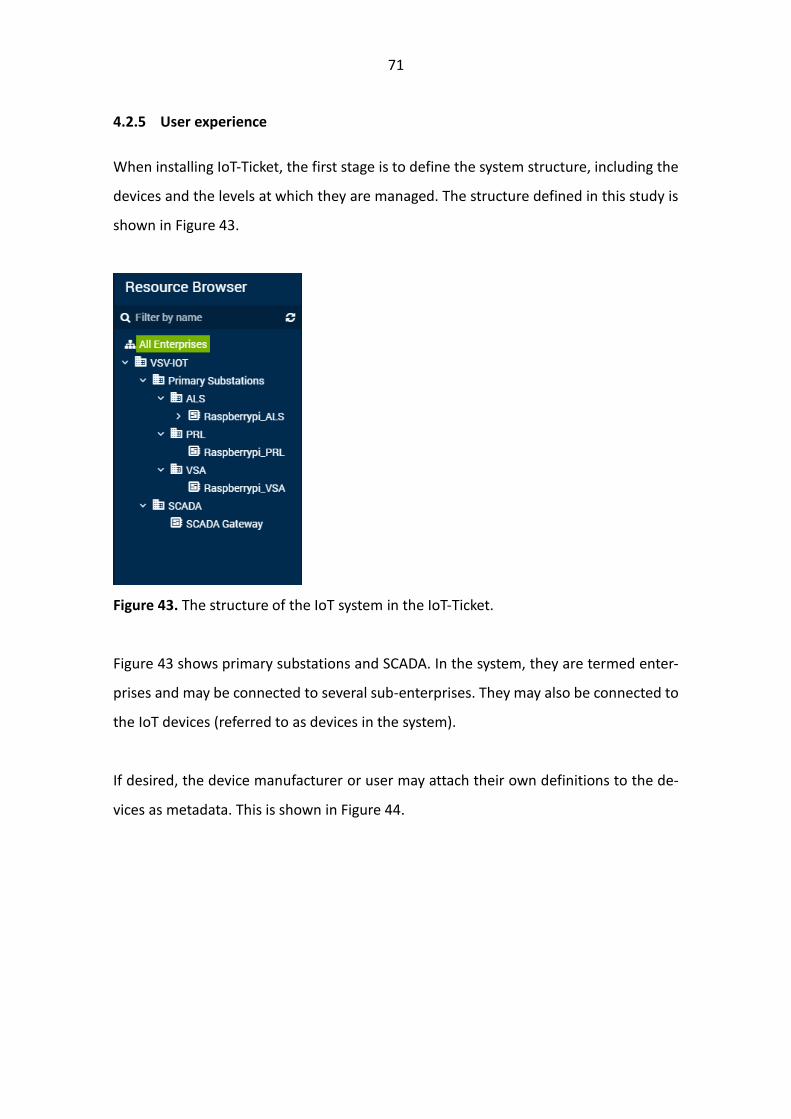
71
4.2.5 User experience
When installing IoT-Ticket, the first stage is to define the system structure, including the
devices and the levels at which they are managed. The structure defined in this study is
shown in Figure 43.
Figure 43. The structure of the IoT system in the IoT-Ticket.
Figure 43 shows primary substations and SCADA. In the system, they are termed enter-
prises and may be connected to several sub-enterprises. They may also be connected to
the IoT devices (referred to as devices in the system).
If desired, the device manufacturer or user may attach their own definitions to the de-
vices as metadata. This is shown in Figure 44.
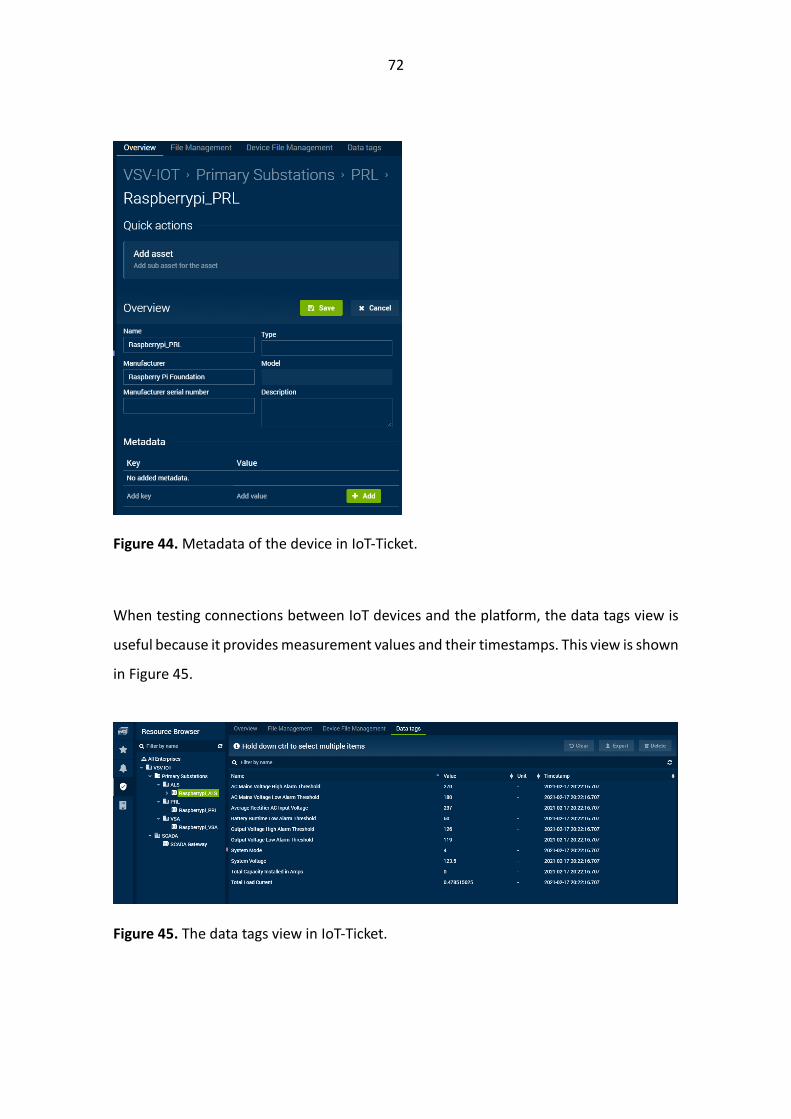
72
Figure 44. Metadata of the device in IoT-Ticket.
When testing connections between IoT devices and the platform, the data tags view is
useful because it provides measurement values and their timestamps. This view is shown
in Figure 45.
Figure 45. The data tags view in IoT-Ticket.

73
Comparable to Power BI, IoT-Ticket has numerous options for creating images to assist
the end user in decision-making. Figure 4 shows that a map view similar to the one cre-
ated in Power BI may be generated in IoT-Ticket (see Figure 37).
Figure 46. The map view in the IoT-Ticket dashboard.
Figure 47 shows that a similar substation-specific dashboard may also be created as in
Power BI (see Figure 38).
Figure 47. The dashboard of the Purola substation in IoT-Ticket.
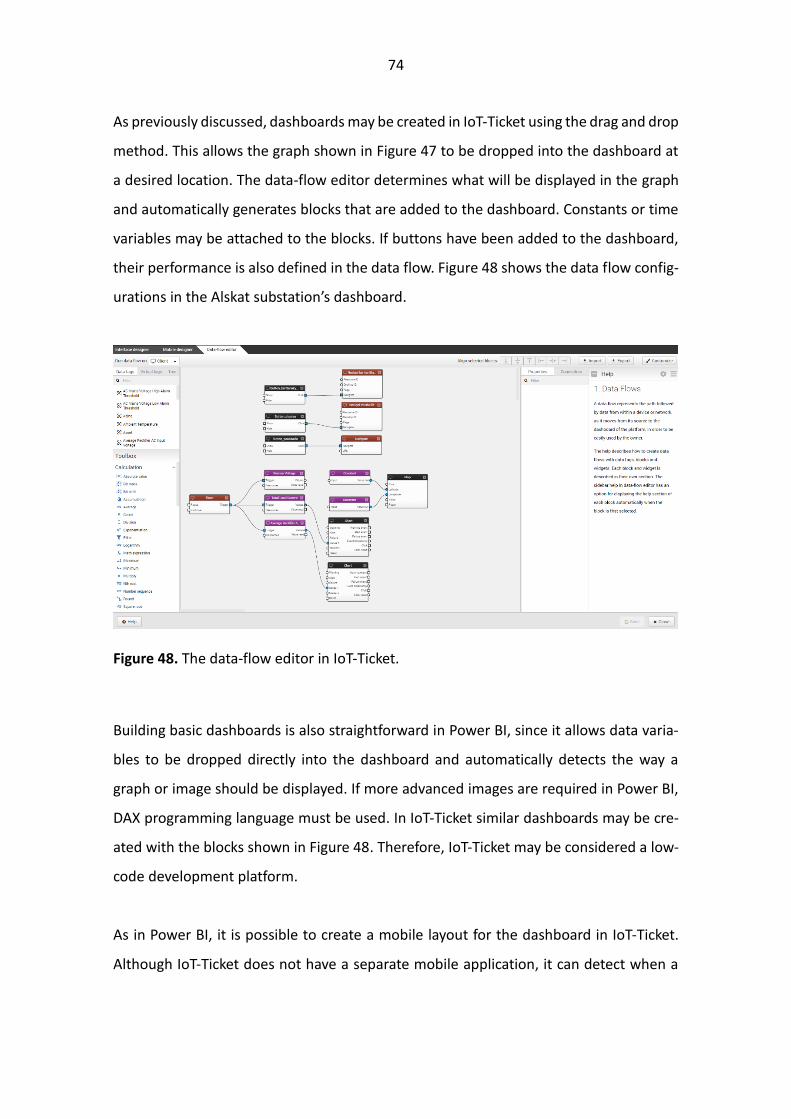
74
As previously discussed, dashboards may be created in IoT-Ticket using the drag and drop
method. This allows the graph shown in Figure 47 to be dropped into the dashboard at
a desired location. The data-flow editor determines what will be displayed in the graph
and automatically generates blocks that are added to the dashboard. Constants or time
variables may be attached to the blocks. If buttons have been added to the dashboard,
their performance is also defined in the data flow. Figure 48 shows the data flow config-
urations in the Alskat substation’s dashboard.
Figure 48. The data-flow editor in IoT-Ticket.
Building basic dashboards is also straightforward in Power BI, since it allows data varia-
bles to be dropped directly into the dashboard and automatically detects the way a
graph or image should be displayed. If more advanced images are required in Power BI,
DAX programming language must be used. In IoT-Ticket similar dashboards may be cre-
ated with the blocks shown in Figure 48. Therefore, IoT-Ticket may be considered a low-
code development platform.
As in Power BI, it is possible to create a mobile layout for the dashboard in IoT-Ticket.
Although IoT-Ticket does not have a separate mobile application, it can detect when a
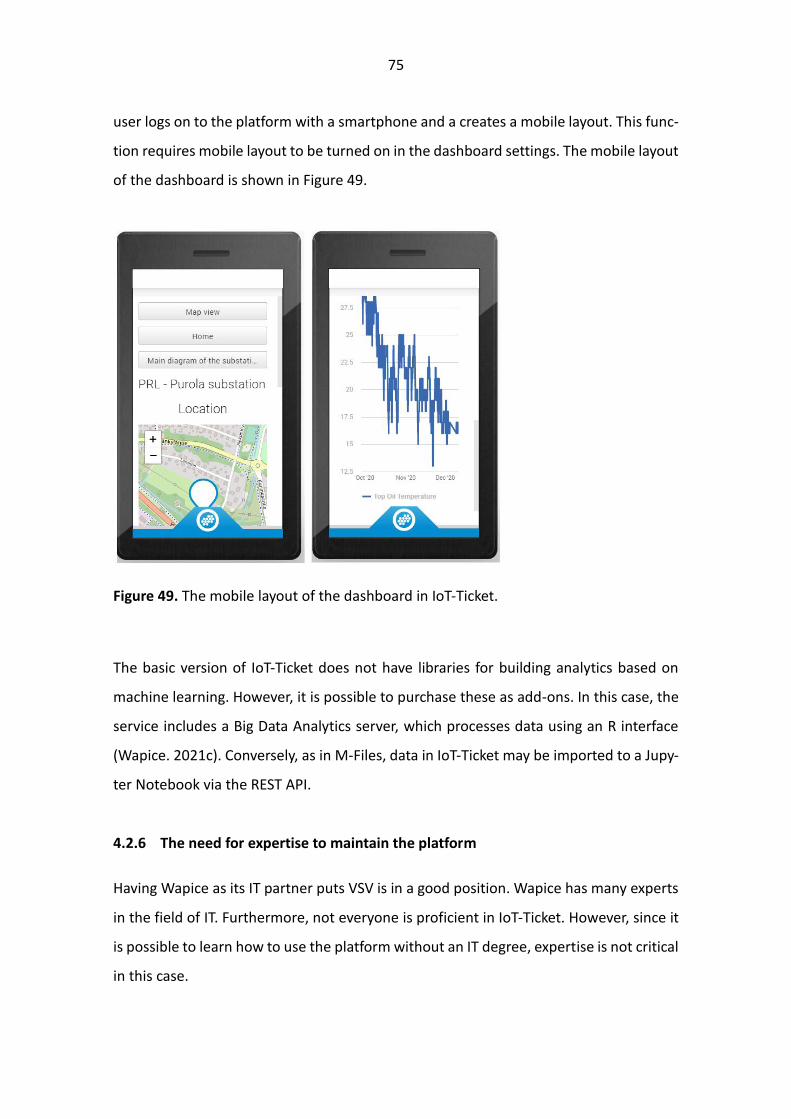
75
user logs on to the platform with a smartphone and a creates a mobile layout. This func-
tion requires mobile layout to be turned on in the dashboard settings. The mobile layout
of the dashboard is shown in Figure 49.
Figure 49. The mobile layout of the dashboard in IoT-Ticket.
The basic version of IoT-Ticket does not have libraries for building analytics based on
machine learning. However, it is possible to purchase these as add-ons. In this case, the
service includes a Big Data Analytics server, which processes data using an R interface
(Wapice. 2021c). Conversely, as in M-Files, data in IoT-Ticket may be imported to a Jupy-
ter Notebook via the REST API.
4.2.6 The need for expertise to maintain the platform
Having Wapice as its IT partner puts VSV is in a good position. Wapice has many experts
in the field of IT. Furthermore, not everyone is proficient in IoT-Ticket. However, since it
is possible to learn how to use the platform without an IT degree, expertise is not critical
in this case.

76
4.3 Azure, AWS and GCP
Since these cloud-based platforms have similar features, they are discussed in the same
section. These platforms operate on the principle that the entire cloud portfolio is avail-
able through the same username. They all have distinct applications and tools for differ-
ent uses, and each has its own unique IoT architecture. Azure's version is shown in Figure
50.
Figure 50. The IoT reference architecture in Azure (Microsoft. 2021c).
In Azure, the IoT Hub connects devices to other services running on the platform. The
IoT Hub offers communication protocols and comprehensive device management. IoT
Hub does not automatically store data, which must be routed to data warehouses or
directly to Power BI, via the Stream Analytics service.
The IoT architecture of AWS is shown in Figure 51.
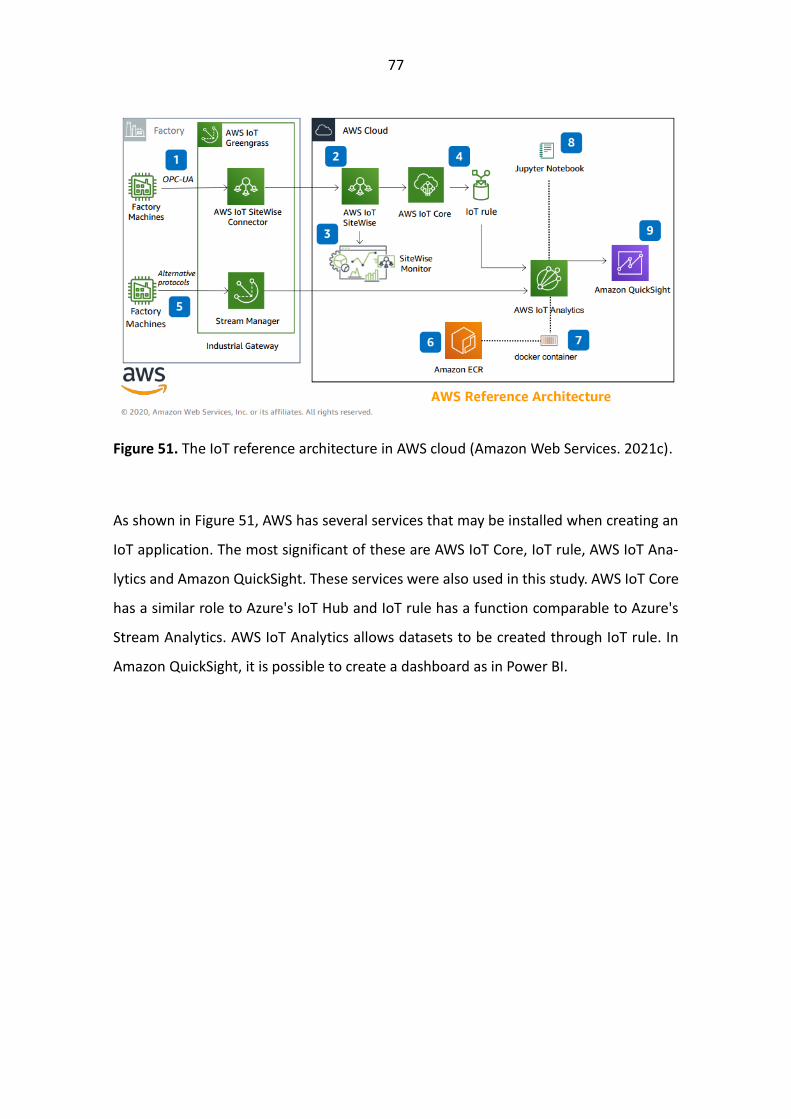
77
Figure 51. The IoT reference architecture in AWS cloud (Amazon Web Services. 2021c).
As shown in Figure 51, AWS has several services that may be installed when creating an
IoT application. The most significant of these are AWS IoT Core, IoT rule, AWS IoT Ana-
lytics and Amazon QuickSight. These services were also used in this study. AWS IoT Core
has a similar role to Azure's IoT Hub and IoT rule has a function comparable to Azure's
Stream Analytics. AWS IoT Analytics allows datasets to be created through IoT rule. In
Amazon QuickSight, it is possible to create a dashboard as in Power BI.
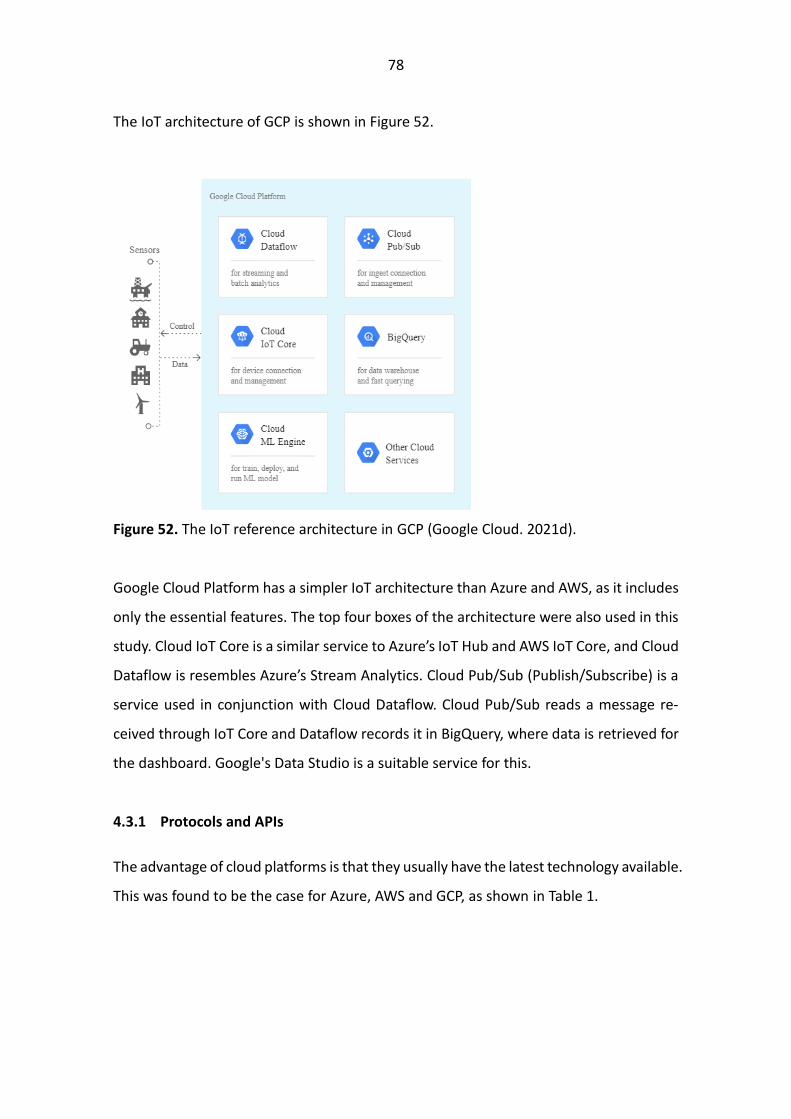
78
The IoT architecture of GCP is shown in Figure 52.
Figure 52. The IoT reference architecture in GCP (Google Cloud. 2021d).
Google Cloud Platform has a simpler IoT architecture than Azure and AWS, as it includes
only the essential features. The top four boxes of the architecture were also used in this
study. Cloud IoT Core is a similar service to Azure’s IoT Hub and AWS IoT Core, and Cloud
Dataflow is resembles Azure’s Stream Analytics. Cloud Pub/Sub (Publish/Subscribe) is a
service used in conjunction with Cloud Dataflow. Cloud Pub/Sub reads a message re-
ceived through IoT Core and Dataflow records it in BigQuery, where data is retrieved for
the dashboard. Google's Data Studio is a suitable service for this.
4.3.1 Protocols and APIs
The advantage of cloud platforms is that they usually have the latest technology available.
This was found to be the case for Azure, AWS and GCP, as shown in Table 1.
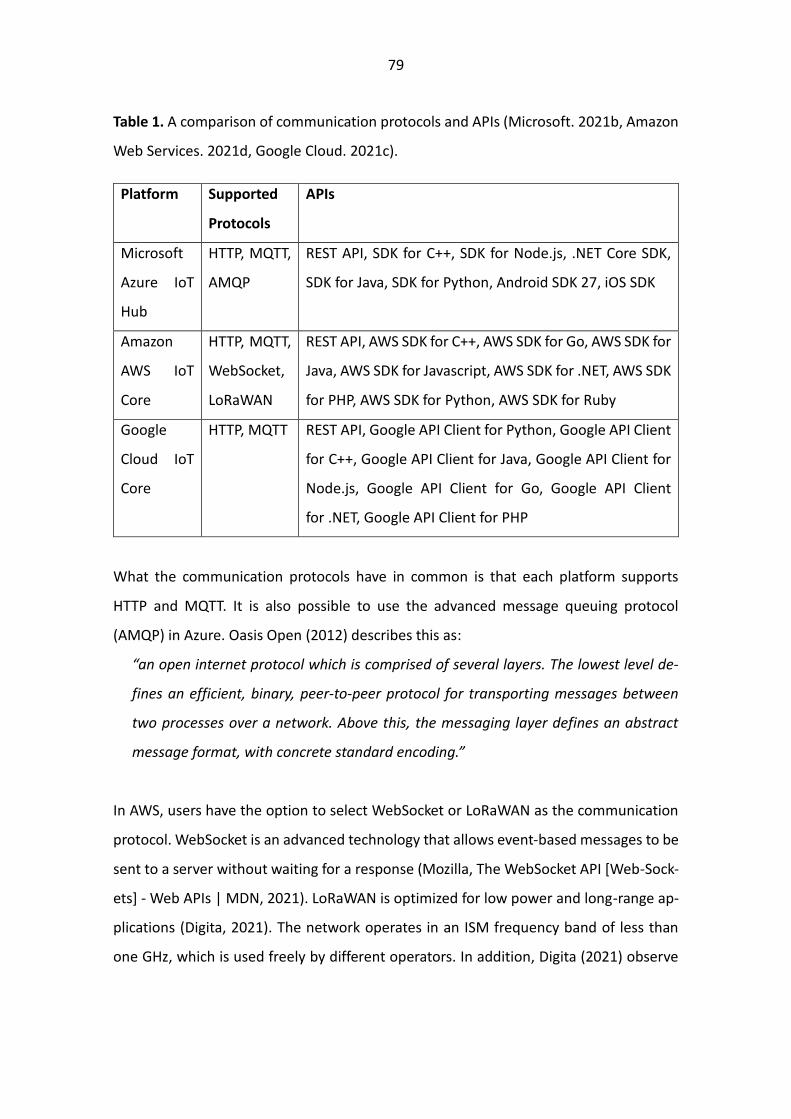
79
Table 1. A comparison of communication protocols and APIs (Microsoft. 2021b, Amazon
Web Services. 2021d, Google Cloud. 2021c).
Platform Supported
Protocols
APIs
Microsoft
Azure IoT
Hub
HTTP, MQTT,
AMQP
REST API, SDK for C++, SDK for Node.js, .NET Core SDK,
SDK for Java, SDK for Python, Android SDK 27, iOS SDK
Amazon
AWS IoT
Core
HTTP, MQTT,
WebSocket,
LoRaWAN
REST API, AWS SDK for C++, AWS SDK for Go, AWS SDK for
Java, AWS SDK for Javascript, AWS SDK for .NET, AWS SDK
for PHP, AWS SDK for Python, AWS SDK for Ruby
Cloud IoT
Core
HTTP, MQTT REST API, Google API Client for Python, Google API Client
for C++, Google API Client for Java, Google API Client for
Node.js, Google API Client for Go, Google API Client
for .NET, Google API Client for PHP
What the communication protocols have in common is that each platform supports
HTTP and MQTT. It is also possible to use the advanced message queuing protocol
(AMQP) in Azure. Oasis Open (2012) describes this as:
“an open internet protocol which is comprised of several layers. The lowest level de-
fines an efficient, binary, peer-to-peer protocol for transporting messages between
two processes over a network. Above this, the messaging layer defines an abstract
message format, with concrete standard encoding.”
In AWS, users have the option to select WebSocket or LoRaWAN as the communication
protocol. WebSocket is an advanced technology that allows event-based messages to be
sent to a server without waiting for a response (Mozilla, The WebSocket API [Web-Sock-
ets] - Web APIs | MDN, 2021). LoRaWAN is optimized for low power and long-range ap-
plications (Digita, 2021). The network operates in an ISM frequency band of less than
one GHz, which is used freely by different operators. In addition, Digita (2021) observe
80
that the LoRaWAN protocol allows data to be transmitted only when necessary. This pro-
motes the battery life of the sensors.
As Table 1 shows, all the platforms support the REST API, and several SDKs have been
developed for them in different programming languages.
Based on these findings, it may be concluded that these platforms offer several different
perspectives on the development of IoT applications.
4.3.2 Scalability and flexibility
As previously discussed, credit card information may be entered into the three cloud
services considered in this subsection. All services are subsequently available on a pay-
as-you-go basis. The number of devices or messages is not technically limited on plat-
forms. As the IoT system grows, however, organizations can increase capacity by moving
to the next charge level. Alternatively, the platform may bill the organization for the
number of messages.
From Table 1, it is also evident that each platform has several methods of generating
information for platforms through IoT devices and other systems. The scalability and
flexibility of these platforms is readily apparent and has been observed in several studies
(Agarwal & Alam 2018, Fridelin Panduman et al. 2019 and Pierleoni et al. 2020).
4.3.3 Pricing model
Each platform has its own calculator that could estimate the costs incurred when using
their cloud services. However, as noted, this study does not provide exact prices but
what factors make up the costs.
The initial cost with Azure, is the IoT Hub, which can be selected as a basic or standard
model. Since the basic version has a narrower range of features, services such as Device
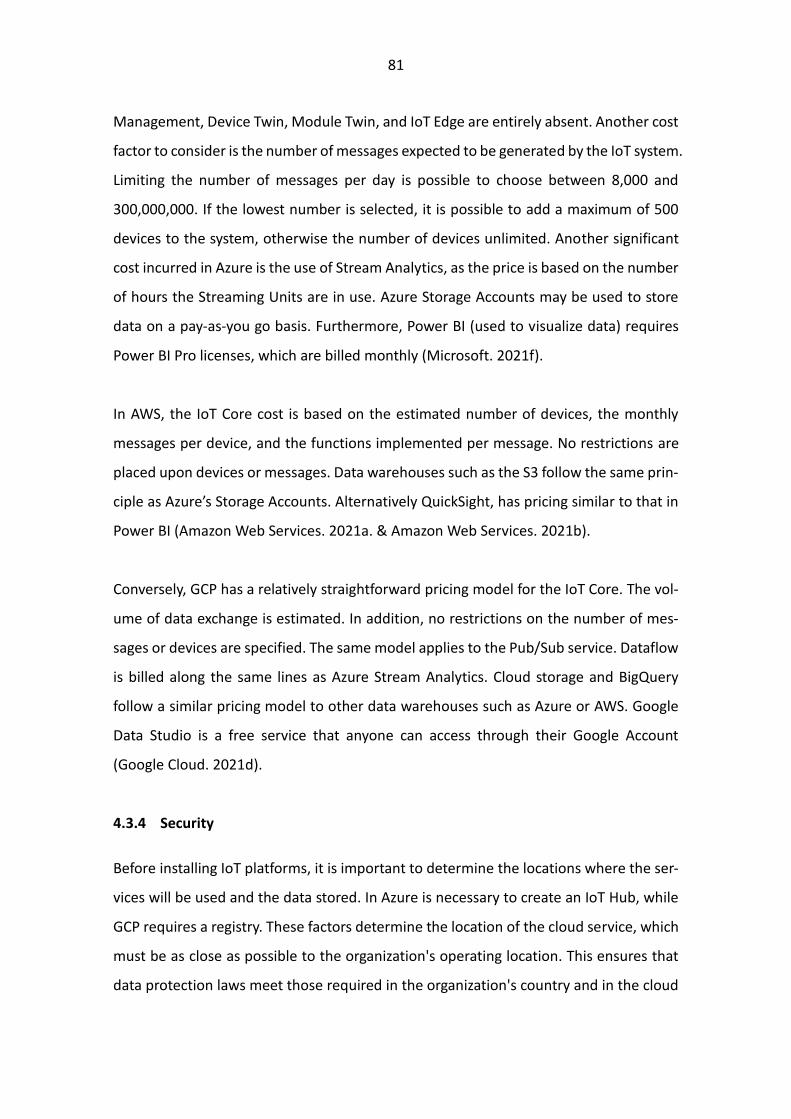
81
Management, Device Twin, Module Twin, and IoT Edge are entirely absent. Another cost
factor to consider is the number of messages expected to be generated by the IoT system.
Limiting the number of messages per day is possible to choose between 8,000 and
300,000,000. If the lowest number is selected, it is possible to add a maximum of 500
devices to the system, otherwise the number of devices unlimited. Another significant
cost incurred in Azure is the use of Stream Analytics, as the price is based on the number
of hours the Streaming Units are in use. Azure Storage Accounts may be used to store
data on a pay-as-you go basis. Furthermore, Power BI (used to visualize data) requires
Power BI Pro licenses, which are billed monthly (Microsoft. 2021f).
In AWS, the IoT Core cost is based on the estimated number of devices, the monthly
messages per device, and the functions implemented per message. No restrictions are
placed upon devices or messages. Data warehouses such as the S3 follow the same prin-
ciple as Azure’s Storage Accounts. Alternatively QuickSight, has pricing similar to that in
Power BI (Amazon Web Services. 2021a. & Amazon Web Services. 2021b).
Conversely, GCP has a relatively straightforward pricing model for the IoT Core. The vol-
ume of data exchange is estimated. In addition, no restrictions on the number of mes-
sages or devices are specified. The same model applies to the Pub/Sub service. Dataflow
is billed along the same lines as Azure Stream Analytics. Cloud storage and BigQuery
follow a similar pricing model to other data warehouses such as Azure or AWS. Google
Data Studio is a free service that anyone can access through their Google Account
(Google Cloud. 2021d).
4.3.4 Security
Before installing IoT platforms, it is important to determine the locations where the ser-
vices will be used and the data stored. In Azure is necessary to create an IoT Hub, while
GCP requires a registry. These factors determine the location of the cloud service, which
must be as close as possible to the organization's operating location. This ensures that
data protection laws meet those required in the organization's country and in the cloud

82
service. In AWS, this selection is made when the first devices are put into operation. The
desired location is selected the from the drop-down menu as shown in Figure 53 (Ama-
zon Web Services. 2021d, Microsoft. 2021b, Google Cloud. 2021c).
Figure 53. Location selection of the cloud service in AWS.
Yu et al. (2019) have made a thorough comparison of the security features in IoT plat-
forms. Their findings for Azure, AWS, and GCP are summarized in the Table 2.

83
Table 2. A comparison of Azure, AWS and GCP security elements (Yu et al. 2019).
According to Microsoft (2021b), Amazon Web Services (2021d) and Google Cloud (2021b)
Table 2 still largely applies. One change that has been previously noted in this study is
that AWS have replaced CoAP with LoRaWAN technology.
It is evident from Table 2 that these platforms have comparable security features. Yu et
al. (2019) commend these platforms on their extensive safety measures, which they at-
tribute to the fact that large organizations strive to accommodate the greatest potential
consumer base to maximize business growth. Azure, AWS and GCP have undoubtedly
succeeded in this regard.

84
4.3.5 User experience
In each platform, the home view lists the available services and shows additional facili-
ties. In GCP, analytics have been brought to the home view, enabling the user to imme-
diately see, for example, the billing situation and how actively the APIs have been used.
The home views of all three platforms are shown in Figures 54-56.
Figure 54. The home view in Azure.
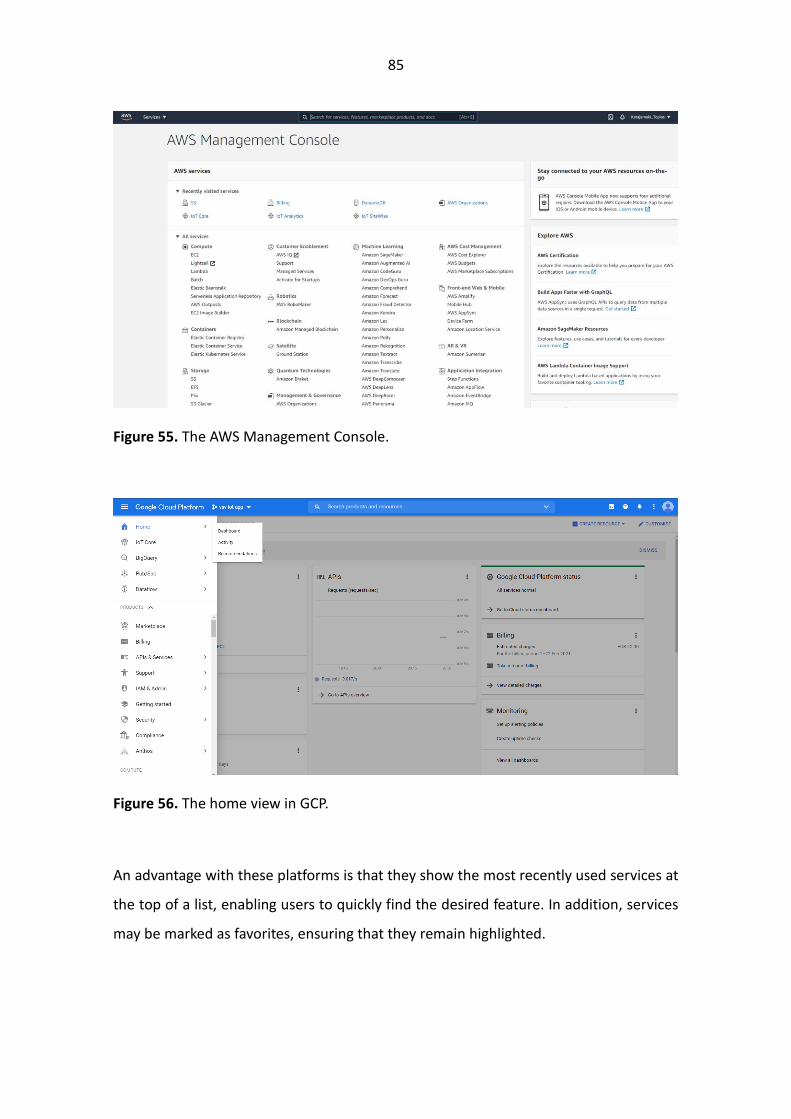
85
Figure 55. The AWS Management Console.
Figure 56. The home view in GCP.
An advantage with these platforms is that they show the most recently used services at
the top of a list, enabling users to quickly find the desired feature. In addition, services
may be marked as favorites, ensuring that they remain highlighted.

86
In Azure and GCP, it is not possible to create a device hierarchy as in IoT-Ticket. However,
AWS allows devices to be categorized into a Things group or Billing group. This may help
developers better understand the system architecture at the backend of the application.
Device management examples of platforms are shown in Figures 57-59.
Figure 57. IoT devices in Azure IoT Hub.

87
Figure 58. IoT devices in AWS IoT Core.
Figure 59. IoT devices in Google Cloud IoT Core.
As shown in Figures 57-59, GCP has the simplest view in Device Manager. In particular,
the selections in the sidebar are more abundant in Azure and AWS. This may be benefi-
cial to an extent, since they are all in one place. Conversely, in Azure, sometimes there
may be a situation where some definable thing on the platform is not very easy to find.
Message processing in Azure Stream Analytics is shown in Figure 60 and the rules section
of AWS is shown in Figure 61
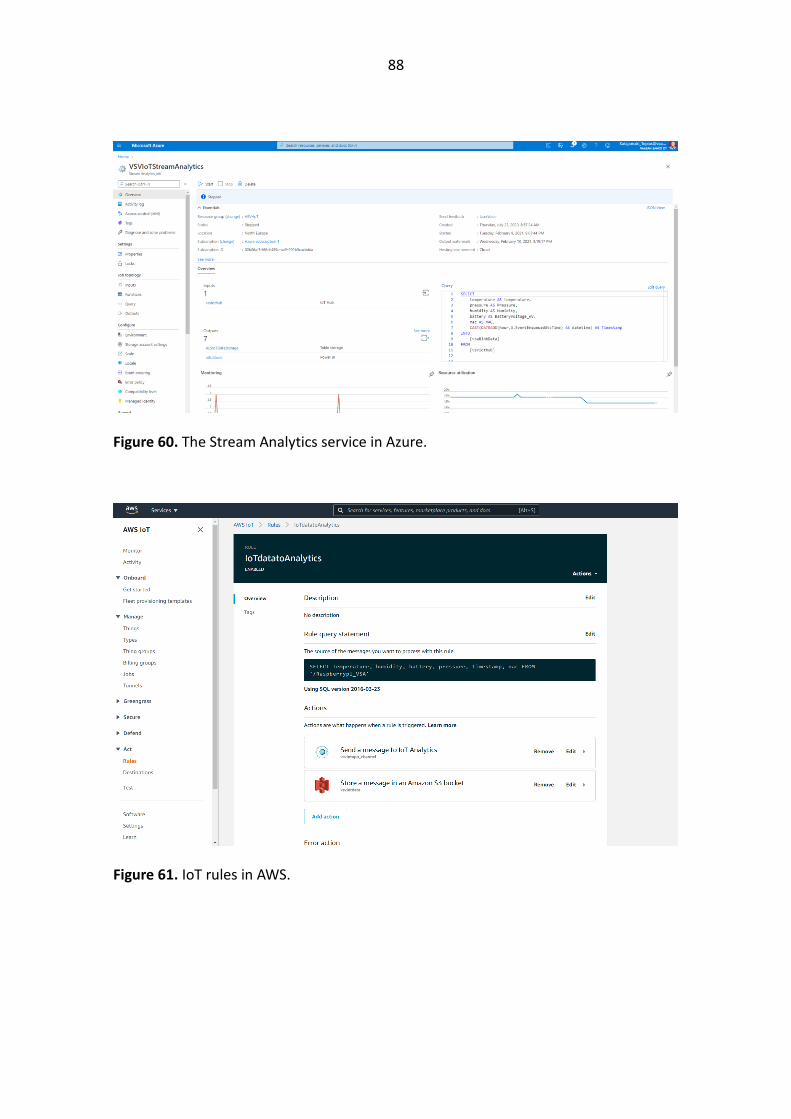
88
Figure 60. The Stream Analytics service in Azure.
Figure 61. IoT rules in AWS.

89
Figures 60 and 61 show that to read a message, it must be defined in SQL programming
language. In Azure, the read and write location is defined by the FROM and INTO state-
ments. In AWS, the message write location is identified using functions in the user inter-
face.
When a registry is created in GCP (to which the devices also connect) a topic must also
be defined. This is followed by the Pub/Sub service, where the topic may be exported to
BigQuery or Cloud Storage using Dataflow. These features are shown in Figures 62 and
63.
Figure 62. Device events in GCP’s Pub/Sub service.
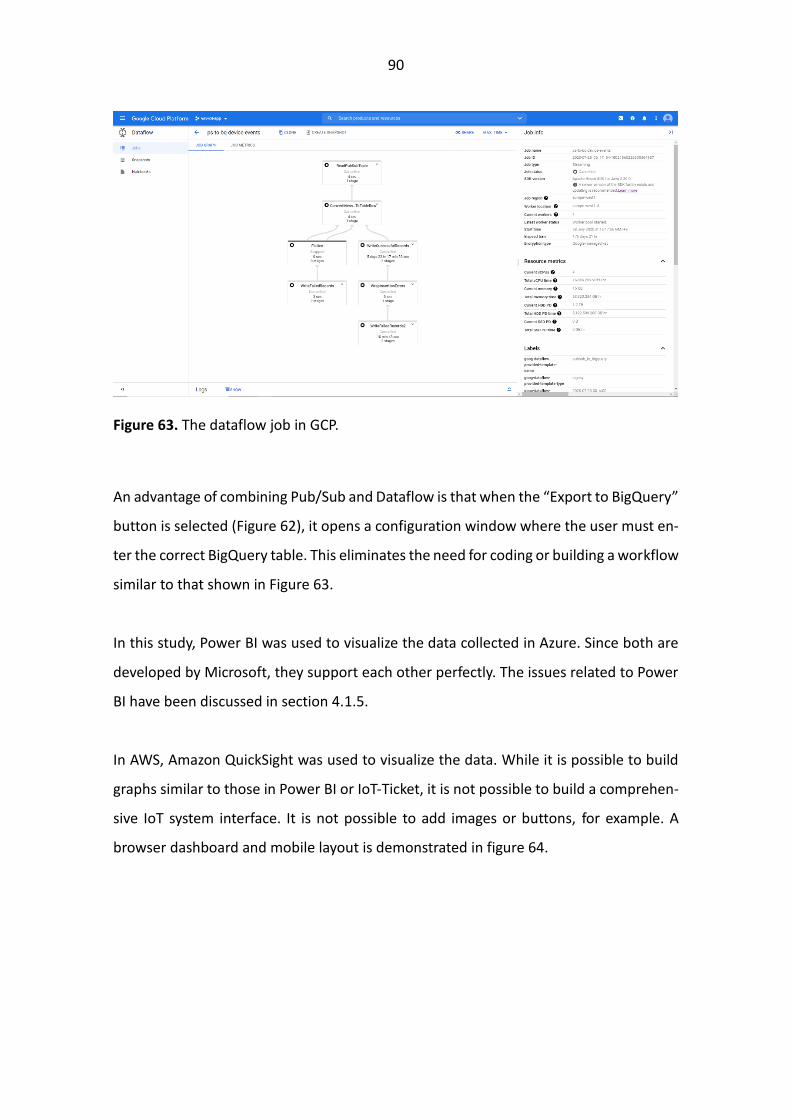
90
Figure 63. The dataflow job in GCP.
An advantage of combining Pub/Sub and Dataflow is that when the “Export to BigQuery”
button is selected (Figure 62), it opens a configuration window where the user must en-
ter the correct BigQuery table. This eliminates the need for coding or building a workflow
similar to that shown in Figure 63.
In this study, Power BI was used to visualize the data collected in Azure. Since both are
developed by Microsoft, they support each other perfectly. The issues related to Power
BI have been discussed in section 4.1.5.
In AWS, Amazon QuickSight was used to visualize the data. While it is possible to build
graphs similar to those in Power BI or IoT-Ticket, it is not possible to build a comprehen-
sive IoT system interface. It is not possible to add images or buttons, for example. A
browser dashboard and mobile layout is demonstrated in figure 64.
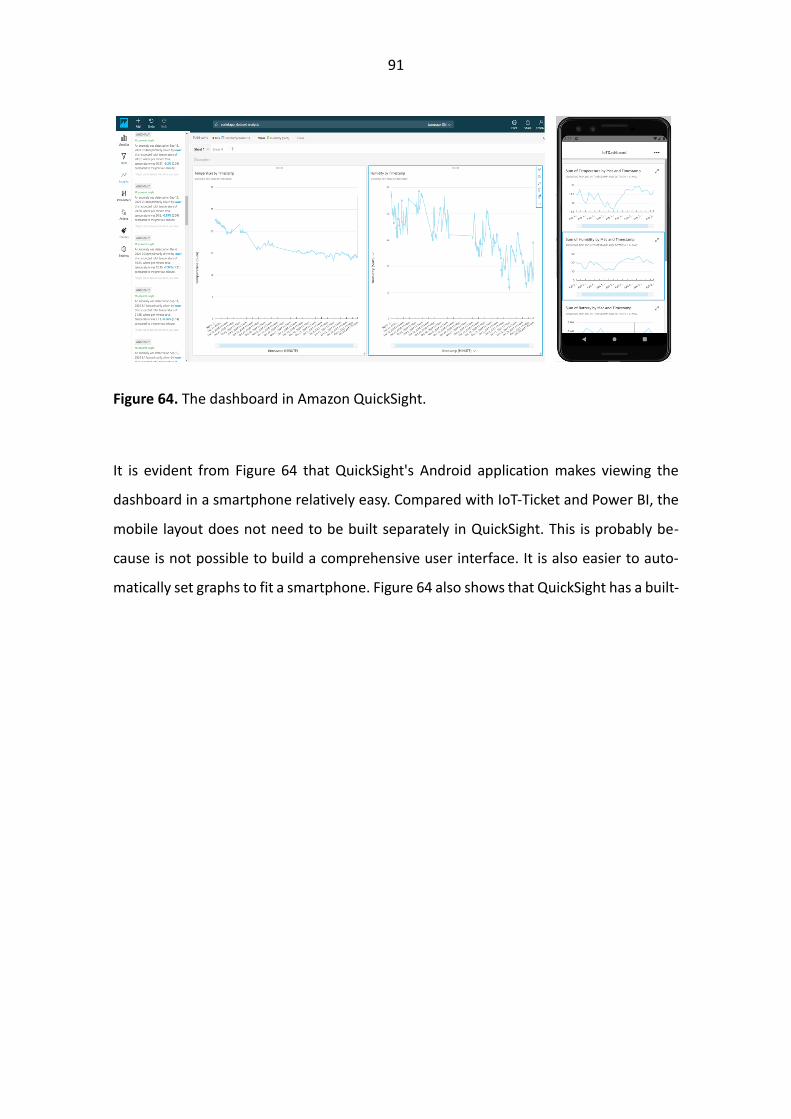
91
Figure 64. The dashboard in Amazon QuickSight.
It is evident from Figure 64 that QuickSight's Android application makes viewing the
dashboard in a smartphone relatively easy. Compared with IoT-Ticket and Power BI, the
mobile layout does not need to be built separately in QuickSight. This is probably be-
cause is not possible to build a comprehensive user interface. It is also easier to auto-
matically set graphs to fit a smartphone. Figure 64 also shows that QuickSight has a built-

92
in anomaly detection based on machine learning. It can therefore monitor measure-
ments that typically reach the platform and list any deviations for the user to inspect. If
the notification is selected, it will filter the correct point on the graph.
Conversely, Google Data Studio is able to build a similar interface to IoT-Ticket or Power
BI. Since there are no separate buttons for the interface, navigation links must be em-
bedded in the text entered in the boxes. The map view in Google Data Studio is shown
in Figure 65.
Figure 65. The map view in the Google Datastudio dashboard.
In Figure 66, the dashboard demonstrates an image based on SCADA Historian data. The
example shows battery voltage measurements in a remote-controlled secondary substa-
tion.

93
Figure 66. The image related to data from SCADA Historian shown in Google Data Studio.
In Google Data Studio, creating a mobile layout is more challenging, because the dash-
board must be set to the desired dimensions. If the dashboard is set for a computer
browser, for example, it will not possible to adapt if for mobile use. One way to over-
come this problem is to create a second dashboard using the same data, but with each
image and page individually set to fit the mobile device. However, elements will remain
in the dashboard that are difficult to view on a smartphone screen.
In Figure 50, Azure highlights machine learning opportunities in the IoT architecture. Az-
ure machine learning is a drag and drop facility that enables users to import their own
datasets from other Azure services. In addition to the drag and drop method, machine
learning algorithms may be built and trained in Jupyter Notebook, which runs on Azure’s
own server (Microsoft. 2021d).
As shown in Figure 51 the datasets from IoT Analytics may be connected directly to a
Jupyter Notebook running on an AWS server. In addition, AWS has at least 12 different
services related to machine learning (Amazon Web Services. 2021e).
Figure 52 shows that machine learning services have also been highlighted in the IoT
architecture of GCP. Google refers to its entire artificial intelligence and machine learning

94
services as the AI Platform. In GCP options, it is also possible to train machine learning
algorithms in Google's cloud-based Jupyter Notebook. In addition, the AI Platform has
at least seven additional services related to artificial intelligence and machine learning
(Google Cloud. 2021a).
4.3.6 The need for expertise in platform maintenance
The IoT application provides numerous instructions for implementing, maintaining and
using these platforms. Nevertheless, developers must become familiar with the subject
and continuously develop the platform to preserve knowledge and promote greater
awareness of the updates that will be published. Compared to IoT-Ticket, for example,
these three platforms are clearly more complicated to manage, since there are so many
service options and implementations.
If VSV selects one of these three platforms for its IoT application, an added advantage is
that there are many potential developer partners in Finland. The table below shows the
number of potential partners per platform. These search results are based on the Ite wiki
database, and the search was performed by selecting “IoT” and the name of each plat-
form as keywords.
Table 3. The number of potential developer partners by platform in Finland (Ite Wiki.
2021).
Platform Number of potential developer partners
Azure 87
AWS 98
GCP 85
Based on the above discussion, continually developing these platforms is unlikely to be
successful as designers aim to develop the system alongside other work. Therefore, a
95
more effective solution may be to find a suitable partner who can help maintenance
experts make the most of the IoT system.

96
5 Discussion of Comparison Results
The results of this study demonstrate that it is possible to install of IoT technology on
significantly different platforms. It may also be observed that, IoT technology is already
sufficiently developed for organizations to benefit from it in their business. The purpose
of this study was to map and test different IoT platforms using practical implementations.
The five platforms selected for testing all have advantages and disadvantages. M-Files
was the IoT platform with the most questions remaining. IoT-Ticket appeared to be the
easiest option for installation and end use. Moreover, platform development training
may be successful for people lack an in-depth knowledge of IT systems. If an organization
were to choose Azure, AWS, or GCP as its IoT platform, it would be advisable for the
organization to have IT staff with expertise in these platforms. Alternative, organizations
would need to find reliable partners to develop the platforms with end users.
M-Files was the only platform in the study that works according to the On-Premises
model. It is also available in a cloud version. Examining the features of the study’s four
cloud-based platforms, it was easy to identify with Collin and Saarelainen (2016) who
observe that the main advantages of the cloud are highly affordable storage and auto-
matic scaling for data streams of up to millions of devices.
In line with other studies (e.g., Ullah et al. 2020, Guth et al. 2016, Pierleoni et al. 2020
and Yu, J.-Y., & Kim, Y.-G. 2019) it was observed that Azure, AWS, and GCP supported key
protocols and had most of the APIs necessary to build a platform that receives infor-
mation from sensors and other business systems. It is also noteworthy that these con-
nections may be built relatively securely. Furthermore, the study found that IoT-Ticket
performs well in these aspects, alongside the major platforms.
Ullah et al. (2020) concluded in their study that the pricing model in Azure and AWS is
poor. Based on this study, it may be concluded that in Azure and AWS, potential costs
are more difficult to predict than in GCP and IoT-Ticket. However, the test results did not
identify the pricing model for Azure and AWS to be poor. Admittedly, knowledge about

97
the different products on these platforms is required to make an optimal prediction. M-
Files was the exception in its pricing model from VSV's point of view, since they already
have the application in use. Furthermore, there was no advantage in examining the sys-
tem’s pricing model in general, as M-Files has been developed largely as a document
management system. Therefore, its acquisition as an IoT platform alone is unlikely to
exploit its full potential.
An overview of the comparison results is presented in Table 4, which shows the platform
properties that were positive based on the results, those that were negative and those
where uncertainties remained.
Table 4. Summary from platform comparisons.
The table above may inform VSVs when acquiring an IoT platform. In this way, the overall
picture is presented and a feature of interest may be explored in more detail, by return-
ing to the relevant section in the results.
Chapter 2 presented two technology stacks describing the elements expected of an ef-
fective IoT-based digital service. All the factors were included in this study and were
found to be relevant. For example, Collin and Saarelainen’s technology stack considers
customer value. In applications such as those examined in this study, it may be concluded
that in the long term, customer value is derived from end user application, allowing ser-
vice experts to make rational decisions that lead to fewer power outages.
Platform Protocols and APIs Scalability and Flexibility Pricing model Security User experienceThe need for expertise to
maintain the platform
M-Files
IoT-Ticket
Microsoft Azure IoT Hub
Amazon AWS IoT Core
Google Cloud IoT Core
98
5.1 Limitations
As previously discussed, there are hundreds of platforms currently on the market that
may be used to build IoT systems. This study compared five platforms, one of which was
not directly categorized as an IoT platform. Therefore, it should be noted that there may
be many platforms that have features superior to in the platforms studied. However, the
reliability of the results is supported by the fact that the study examined three platforms
that are performing well in terms of market shares (Knud, 2019).
99
6 Conclusion
During this study, it became evident that IoT technology is relatively evolved and organ-
izations should begin using it at a low threshold if suitable applications are found. PdM,
which was one of the key themes of this study, may be considered a particularly suitable
candidate. The purpose of this study was to map and test different IoT platforms using
practical implementations. The five platforms selected for testing all have advantages
and disadvantages. It may be argued that M-Files was the IoT platform with the most
questions remaining. Conversely IoT-Ticket, with its rich visualization features, creates a
pleasant user experience. Drag and drop methods provide a simple method for develop-
ers to build value-added applications. In terms of scalability, flexibility and security, IoT-
Ticket largely works on the same principles as Azure, AWS and GCP. These major per-
formers have so many tools, that an organization selecting one of them as its IoT plat-
form is unlikely to face challenges in scalability, flexibility, or tools. The difficulty, however,
is that their implementation and development require more expertise.
This study was carried out in collaboration with VSV. Based on the study findings, the
following starting points for acquiring and installing IoT platforms are proposed:
- M-Files in conjunction with Power BI is a workable solution. However, the main
question is its performance and scalability in an IoT operating environment. It is
recommended that the test run is continued on an increased scale if it is to re-
main in use.
- IoT-Ticket is a functional solution and contains all the significant elements ex-
pected of an IoT platform. If the pricing model is suitable for VSV, IoT-Ticket may
be a viable option.
- Azure, AWS, and GCP all have considerable potential. However, it is crucial that
developers possess sufficient expertise. For AWS and GCP, it is important to con-
sider the most efficient way to build an end user application, since the solutions
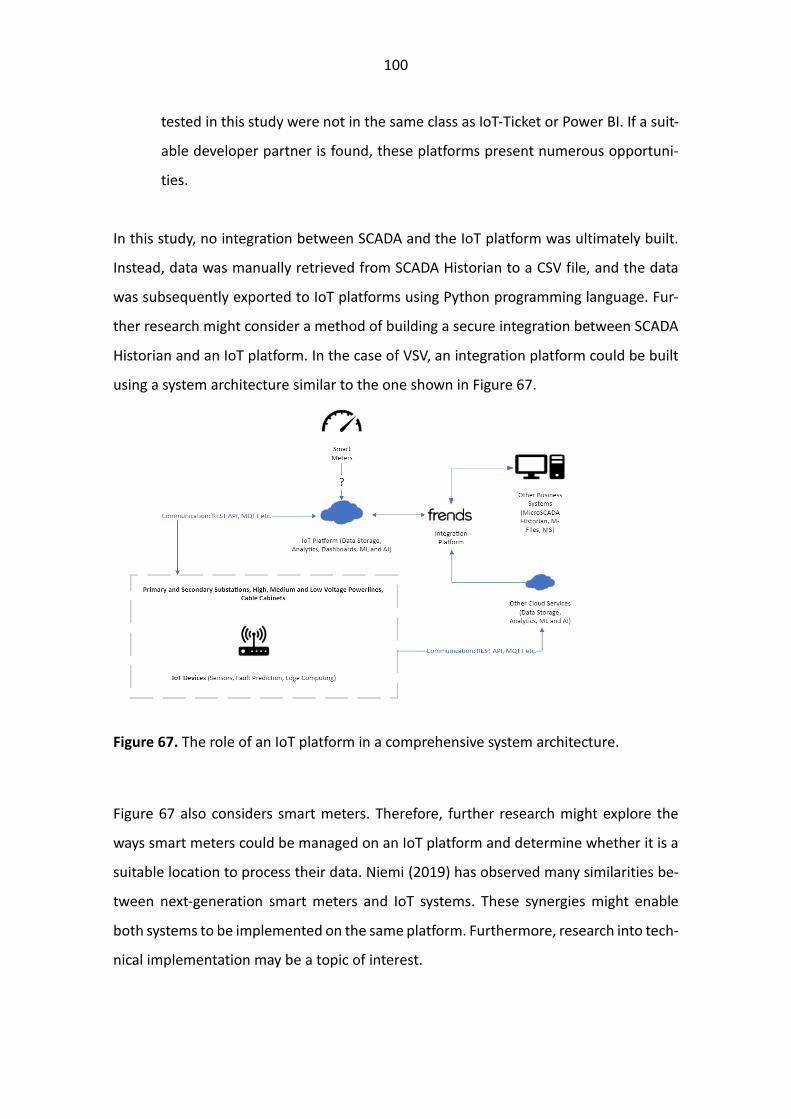
100
tested in this study were not in the same class as IoT-Ticket or Power BI. If a suit-
able developer partner is found, these platforms present numerous opportuni-
ties.
In this study, no integration between SCADA and the IoT platform was ultimately built.
Instead, data was manually retrieved from SCADA Historian to a CSV file, and the data
was subsequently exported to IoT platforms using Python programming language. Fur-
ther research might consider a method of building a secure integration between SCADA
Historian and an IoT platform. In the case of VSV, an integration platform could be built
using a system architecture similar to the one shown in Figure 67.
Figure 67. The role of an IoT platform in a comprehensive system architecture.
Figure 67 also considers smart meters. Therefore, further research might explore the
ways smart meters could be managed on an IoT platform and determine whether it is a
suitable location to process their data. Niemi (2019) has observed many similarities be-
tween next-generation smart meters and IoT systems. These synergies might enable
both systems to be implemented on the same platform. Furthermore, research into tech-
nical implementation may be a topic of interest.
101
References
ABB. (2000). ABB:n TTT-käsikirja. ABB.
ABB. (2021a). CoreTecTM 4, the TXpertTM Hub for power transformers enabling trans-
former digitalization and monitoring. https://search.abb.com/library/Down-
load.aspx?DocumentID=1LAB000631&LanguageCode=en&DocumentPartId=&Ac-
tion=Launch
ABB. (2021b). TXpert TM Ready hydrogen & moisture sensor CoreSenseTM.
https://search.abb.com/library/Download.aspx?DocumentID=1LAB000585&Language-
Code=en&DocumentPartId=&Action=Launch
Agarwal, P., & Alam, M. (2018). Investigating IoT Middleware Platforms for Smart Appli-
cation Development. Jamia Millia Islamia, New Delhi, India, 6–13.
https://arxiv.org/abs/1810.12292
Al-Fuqaha, A., Guizani, M., Mohammadi, M., Aledhari, M., & Ayyash, M. (2015). Internet
of Things: A Survey on Enabling Technologies, Protocols, and Applications. IEEE Commu-
nications Surveys & Tutorials, 17(4), 2347–2376.
https://doi.org/10.1109/comst.2015.2444095
Alpha Technologies Ltd. (2016). Cordex HP Controller – Software Manual.
https://www.alpha.com/download/critical_facilities_power/dc_power_solutions/cont-
rollers/cordex_cxc_hp/cordex_cxc_hp_controller_software_manual.pdf
Amazon Web Services. (2021a). Amazon QuickSight Pricing. https://aws.ama-
zon.com/quicksight/pricing/
Amazon Web Services. (2021b). AWS Pricing Calculator. Estimate the Cost for Your Archi-
tecture Solution. https://calculator.aws/#/
102
Amazon Web Services. (2021c). AWS Solutions Reference Architectures. https://aws.am-
azon.com/solutions/reference-architectures
Amazon Web Services. (2021d). Getting started with AWS IoT Core.
https://docs.aws.amazon.com/iot/latest/developerguide/iot-gs.html
Amazon Web Services. (2021e). Machine Learning on AWS. https://aws.ama-
zon.com/machine-learning/
Amazon Web Services. (2021f). What is AWS IoT Core? https://aws.amazon.com/iot-
core/
Bangalore, P., & Tjernberg, L. B. (2016). Condition monitoring and asset management in
the smart grid. Smart Grid Handbook, 6–12.
https://doi.org/10.1002/9781118755471.sgd061
Cirani, S., Ferrari, G., Picone, M., & Veltri, L. (2019). Internet of Things. Wiley.
Cisco. (2020). What Is a LAN? Products & Services. https://www.cisco.com/c/en/us/pro-
ducts/switches/what-is-a-lan-local-area-network.html?utm_source=CAM
Collin, J., & Saarelainen, A. (2016). Teollinen internet [E-book]. Talentum Media Oy.
https://shop.almatalent.fi/teollinen-internet-ekirja
Digita. (2021). LoRaWAN technology – What is LoRaWAN? https://www.digita.fi/en/ser-
vices/iot/lorawan-technology/

103
Electrical4U. (2020). Electrical Power Transformer: Definition & Types of Transformers.
https://www.electrical4u.com/electrical-power-transformer-definition-and-types-of-
transformer/
Elovaara, J., & Haarla, L. (2011). Sähköverkot 2. Otatieto.
Energiavirasto. (2018). Valvontamenetelmät neljännellä 1.1.2016 – 31.12.2019 ja viiden-
nellä 1.1.2020 – 31.12.2023 valvontajaksolla. https://energiavirasto.fi/docu-
ments/11120570/12766832/Valvontamenetelm%C3%A4t-s%C3%A4hk%C3%B6njakelu-
2016-2023.pdf/72eac45f-4fe0-6b0a-d5f7-e89ee97b89fc/Valvontamenetelm%C3%A4t-
s%C3%A4hk%C3%B6njakelu-2016-2023.pdf
Eronen, M. (2016). Customer value and profitability of power transformer online dga
monitoring. http://urn.fi/URN:NBN:fi:tty-201610264660
Etab Electric Oy. (2019). Thermal imaging report of the Ristinummi primary substation.
[Report].
Fielding, T. (2000). Architectural Styles and the Design of Network-based Software Archi-
tectures. University of California, Irvine. https://roy.gbiv.com/pubs/dissertation/field-
ing_dissertation.pdf
Fridelin Panduman, Y. Y., Sukaridhoto, S., & Tjahjono, A. (2019). A Survey of IoT Platform
Comparison for Building Cyber-Physical System Architecture. 2019 International Seminar
on Research of Information Technology and Intelligent Systems (ISRITI), 1–5.
https://doi.org/10.1109/isriti48646.2019.9034650
Gartner. (2021). What are Industrial IoT Platforms? Peer Insights. https://www.gart-
ner.com/reviews/market/industrial-iot-platforms
104
Google Cloud. (2021a). AI Platform documentation. https://cloud.google.com/ai-plat-
form/docs
Google Cloud. (2021b). Cloud IoT Core. https://cloud.google.com/iot-core
Google Cloud. (2021c). Cloud IoT Core – Quickstart.
https://cloud.google.com/iot/docs/quickstart
Google Cloud. (2021d). Google Cloud Pricing Calculator. https://cloud.google.com/prod-
ucts/calculator
Google Cloud. (2021d). Technical overview of Internet of Things.
https://cloud.google.com/solutions/iot-overview
Gratton, D. A. (2013). The Handbook of Personal Area Networking Technologies and Pro-
tocols. Cambridge University Press, 15–22. https://doi.org/10.1017/cbo9780511979132
Guth, J., Breitenbucher, U., Falkenthal, M., Leymann, F., & Reinfurt, L. (2016). Compari-
son of IoT platform architectures: A field study based on a reference architecture. 2016
Cloudification of the Internet of Things (CIoT), 1–5.
https://doi.org/10.1109/ciot.2016.7872918
Hersent, O., Boswarthick, D., & Elloumi, O. (2012). The Internet of Things: Key Applica-
tions and Protocols (2nd ed.). Wiley.
Hillar, G. C. (2018). Hands-On MQTT Programming with Python: Work with the light-
weight IoT protocol in Python. Packt Publishing.
HTTP Messages - HTTP | MDN. (2021, February 16). MDN Web Docs. https://deve-
loper.mozilla.org/en-US/docs/Web/HTTP/Messages
105
Huang, S., Wang, R., & Yang, Z. (2017). Substation DC system intelligent monitor and
maintenance system. 2017 IEEE 2nd Advanced Information Technology, Electronic and
Automation Control Conference (IAEAC), 1–3.
https://doi.org/10.1109/iaeac.2017.8054381
Ite wiki. (2021). Teollisen internetin ja IoT:n osaajayritykset. https://www.itewiki.fi/yri-
tykset/iot
Kang, B., Kim, D., & Choo, H. (2017). Internet of Everything: A Large-Scale Autonomic IoT
Gateway. IEEE Transactions on Multi-Scale Computing Systems, 3(3), 206–214.
https://doi.org/10.1109/tmscs.2017.2705683
Knud, L. L. (2019). IoT Platform Companies Landscape 2019/2020: 620 IoT Platforms
globally. https://iot-analytics.com/iot-platform-companies-landscape-2020/
Laaksonen, H. (2020). Smart Grids – Active Networks and Microgrids [Lecture material].
University of Vaasa.
Lappi, J. (2019). Asset Performance Management application for power system condition
monitoring in an Internet of Things platform. http://urn.fi/URN:NBN:fi:aalto-
201905122987
Lau, B. P. L., Marakkalage, S. H., Zhou, Y., Hassan, N. U., Yuen, C., Zhang, M., & Tan, U.-X.
(2019). A survey of data fusion in smart city applications. Information Fusion, 52, 357–
374. https://doi.org/10.1016/j.inffus.2019.05.004
Liu, B., Lin, J., Zhang, L., & Kumar, U. (2019). A Dynamic Prescriptive Maintenance Model
Considering System Aging and Degradation. IEEE Access, 7, 94931–94943.
https://doi.org/10.1109/access.2019.2928587

106
McCrady, S. G. (2013). Designing SCADA Application Software: A Practical Approach (1st
ed.). Elsevier. https://www.elsevier.com/books/designing-scada-application-soft-
ware/mccrady/978-0-12-417000-1
M-Files Corporation. (2020). Protecting File Data at Rest with Encryption in M-Files (1.5).
https://kb.cloudvault.m-files.com/Default.aspx?#3ECA226F-7B54-428B-B539-
DE443E6134EC/object/CAB2C1CC-9DF8-4F89-841F-20857383E0B6/latest
M-Files Corporation. (2021a). System Administration. https://www.m-files.com/user-
guide/latest/eng/configuring_the_system.html
M-Files Corporation. (2021b). What to use M-Files for. https://www.m-files.com/prod-
ucts/platform-features/
Microsoft. (2021a). Azure IoT Hub. https://azure.microsoft.com/en-us/services/iot-hub/
Microsoft. (2021b). Azure IoT Hub Documentation. https://docs.microsoft.com/en-
us/azure/iot-hub/
Microsoft. (2021c). Azure IoT reference architecture. https://docs.microsoft.com/en-
us/azure/architecture/reference-architectures/iot
Microsoft. (2021d). Azure Machine Learning. https://azure.microsoft.com/en-us/servi-
ces/machine-learning/
Microsoft. (2021e). Pricing calculator – Configure and estimate the costs for Azure prod-
ucts. https://azure.microsoft.com/en-us/pricing/details/iot-hub/

107
Microsoft. (2021f). What is Power BI? https://powerbi.microsoft.com/en-us/what-is-po-
wer-bi/
Mineraud, J., Mazhelis, O., Su, X., & Tarkoma, S. (2016). A gap analysis of Internet-of-
Things platforms. Computer Communications, 89–90, 5–16.
https://doi.org/10.1016/j.comcom.2016.03.015
Mobley, R. K. (2004). Maintenance Fundamentals. Elsevier Gezondheidszorg.
Morabito, R., Cozzolino, V., Ding, A. Y., Beijar, N., & Ott, J. (2018). Consolidate IoT Edge
Computing with Lightweight Virtualization. IEEE Network, 32(1), 102–111.
https://doi.org/10.1109/mnet.2018.1700175
Nemeth, T., Ansari, F., Sihn, W., Haslhofer, B., & Schindler, A. (2018). PriMa-X: A reference
model for realizing prescriptive maintenance and assessing its maturity enhanced by ma-
chine learning. Procedia CIRP, 72, 1039–1044. https://doi.org/10.1016/j.pro-
cir.2018.03.280
Niemi, P. (2019). Internet of Things –sensoreiden hyödyntäminen sähkönjakeluverkon
kunnonhallinnassa. http://urn.fi/URN:NBN:fi:tuni-201908022809
Oasis Open. (2012). OASIS Advanced Message Queuing Protocol (AMQP).
https://docs.oasis-open.org/amqp/core/v1.0/os/amqp-core-complete-v1.0-os.pdf
OpenJS Foundation. (2021). Node-RED – Low-code programming for event-driven appli-
cations. https://nodered.org/
Oppliger, R. (2016). SSL and TLS: Theory and Practice, Second Edition. Macmillan Pub-
lishers. https://books.google.fi/books?id=jm6uDgAAQBAJ
108
Pierleoni, P., Concetti, R., Belli, A., & Palma, L. (2020). Amazon, Google and Microsoft
Solutions for IoT: Architectures and a Performance Comparison. IEEE Access, 8, 5455–
5470. https://doi.org/10.1109/access.2019.2961511
Ramamurthy, A., & Jain, P. (2017). The Internet of Things in the Power Sector: Opportu-
nities in Asia and the Pacific. Asian Development Bank, 9–11.
https://doi.org/10.22617/WPS178914-2
Rantonen, V. (2020). MicroSCADA PRO Historian – Redundancy Features and Perfor-
mance, Implementation in MicroSCADA System. http://urn.fi/URN:NBN:fi:amk-
2020080419657
Raspberry Pi Foundation. (2021). Raspberry Pi 4. https://www.raspberrypi.org/prod-
ucts/raspberry-pi-4-model-b/
Ravulavaru, A. (2018). Enterprise Internet of Things Handbook: Build end-to-end IoT so-
lutions using popular IoT platforms. Packt Publishing. https://ebookcentral-proquest-
com.proxy.uwasa.fi
Red Hat. (2021). Cloud-Native Applications – What is an SDK? https://www.red-
hat.com/en/topics/cloud-native-apps/what-is-SDK
Rojas, H. (2018). Service Day. PGHV – Solutions [Slides]. ABB.
https://new.abb.com/docs/librariesprovider78/colombia-ecuador-docs/presentation-
abb-daypghv.pdf?sfvrsn=ebe3ec14_6
Ruuvi. (2021). What is Ruuvitag? Ruuvi - We Love Open-Source.
https://ruuvi.com/ruuvitag-specs/

109
Schmidt, B., & Wang, L. (2016). Cloud-enhanced predictive maintenance. The Interna-
tional Journal of Advanced Manufacturing Technology, 99(1–4), 5–13.
https://doi.org/10.1007/s00170-016-8983-8
Sekita, R. (2019). Risk-Based Maintenance Methodology Applying IoT to Electrical Facili-
ties. 2019 Annual Reliability and Maintainability Symposium (RAMS), 1–4.
https://doi.org/10.1109/rams.2019.8769006
Teräväinen, M. (2019). Osittaispurkauksien perusteet. http://urn.fi/URN:NBN:fi:amk-
201903132832
The WebSocket API (WebSockets) - Web APIs | MDN. (2021). MDN Web Docs. https://de-
veloper.mozilla.org/en-US/docs/Web/API/WebSockets_API
Ullah, M., Nardelli, P. H. J., Wolff, A., & Smolander, K. (2020). Twenty-One Key Factors to
Choose an IoT Platform: Theoretical Framework and Its Applications. IEEE Internet of
Things Journal, 7(10), 10111–10119. https://doi.org/10.1109/jiot.2020.3000056
Unseen Technologies Oy. (2019). Autonominen lämpökamera sähköverkon kunnonval-
vontaan. https://energia.fi/files/4384/Autonominen_lampokamera_sahkoverkon_kun-
nonvalvontaan_-_UnSeen_20191112.pdf
Vaasan Sähköverkko Oy. (2020a). Inspection material of the low voltage network [Da-
taset].
Vaasan Sähköverkko Oy. (2020b). Time-based maintenance plan for primary substation
components [Dataset].
Vaasan Sähköverkko Oy. (2021a). Main diagram of the electrical primary substation
[Drawing].
110
Vaasan Sähköverkko Oy. (2021b). The view of the Alskat primary substation in SCADA
system [Screenshot from SCADA].
Vaisala Oyj. (2021). Vaisala Optimus TM DGA Monitor for power transformers. OPT100.
https://www.vaisala.com/sites/default/files/documents/OPT100-Installation-Guide-
M211857EN.pdf
Vlasov, A., Echeistov, V., Krivoshein, A., Shakhnov, V., Filin, S., & Migalin, V. (2018). An
information system of predictive maintenance analytical support of industrial equipment.
Journal of Applied Engineering Science, 16(4), 515–522. https://doi.org/10.5937/jaes16-
18405
Wapice. (2019). Vaasan Sähköverkko Oy – Monitoring of substations. [Budget offer].
Wapice. (2021a). Build Production Grade IoT Applications.
https://www.wapice.com/products/iot-ticket
Wapice. (2021b). Combining Wapice’s IoT-TICKET® platform and HiQ’s Frends platform
enables more extensive data integration. https://www.wapice.com/news/wapice-and-
hiq-combines-iot-ticket-with-frends
Wapice. (2021c). IoT-Ticket Platform. https://iot-ticket.com/platform
Wapice. (2021d). IoT-Ticket Security Aspects [Presentation material].
Wortmann, F., & Flüchter, K. (2015). Internet of Things. Business & Information Systems
Engineering, 57(3), 221–224. https://doi.org/10.1007/s12599-015-0383-3
111
You, M.-Y. (2017). A predictive maintenance system for hybrid degradation processes.
International Journal of Quality & Reliability Management, 34(7), 1123–1135.
https://doi.org/10.1108/ijqrm-08-2016-0141
Yu, J.-Y., & Kim, Y.-G. (2019). Analysis of IoT Platform Security: A Survey. 2019 Interna-
tional Conference on Platform Technology and Service (PlatCon), 2–5.
https://doi.org/10.1109/platcon.2019.8669423
Zhang, Y., Ansari, N., Wu, M., & Yu, H. (2012). On Wide Area Network Optimization. IEEE
Communications Surveys & Tutorials, 14(4), 1090–1113.
https://doi.org/10.1109/surv.2011.092311.00071