mapping aquifer bifurcation through integrated geophysical ...mapping aquifer bifurcation through...
TRANSCRIPT

© 2017. Rolland Andrade. This is a research/review paper, distributed under the terms of the Creative Commons Attribution-Noncommercial 3.0 Unported License http://creativecommons.org/licenses/by-nc/3.0/), permitting all non-commercial use, distribution, and reproduction in any medium, provided the original work is properly cited.
Mapping Aquifer Bifurcation Through Integrated Geophysical and Tracer Studies in a Granite Terrain
By Rolland Andrade
Abstract- Identification of groundwater aquifer in hard rock using conventional surface geophysical investigation techniques is intricate in nature. Numerous attempts have been made in the recent past to understand and identify appropriate technique(s) to locate deeper fracture zones (pay zones), its dimension and orientation, transient variations due to moisture etc., which are the prime cause of complexity in identifying groundwater. Simply a practical approach to locate groundwater aquifer could be to carry out surfacial geophysical investigation(s) in unison with tracer studies and also to look out for favorable geological settings in an area. One such approach initiated in granite terrain of southern India is described in this paper. In this manuscript the author illustrates surface geophysical and tracer techniques adopted in deciphering a buried dolerite dyke occupying a fault, also happen to bifurcate/truncate shallow aquifer into two independent segments during pre-monsoon which otherwise appears as a single unit after monsoon. This integrated study has proven to be exceptionally useful in this hydrological investigation and may be extended for similar complicated situations.
Keywords: dolerite dyke, 2D resistivity tomography, radon counts, faults, litho-stratification.
GJHSS-B Classification: FOR Code: 269999
MappingAquiferBifurcationThroughIntegratedGeophysicalandTracerStudiesinaGraniteTerrain Strictly as per the compliance and regulations of:
Online ISSN: 2249-460x & Print ISSN: 0975-587X
Global Journal of HUMAN-SOCIAL SCIENCE: B
Geography, Geo-Sciences, Environmental Science & Disaster Management
Type: Double Blind Peer Reviewed International Research JournalPublisher: Global Journals Inc. (USA)
Volume 17 Issue 3 Version 1.0 Year 2017
Mapping Aquifer Bifurcation Through Integrated Geophysical and Tracer Studies in a Granite
Terrain Rolland Andrade
Abstract- Identification of groundwater aquifer in hard rock using conventional surface geophysical investigation techniques is intricate in nature. Numerous attempts have been made in the recent past to understand and identify appropriate technique(s) to locate deeper fracture zones (pay zones), its dimension and orientation, transient variations due to moisture etc., which are the prime cause of complexity in identifying groundwater. Simply a practical approach to locate groundwater aquifer could be to carry out surfacial geophysical investigation(s) in unison with tracer studies and also to look out for favorable geological settings in an area. One such approach initiated in granite terrain of southern India is described in this paper. In this manuscript the author illustrates surface geophysical and tracer techniques adopted in deciphering a buried dolerite dyke occupying a fault, also happen to bifurcate/truncate shallow aquifer into two independent segments during pre-monsoon which otherwise appears as a single unit after monsoon. This integrated study has proven to be exceptionally useful in this hydrological investigation and may be extended for similar complicated situations. Keywords: dolerite dyke, 2D resistivity tomography, radon counts, faults, litho-stratification.
I. Introduction
resently the prime global issues of the 21st century are food security, water scarcity and environmental degradation. Renewable fresh
water scarcity remains a problem for millions of people around the world, especially those in arid and semiarid regions. Occurrence of groundwater is mainly in weathered to semi-weathered formations in shallow depths and in fractures/fissures at deeper depths. Exploration and delineation of groundwater aquifer in hard rock terrain is a challenging problem. Surface geophysical investigation(s) are the primary means to delineate and visualize the subsurface complexities through transient or permanent response of measurable physical parameters integrated with the site geological inference. There are numerous geophysical investigation methods adopted for groundwater exploration of which electrical method has shown a wide acceptance and better applicability in groundwater science. Electrical method in concatenation with magnetic, VLF and other
Author: Central Water and Power Research Station, Pune-411024.
e-mail: [email protected]
investigation methods form a strong tool in delineating subsurface lithology, lineaments and also to decipher conduits for groundwater storage.
In resistivity investigation the selection of site is most important and complex criterion. In usual practice a site is selected based on hydrogeological information gathered over the area and supported by remote sensing data, if available, but there is always a probability that the best location may be away from the selected point. The ground resistivity is related to various geological parameters such as the mineral content, intergranular compaction, porosity, degree of water saturation in the rocks etc. (Dr. Laurent Marescot, 1995). In this manuscript, the author highlights a unique case of a dolerite dyke occupying a fault, bisecting the shallow granite aquifer into two halves during pre-monsoon period. Geophysical investigation(s) in association with geo-hydrological and tracer methods have been attempted in understanding this site specific problem. Tracer studies were carried out at specific location based on interpreted geophysical investigation results and has concurred the presence of fault associated with a Dyke.
II. Study Area
The study area was selected within a watershed basin of ~150 sq km in a semi-arid granite terrain. The prime purpose of the watershed selection in such area was to undertake integrated watershed management and groundwater quality assessment studies. Based on natural resource map & geological mapping, it was confirmed that the geology of the area is basically granite (pink/grey) with numerous dykes and faults signifying high tectonic disturbances during the recent geological past. The drainage pattern of the watershed area is parallel to sub-parallel and is structurally controlled as seen in figure.1.
P
© 2017 Global Journals Inc. (US)
V
olum
e XVII
Issu
e III
Versio
n I
59
( B)
Globa
l Jo
urna
l of H
uman
Soc
ial Sc
ienc
e
-
Year
2017

Fig. 1: Watershed area delineated with drainage and lineaments
Physiographycally, the entire watershed area has rugged topography with hill ranges and plains with elevation ranging from 670 m to 400 m A.M.S.L (Above
Mean Sea Level). Groundwater in the study area occurs both under phreatic and semi confined conditions in the weathered and fractured horizons. The occurrence of
© 2017 Global Journals Inc. (US)
V
olum
e XVII
Issu
e III
Versio
n I
60
( B)
Globa
l Jo
urna
l of H
uman
Soc
ial Sc
ienc
e
-
Year
2017
Mapping Aquifer Bifurcation Through Integrated Geophysical and Tracer Studies in a Granite Terrain

groundwater is confined to shallow to moderate depths. The thickness of the weathered residuum varies widely and ranges between 8 to 20 m and occasionally up to 40 m. Shallow fractured and fissured zones occur beneath the weathered zones down to the depth of 30-75 m bgl.
III. Methodology
Groundwater exploration, aquifer depth determination and site selection for artificial recharge structure like check dam, percolation tank etc. was carried out in the study area, using surface geophysical investigation(s) techniques. Electrical resistivity method, Very Low Frequency (VLF) method, 2D resistivity imaging etc., along with tracer studies were carried out in order to determine the lithological distribution, depth to the basement, presence of faults and emplacement of dyke in the area under study. The basic concept and working principle of these methods are discussed as follow:
a) Resistivity Measurements Resistivity measurements are normally carried
out by injecting electric current through two electrodes (C1 and C2), and measuring the resulting voltage difference through electrodes (P1 and P2). The calculated field resistivity value is an “apparent” value, which is the resistivity of a heterogeneous medium, which in turn gives variable resistance value for different electrode position and spacing. In order to determine the true resistivity of the subsurface, the measured field value has to be subjected to inversion using computer program. Resistivity surveys are broadly of two types viz. (1) Vertical Electrical Sounding (VES), also known as electrical drilling, or expanding probe. It gives the resistivity behavior of horizontal or near horizontal interfaces occurring at varying depths; and (2) Constant Separation Traversing (CST), also known as electrical profiling or scanning. It gives the lateral variation in electrical conductivity within the subsurface (Rolland Andrade, 2009).
i. ERT (Electrical Resistivity Tomography) 2D resistivity imaging (E.R.T) in broad sense is
a combination of both electrical profiling and sounding, designed to overcome several constraints raised from independent methods (Dahlin T., 1996; Keller G.V. and Frischknecht F.C., 1966; Griffiths, D.H. and Turnbull, J., 1985). Based on the CVES principle (continuous vertical electric sounding), the electrode arrays combines electrical sounding and electrical profiling together; which results in resistivity values measured both along a line and simultaneously at different depths. Automatic acquisition systems based on CVES make it possible to collect dense data sets, which give a comprehensive description of the ground in two dimensions (2-D). Advantage of 2D resistivity imaging is not only in
mapping the sub-surface information of the area in terms of geo-electrical layers but also in generation of reliable information of large dimension. E.R.T provides a true resistivity pseudo-depth section of the subsurface and also resolves the principle of suppression to a greater extent through its data acquisition technique.
b) Magnetic Survey Magnetic survey is to investigate subsurface
geology on the basis of the anomalies in the earth's magnetic field resulting from the magnetic properties of the underlying rocks. It measures small, localised variations in the Earth's magnetic field. In general, the magnetic content (susceptibility) of rocks is extremely variable depending on the type of rock and the surrounding environment. The magnetic properties of naturally occurring materials such as magnetic ore bodies and basic intrusive igneous rocks are best identified and mapped by magnetic surveys. It involves the measurement of earth's magnetic field intensity. Typically the total magnetic field and/or vertical magnetic gradient is measured. Measurements of the horizontal or vertical component or horizontal gradient of the magnetic field may also be made (Mariita N.O., 2007). Common causes of magnetic anomalies include dykes, faults and lava flows. Where the rocks have high magnetic susceptibility, the local magnetic field will be strong; where these have low magnetic susceptibility, it will be weaker.
c) VLF (Very Low Frequency) Survey Very Low Frequency (VLF) Electromagnetics is
a geophysical ground probing technology that employs VLF signals in the range 15 to 30 kHz, normally transmitted using powerful radio transmitter used in long range communication for navigational system (Nabighian and Macnae, 1991). VLF method relies on transmitted current inducing secondary responses in conductive geologic units. The transmitted signal has horizontal and linearly polarized magnetic and electrical components of the radiowave, in the absence of a subsurface conductor; however, eddy current is generated when the radiowave field passes through a buried conductor, creating a secondary electromagnetic field. VLF is an effective method for detecting long, straight, electrically charged conductors, and it has been used to locate fractures, image subsurface voids, map landfill margins, and to delineate buried conductive utilities.
IV. Field Investigation
Fifteen vertical electrical sounding(s) (VES) with AB/2 50-80 mts and cadastral survey with 1 m interval spacing was carried out from the catchment to the plains, in order to identify suitable sites for drilling of borehole. Based on VES data interpretation results and topographic elevation from cadastral survey, 4 bore
© 2017 Global Journals Inc. (US)
V
olum
e XVII
Issu
e III
Versio
n I
61
( B)
Globa
l Jo
urna
l of H
uman
Soc
ial Sc
ienc
e
-
Year
2017
Mapping Aquifer Bifurcation Through Integrated Geophysical and Tracer Studies in a Granite Terrain

wells upto a depth of 30-40 mts were drilled. Based on drilling information and geophysical investigation(s) a lithological cross section was prepared as shown in figure 2. The lithology of the area was interpreted based on investigation result(s) was top soil followed by weathered and fractured granite (aquifer zone) underlained by massif granite as basement. A large
diameter open (dug) well termed as resource well was executed near to the foothills were the aquifer thickness is more than 20 m. Further, in order to sustain the resource well both in quality and quantity, a number of water harvesting structures were planned on the upstream section of the study area.
Fig. 2: Lithological cross section with vertical electrical sounding (VES) and bore well location
The aquifer zone which appears to be a single unit with variable thickness from the catchment to the plains is practically segmented / bifurcated into two units between OB-3 and OB-4 as seen in figure 2. Based on water level and other hydro-chemical analysis, it was later established that the aquifer is segmented. In order to authenticate the same, a detailed geophysical and tracer investigation was planned within the selected site as shown under inset in cloud.
In order to have a detailed insight understanding of the watershed area, satellite imageries were analyzed, followed by ground truth, which revealed the presence of a dolerite dyke across the stream course (2nd to 3rd order stream) occupying a fault, trending east-west in the study area. Although the suspected dyke emplacement across the stream course was not visible on the surface, but the same was exposed on the hill slopes along the two flank of the
stream. Two observation bore wells OB-3 and OB-4 as mentioned earlier were used to monitor the water level fluctuation for the entire hydrological cycle. During the pre-monsoon season when the water level fluctuates down to a depth below 2 to 2.5 m from the surface, the aquifer acts as two independent systems. Whereas during monsoon and post monsoon season due to rise in regional water table up to the ground surface, the entire aquifer stretch gets interconnected as a single aquifer unit, indicating a hydraulic passage through weathered dyke up to 2 m depth.
In order to authenticate the presence of the suspected fault occupied by the stream and a dyke cutting across; different geophysical methods of investigation were carried out in integration, at the suspected juncture (dyke cutting stream course): a. Resistivity wenner profiling survey was carried out
using DC resistivity meter (Terra Science; Model
© 2017 Global Journals Inc. (US)
V
olum
e XVII
Issu
e III
Versio
n I
62
( B)
Globa
l Jo
urna
l of H
uman
Soc
ial Sc
ienc
e
-
Year
2017
Mapping Aquifer Bifurcation Through Integrated Geophysical and Tracer Studies in a Granite Terrain
Note: OB:- Observation Bore Well

TSRM-4/4117) for two different electrode spacing (a=5, 10 and 20 mts.) with station interval of 2 m was carried out perpendicular to the suspected dyke alignment. A resistivity high showing a considerable width of 20-25 m is predominantly
seen in all the profile signatures as shown in Figure.3. Investigation was carried out 250 m downstream from observation bore well No.4 (OB-4).
Fig. 3: Resistivity wenner profiling across suspected dyke zone with three electrode spacing(s)
The resistivity signature of wenner profile(s) with spacing a=20, 10 and 5 m, over the suspected buried dyke zone has shown high turbulence in resistivity values ranging from 600 to 70 ohm-m (Ωm). There are three prominent rise and fall in resistivity signature(s) observed within the suspected zone, indicating the sharp flank of the dyke with the host rock and the dyke itself. The resistivity profiling signature across a vertical dyke depends not only upon the resistivity contrast between the dike and the country rock, but also upon the width of the dyke. Usually, in case of resistivity profiling using Wenner configuration, the apparent-resistivity signature has twin peaks shifted towards the center of the dyke for smaller resistivity contrasts. The resistivity signature recorded in the study area, shown in figure 3 appears similar to the theoretical model as mentioned by Robert G. Van No strand & Kenneth L. Cook, 1966. But the signatures lacks in sharpness as that of the theoretical curve, mainly due to the presence of overburden, which comprises of weathered granite (murram), sandy clay and rubbles of weathered dyke. b. Later on magnetic profiling was carried out along
the same profile as that of the resistivity wenner profile with station interval of 2 m. Proton precision magnetometer (Terra-science make) was used to measure the total magnetic field intensity. The area of investigation where the magnetic profiling was carried out was ‘magnetically clean’ in the sense that the measurements were taken at large distances from buildings or human activity and the emplacement of suspected dyke was in granite
(Felsic rock type) terrain, which is generally non magnetic in nature.
© 2017 Global Journals Inc. (US)
V
olum
e XVII
Issu
e III
Versio
n I
63
( B)
Globa
l Jo
urna
l of H
uman
Soc
ial Sc
ienc
e
-
Year
2017
Mapping Aquifer Bifurcation Through Integrated Geophysical and Tracer Studies in a Granite Terrain
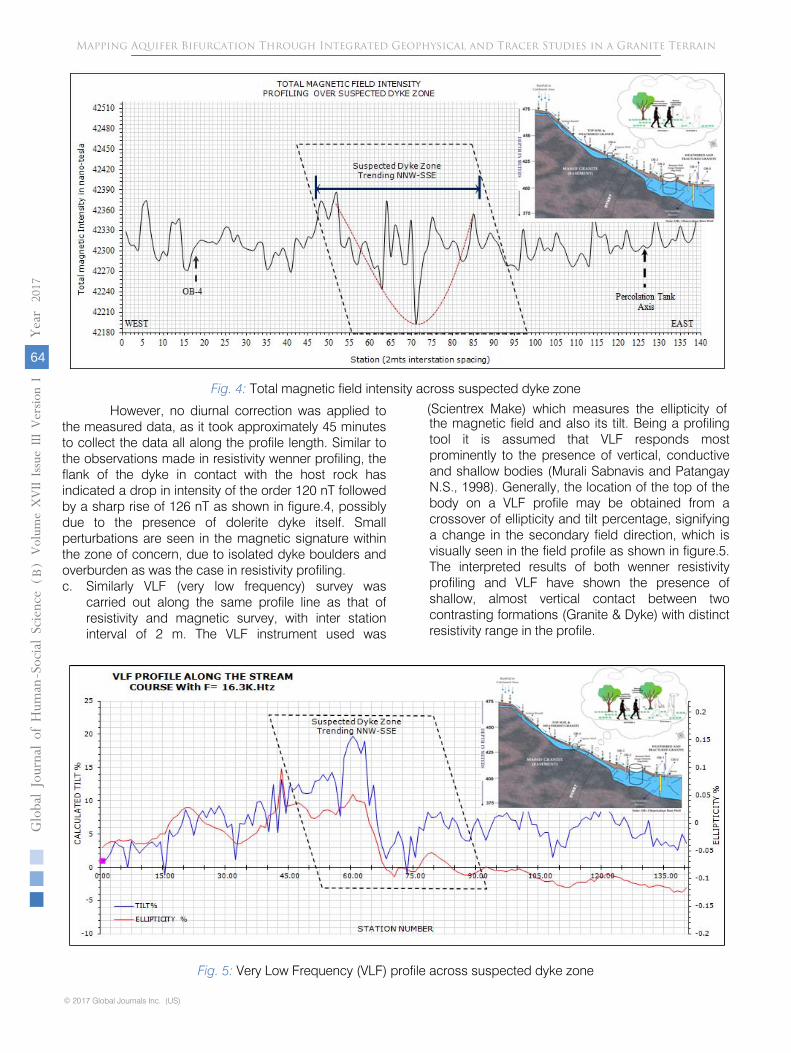
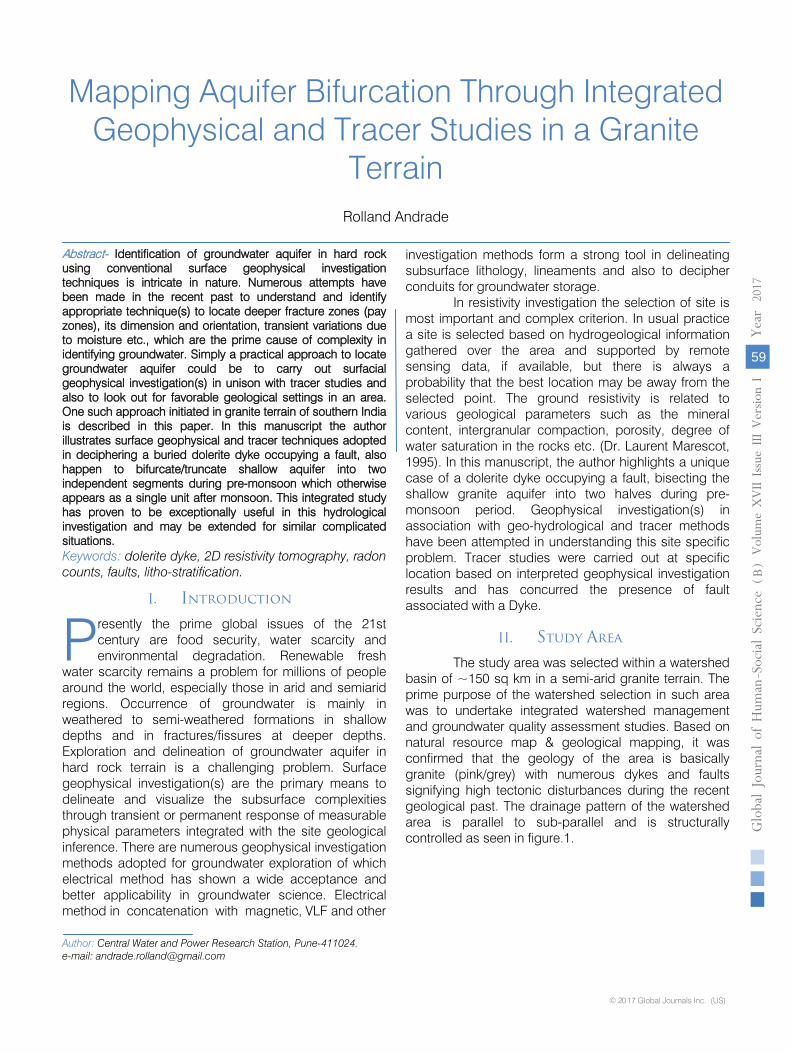
Fig. 4: Total magnetic field intensity across suspected dyke zone
However, no diurnal correction was applied to the measured data, as it took approximately 45 minutes to collect the data all along the profile length. Similar to the observations made in resistivity wenner profiling, the flank of the dyke in contact with the host rock has indicated a drop in intensity of the order 120 nT followed by a sharp rise of 126 nT as shown in figure.4, possibly due to the presence of dolerite dyke itself. Small perturbations are seen in the magnetic signature within the zone of concern, due to isolated dyke boulders and overburden as was the case in resistivity profiling. c. Similarly VLF (very low frequency) survey was
carried out along the same profile line as that of resistivity and magnetic survey, with inter station interval of 2 m. The VLF instrument used was
(Scientrex Make) which measures the ellipticity of the magnetic field and also its tilt. Being a profiling tool it is assumed that VLF responds most prominently to the presence of vertical, conductive and shallow bodies (Murali Sabnavis and Patangay N.S., 1998). Generally, the location of the top of the body on a VLF profile may be obtained from a crossover of ellipticity and tilt percentage, signifying a change in the secondary field direction, which is visually seen in the field profile as shown
in figure.5.
The interpreted results of both wenner resistivity profiling and VLF have shown the presence of shallow, almost vertical contact between two contrasting formations (Granite & Dyke) with distinct resistivity range in the profile.
Fig. 5: Very Low Frequency (VLF) profile across suspected dyke zone
© 2017 Global Journals Inc. (US)
V
olum
e XVII
Issu
e III
Versio
n I
64
( B)
Globa
l Jo
urna
l of H
uman
Soc
ial Sc
ienc
e
-
Year
2017
Mapping Aquifer Bifurcation Through Integrated Geophysical and Tracer Studies in a Granite Terrain
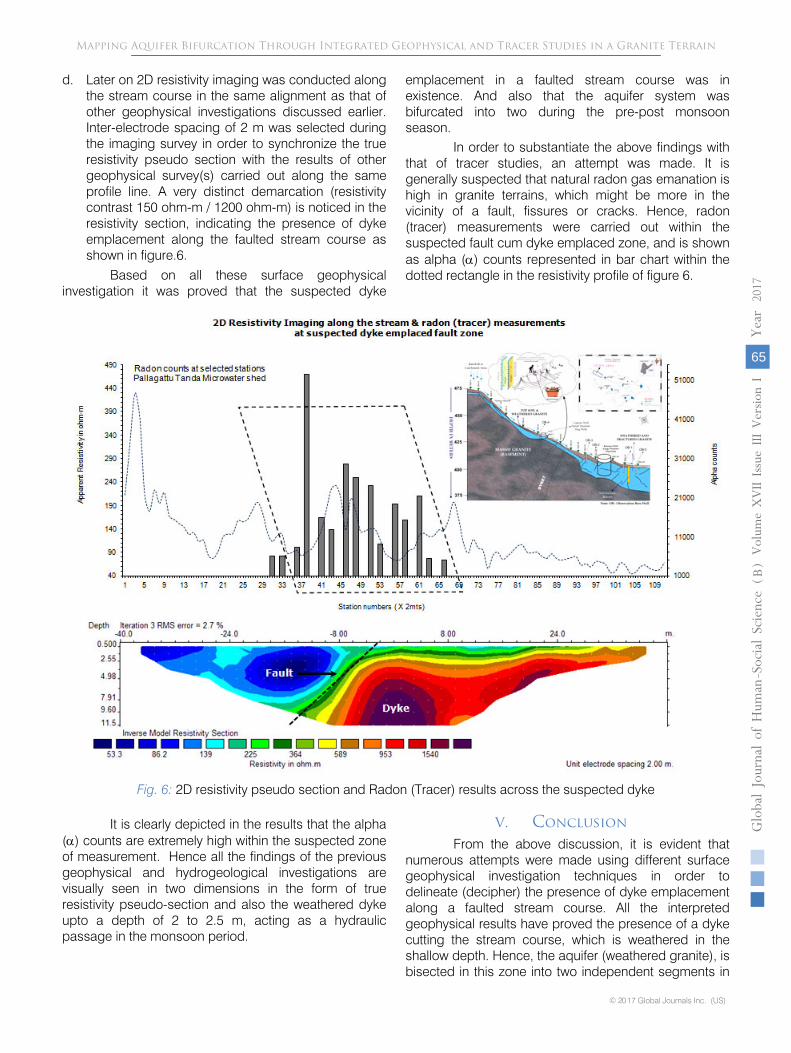
d. Later on 2D resistivity imaging was conducted along
the stream course in the same alignment as that of other geophysical investigations discussed earlier. Inter-electrode spacing of 2 m was selected during the imaging survey in order to synchronize the true resistivity pseudo section with the results of other geophysical survey(s) carried out along the same profile line. A very distinct demarcation (resistivity contrast 150 ohm-m / 1200 ohm-m) is noticed in the resistivity section, indicating the presence of dyke emplacement along the faulted stream course as shown in figure.6.
Based on all these surface geophysical investigation it was proved that the suspected dyke
emplacement in a faulted stream course was in existence. And also that the aquifer system was bifurcated into two during the pre-post monsoon season.
In order to substantiate the above findings with that of tracer studies, an attempt was made. It is generally suspected that natural radon gas emanation is high in granite terrains, which might be more in the vicinity of a fault, fissures or cracks. Hence, radon (tracer) measurements were carried out within the suspected fault cum dyke emplaced zone, and is shown as alpha (α) counts represented in bar chart within the dotted rectangle in the resistivity profile of figure 6.
Fig. 6: 2D resistivity pseudo section and Radon (Tracer) results across the suspected dyke
It is clearly depicted in the results that the alpha
(α) counts are extremely high within the suspected zone of measurement. Hence all the findings of the previous geophysical and hydrogeological investigations are visually seen in two dimensions in the form of true resistivity pseudo-section and also the weathered dyke upto a depth of 2 to 2.5 m, acting as a hydraulic passage in the monsoon period.
V. Conclusion
From the above discussion, it is evident that numerous attempts were made using different surface geophysical investigation techniques in order to delineate (decipher) the presence of dyke emplacement along a faulted stream course. All the interpreted geophysical results have proved the presence of a dyke cutting the stream course, which is weathered in the shallow depth. Hence, the aquifer (weathered granite), is bisected in this zone into two independent segments in
© 2017 Global Journals Inc. (US)
V
olum
e XVII
Issu
e III
Versio
n I
65
( B)
Globa
l Jo
urna
l of H
uman
Soc
ial Sc
ienc
e
-
Year
2017
Mapping Aquifer Bifurcation Through Integrated Geophysical and Tracer Studies in a Granite Terrain

the pre-monsoon season, when the water level drops below 2.5-3.0mts and the same is connected and behaves as a single unit in the post-monsoon season when the water level is shallow (almost the ground level). The finding of the entire study based on geophysical and tracer investigation(s) was useful in adopting suitable strategy for surface runoff and also to artificially recharge the groundwater aquifer system in the study area.
Acknowledgement
The author is thankful to Dr. D. Muralidharan (Retd. Scientist, NGRI) for his constant support and guidance and also under whose supervision the studies were executed. The author also expresses his gratitude to all the team members of groundwater replenishment division for their support in the field investigations. The author also extends his sincere thanks to the Director, CWPRS for her kind support and encouragement in publishing this work.
References References Referencias
1. Dr. Laurent Marescot (1995) “Electrical Surveying Part I: Resistivity method”, Lecture A.WS0506.
2. Dahlin T. (1996) “2D resistivity surveying for environmental and engineering applications”, First Break, 14, pp.275-284.
3. Keller G.V. and Frischknecht F.C. (1966) “Electrical methods in geophysical prospecting”, Pergamon Press Inc., Oxford.
4. Griffiths, D. H. & Turnbull, J. (1985). A multi-electrode array for resistivity surveying. First Break, 3(7), 16–20.
5. Rolland Andrade, (2009). “Sustainable Groundwater Development and Quality Management in Nalgonda District – Andhra Pradesh through Integrated Geohydrological and Artificial Recharge Approach”, Ph.D Thesis, Osmania University.
6. Murali Sabnavis and Patangay N.S., (1998) “Principles and application of Groundwater Geophysics”, Published by Association of Exploration Geophysicists, Pages. 1-419.
7. N.O. Mariita, (2007) “Magnetic Method”, Presented at Short Course II on Surface Exploration for Geothermal Resources, organized by UNU - GTP and KenGen, at Lake Naivasha, Kenya, 2 - 17 November.
8. Nabighian MN, Macnae JC (1991) “Time domain electromagnetic prospecting methods. In: Nabighian MN (ed) Electromagnetic methods in applied geophysics”, vol 2. Society of Exploration Geophysicists, Tulsa, OK, pp 427-520.
9. Robert G. Van No strand and Kenneth L. Cook, (1966), “Interpretation of Resistivity” Geological Survey Professional Paper 499 Geological Survey Professional Paper 499.
© 2017 Global Journals Inc. (US)
V
olum
e XVII
Issu
e III
Versio
n I
66
( B)
Globa
l Jo
urna
l of H
uman
Soc
ial Sc
ienc
e
-
Year
2017
Mapping Aquifer Bifurcation Through Integrated Geophysical and Tracer Studies in a Granite Terrain

Global Journals Inc. (US)
Guidelines Handbook 2017
www.GlobalJournals.org