mapping culture - western sydney university · mapping venues & infrastructure in the city of...
TRANSCRIPT
CULTUREVENUES & INFRASTRUCTURE IN THE CITY OF SYDNEY
FINAL REPORT SEPTEMBER 2016
MAPPING
IEN ANGDAVID ROWELIAM MAGEEALEXANDRA WONGTERESA SWISTDENIS ROUILLARDANDREA POLLIO
INSTITUTE FOR CULTURE AND SOCIETY
MAPPING
venues & infrastructurein the City of Sydney
Prepared by members of Western Sydney University's Institute for Culture and Society for the City of Sydney
September 2016
The project team Prof. Ien Ang Prof. David Rowe Dr. Liam Magee Dr. Alexandra Wong Dr. Teresa Swist Mr. Denis Rouillard Mr. Andrea Pollio
ISBN: 978-1-74108-435-1DOI: 10.4225/35/58b89d57f38a4
1
CULTURE
ACKNOWLEDGEMENTS
Western Sydney University’s Institute for Culture and Society (ICS) project team would like to acknowledge and thank the City of Sydney for the provision of funding and participation in this project, especially Lisa Colley, Ianto Ware and Hugh Nichols from the Research, Strategy and Corporate Planning Unit (Culture), and all the City of Sydney staff who contributed valuable ideas and support to this project.
We also would like to extend our thanks to Steve Hillier and Pinar Cabadag from the City of Sydney for the provision of the Floorspace and Employment Survey database and other GIS resources.
Our gratitude also goes to all the festival organisers, cultural organisations, individual artists and community organisations who disseminated, participated in and shared their experiences in our online survey. The project team would like to thank them for their time, openness and informative responses.
Notes This is an independent report from Western Sydney University to the City of Sydney. The accuracy and content of the report is the sole responsibility of the project team and its views do not necessarily represent the views of City of Sydney.
2
TABLE OF CONTENTS
Acknowledgements Table of Contents Lists of Tables List of Figures Abbreviations
Executive Summary
1. Introduction……………………………………………………….………12
1.1. Project overview and objectives 1.2. Project phases
2. Background……………………………………….……………………….16
2.1. The concept of culture 2.2. Classification of cultural industries 2.3. Relationship between culture, mapping and infrastructure 2.4. E xamples of cultural classification and resource mapping frameworks 2.5. City of Sydney cultural infrastructure: where to next?
3. Cultural mapping classi秜ᇘcation framework…….…….…… 40 3.1. Classification framework overview (rationale, development and value ) 3.2. Definition and characteristics of the six domains (spatial dimension) 3.3. Incorporation of the value-chain (relational dimension) 3.4. Application to this study (relevance and impact)
4. Methodology……………………………………………………………….52 4.1. Methodological challenges 4.2. Data sources 4.3. From GIS to GeoViz 4.4. The crowdsourcing survey
5. Findings and discussion….…………………………………………...56 5.1. Approach 5.2. Mapping of cultural venues by spatial type—all villages 5.3. Mapping of cultural venues by value chain role—all villages 5.4. Mapping venues by spatial type—selected villages
3
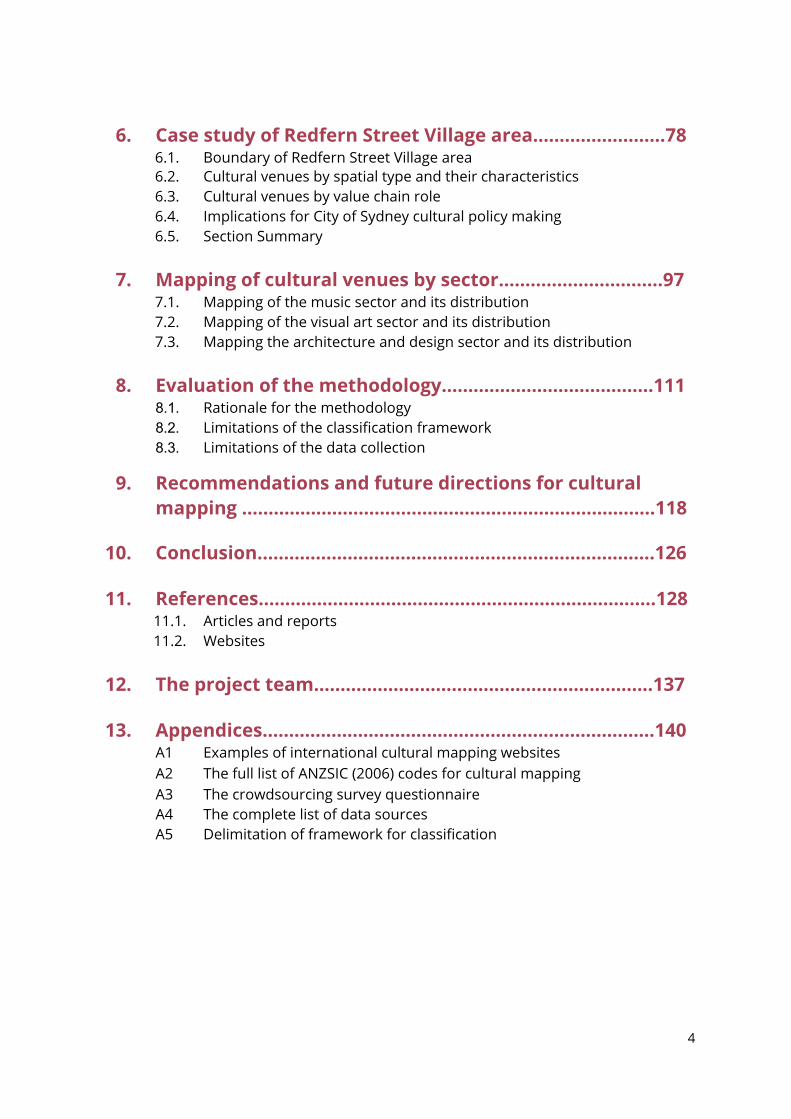
6. Case study of Redfern Street Village area…………….………78 6.1. Boundary of Redfern Street Village area 6.2. Cultural venues by spatial type and their characteristics 6.3. Cultural venues by value chain role 6.4. Implications for City of Sydney cultural policy making 6.5. Section Summary
7. Mapping of cultural venues by sector………………………….97 7.1. Mapping of the music sector and its distribution 7.2. Mapping of the visual art sector and its distribution 7.3. Mapping the architecture and design sector and its distribution
8. Evaluation of the methodology………………………………….111 8.1. Rationale for the methodology 8.2. Limitations of the classi୦�cation framework 8.3. Limitations of the data collection
9. Recommendations and future directions for cultural mapping ……...………………………………………………………..….118
10. Conclusion…………………………………………………………………126
11. References……………………………………………………….………..128 11.1. Articles and reports 11.2. Websites
12. The project team………..……………...……………………………..137
13. Appendices…………………..……………………………….…………..140 A1 Examples of international cultural mapping websites A2 The full list of ANZSIC (2006) codes for cultural mapping A3 The crowdsourcing survey questionnaire A4 The complete list of data sources A5 Delimitation of framework for classi୦�cation
4
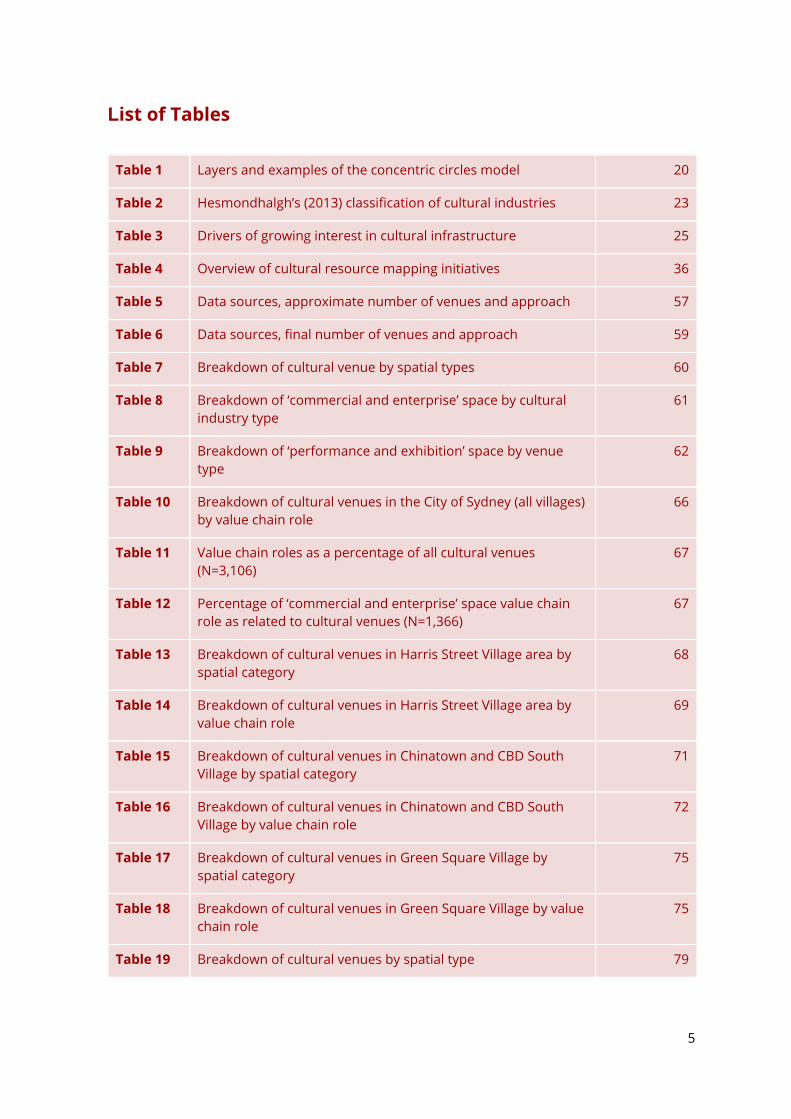
L ist of Tables
Table 1 Layers and examples of the concentric circles model 20
Table 2 Hesmondhalgh’s (2013) classiЄcation of cultural industries 23
Table 3 Drivers of growing interest in cultural infrastructure 25
Table 4 Overview of cultural resource mapping initiatives 36
Table 5 Data sources, approximate number of venues and approach 57
Table 6 Data sources, Єnal number of venues and approach 59
Table 7 Breakdown of cultural venue by spatial types 60
Table 8 Breakdown of ‘commercial and enterprise’ space by cultural industry type
61
Table 9 Breakdown of ‘performance and exhibition’ space by venue type
62
Table 10 Breakdown of cultural venues in the City of Sydney (all villages) by value chain role
66
Table 11 Value chain roles as a percentage of all cultural venues (N=3,106)
67
Table 12 Percentage of ‘commercial and enterprise’ space value chain role as related to cultural venues (N=1,366)
67
Table 13 Breakdown of cultural venues in Harris Street Village area by spatial category
68
Table 14 Breakdown of cultural venues in Harris Street Village area by value chain role
69
Table 15 Breakdown of cultural venues in Chinatown and CBD South Village by spatial category
71
Table 16 Breakdown of cultural venues in Chinatown and CBD South Village by value chain role
72
Table 17 Breakdown of cultural venues in Green Square Village by spatial category
75
Table 18 Breakdown of cultural venues in Green Square Village by value chain role
75
Table 19 Breakdown of cultural venues by spatial type 79
5
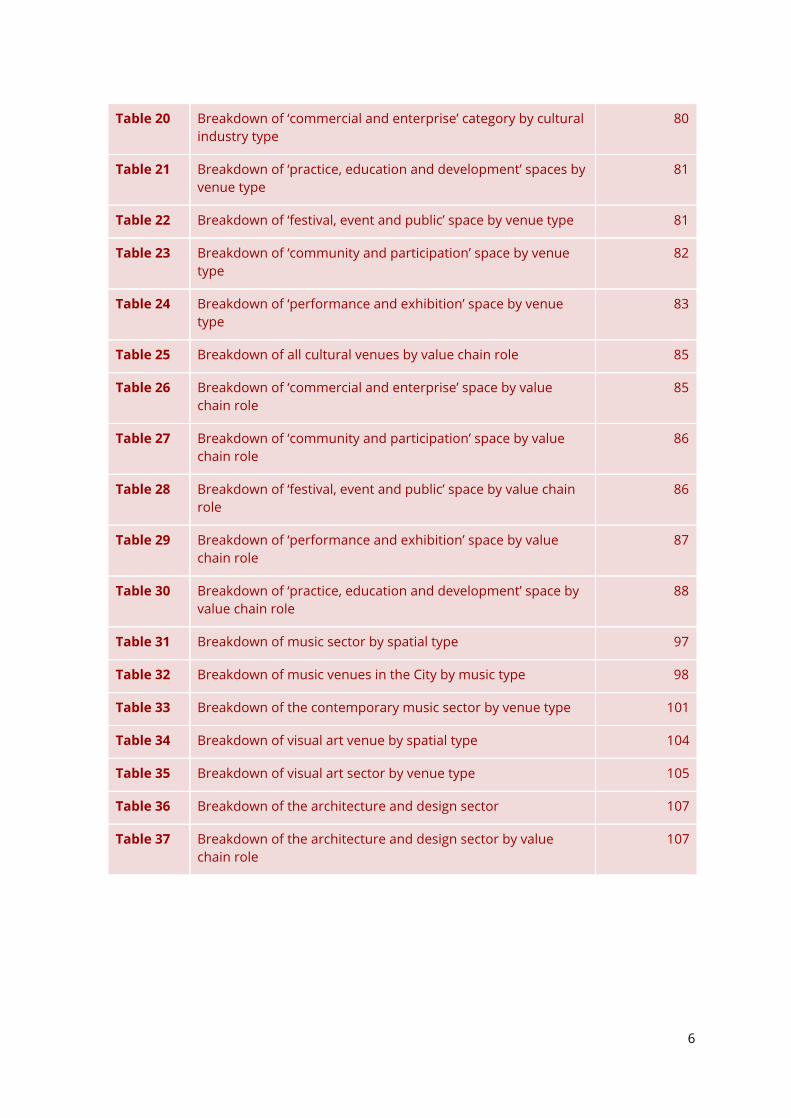
Table 20 Breakdown of ‘commercial and enterprise’ category by cultural industry type
80
Table 21 Breakdown of ‘practice, education and development’ spaces by venue type
81
Table 22 Breakdown of ‘festival, event and public’ space by venue type 81
Table 23 Breakdown of ‘community and participation’ space by venue type
82
Table 24 Breakdown of ‘performance and exhibition’ space by venue type
83
Table 25 Breakdown of all cultural venues by value chain role 85
Table 26 Breakdown of ‘commercial and enterprise’ space by value chain role
85
Table 27 Breakdown of ‘community and participation’ space by value chain role
86
Table 28 Breakdown of ‘festival, event and public’ space by value chain role
86
Table 29 Breakdown of ‘performance and exhibition’ space by value chain role
87
Table 30 Breakdown of ‘practice, education and development’ space by value chain role
88
Table 31 Breakdown of music sector by spatial type 97
Table 32 Breakdown of music venues in the City by music type 98
Table 33 Breakdown of the contemporary music sector by venue type 101
Table 34 Breakdown of visual art venue by spatial type 104
Table 35 Breakdown of visual art sector by venue type 105
Table 36 Breakdown of the architecture and design sector 107
Table 37 Breakdown of the architecture and design sector by value chain role
107
6
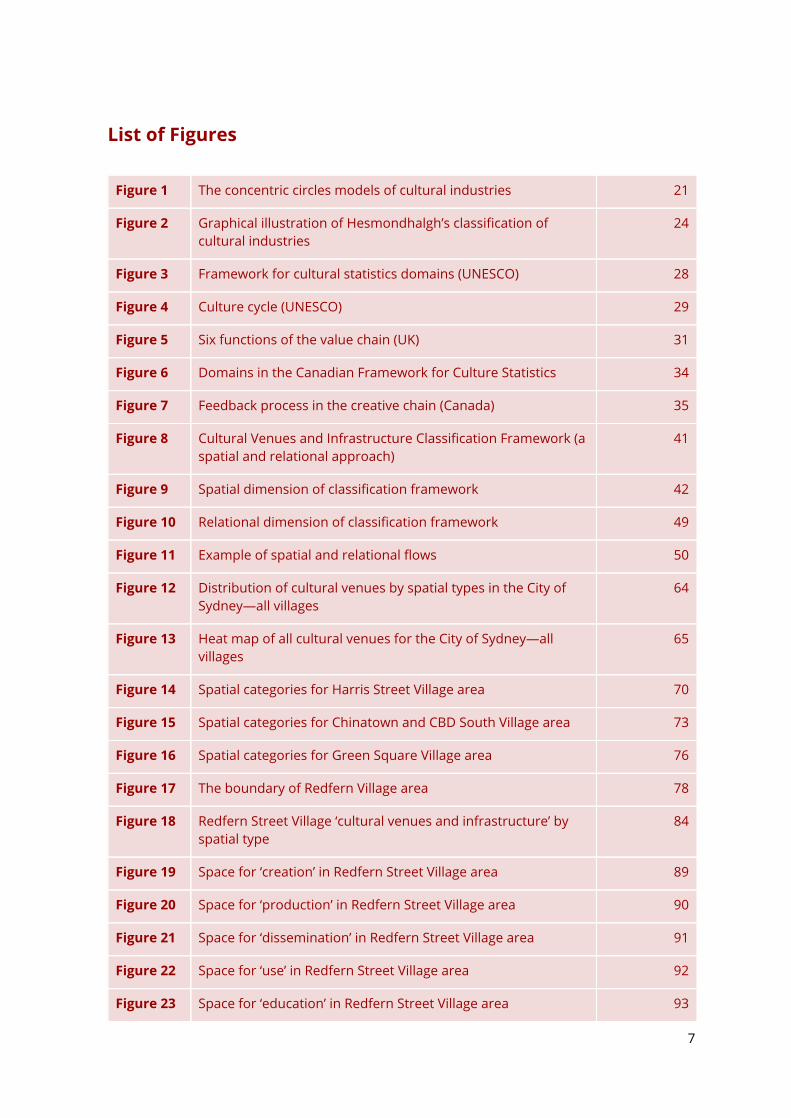
List of Figures
Figure 1 The concentric circles models of cultural industries 21
Figure 2 Graphical illustration of Hesmondhalgh’s classification of cultural industries
24
Figure 3 Framework for cultural statistics domains (UNESCO) 28
Figure 4 Culture cycle (UNESCO) 29
Figure 5 Six functions of the value chain (UK) 31
Figure 6 Domains in the Canadian Framework for Culture Statistics 34
Figure 7 Feedback process in the creative chain (Canada) 35
Figure 8 Cultural Venues and Infrastructure Classification Framework (a spatial and relational approach)
41
Figure 9 Spatial dimension of classification framework 42
Figure 10 Relational dimension of classification framework 49
Figure 11 Example of spatial and relational flows 50
Figure 12 Distribution of cultural venues by spatial types in the City of Sydney—all villages
64
Figure 13 Heat map of all cultural venues for the City of Sydney—all villages
65
Figure 14 Spatial categories for Harris Street Village area 70
Figure 15 Spatial categories for Chinatown and CBD South Village area 73
Figure 16 Spatial categories for Green Square Village area 76
Figure 17 The boundary of Redfern Village area 78
Figure 18 Redfern Street Village ‘cultural venues and infrastructure’ by spatial type
84
Figure 19 Space for ‘creation’ in Redfern Street Village area 89
Figure 20 Space for ‘production’ in Redfern Street Village area 90
Figure 21 Space for ‘dissemination’ in Redfern Street Village area 91
Figure 22 Space for ‘use’ in Redfern Street Village area 92
Figure 23 Space for ‘education’ in Redfern Street Village area 93
7
Figure 24 Venues in the music sector by spatial type 99
Figure 25 Density of the music sector in the City 100
Figure 26 Density of contemporary music venues in the City 102
Figure 27 Visual art venues by spatial type 103
Figure 28 Density of visual art venues in the City 106
Figure 29 Distribution of the architecture and design sector in the City 109
Figure 30 Density of the architecture and design sector in the City 110
Abbreviations
ABS Australian Bureau of Statistics
AGSEI Australian Graduate School of Engineering Innovation
ANZSIC Australian and New Zealand Standard Industrial Classification
APRA-AMCOS Australian Performing Right Association and Australian Mechanical Copyright Owners Society
CAMRA Cultural Asset Mapping for Regional Australia
CASE Culture and Sport Evidence (UK)
CCI Cultural and Creative Industries
CCNC Creative City Network of Canada
CISAC Confederation of Societies of Authors and Composers
DCMS Department for Culture, Media and Sport (UK)
ESSnet-Culture European Statistical System Network on Culture
FES Floorspace and Employment Survey
GIS Geographical Information System
LCRD London Cultural Resource Database (Canada)
LGA Local Government Area
MCPI Municipal Cultural Planning Incorporated
MLA Museums, Libraries and Archives
8
NAICS North American Industry Classification System
NAVA National Association for the Visual Arts
NCVO National Council for Voluntary Organisations
SFF Sydney Fringe Festival
SHFA Sydney Harbour Foreshore Authority
SIC Standard Industrial Classification
SOC Standard Occupation Classification
UNESCO United Nations Educational, Scientific and Cultural Organisation
UTS University of Technology Sydney
VGI Volunteer Geographic Information
9
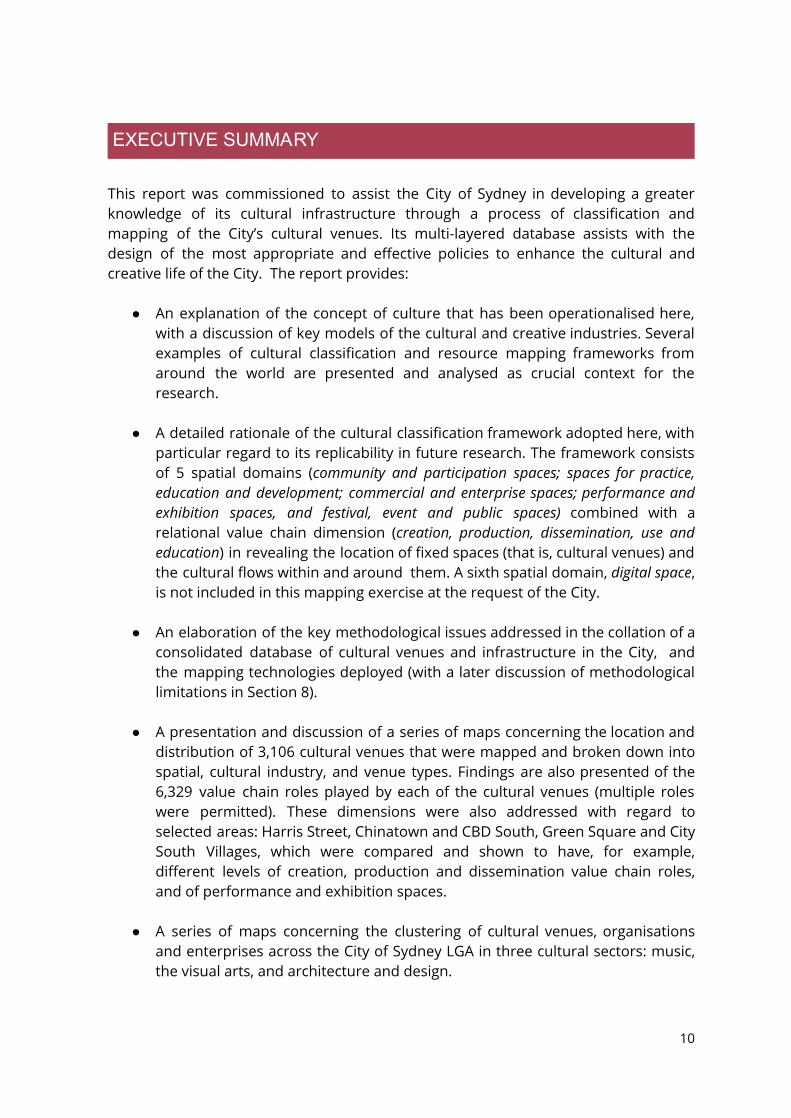
EXECUTIVE SUMMARY This report was commissioned to assist the City of Sydney in developing a greater knowledge of its cultural infrastructure through a process of classification and mapping of the City’s cultural venues. Its multi-layered database assists with the design of the most appropriate and effective policies to enhance the cultural and creative life of the City. The report provides:
● An explanation of the concept of culture that has been operationalised here, with a discussion of key models of the cultural and creative industries. Several examples of cultural classification and resource mapping frameworks from around the world are presented and analysed as crucial context for the research.
● A detailed rationale of the cultural classification framework adopted here, with
particular regard to its replicability in future research. The framework consists of 5 spatial domains ( community and participation spaces; spaces for practice, education and development; commercial and enterprise spaces; performance and exhibition spaces, and festival, event and public spaces) combined with a relational value chain dimension ( creation, production, dissemination, use and education ) in revealing the location of fixed spaces (that is, cultural venues) and the cultural flows within and around them. A sixth spatial domain, digital space , is not included in this mapping exercise at the request of the City.
● An elaboration of the key methodological issues addressed in the collation of a
consolidated database of cultural venues and infrastructure in the City, and the mapping technologies deployed (with a later discussion of methodological limitations in Section 8).
● A presentation and discussion of a series of maps concerning the location and
distribution of 3,106 cultural venues that were mapped and broken down into spatial, cultural industry, and venue types. Findings are also presented of the 6,329 value chain roles played by each of the cultural venues (multiple roles were permitted). These dimensions were also addressed with regard to selected areas: Harris Street, Chinatown and CBD South, Green Square and City South Villages, which were compared and shown to have, for example, different levels of creation, production and dissemination value chain roles, and of performance and exhibition spaces.
● A series of maps concerning the clustering of cultural venues, organisations
and enterprises across the City of Sydney LGA in three cultural sectors: music, the visual arts, and architecture and design.
10
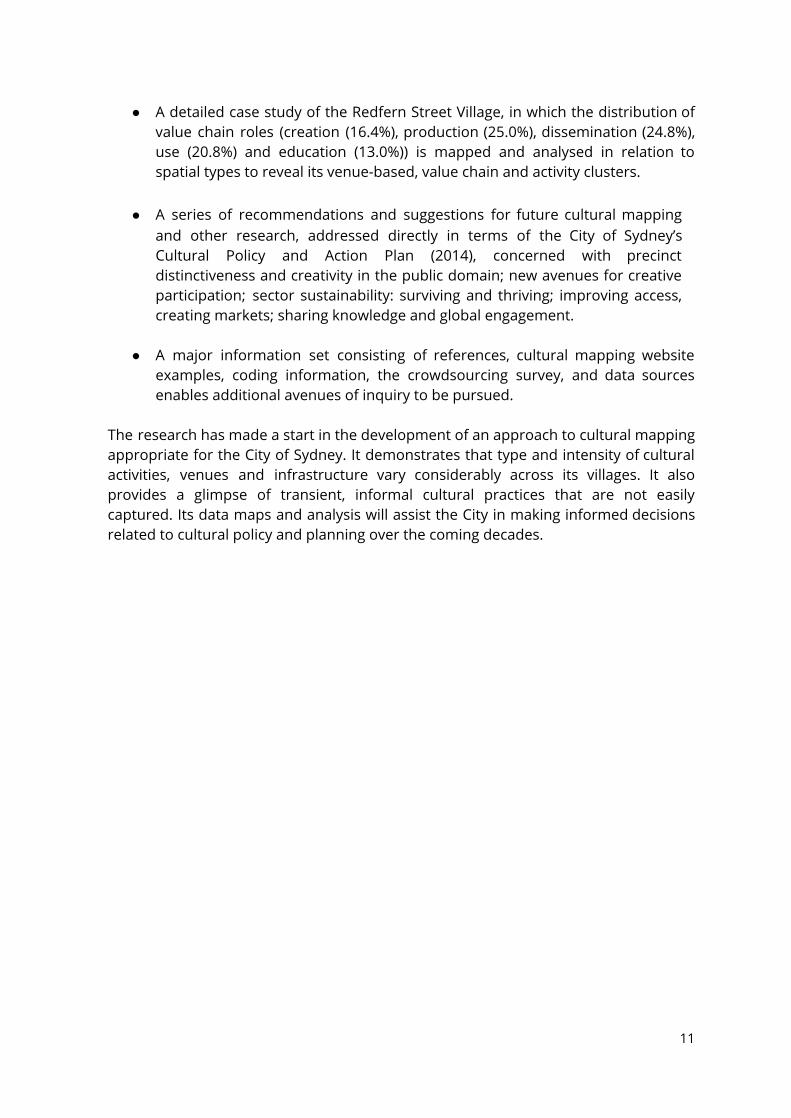
● A detailed case study of the Redfern Street Village, in which the distribution of value chain roles (creation (16.4%), production (25.0%), dissemination (24.8%), use (20.8%) and education (13.0%)) is mapped and analysed in relation to spatial types to reveal its venue-based, value chain and activity clusters.
● A series of recommendations and suggestions for future cultural mapping
and other research, addressed directly in terms of the City of Sydney’s Cultural Policy and Action Plan (2014), concerned with precinct distinctiveness and creativity in the public domain; new avenues for creative participation; sector sustainability: surviving and thriving; improving access, creating markets; sharing knowledge and global engagement.
● A major information set consisting of references, cultural mapping website
examples, coding information, the crowdsourcing survey, and data sources enables additional avenues of inquiry to be pursued.
The research has made a start in the development of an approach to cultural mapping appropriate for the City of Sydney. It demonstrates that type and intensity of cultural activities, venues and infrastructure vary considerably across its villages. It also provides a glimpse of transient, informal cultural practices that are not easily captured. Its data maps and analysis will assist the City in making informed decisions related to cultural policy and planning over the coming decades.
11
1. INTRODUCTION
1.1 Project overview and objectives This project, entitled ‘Mapping cultural venues and infrastructure in the City of Sydney local government area (LGA)’, is a key action under the City of Sydney’s Strategic Plan Sustainable Sydney 2030 , an ongoing commitment to achieve the vision of a green, global and connected city. It is particularly relevant to Strategic Direction 7 of the plan to develop a cultural and creative city. This project has the following objectives:
● Develop a classification system of cultural venues and infrastructure as a framework for mapping existing, new and emerging cultural venues and infrastructure in the city;
● Collect and analyse relevant data of cultural venues and infrastructure in 10 village areas within the City of Sydney;
● Create maps for the City to disseminate information concerning cultural venues and infrastructure to the benefit of the cultural sector and general public;
● Submit a full final report (detailed methodology and results of venue and infrastructure mapping) and draw out recommendations on cultural cluster and other policy and planning implications.
Western Sydney University’s Institute for Culture and Society project team has been working with the City of Sydney to map cultural venues and infrastructure in the city, with an aim to develop a ‘Cultural Venues and Infrastructure Database’ to improve the volume, visibility and analysis of related spatial data. This project supports the identified need to ‘deal more broadly with arts, creative enterprise, and community facilities to increase understanding of the relationship between specific sectors’ as outlined in the Request for Quotation document (no: 1916) (City of Sydney, 2016a, p.4). Mapping and visualising the City of Sydney’s cultural infrastructure provides a strong foundation for identifying these interrelationships. It is also important to the tasks of maximising current assets, identifying hidden or under-utilised spaces, and supporting new cultural and creative activities. This project enables layering of further data - such as planning and regulatory frameworks, rental and property prices - which can produce new knowledge and insights for a range of interested and involved parties to inform future funding, research and planning activities. We view the impact of the design and development of this database as being twofold: first, informing the proposed Cultural Infrastructure Plan; and, second, as a foundation for future cultural resource data to be added (e.g., digital events) to expand and enrich the database and the City of Sydney’s work in the cultural sector.
12
1.2 Project phases This project aligns with the following aspect of the City’s Creative City Cultural Policy and Action Plan (2014): ‘Map neighbourhood cultural activity and infrastructure, and plan for ways to serve neighbourhoods by identifying gaps and promoting current cultural assets’ (p.42). It consists of three phases:
● Phase 1: development of a cultural mapping classification framework ● Phase 2: collection of data from various sources, including the City of Sydney
Floorspace and Employment survey, City of Sydney’s existing database, desktop research on various websites and online directories, and the crowdsourcing survey
● Phase 3: analysis of data, creation of maps, submission of final report and promotion of cultural map via community roadshow (to be decided with the City of Sydney).
Phase 1: Development of the cultural mapping classi秜ᇘcation framework Underpinning this program of work is the development of an appropriate classification framework based on the City’s Cultural Policy and Action Plan (2014). This framework clearly describes five areas for grouping cultural infrastructure (broadly, arts, cultural and creative venues and businesses), to which we have added the following headings:
● Community and participatory spaces : Cultural infrastructure for 'active' participation and spaces with resources and facilities for active making, doing and skill-sharing (e.g., libraries, archives, and maker-spaces)
● Practice, education and development spaces : Cultural infrastructure for professional creative practice and art form development, such as rehearsal rooms, artist studios, studio and workshop spaces, relevant education providers (including art, theatre, dance and film schools), and co-working spaces
● Commercial and enterprise spaces: Spaces for creative enterprise, including retail (e.g., book and record stores)
● Performance and exhibition spaces: Cultural venues and infrastructure for audiences or spectatorship (e.g., major performing arts venues, contemporary arts venues, live music venues, theatres, museums)
● Festival, event and public spaces: Spaces for temporary, unplanned or 'special event' cultural use in the public domain (e.g., park, public art, and pop-up spaces).
13
This framework provides a foundation for replicable data gathering in the future. The details of this classification framework and its justifications are outlined in Section 3 of this report. Phase 2: Collection of data from various sources and data validation Identification of cultural venues and infrastructure, data sourcing and assessment have been guided by the above framework. The basic data source is the 2012 City of Sydney Floorspace and Employment Survey (FES). That survey provides geocoded data on the current land use, the types of occupying business, employment level, and floor space measures of the properties based on the 2006 Australian and New Zealand Standard Industrial Classification (ANZSIC) at 4-digit level, thus allowing extraction of information about cultural venues and infrastructure based on the codes from various divisions. However, there are also limitations regarding the FES, as the codes of ANZSIC do not cover all cultural venues, especially non-commercial and informal venues. Also, the most recent FES was conducted in 2012, which means that it doesn’t capture changes in the past few years. In order to address these limitations of FES data, a range of complementary data sources are used as appropriate. These include:
● Quantitative data provided by the City of Sydney based on its existing database compiled for other purposes
● Phone books and other web-based directories, art and cultural related websites
● Online surveys asking cultural communities to nominate informal cultural spaces.
All cultural venues and infrastructure identified for this project were checked and validated by the research team. Venues that are located outside the City of Sydney LGA have been filtered out, non-cultural venues removed, and other cultural venues which belong to any of our designed spatial domains added to the database. The consolidated database was transferred to ArcGIS, and each entry linked to a geocode to prepare for map creation at Phase 3. Phase 3: Analysis of data, creation of maps, community engagement activities Draft maps and preliminary findings have been presented to City of Sydney in the interim report in June 2016. This final report provides a detailed analysis of mapping results and discussion of findings.
14
Cultural mapping has advanced significantly in recent years following innovations in GIS technologies and geo-spatial analysis. For example, the City of London in Ontario, Canada has produced the London Cultural Resource Database (LCRD), a ‘centralised inventory of information about London’s cultural resources’ (Canadian Urban Institute, 2013, p.5). In addition, software programs such as Tableau , StatPlanet and OpenStreetMap offer ways to provide well-designed, visually appealing interactive maps for users (e.g., St Thomas Cultural Map, see http://bit.ly/1Lr0xk2 ) (see Appendix 1) The accessibility and usability of these maps are vital for sparking conversations, questions and interest which can inform future planning and collaborations. Hence, we have proposed to include a public engagement phase after the completion of this project, involving organisation of a roadshow at public libraries to raise awareness of this project’s outputs, as well as to promote interest in, and use of, the cultural maps that it has generated. In our original tender document we proposed to create a number of interactive maps via the key cultural domains and associated sub-categories (detailed in Section 3) to explore cultural venues and infrastructure across the city at three scales: the City of Sydney scale, the village scale and the village comparison scale. Whilst we understand the concerns and reservations of the City of Sydney about the long-term maintenance issues regarding these maps, we believe that they have potential scope for further development of this project in future.
15
2. BACKGROUND
The Institute for Culture and Society, Western Sydney University was engaged by the City of Sydney to undertake a systematic mapping of cultural venues and infrastructure within the City of Sydney Local Government Area (LGA). One of the key objectives of the project was to develop a cultural mapping methodology that is both aligned with the City of Sydney Cultural Policy and Action Plan (2014) and consistent with global best practice. In particular:
As a capital city government, the City has many means of supporting Sydney’s cultural life and creative communities, and fostering and promoting individual and collaborative creative expression. It also has a special leadership role, including planning for cultural infrastructure and precincts as part of its urban-planning process. The ubiquitous interweaving of culture and creativity into every aspect of life also means it is sensitive to government regulations and policy in all areas. (p. 18)
In view of this position taken by the City of Sydney, the project team has reviewed cultural studies, cultural policy, cultural mapping, sociological, urban studies and critical geography literature (alongside government, council and media reports) to explore the following topics:
● The concept of culture ● Classification of culture: the definition debates ● Relationships between culture, mapping and infrastructure ● Three examples (plus an overview) ● City of Sydney: where to next?
This section of the report aims to provide a brief synthesis of the interrelationship between cultural concepts, classifications, mapping, infrastructure and policy making. To support our analysis, we highlight pivotal processes that create cultural infrastructure, as well as approaches being used in other countries, before highlighting some of the distinctive challenges and opportunities facing the City of Sydney. This discussion demonstrates how a blend of policy, practice and academic literature has informed the classification framework described in Section 3 .
16
2.1 The concept of culture
2.1.1 De秜ᇘning culture Definitions of culture are highly variable, arising from different disciplines and intellectual traditions. The narrow definition of culture, also known as the ‘culturalist’ approach, is based on judgements of artistic, aesthetic or symbolic value and generally embraces selected forms of artistic activities such as music, theatre, dance, sculpture, and literature. On the other hand, the ‘anthropological’ approach adopts a broad definition of culture, which is defined as a ‘whole way of life of a distinct people or other social group’ (Williams, 1981, p.11). In other words, culture involves a wide range of human activities, including economic and political processes, educational institutions, social programs, environment, recreational, customs and traditions, artistic and heritage activities, technology and communication industries, and religious activities. However, as Harrington (2004) has pointed out, it is increasingly difficult to draw a distinction between culturalist and anthropological approaches, as art and culture cannot separate themselves from their social contexts and relations (Harrington, 2004). In order to take full account of the blurring of the distinction between these two approaches, this report adopts the broad definition of culture proposed by the United Nations Educational, Scientific and Cultural Organisation (UNESCO), which defines it as ‘the set of distinctive spiritual, material, intellectual and emotional features of society or a social group, that encompasses, not only art and literature, but lifestyles, ways of living together, value systems, traditions and beliefs’ (UNESCO, 2001, p.9). 2.1.2 From cultural industries to creative industries: the de秜ᇘnition
debate In cultural theory, the concept of cultural industries originated from the critique of art and culture under industrial capitalism offered by neo-Marxist theorists. According to Hartley et al. (2012), Adorno and Horkheimer coined the term ‘culture industry’ in 1947 to refer to aesthetic forms, such as art, music and literature, that had been integrated into the capitalist system and become industrialised and commodified, leading to growing uniformity and triviality (Adorno and Horkheimer, 1947; Hartley et al., 2012). Adorno and Horkheimer’s pessimistic notion, however, has received much criticism. For instance, Garnham (2011) argues that a wide range of cultural forms and ideas
17
can co-exist in a capitalist economic system, thus leading to greater diversity of cultural products for consumers. Adorno and Horkheimer’s critique that ‘mass culture and commercial markets led to a debased form of culture’ (Flew, 2011) still underpins many contemporary responses to the concept of the cultural industries. Uneasiness about primarily profit-making companies being involved in the production of culture, though, is also accompanied by the acknowledgement of the cultural sector as a major employer. Since the 1980s the idea of the cultural industries has been rather less contentious. According to O’Connor (2000), in the UK context it generally referred to commercially operated cultural activities which fell outside the public funding system, and involves a whole range of cultural goods that people consumed. The rapid development of the cultural industries in the 1990s, in the wake of the de-industrialisation of Western cities, has led to growing recognition of the contribution of the arts and cultural industries to the economy. The UK’s Department for Culture, Media & Sport (DCMS), created in 1997 under the newly-installed Blair Labour government, introduced the concept of ‘creative industries’ to acknowledge the expansion of cultural industries to include related sectors such as education, information technology, and media production such as broadcasting, music recording and film . In its 1998 Creative Industry Mapping Document, creative industries were defined as ‘those industries which have their origin in individual creativity, skill and talent and which have a potential for wealth and job creation through generation and exploitation of intellectual property’ (DCMS, 2001, p.5). This UK-originating conception of creative industries was quickly taken up in Australia (Stevenson, Rowe and McKay, 2010; Stevenson, McKay, and Rowe, 2010), where humanities scholars such as Cunningham (2005) and Hartley (2005) viewed the concept of creative industries as providing a more inclusive and contemporary understanding of the field. Hartley (2005) viewed the concept of the ‘creative industries’ as more relevant in recognising the convergence of art and mass media in the digital era, as well as the growing role of consumers not only as users, but also as co-creators (so-called ‘prosumers’). Cunningham (2005), similarly, saw the concept of creative industries as superseding that of the cultural industries on the grounds that it:
● recognises the value of creativity in the digitised ‘new economy’ ● identifies the convergence of arts, media and design sectors ● incorporates a spectrum of commercial and non-commercial arts, media and
design activities (Cunningham, 2005, p.284). However, other scholars, such as the UK-based Hesmondhalgh and Pratt (2005), found the concept of creativity to be too vague, diluting the significance of the cultural dimension of these industries whilst artificially linking them to the ICT sectors. More importantly, Hesmondhalgh (2013) argues that the concept of creative
18
industries fails to recognise the disadvantages of the marketisation and commodification of culture, and the precarious nature of most cultural/creative labour. Hesmondhalgh prefers the term cultural industries to creative industries as it draws attention to the tradition of critical thinking about cultural industries, which is ‘complex, ambivalent and contested’, pointing out that ‘using the term cultural industries’ signals not only an awarenesses of the problems of the industrialisation of culture, but also a refusal to simplify assessment and explanation (Hesmondhalgh, 2013, p.25). It also, he argues, retains an important emphasis on the cultural production and circulation of ‘texts’ of various kinds. Hesmondhalgh's concern signals a return to the ambivalence toward the alignment of culture and industry noted earlier. In spite of these continuing theoretical and conceptual debates, the term ‘cultural industries’ tends in practice to be used interchangeably or simultaneously with that of ‘creative industries’ in international organisations such as the European Union and UNESCO, in many countries in east Asia such as China, Japan, and Korea, as well as in Australia and New Zealand (Flew, 2011). Sometimes, nonetheless, an organisation such as UNESCO strategically differentiates the cultural and the creative industries:
The term “cultural industries” is used almost interchangeably with the concept of “creative industries”. Whereas the notion of ‘cultural industries’ emphasises the cultural heritage, and traditional and artistic elements of creativity, the notion of ‘creative industries’ tends to place emphasis on individual creative talent and innovation, and on the exploitation of intellectual property (UNESCO, 2007, p.11)
Whilst such definitional distinction may not be viewed as important in many contexts, in this report we use the term ‘cultural industries’ in order to acknowledge its important intellectual trajectory and the complex empirical relationship between culture, commerce, industry, economy, aesthetics, politics and meaning creation.
2.2 Classi秜ᇘcation of cultural industries
There are a number of ways to categorise the cultural industries. Below we introduce two models, each based on different principles and interpretation of cultural industries. The first is the concentric circles model developed by Australian cultural economist David Throsby (2008), which regards cultural industries as a spectrum of sectors ranging from the cultural to the commercial. The second is by the above-mentioned David Hesmondhalgh (2013), and which is based on a continuum of sectors involving the production of symbolic ‘texts’ and extensive user/consumer reach.
19
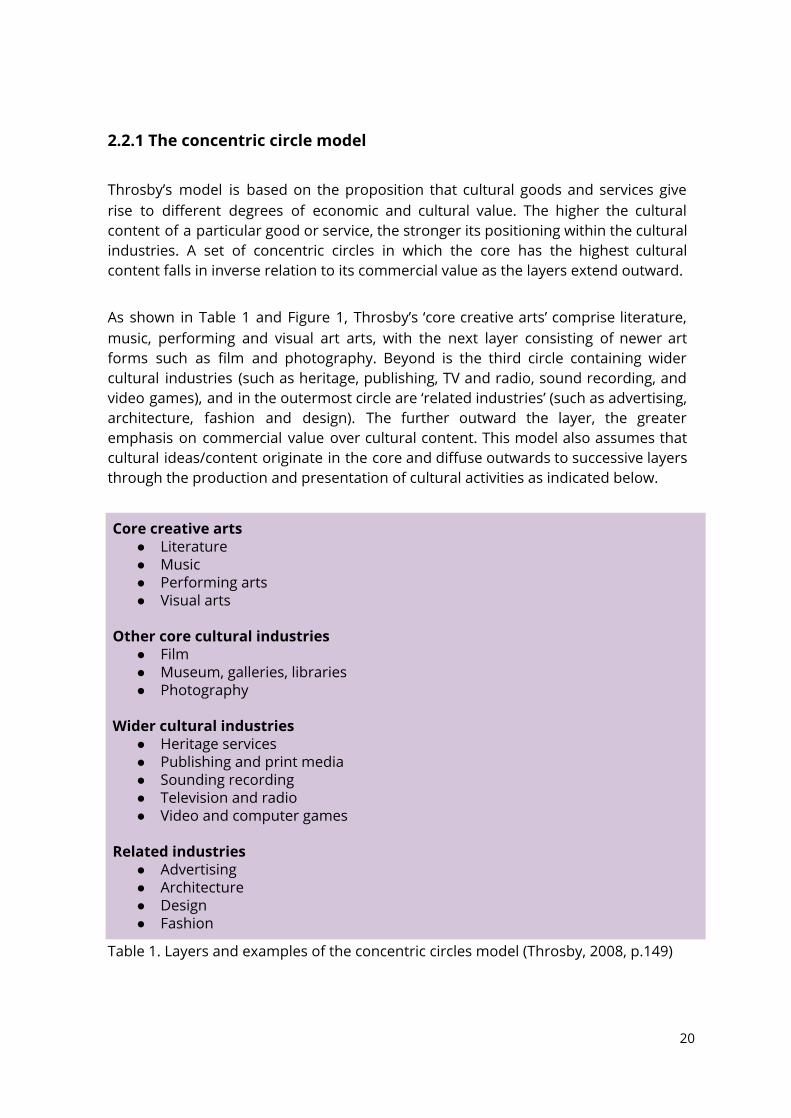
2.2.1 The concentric circle model Throsby’s model is based on the proposition that cultural goods and services give rise to different degrees of economic and cultural value. The higher the cultural content of a particular good or service, the stronger its positioning within the cultural industries. A set of concentric circles in which the core has the highest cultural content falls in inverse relation to its commercial value as the layers extend outward. As shown in Table 1 and Figure 1, Throsby’s ‘core creative arts’ comprise literature, music, performing and visual art arts, with the next layer consisting of newer art forms such as film and photography. Beyond is the third circle containing wider cultural industries (such as heritage, publishing, TV and radio, sound recording, and video games), and in the outermost circle are ‘related industries’ (such as advertising, architecture, fashion and design). The further outward the layer, the greater emphasis on commercial value over cultural content. This model also assumes that cultural ideas/content originate in the core and diffuse outwards to successive layers through the production and presentation of cultural activities as indicated below.
Core creative arts ● Literature ● Music ● Performing arts ● Visual arts
Other core cultural industries
● Film ● Museum, galleries, libraries ● Photography
Wider cultural industries
● Heritage services ● Publishing and print media ● Sounding recording ● Television and radio ● Video and computer games
Related industries
● Advertising ● Architecture ● Design ● Fashion
Table 1. Layers and examples of the concentric circles model (Throsby, 2008, p.149)
20
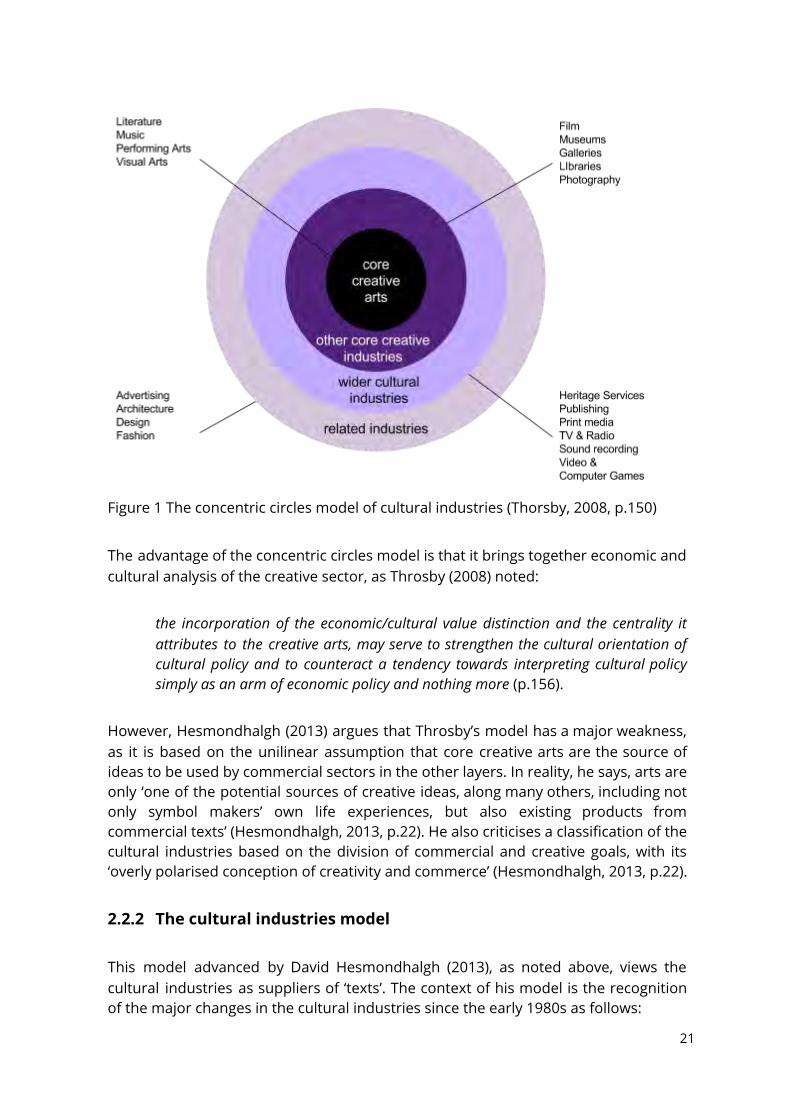
Figure 1 The concentric circles model of cultural industries (Thorsby, 2008, p.150) The advantage of the concentric circles model is that it brings together economic and cultural analysis of the creative sector, as Throsby (2008) noted:
the incorporation of the economic/cultural value distinction and the centrality it attributes to the creative arts, may serve to strengthen the cultural orientation of cultural policy and to counteract a tendency towards interpreting cultural policy simply as an arm of economic policy and nothing more (p.156).
However, Hesmondhalgh (2013) argues that Throsby’s model has a major weakness, as it is based on the unilinear assumption that core creative arts are the source of ideas to be used by commercial sectors in the other layers. In reality, he says, arts are only ‘one of the potential sources of creative ideas, along many others, including not only symbol makers’ own life experiences, but also existing products from commercial texts’ (Hesmondhalgh, 2013, p.22). He also criticises a classification of the cultural industries based on the division of commercial and creative goals, with its ‘overly polarised conception of creativity and commerce’ (Hesmondhalgh, 2013, p.22).
2.2.2 The cultural industries model This model advanced by David Hesmondhalgh (2013), as noted above, views the cultural industries as suppliers of ‘texts’. The context of his model is the recognition of the major changes in the cultural industries since the early 1980s as follows:
21
● Cultural industries have moved closer to the centre of economic action in
many countries ● Radical changes to the ownership and organisation of cultural industries ● Increasingly complex relationships between large, medium, and small cultural
companies ● Digitisation, the internet and mobile telephone have changed the ways in
which audiences gain access to content ● Cultural products increasingly circulate across national borders ● Greater emphasis on audience research, marketing and address ‘niche’
audiences ● Traditional public ownership and regulations of cultural industries have been
reduced ● Increased business spending on advertising has helped rapid growth of the
cultural industries ● More products based on different forms of ‘text’ (i.e., content of cultural works
of all kinds) across a variety of genres and cultural activities (Hesmondhalgh, 2013, p.2-3).
Hesmondhalgh (2013) defines art as the ‘manipulation of symbols for the purpose of entertainment, information and even enlightenment’. His concept of cultural industries is involved directly in the production of social meanings, with the primary aim of communicating with audiences. As Table 2 and Figure 2 (below) show, Hesmondhalgh’s model is significantly different from Throsby’s, as he applies a different axial principle to the classification of cultural industries. He places those industrialised forms of production which generate most cultural activity in the centre, and less-industrialised forms which generate less cultural activity on the outside. The rationale for this model is that he considers the cultural industries that make and circulate ‘texts’ to have great influence on our understanding and knowledge of 1
the world. Therefore, he places ‘media’ at the core of cultural industries, as they are primarily involved in textual production and circulation:
We are in巗マuenced not only by informational text, such as newspapers, broadcast news programmes, documentaries and analytical books, but also by entertainment. Films, TV series, comics, music, video games, and so on provide us with recurring representations of the world and so act as a kind of reporting. Just as crucially, they draw on and help to constitute inner, private lives and our public selves: our fantasies, emotions and identities ( Hesmondhalgh, 2013, p.4)
1 Hesmondhalgh (2013) uses the term ‘text’ to refer to the content of cultural works of all kinds, the programmes, films, records, books, comics images, magazines, newspapers and so on produced by the cultural industries (p.3)
22
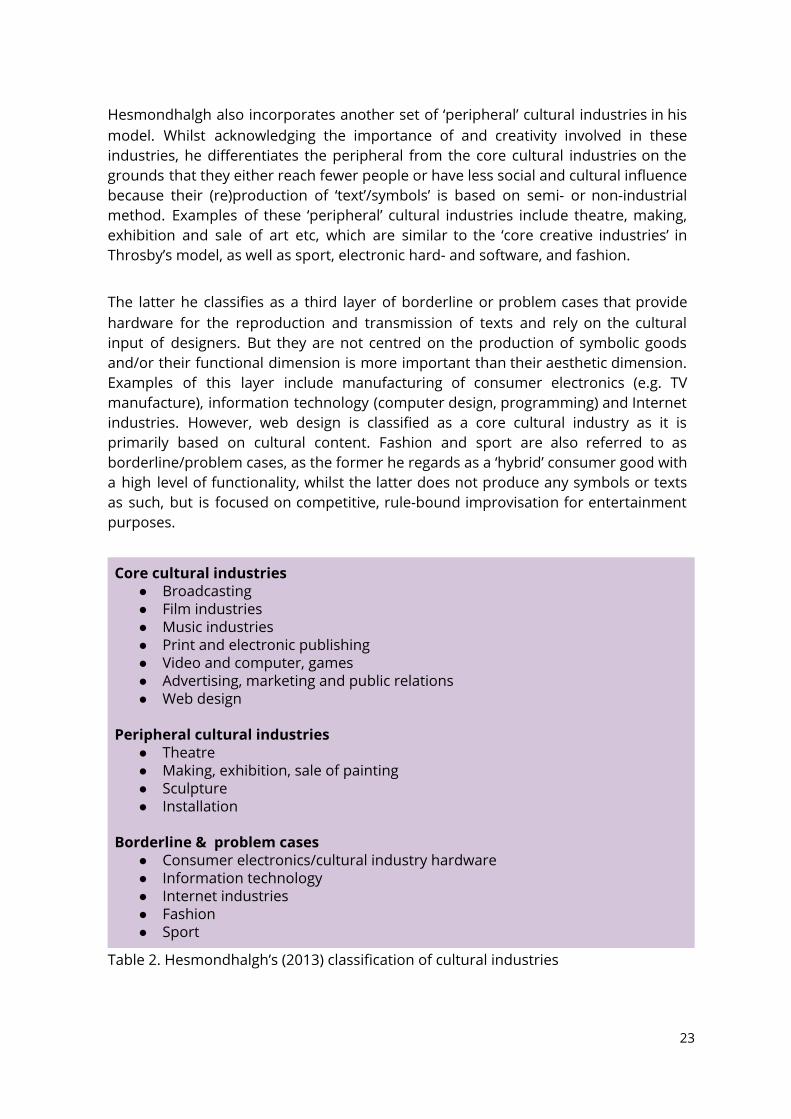
Hesmondhalgh also incorporates another set of ‘peripheral’ cultural industries in his model. Whilst acknowledging the importance of and creativity involved in these industries, he di៛�erentiates the peripheral from the core cultural industries on the grounds that they either reach fewer people or have less social and cultural in�uence because their (re)production of ‘text’/symbols’ is based on semi- or non-industrial method. Examples of these ‘peripheral’ cultural industries include theatre, making, exhibition and sale of art etc, which are similar to the ‘core creative industries’ in Throsby’s model, as well as sport, electronic hard- and software, and fashion. The latter he classi�es as a third layer of borderline or problem cases that provide hardware for the reproduction and transmission of texts and rely on the cultural input of designers. But they are not centred on the production of symbolic goods and/or their functional dimension is more important than their aesthetic dimension. Examples of this layer include manufacturing of consumer electronics (e.g. TV manufacture), information technology (computer design, programming) and Internet industries. However, web design is classi�ed as a core cultural industry as it is primarily based on cultural content. Fashion and sport are also referred to as borderline/problem cases, as the former he regards as a ‘hybrid’ consumer good with a high level of functionality, whilst the latter does not produce any symbols or texts as such, but is focused on competitive, rule-bound improvisation for entertainment purposes.
Core cultural industries ● Broadcasting ● Film industries ● Music industries ● Print and electronic publishing ● Video and computer, games ● Advertising, marketing and public relations ● Web design
Peripheral cultural industries
● Theatre ● Making, exhibition, sale of painting ● Sculpture ● Installation
Borderline & problem cases
● Consumer electronics/cultural industry hardware ● Information technology ● Internet industries ● Fashion ● Sport
Table 2. Hesmondhalgh’s (2013) classi�cation of cultural industries
23
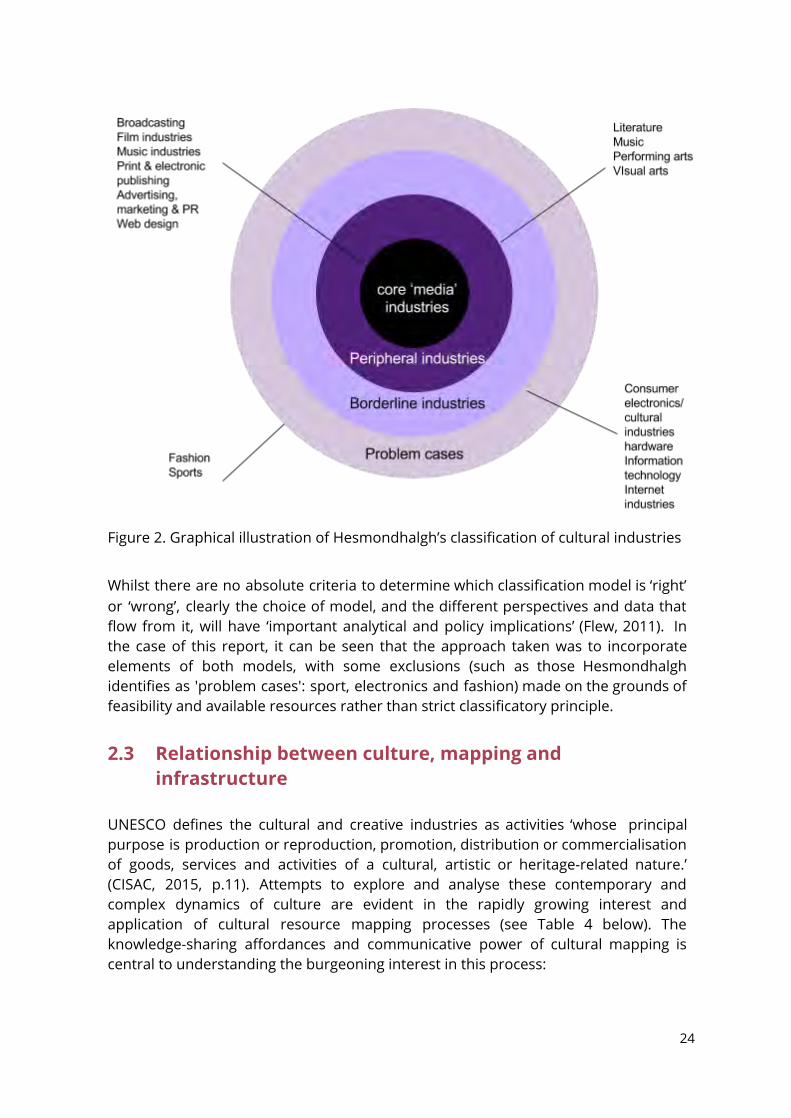
Figure 2. Graphical illustration of Hesmondhalgh’s classification of cultural industries
Whilst there are no absolute criteria to determine which classification model is ‘right’ or ‘wrong’, clearly the choice of model, and the different perspectives and data that flow from it, will have ‘important analytical and policy implications’ (Flew, 2011). In the case of this report, it can be seen that the approach taken was to incorporate elements of both models, with some exclusions ( such as those Hesmondhalgh identifies as 'problem cases': sport, electronics and fashion ) made on the grounds of feasibility and available resources rather than strict classificatory principle.
2.3 Relationship between culture, mapping and infrastructure
UNESCO defines the cultural and creative industries as activities ‘whose principal purpose is production or reproduction, promotion, distribution or commercialisation of goods, services and activities of a cultural, artistic or heritage-related nature.’ (CISAC, 2015, p.11). Attempts to explore and analyse these contemporary and complex dynamics of culture are evident in the rapidly growing interest and application of cultural resource mapping processes (see Table 4 below). The knowledge-sharing affordances and communicative power of cultural mapping is central to understanding the burgeoning interest in this process:
24
Cultural mapping enables us to understand and share culture; to re-think history; and to promote creativity and development … The process of mapping by itself draws attention to the existence and importance of cultural resources. The results point out problems to be solved or strengths to build upon (CCNC, 2010, p.3).
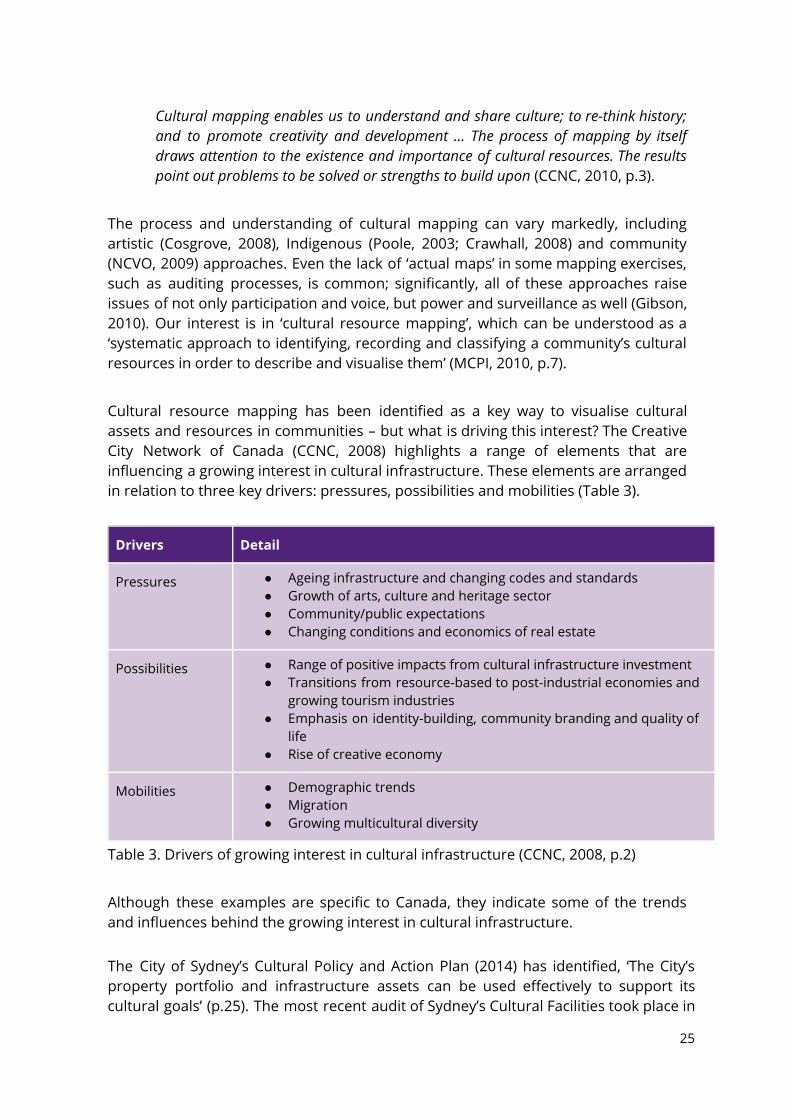
The process and understanding of cultural mapping can vary markedly, including artistic (Cosgrove, 2008), Indigenous (Poole, 2003; Crawhall, 2008) and community (NCVO, 2009) approaches. Even the lack of ‘actual maps’ in some mapping exercises, such as auditing processes, is common; significantly, all of these approaches raise issues of not only participation and voice, but power and surveillance as well (Gibson, 2010). Our interest is in ‘cultural resource mapping’, which can be understood as a ‘systematic approach to identifying, recording and classifying a community’s cultural resources in order to describe and visualise them’ (MCPI, 2010, p.7). Cultural resource mapping has been identified as a key way to visualise cultural assets and resources in communities – but what is driving this interest? The Creative City Network of Canada (CCNC, 2008) highlights a range of elements that are influencing a growing interest in cultural infrastructure. These elements are arranged in relation to three key drivers: pressures, possibilities and mobilities (Table 3).
Drivers Detail
Pressures ● Ageing infrastructure and changing codes and standards ● Growth of arts, culture and heritage sector ● Community/public expectations ● Changing conditions and economics of real estate
Possibilities ● Range of positive impacts from cultural infrastructure investment ● Transitions from resource-based to post-industrial economies and
growing tourism industries ● Emphasis on identity-building, community branding and quality of
life ● Rise of creative economy
Mobilities ● Demographic trends ● Migration ● Growing multicultural diversity
Table 3. Drivers of growing interest in cultural infrastructure (CCNC, 2008, p.2) Although these examples are specific to Canada, they indicate some of the trends and influences behind the growing interest in cultural infrastructure. The City of Sydney’s Cultural Policy and Action Plan (2014) has identified, ‘The City’s property portfolio and infrastructure assets can be used effectively to support its cultural goals’ (p.25). The most recent audit of Sydney’s Cultural Facilities took place in
25
2011, with the audit previous to that taking place in 1994. The report notes how there were clear highlights, including refurbishments (Capitol Theatre, Sydney Town Hall) and constructions (Sydney Olympic Park, CarriageWorks), but also significant losses, such as Her Majesty’s Theatre, and the ‘number and quality of venues presenting Indigenous art has also decreased’ (Sweet Reason, 2011, p.4). Our development of the City of Sydney Classification Framework and the associated Cultural Venues and Infrastructure Database aims to provide a strong foundation for more timely and sustainable data collection to inform and support policy, planning and community developments. Usefully informing these initiatives are insights from classification and cultural resource mapping frameworks outlined in the section below.
2.4 Examples of cultural classi秜ᇘcation and resource mapping
frameworks Exploring features of recent classification frameworks, as well as cultural resource mapping initiatives has informed the development of the City of Sydney Classification Framework and associated Cultural Venues and Infrastructure Database. Recognising that cultural industries have become one of the fastest growing sectors in post-industrial economies, many governments in the world have invested in mapping studies as a part of their policies to support the development of their cultural industries. Below, we introduce three examples, namely the UNESCO cultural framework, the DCMS cultural data framework and Culture and Sport Evidence (CASE) programme in the UK and the Canadian framework for culture statistics, and discuss briefly the current development of cultural statistics in Australia at the national level. This information is followed by a brief overview of Australian, international and global initiatives (see Table 4) which shows the growing interest in this process, how their features vary, and the gap in the data that the City of Sydney ‘Cultural Venues and Infrastructure Database’ seeks to address. 2.4.1 Example 1
UNESCO FRAMEWORK FOR CULTURAL STATISTICS As Flew (2011) has pointed out, mapping cultural industries must engage with questions of both breadth and depth. The former refers to the choice of which industries are to be included, whilst the latter refers to the range of activities in the production of culture that need to be covered. Answering the latter question is particularly difficult as the production of culture relies on a range of non-cultural activities associated with manufacturing and distribution, and the circulation and consumption of cultural products is embedded in different infrastructures for exhibition, archiving and education (Flew, 2011, p.77).
26
To address the breadth question, the UNESCO’s Framework for Cultural Statistics (2009) classified culture into different cultural domains that represent a common set of economic and social activities that have been regarded typically as ‘cultural’. The six domains included in UNESCO’s 2009 framework are:
● Cultural and natural heritage: museum, archaeological and historical places, cultural landscapes, natural heritage
● Performance and celebration: performing arts, music, festivals, fairs and feasts ● Visual arts and crafts: fine arts, crafts, photography ● Books and print media: books, newspapers and magazines, other printed
matters, virtual publishing, libraries, book fairs ● Audiovisual and media: film and video, television and radio, internet TV and
podcasting, video games ● Design and creative services: fashion design, graphic design, interior design,
landscape design, architectural services, advertising services. There are also two ‘related domains’ which consist of the activities that may have a cultural character, but their main component is not regarded as principally cultural:
● Tourism: travel and tourist services, hospitality and accommodation ● Sport and recreation: sport, physical fitness and well-being, amusement and
theme parks, gambling. In addition, there are transversal domains that can be applied to all cultural and related domains. Whilst the elements in the transversal domains are of importance to cultural activities, for UNESCO they may be considered as only ‘partially cultural’. These transversal domains are:
● Intangible cultural heritage: oral traditions and expressions, rituals, languages social practices,
● Education and training: learning activities that support culture, dance schools, literary criticism
● Archives and preservation: collection and repository of cultural forms, preservation of historic sites and buildings, sound archives, picture libraries
● Equipment and supporting materials: supporting industries and ancillary services that can be used as ‘tools’ for cultural products and activities, such as IT, computer, internet.
27
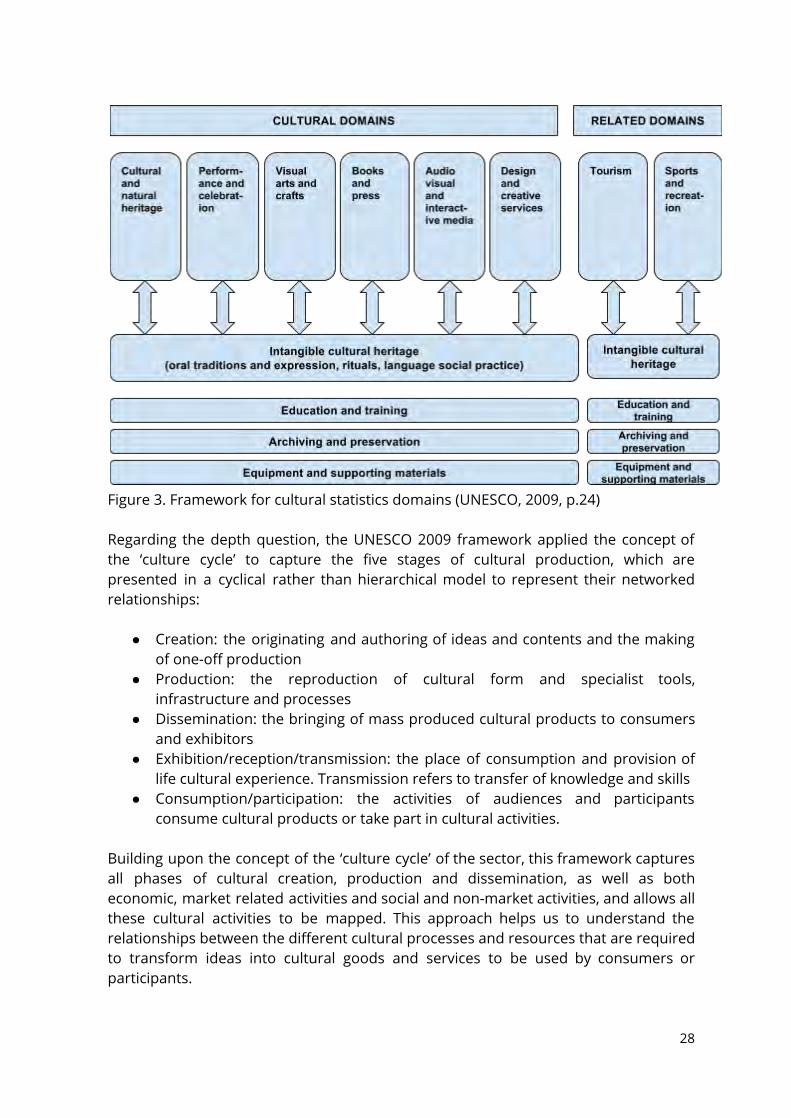
Figure 3. Framework for cultural statistics domains (UNESCO, 2009, p.24) Regarding the depth question, the UNESCO 2009 framework applied the concept of the ‘culture cycle’ to capture the five stages of cultural production, which are presented in a cyclical rather than hierarchical model to represent their networked relationships:
● Creation: the originating and authoring of ideas and contents and the making of one-off production
● Production: the reproduction of cultural form and specialist tools, infrastructure and processes
● Dissemination: the bringing of mass produced cultural products to consumers and exhibitors
● Exhibition/reception/transmission: the place of consumption and provision of life cultural experience. Transmission refers to transfer of knowledge and skills
● Consumption/participation: the activities of audiences and participants consume cultural products or take part in cultural activities.
Building upon the concept of the ‘culture cycle’ of the sector, this framework captures all phases of cultural creation, production and dissemination, as well as both economic, market related activities and social and non-market activities, and allows all these cultural activities to be mapped. This approach helps us to understand the relationships between the different cultural processes and resources that are required to transform ideas into cultural goods and services to be used by consumers or participants.
28
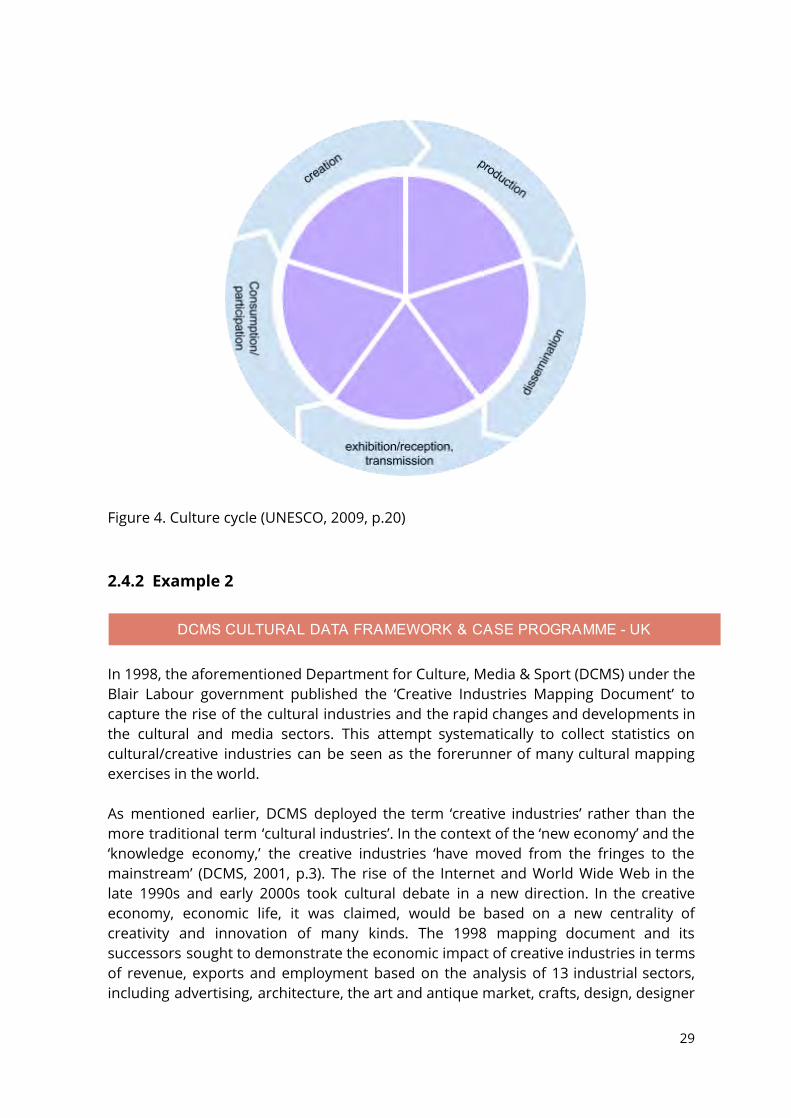
Figure 4. Culture cycle (UNESCO, 2009, p.20) 2.4.2 Example 2
DCMS CULTURAL DATA FRAMEWORK & CASE PROGRAMME - UK In 1998, the aforementioned Department for Culture, Media & Sport (DCMS) under the Blair Labour government published the ‘Creative Industries Mapping Document’ to capture the rise of the cultural industries and the rapid changes and developments in the cultural and media sectors. This attempt systematically to collect statistics on cultural/creative industries can be seen as the forerunner of many cultural mapping exercises in the world. As mentioned earlier, DCMS deployed the term ‘creative industries’ rather than the more traditional term ‘cultural industries’. In the context of the ‘new economy’ and the ‘knowledge economy,’ the creative industries ‘have moved from the fringes to the mainstream’ (DCMS, 2001, p.3). The rise of the Internet and World Wide Web in the late 1990s and early 2000s took cultural debate in a new direction. In the creative economy, economic life, it was claimed, would be based on a new centrality of creativity and innovation of many kinds. The 1998 mapping document and its successors sought to demonstrate the economic impact of creative industries in terms of revenue, exports and employment based on the analysis of 13 industrial sectors, including advertising, architecture, the art and antique market, crafts, design, designer
29
fashion, film and video, interactive leisure software, music, the performing arts, publishing, software and computer services, and television and radio (DCMS, 2001, p.5). Interest has since grown demonstrably in the cultural sector’s capacity to attract business and investment around the world, including in emergent economies such as China (Keane, 2016). However, these early mapping exercises were hampered by a number of limitations, such as the lack of a precise sector definition leading to overreach, overlaps and gaps in the statistics. There was also inconsistency in data sources and classification, and an over-reliance on highly aggregated source data (Cunningham and Higgs, 2008). In 2002, DCMS released the Regional Cultural Data Framework (renamed as the 2004 DCMS Evidence Toolkit) to address the need for consistency in sector definition and data collection. The DCMS framework proposed to cover a range of cultural activities that can be classified under seven broad ‘sectors’/domains:
● Visual Art ● Performance ● Audio-Visual ● Books and Press ● Sport ● Heritage ● Tourism
The classification of culture in the DCMS framework is very different from that of the aforementioned UNESCO framework, as sport and tourism are regarded as key cultural domains rather than ‘related’ domains. After consulting several international cultural statistics frameworks such as those proposed by the UNESCO and the European Commission, the DCMS Cultural Data Framework decided to add a value chain dimension to each of its major domains to form detailed metrics of industrial activities. Its rationale was outlined in the document:
Culture has both a ‘material’ and a non-material dimension. The de秜ᇘnition of cultural sector must focus upon material culture, and we understand this to be the sum of activities and necessary resources (tools, infrastructure and artefacts) involved in the whole ‘cycle’ of creation, making, dissemination, exhibition/reception, archiving/preservation, and education/understanding relating to cultural products and services (DCMS, 2004, p.10).
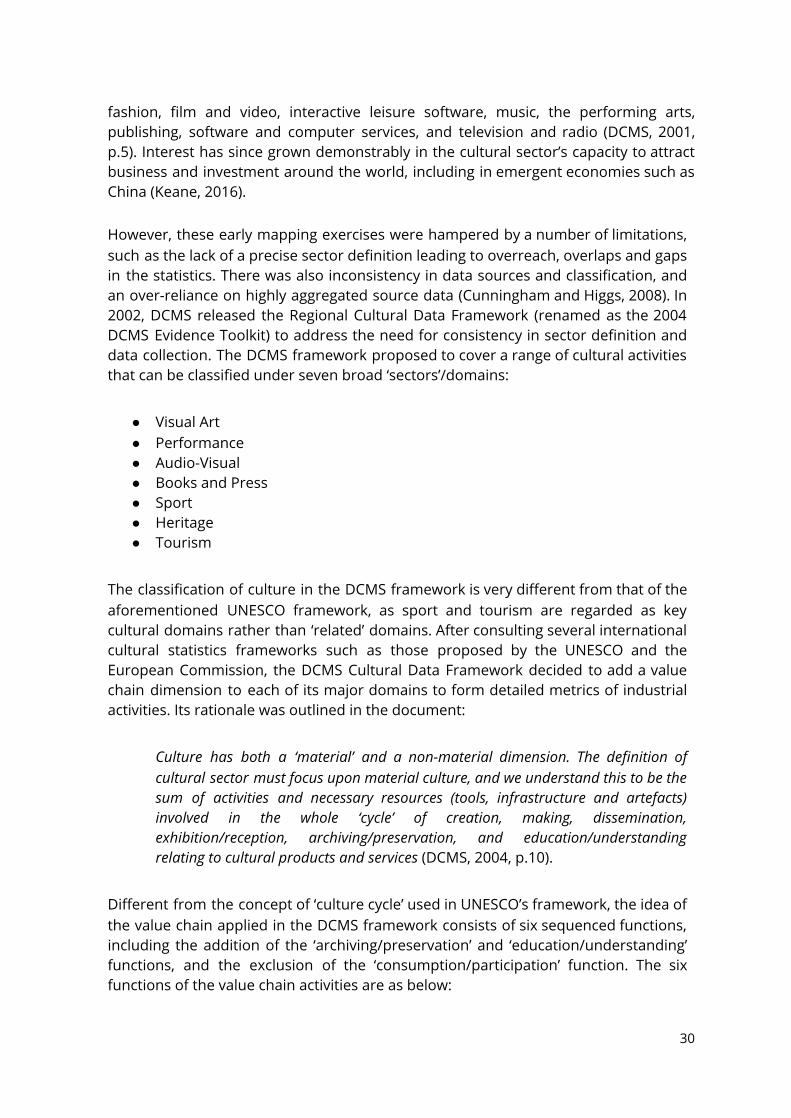
Different from the concept of ‘culture cycle’ used in UNESCO’s framework, the idea of the value chain applied in the DCMS framework consists of six sequenced functions, including the addition of the ‘archiving/preservation’ and ‘education/understanding’ functions, and the exclusion of the ‘consumption/participation’ function. The six functions of the value chain activities are as below:
30
Figure 5. Six functions of the value chain The DCMS recommended a methodology based on determining those industry and occupation codes (UK Standard Industrial Classification ‘SIC’ and Standard Occupation Classification ‘SOC’) that can be classified as ‘cultural’. However, Cunningham and Higgs (2008) have pointed out that the DCMS framework does not differentiate between the primary activities of the value chain and the support or infrastructure requirements. Also, unlike the Canadian framework, training and government bodies are not considered to be part of the value chain. Since 2002, the DCMS also collected and published a separate economic account of creative industries (known as the Creative Industries Economic Estimate). Over the years, the activities constituting the DCMS cultural data framework have evolved. In particular data collection for the creative/cultural industries statistics has been improved (e.g., a new version of the SIC codes was released in 2007 and further broke down the creative industries into core and related activities, and with the ‘creative trident’ approach developed by Cunningham and Higgs (2008) providing a more accurate measurement of creative employment). Besides, the definition of the creative industries has been updated to reflect the changes in the sector, which now comprise: advertising and marketing, architecture, crafts, product, graphic and fashion design, film, TV, video, radio and photography, IT, software and computer services, publishing, museums, galleries, libraries and music, and performing and visual arts, whilst the art and antique markets included in the 1998 mapping document have been removed (DCMS, 1998; 2015). Besides, the digitisation and convergence position creates complex relations of cultural production and consumption. Amateur or ‘pro-am’ cultural activities have frequently been disparaged as a leisure pursuit, leading to the neglect of their artistic or aesthetic dimensions and cultural value. The commercial production and distribution of cultural goods is the most widespread form of cultural experience and is dominant in music, film, games, literature and theatre. However, there is now a much more complex cultural environment in which the boundaries of the amateurs and the professionals, the producers and the consumers are drawn in a range of ways that require considerable flexibility in classification systems and mapping methods. The development of the CASE programme in the late 2000s was a response to the call for more and better evidence in relation to changes in the demand side of cultural activities and practices. Currently funded jointly by DCMS and Art Council England, English Heritage, Museums, Libraries and Archives Council and Sport England, the programme mainly looks at the social aspects of cultural consumption and participation such as drivers, impact and values of engagement in culture and sport. By bringing together
31
‘high-quality’ research previously scattered across different platforms, CASE has made it possible to carry out extensive analysis, including at a local and regional level. In association with the programme is the development of a set of new toolkits for delivering high quality mapping and databases for culture and sport, including the following:
● CASE Database – over 12,000 studies on engagement in culture and sport, in an online, searchable database
● Drivers, Impacts and Value work – research and evidence on engagement in culture and sport
● Local Culture and Heritage Profile tool – a rich source of local information, and culture and heritage data for better investment and cultural planning decisions
● Sport England Local Sport Profile tool – brings together data on sporting participation and provision to help local authorities
● Regional and Local Insights data – a guide for mapping local culture and sport assets
● Mapping Asset Guidance – enabling accurate information on existing cultural assets for better cultural planning (DCMS, 2013).
The CASE programme covered 4 primary cultural domains, namely: Arts; Heritage; Museums, Libraries & Archives (MLA); and Sport. Although the data collected for the CASE programme can measure investment, expenditure and participation within the cultural/creative sector, its concern to make the business case for government investment (Walmsley, 2012) meant that it embraced selection criteria that privileged certain types of culture over others.
32
2.4.3 Example 3
CANADIAN FRAMEWORK FOR CULTURE STATISTICS 2
The Canadian framework for culture statistics is based on a broad definition of culture, referring to the ‘creative artistic activity and the goods and services produced by it, and the preservation of heritage’ (Statistics Canada, 2011, p.9). The purpose of this framework, as outlined in its conceptual document, is to ‘provide standard concepts, definitions and categories to facilitate comprehensive, consistent and comparable statistics on culture and support evidence based decision making (Statistics Canada, 2011, p.8) In fact, the Canadian framework bears many similarities with that developed by UNESCO in 2009, and defines the culture industries as involving different domains. Each domain is linked to a set of standard classification codes, namely the North American Industry Classification System (NAICS) for collecting data in industries and employment statistics. The framework has six domains adopted from the UNESCO framework:
● Heritage and Libraries ● Live performance ● Visual and applied arts ● Written and published works ● Audiovisual and interactive media ● Sound recording
The last domain is different from that of the UNESCO 2009 framework, which includes ‘Design and creative services’. Another difference between the two frameworks is that the Canadian framework further subdivides the cultural domains into core and ancillary sub-domains. The core culture sub-domains refer to sectors the primary purpose of which is the transmission of cultural content, whereas the ancillary culture sub-domains refer to sectors producing non-core culture goods and services, such as provision of artistic creative services or intermediary inputs for non-culture products (see Figure 6 for details of these sub-domains). Although the ‘related domains’ (i.e., tourism and sport) are included in the framework, they are not measured in the culture statistics. Statistics Canada has a separate methodology to measure tourism, whilst sport is not generally considered sufficiently ‘cultural’. In addition, the Canadian framework includes two transversal domains, namely ‘Education and training’ and ‘Governance, funding and professional support’. However, the transversal domain does not cover intangible cultural heritage, as is the case in the UNESCO framework, due to practical difficulties of measurement.
2 The terms ‘culture industries‘, ‘culture statistics’ and ‘culture sector’ are used in the Canadian framework to reflect their standing usage by the Culture Statistics Program at Statistics Canada (Statistics Canada, 2011, p.22)
33
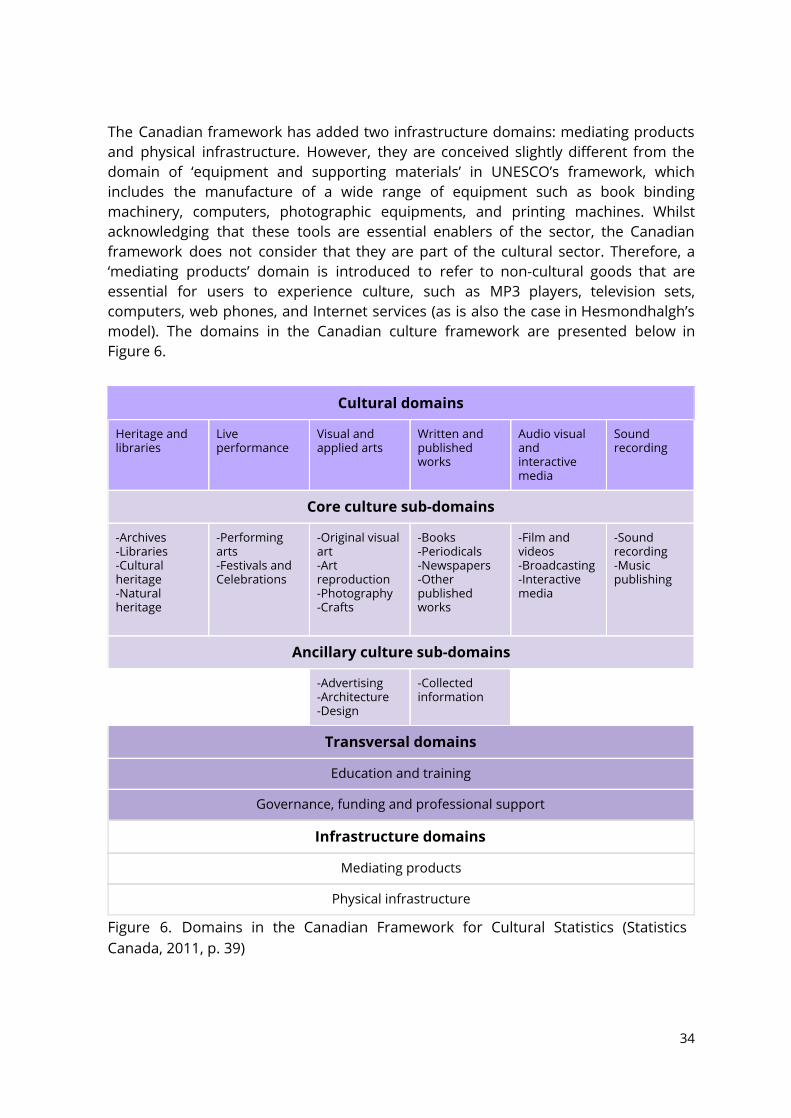
The Canadian framework has added two infrastructure domains: mediating products and physical infrastructure. However, they are conceived slightly different from the domain of ‘equipment and supporting materials’ in UNESCO’s framework, which includes the manufacture of a wide range of equipment such as book binding machinery, computers, photographic equipments, and printing machines. Whilst acknowledging that these tools are essential enablers of the sector, the Canadian framework does not consider that they are part of the cultural sector. Therefore, a ‘mediating products’ domain is introduced to refer to non-cultural goods that are essential for users to experience culture, such as MP3 players, television sets, computers, web phones, and Internet services (as is also the case in Hesmondhalgh’s model). The domains in the Canadian culture framework are presented below in Figure 6.
Cultural domains
Heritage and libraries
Live performance
Visual and applied arts
Written and published works
Audio visual and interactive media
Sound recording
Core culture sub-domains
-Archives -Libraries -Cultural heritage -Natural heritage
-Performing arts -Festivals and Celebrations
-Original visual art -Art reproduction -Photography -Crafts
-Books -Periodicals -Newspapers -Other published works
-Film and videos -Broadcasting -Interactive media
-Sound recording -Music publishing
Ancillary culture sub-domains
-Advertising -Architecture -Design
-Collected information
Transversal domains
Education and training
Governance, funding and professional support
Infrastructure domains
Mediating products
Physical infrastructure
Figure 6. Domains in the Canadian Framework for Cultural Statistics (Statistics Canada, 2011, p. 39)
34
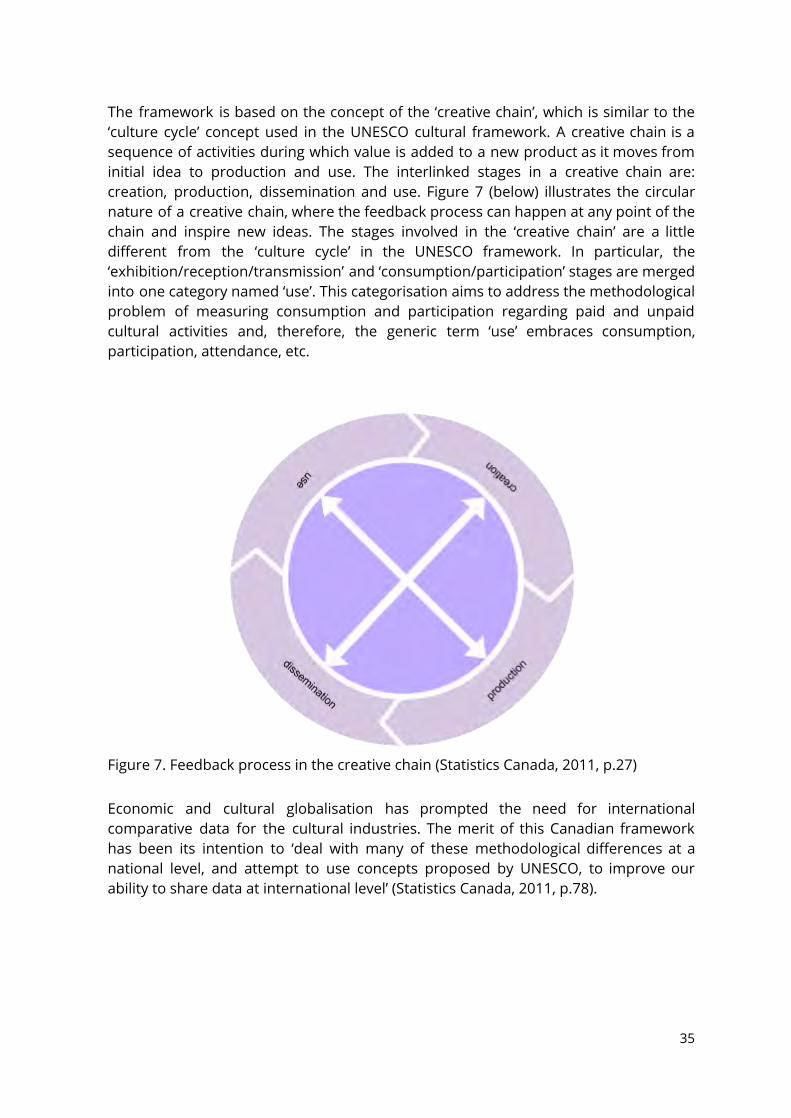
The framework is based on the concept of the ‘creative chain’, which is similar to the ‘culture cycle’ concept used in the UNESCO cultural framework. A creative chain is a sequence of activities during which value is added to a new product as it moves from initial idea to production and use. The interlinked stages in a creative chain are: creation, production, dissemination and use. Figure 7 (below) illustrates the circular nature of a creative chain, where the feedback process can happen at any point of the chain and inspire new ideas. The stages involved in the ‘creative chain’ are a little different from the ‘culture cycle’ in the UNESCO framework. In particular, the ‘exhibition/reception/transmission’ and ‘consumption/participation’ stages are merged into one category named ‘use’. This categorisation aims to address the methodological problem of measuring consumption and participation regarding paid and unpaid cultural activities and, therefore, the generic term ‘use’ embraces consumption, participation, attendance, etc.
Figure 7. Feedback process in the creative chain (Statistics Canada, 2011, p.27) Economic and cultural globalisation has prompted the need for international comparative data for the cultural industries. The merit of this Canadian framework has been its intention to ‘deal with many of these methodological differences at a national level, and attempt to use concepts proposed by UNESCO, to improve our ability to share data at international level’ (Statistics Canada, 2011, p.78).
35
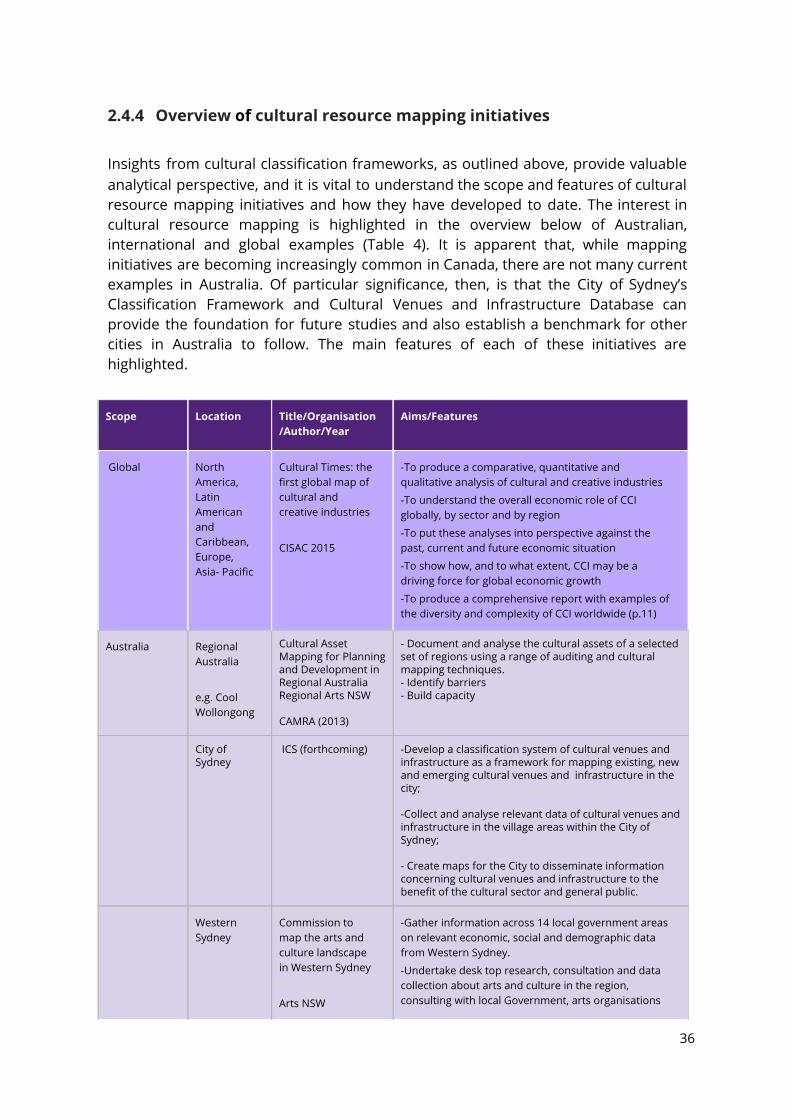
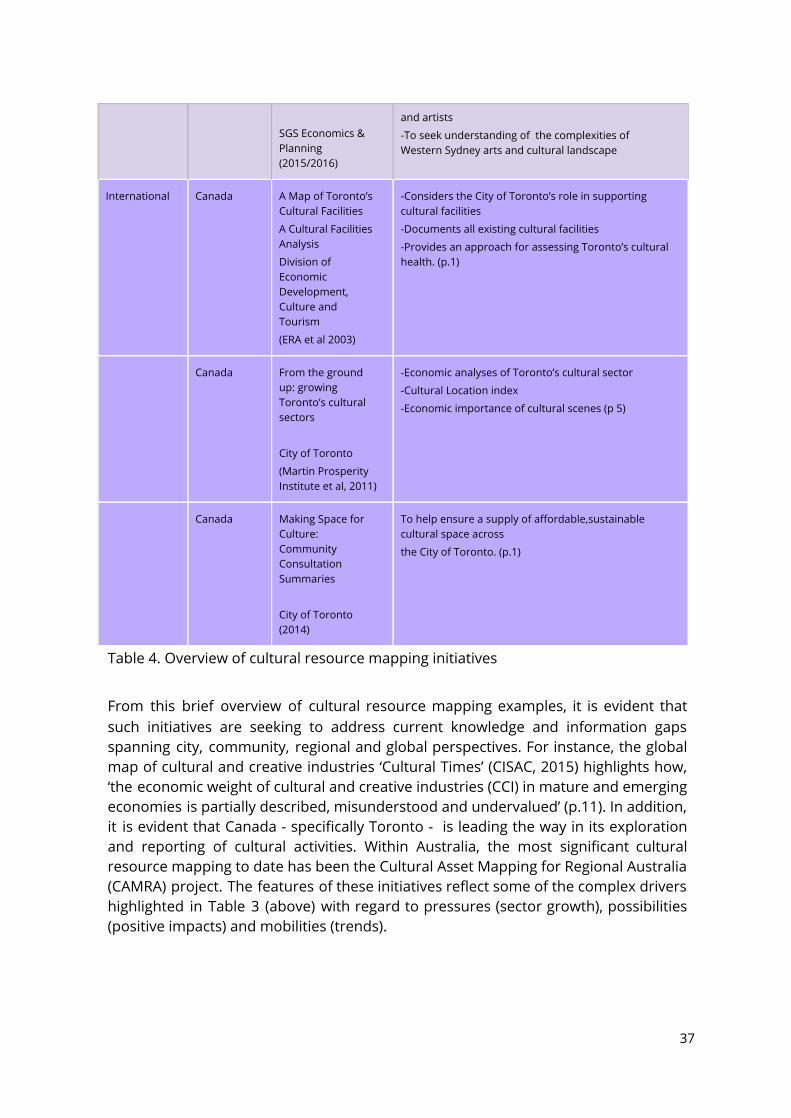
2.4.4 Overview of cultural resource mapping initiatives Insights from cultural classification frameworks, as outlined above, provide valuable analytical perspective, and it is vital to understand the scope and features of cultural resource mapping initiatives and how they have developed to date. The interest in cultural resource mapping is highlighted in the overview below of Australian, international and global examples (Table 4). It is apparent that, while mapping initiatives are becoming increasingly common in Canada, there are not many current examples in Australia. Of particular significance, then, is that the City of Sydney’s Classification Framework and Cultural Venues and Infrastructure Database can provide the foundation for future studies and also establish a benchmark for other cities in Australia to follow. The main features of each of these initiatives are highlighted.
Scope
Location Title/Organisation/Author/Year
Aims/Features
Global
North America, Latin American and Caribbean, Europe, Asia- Pacific
Cultural Times: the first global map of cultural and creative industries
CISAC 2015
-To produce a comparative, quantitative and qualitative analysis of cultural and creative industries
-To understand the overall economic role of CCI globally, by sector and by region
-To put these analyses into perspective against the past, current and future economic situation
-To show how, and to what extent, CCI may be a driving force for global economic growth
-To produce a comprehensive report with examples of the diversity and complexity of CCI worldwide (p.11)
Australia Regional Australia
e.g. Cool Wollongong
Cultural Asset Mapping for Planning and Development in Regional Australia Regional Arts NSW CAMRA (2013)
- Document and analyse the cultural assets of a selected set of regions using a range of auditing and cultural mapping techniques. - Identify barriers - Build capacity
City of Sydney
ICS (forthcoming) -Develop a classification system of cultural venues and infrastructure as a framework for mapping existing, new and emerging cultural venues and infrastructure in the city; -Collect and analyse relevant data of cultural venues and infrastructure in the village areas within the City of Sydney; - Create maps for the City to disseminate information concerning cultural venues and infrastructure to the benefit of the cultural sector and general public.
Western Sydney
Commission to map the arts and culture landscape in Western Sydney
Arts NSW
-Gather information across 14 local government areas on relevant economic, social and demographic data from Western Sydney.
-Undertake desk top research, consultation and data collection about arts and culture in the region, consulting with local Government, arts organisations
36
SGS Economics & Planning (2015/2016)
and artists
-To seek understanding of the complexities of Western Sydney arts and cultural landscape
International Canada
A Map of Toronto’s Cultural Facilities
A Cultural Facilities Analysis
Division of Economic Development, Culture and Tourism
(ERA et al 2003)
-Considers the City of Toronto’s role in supporting cultural facilities
-Documents all existing cultural facilities
-Provides an approach for assessing Toronto’s cultural health. (p.1)
Canada From the ground up: growing Toronto’s cultural sectors
City of Toronto
(Martin Prosperity Institute et al, 2011)
-Economic analyses of Toronto’s cultural sector
-Cultural Location index
-Economic importance of cultural scenes (p 5)
Canada Making Space for Culture: Community Consultation Summaries
City of Toronto (2014)
To help ensure a supply of affordable,sustainable cultural space across
the City of Toronto. (p.1)
Table 4. Overview of cultural resource mapping initiatives From this brief overview of cultural resource mapping examples, it is evident that such initiatives are seeking to address current knowledge and information gaps spanning city, community, regional and global perspectives. For instance, the global map of cultural and creative industries ‘Cultural Times’ (CISAC, 2015) highlights how, ‘the economic weight of cultural and creative industries (CCI) in mature and emerging economies is partially described, misunderstood and undervalued’ (p.11). In addition, it is evident that Canada - specifically Toronto - is leading the way in its exploration and reporting of cultural activities. Within Australia, the most significant cultural resource mapping to date has been the Cultural Asset Mapping for Regional Australia (CAMRA) project. The features of these initiatives reflect some of the complex drivers highlighted in Table 3 (above) with regard to pressures (sector growth), possibilities (positive impacts) and mobilities (trends).
37
2.5 City of Sydney cultural infrastructure: where to next? It is recognised that cultural infrastructure development models are diverse, responding to the social, economic, cultural, and environmental ca pacities and to changes within our communities’ (CCNC, 2008), such as agents and partnerships, cultural-creative enterprise trends and funding frameworks. How are such emerging innovations currently reflected and recognised in the City of Sydney?
The creative sector is vital to Sydney’s future. The NSW Government’s 2013 Creative Industries Economic Pro秜ᇘle found New South Wales is home to 40 per cent of the nation’s creative industries workforce, contributing $1.4 billion to the state economy. The bulk of this is concentrated in the City of Sydney area. Small art galleries, performance spaces and music venues, as well as co-working spaces, startups, and social enterprises, are incubators for Sydney’s creative life. They diversify the night-time economy, attract tourists, and provide places for people to produce and engage with local culture. (City of Sydney, 2016b, p.4)
A review of industry (SFF, 2015) and City of Sydney reports (2014a; 2014b) highlights a range of current gaps and critical success factors in relation to cultural infrastructure. Our classification framework, mapping and analysis can provide a foundation for beginning to understand and explore these issues:
● Mapping music venues : ‘local live music and performance scene has declined – venues have closed, there are fewer opportunities for live music and performance’ (City of Sydney, 2014b, p.4)
● Identifying unique performance spaces : ‘ We need to think outside the box, we need to encourage artists and companies to rede秜ᇘne the traditional performance space and use available, a齰︘ordable spaces. This doesn't just make cultural sense, it makes economic sense.’ (SFF, 2015, p.4)
● Exploring the interrelationship between building stock, property costs and zoning : ‘The limited number of existing small performance spaces indicates the barriers to establishing new spaces, as distinct from a lack of market demand. Limited suitable building stock, high property costs and the increased volume of residential zoning has decreased the amount of readily available space for performance venues.’ (City of Sydney, 2016b, p.31)
● Creative villages : ‘opportunities are lost when the cultural assets of neighbourhoods are under-recognised, insufficiently supported, or poorly incorporated into the existing cultural policy’ (City of Sydney, 2014a, p.38)
● Cultural precincts : ‘the city aims to recognise and encourage organic cultural activity throughout the city and support the emergence of creative clusters’ (City of Sydney, 2014a, p.39)
● Festivals : ‘The City aims to better measure and articulate their social, economic and of cultural contribution to Sydney, and the City’s expectations
38
in relation to those of other government agencies’ (City of Sydney, 2014a, p.40).
These insights demonstrate how cultural infrastructure dynamics and demands are developing in the City of Sydney. This section has also described how cultural classification and resource mapping frameworks have informed the spatial and relational dimensions that we propose as part of our classification framework in ‘exploring “where” and “why” cultural and arts activities occur in places (and what meanings communities attach to them)’ (Gibson, 2010, p.67). The City of Sydney Classification Framework outlined in the next section provides a way of both mapping these spaces and of charting their dynamics in order to understand, explore and support cultural infrastructure and life in the City of Sydney.
39
3. CULTURAL MAPPING CLASSIFICATION FRAMEWORK
3.1 Classi秜ᇘcation framework overview (rationale, development and value)
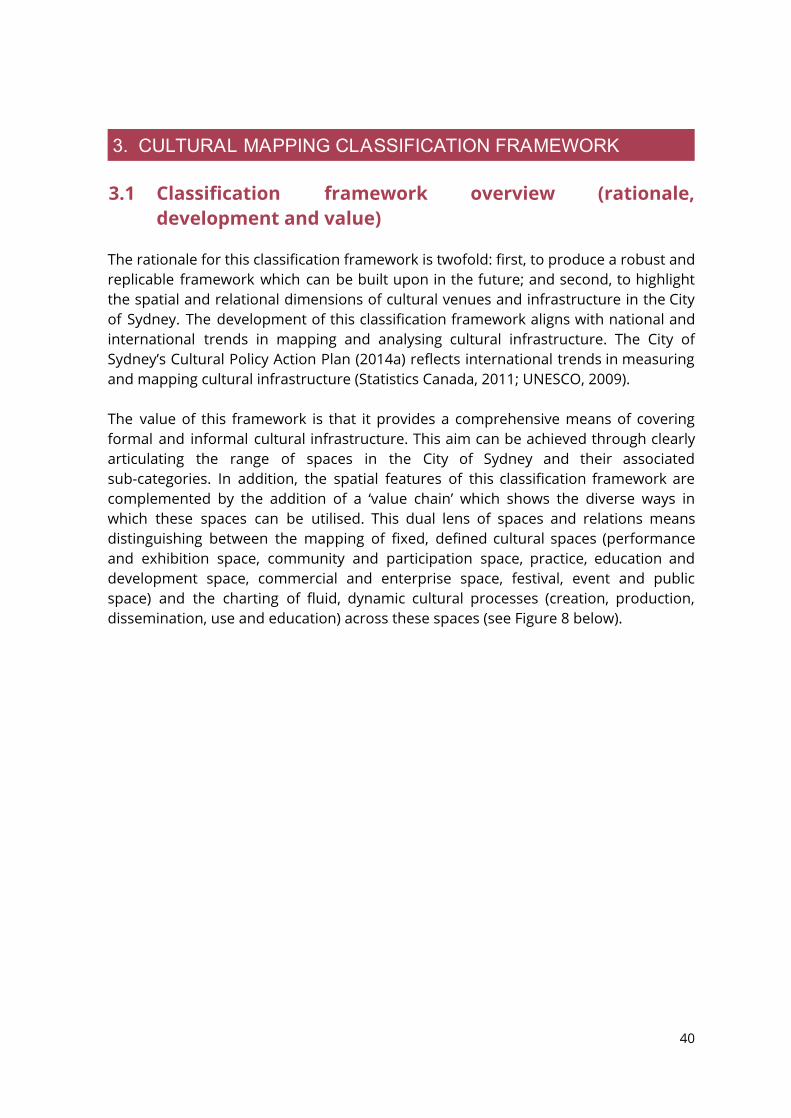
The rationale for this classification framework is twofold: first, to produce a robust and replicable framework which can be built upon in the future; and second, to highlight the spatial and relational dimensions of cultural venues and infrastructure in the City of Sydney. The development of this classification framework aligns with national and international trends in mapping and analysing cultural infrastructure. The City of Sydney’s Cultural Policy Action Plan (2014a) reflects international trends in measuring and mapping cultural infrastructure (Statistics Canada, 2011; UNESCO, 2009). The value of this framework is that it provides a comprehensive means of covering formal and informal cultural infrastructure. This aim can be achieved through clearly articulating the range of spaces in the City of Sydney and their associated sub-categories. In addition, the spatial features of this classification framework are complemented by the addition of a ‘value chain’ which shows the diverse ways in which these spaces can be utilised. This dual lens of spaces and relations means distinguishing between the mapping of fixed, defined cultural spaces (performance and exhibition space, community and participation space, practice, education and development space, commercial and enterprise space, festival, event and public space) and the charting of fluid, dynamic cultural processes (creation, production, dissemination, use and education) across these spaces (see Figure 8 below).
40
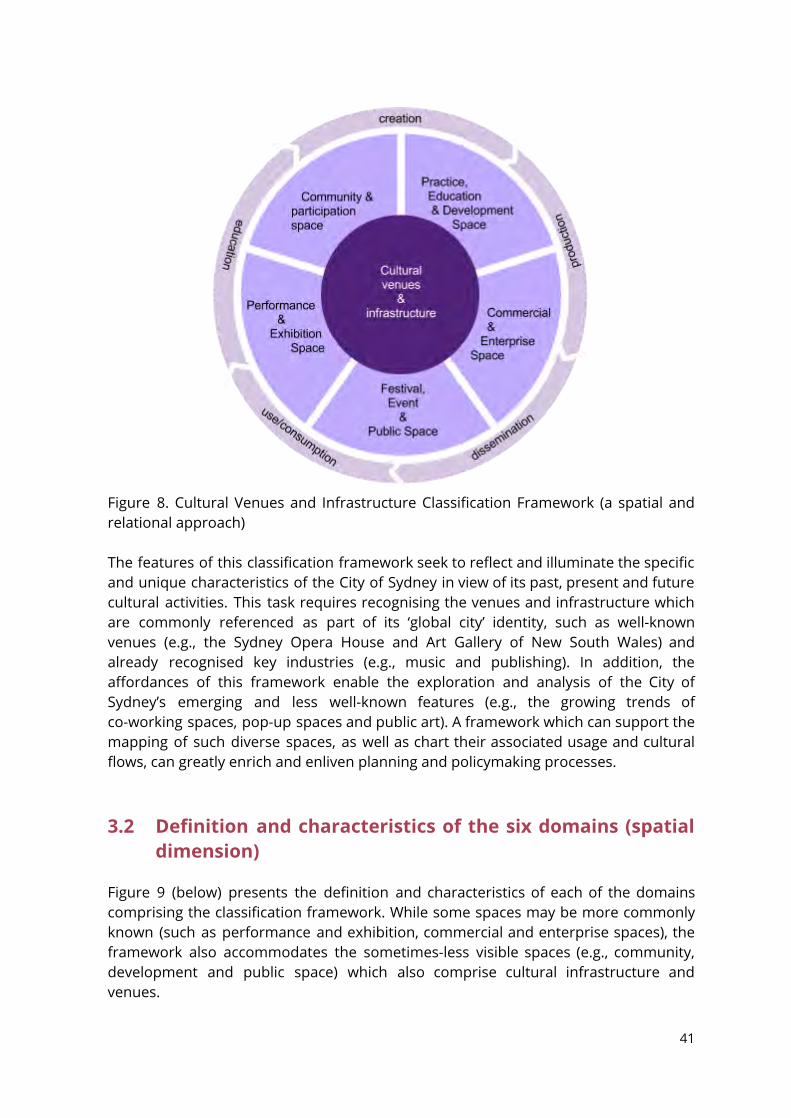
Figure 8. Cultural Venues and Infrastructure Classification Framework (a spatial and relational approach) The features of this classification framework seek to reflect and illuminate the specific and unique characteristics of the City of Sydney in view of its past, present and future cultural activities. This task requires recognising the venues and infrastructure which are commonly referenced as part of its ‘global city’ identity, such as well-known venues (e.g., the Sydney Opera House and Art Gallery of New South Wales) and already recognised key industries (e.g., music and publishing). In addition, the affordances of this framework enable the exploration and analysis of the City of Sydney’s emerging and less well-known features (e.g., the growing trends of co-working spaces, pop-up spaces and public art). A framework which can support the mapping of such diverse spaces, as well as chart their associated usage and cultural flows, can greatly enrich and enliven planning and policymaking processes.
3.2 De秜ᇘnition and characteristics of the six domains (spatial dimension)
Figure 9 (below) presents the definition and characteristics of each of the domains comprising the classification framework. While some spaces may be more commonly known (such as performance and exhibition, commercial and enterprise spaces), the framework also accommodates the sometimes-less visible spaces (e.g., community, development and public space) which also comprise cultural infrastructure and venues.
41
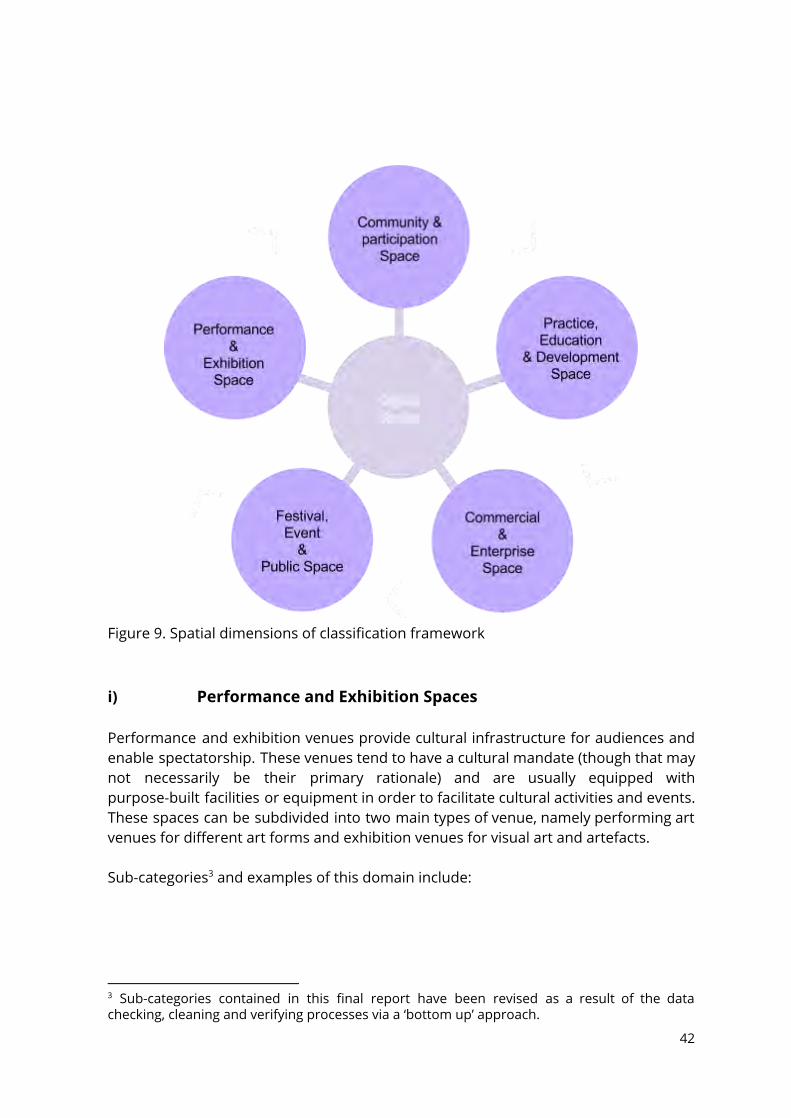
Figure 9. Spatial dimensions of classification framework i) Performance and Exhibition Spaces
Performance and exhibition venues provide cultural infrastructure for audiences and enable spectatorship. These venues tend to have a cultural mandate (though that may not necessarily be their primary rationale) and are usually equipped with purpose-built facilities or equipment in order to facilitate cultural activities and events. These spaces can be subdivided into two main types of venue, namely performing art venues for different art forms and exhibition venues for visual art and artefacts. Sub-categories and examples of this domain include: 3
3 Sub-categories contained in this final report have been revised as a result of the data checking, cleaning and verifying processes via a ‘bottom up’ approach.
42
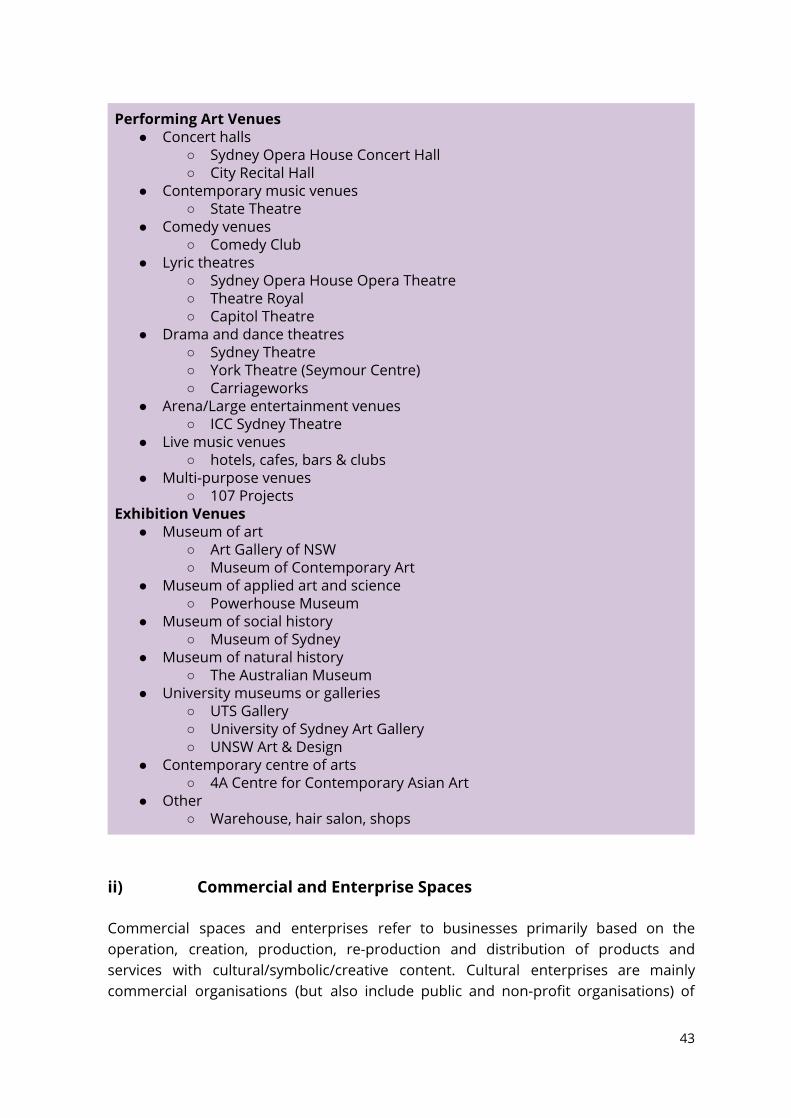
Performing Art Venues ● Concert halls
○ Sydney Opera House Concert Hall ○ City Recital Hall
● Contemporary music venues ○ State Theatre
● Comedy venues ○ Comedy Club
● Lyric theatres ○ Sydney Opera House Opera Theatre ○ Theatre Royal ○ Capitol Theatre
● Drama and dance theatres ○ Sydney Theatre ○ York Theatre (Seymour Centre) ○ Carriageworks
● Arena/Large entertainment venues ○ ICC Sydney Theatre
● Live music venues ○ hotels, cafes, bars & clubs
● Multi-purpose venues ○ 107 Projects
Exhibition Venues ● Museum of art
○ Art Gallery of NSW ○ Museum of Contemporary Art
● Museum of applied art and science ○ Powerhouse Museum
● Museum of social history ○ Museum of Sydney
● Museum of natural history ○ The Australian Museum
● University museums or galleries ○ UTS Gallery ○ University of Sydney Art Gallery ○ UNSW Art & Design
● Contemporary centre of arts ○ 4A Centre for Contemporary Asian Art
● Other ○ Warehouse, hair salon, shops
ii) Commercial and Enterprise Spaces Commercial spaces and enterprises refer to businesses primarily based on the operation, creation, production, re-production and distribution of products and services with cultural/symbolic/creative content. Cultural enterprises are mainly commercial organisations (but also include public and non-profit organisations) of
43
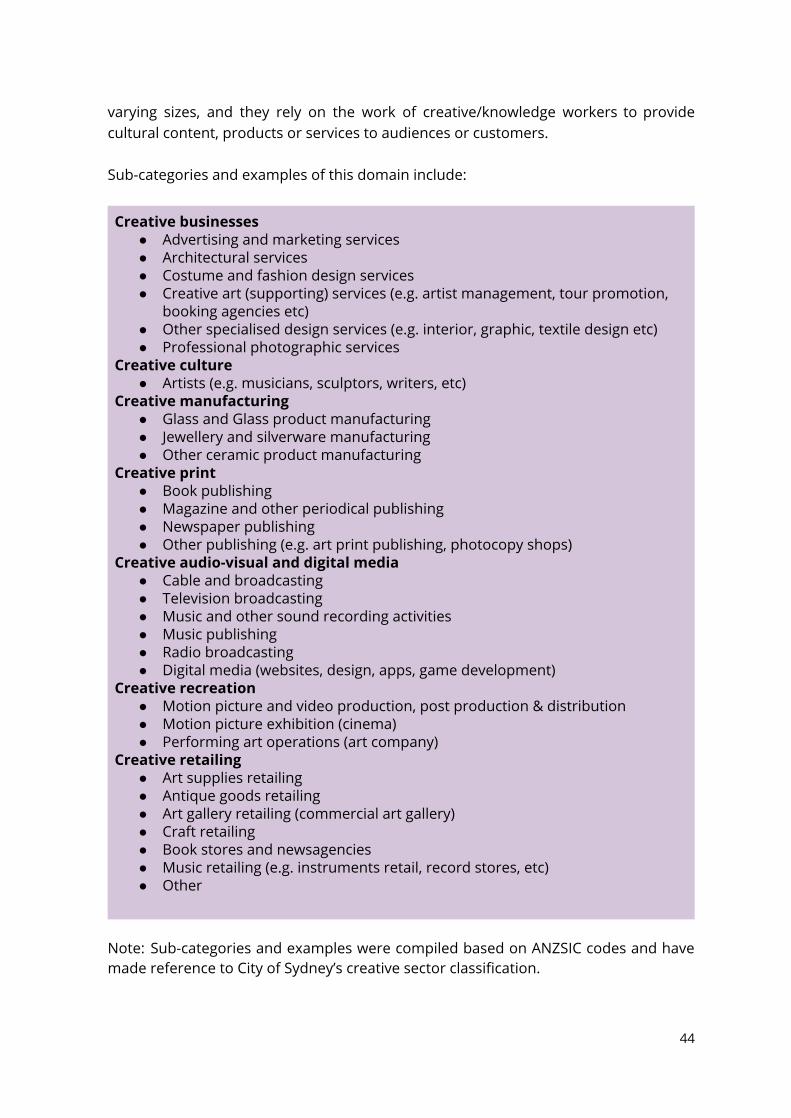
varying sizes, and they rely on the work of creative/knowledge workers to provide cultural content, products or services to audiences or customers. Sub-categories and examples of this domain include:
Creative businesses ● Advertising and marketing services ● Architectural services ● Costume and fashion design services ● Creative art (supporting) services (e.g. artist management, tour promotion,
booking agencies etc) ● Other specialised design services (e.g. interior, graphic, textile design etc) ● Professional photographic services
Creative culture ● Artists (e.g. musicians, sculptors, writers, etc)
Creative manufacturing ● Glass and Glass product manufacturing ● Jewellery and silverware manufacturing ● Other ceramic product manufacturing
Creative print ● Book publishing ● Magazine and other periodical publishing ● Newspaper publishing ● Other publishing (e.g. art print publishing, photocopy shops)
Creative audio-visual and digital media ● Cable and broadcasting ● Television broadcasting ● Music and other sound recording activities ● Music publishing ● Radio broadcasting ● Digital media (websites, design, apps, game development)
Creative recreation ● Motion picture and video production, post production & distribution ● Motion picture exhibition (cinema) ● Performing art operations (art company)
Creative retailing ● Art supplies retailing ● Antique goods retailing ● Art gallery retailing (commercial art gallery) ● Craft retailing ● Book stores and newsagencies ● Music retailing (e.g. instruments retail, record stores, etc) ● Other
Note: Sub-categories and examples were compiled based on ANZSIC codes and have made reference to City of Sydney’s creative sector classification.
44
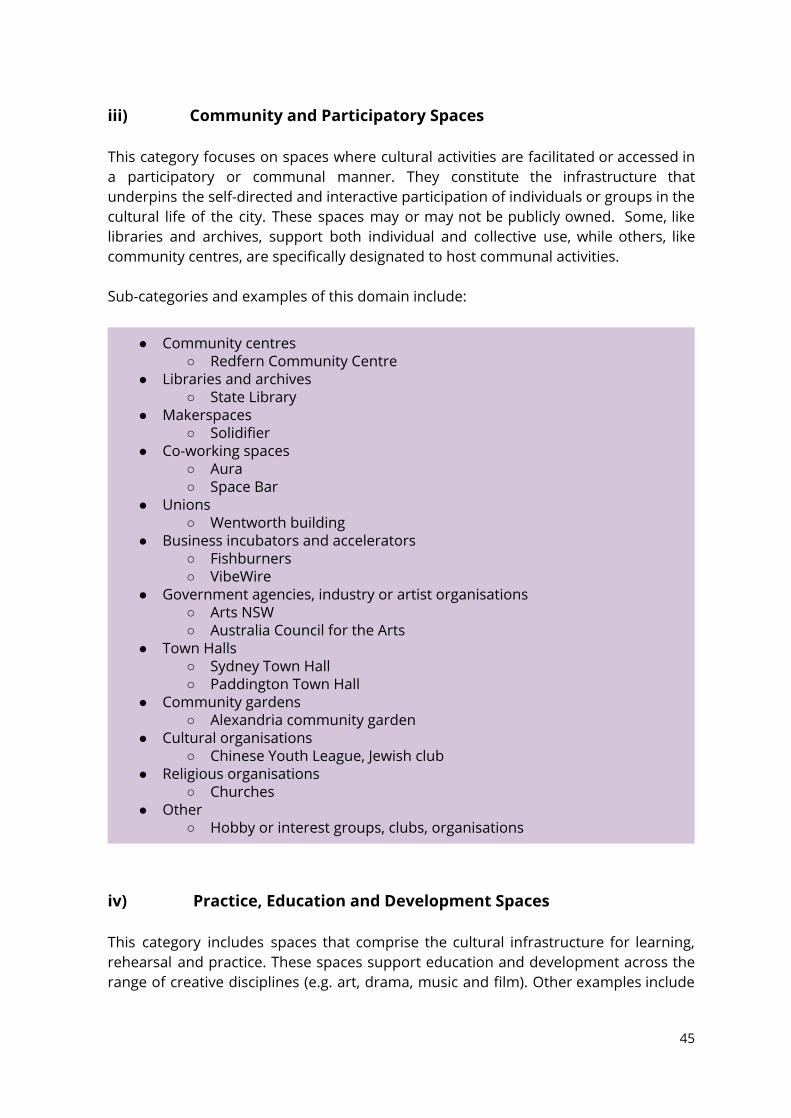
iii) Community and Participatory Spaces
This category focuses on spaces where cultural activities are facilitated or accessed in a participatory or communal manner. They constitute the infrastructure that underpins the self-directed and interactive participation of individuals or groups in the cultural life of the city. These spaces may or may not be publicly owned. Some, like libraries and archives, support both individual and collective use, while others, like community centres, are specifically designated to host communal activities. Sub-categories and examples of this domain include:
● Community centres ○ Redfern Community Centre
● Libraries and archives ○ State Library
● Makerspaces ○ Solidifier
● Co-working spaces ○ Aura ○ Space Bar
● Unions ○ Wentworth building
● Business incubators and accelerators ○ Fishburners ○ VibeWire
● Government agencies, industry or artist organisations ○ Arts NSW ○ Australia Council for the Arts
● Town Halls ○ Sydney Town Hall ○ Paddington Town Hall
● Community gardens ○ Alexandria community garden
● Cultural organisations ○ Chinese Youth League, Jewish club
● Religious organisations ○ Churches
● Other ○ Hobby or interest groups, clubs, organisations
iv) Practice, Education and Development Spaces
This category includes spaces that comprise the cultural infrastructure for learning, rehearsal and practice. These spaces support education and development across the range of creative disciplines (e.g. art, drama, music and film). Other examples include
45
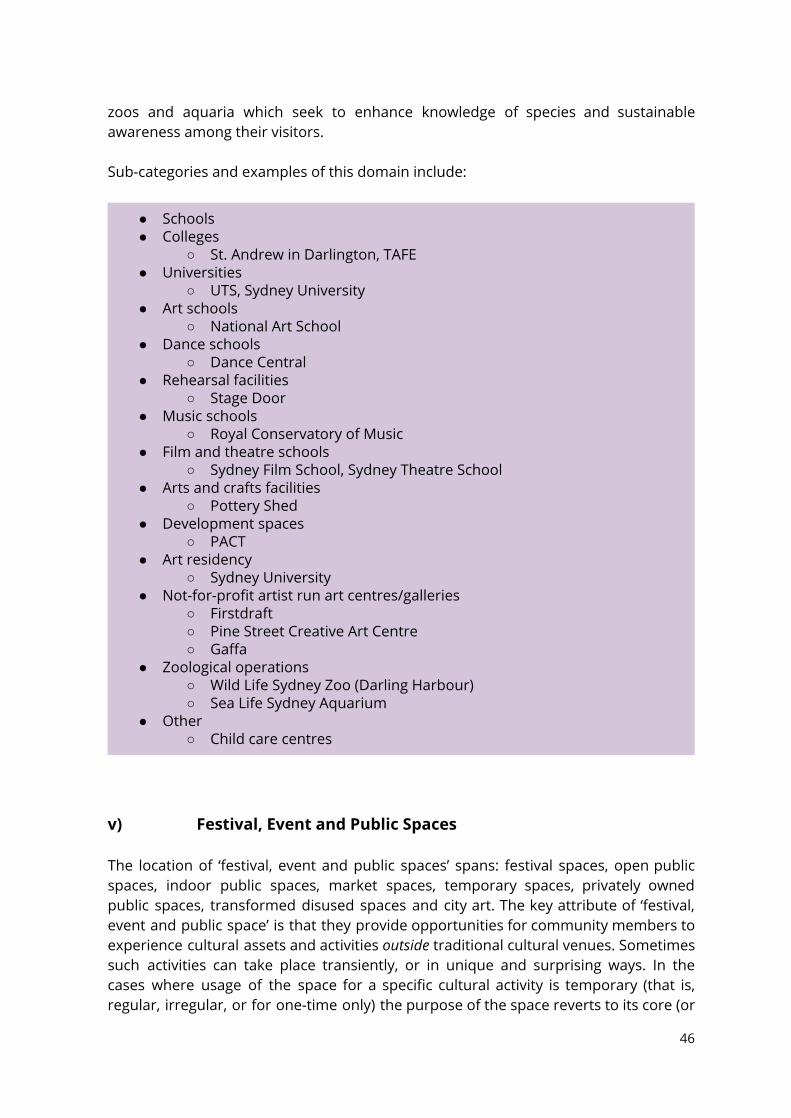
zoos and aquaria which seek to enhance knowledge of species and sustainable awareness among their visitors. Sub-categories and examples of this domain include:
● Schools ● Colleges
○ St. Andrew in Darlington, TAFE ● Universities
○ UTS, Sydney University ● Art schools
○ National Art School ● Dance schools
○ Dance Central ● Rehearsal facilities
○ Stage Door ● Music schools
○ Royal Conservatory of Music ● Film and theatre schools
○ Sydney Film School, Sydney Theatre School ● Arts and crafts facilities
○ Pottery Shed ● Development spaces
○ PACT ● Art residency
○ Sydney University ● Not-for-profit artist run art centres/galleries
○ Firstdraft ○ Pine Street Creative Art Centre ○ Gaffa
● Zoological operations ○ Wild Life Sydney Zoo (Darling Harbour) ○ Sea Life Sydney Aquarium
● Other ○ Child care centres
v) Festival, Event and Public Spaces
The location of ‘festival, event and public spaces’ spans: festival spaces, open public spaces, indoor public spaces, market spaces, temporary spaces, privately owned public spaces, transformed disused spaces and city art. The key attribute of ‘festival, event and public space’ is that they provide opportunities for community members to experience cultural assets and activities outside traditional cultural venues. Sometimes such activities can take place transiently, or in unique and surprising ways. In the cases where usage of the space for a specific cultural activity is temporary (that is, regular, irregular, or for one-time only) the purpose of the space reverts to its core (or
46
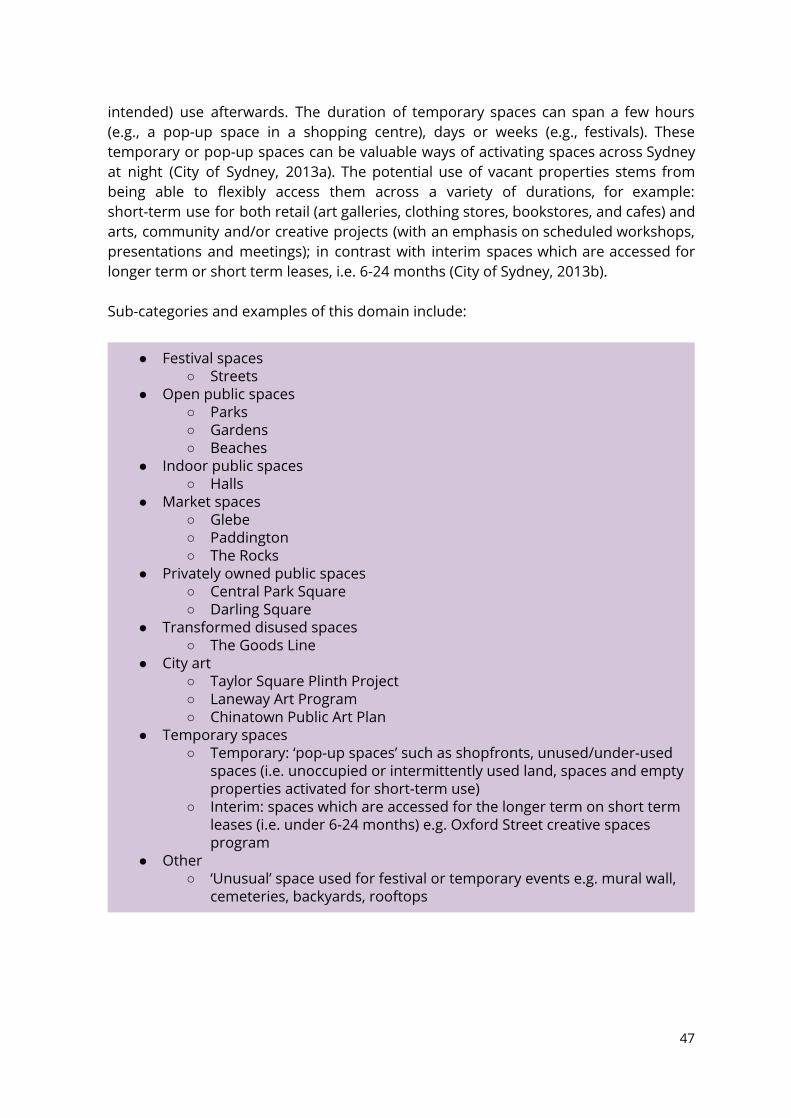
intended) use afterwards. The duration of temporary spaces can span a few hours (e.g., a pop-up space in a shopping centre), days or weeks (e.g., festivals). These temporary or pop-up spaces can be valuable ways of activating spaces across Sydney at night (City of Sydney, 2013a). The potential use of vacant properties stems from being able to flexibly access them across a variety of durations, for example: short-term use for both retail (art galleries, clothing stores, bookstores, and cafes) and arts, community and/or creative projects (with an emphasis on scheduled workshops, presentations and meetings); in contrast with interim spaces which are accessed for longer term or short term leases, i.e. 6-24 months (City of Sydney, 2013b). Sub-categories and examples of this domain include:
● Festival spaces ○ Streets
● Open public spaces ○ Parks ○ Gardens ○ Beaches
● Indoor public spaces ○ Halls
● Market spaces ○ Glebe ○ Paddington ○ The Rocks
● Privately owned public spaces ○ Central Park Square ○ Darling Square
● Transformed disused spaces ○ The Goods Line
● City art ○ Taylor Square Plinth Project ○ Laneway Art Program ○ Chinatown Public Art Plan
● Temporary spaces ○ Temporary: ‘pop-up spaces’ such as shopfronts, unused/under-used
spaces (i.e. unoccupied or intermittently used land, spaces and empty properties activated for short-term use)
○ Interim: spaces which are accessed for the longer term on short term leases (i.e. under 6-24 months) e.g. Oxford Street creative spaces program
● Other ○ ‘Unusual’ space used for festival or temporary events e.g. mural wall,
cemeteries, backyards, rooftops
47
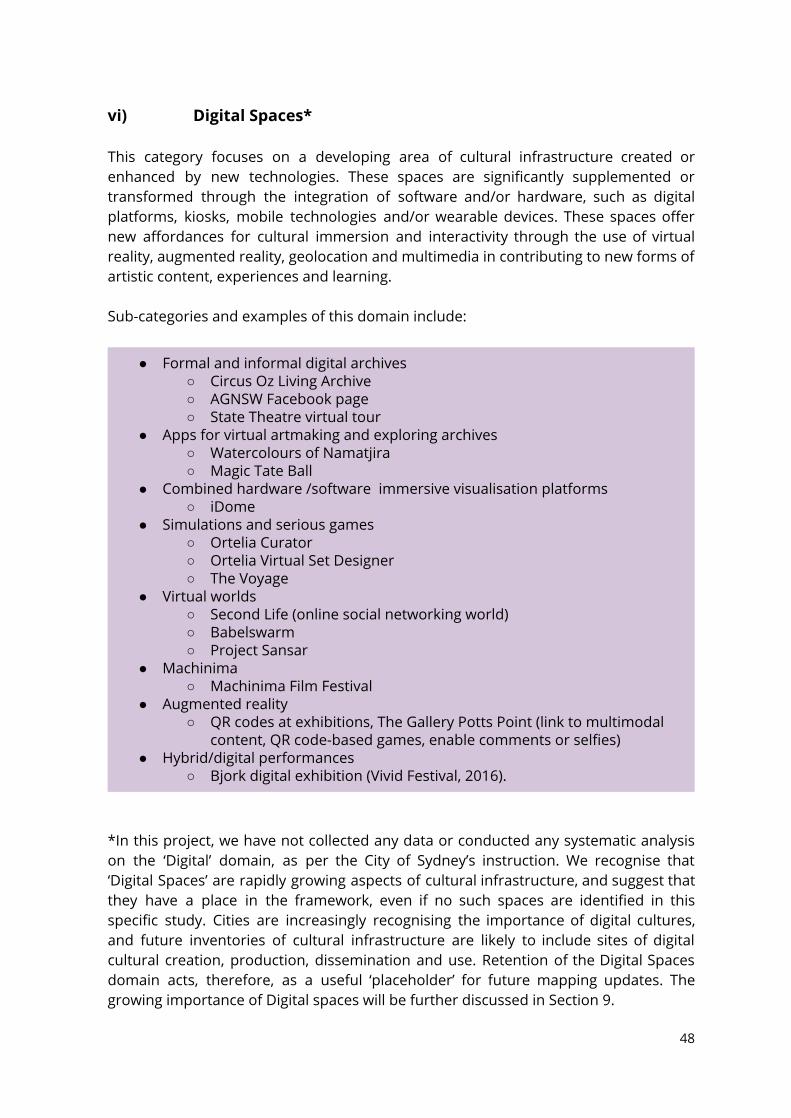
vi) Digital Spaces*
This category focuses on a developing area of cultural infrastructure created or enhanced by new technologies. These spaces are significantly supplemented or transformed through the integration of software and/or hardware, such as digital platforms, kiosks, mobile technologies and/or wearable devices. These spaces offer new affordances for cultural immersion and interactivity through the use of virtual reality, augmented reality, geolocation and multimedia in contributing to new forms of artistic content, experiences and learning. Sub-categories and examples of this domain include:
● Formal and informal digital archives ○ Circus Oz Living Archive ○ AGNSW Facebook page ○ State Theatre virtual tour
● Apps for virtual artmaking and exploring archives ○ Watercolours of Namatjira ○ Magic Tate Ball
● Combined hardware /software immersive visualisation platforms ○ iDome
● Simulations and serious games ○ Ortelia Curator ○ Ortelia Virtual Set Designer ○ The Voyage
● Virtual worlds ○ Second Life (online social networking world) ○ Babelswarm ○ Project Sansar
● Machinima ○ Machinima Film Festival
● Augmented reality ○ QR codes at exhibitions, The Gallery Potts Point (link to multimodal
content, QR code-based games, enable comments or selfies) ● Hybrid/digital performances
○ Bjork digital exhibition (Vivid Festival, 2016).
*In this project, we have not collected any data or conducted any systematic analysis on the ‘Digital’ domain, as per the City of Sydney’s instruction. We recognise that ‘Digital Spaces’ are rapidly growing aspects of cultural infrastructure, and suggest that they have a place in the framework, even if no such spaces are identified in this specific study. Cities are increasingly recognising the importance of digital cultures, and future inventories of cultural infrastructure are likely to include sites of digital cultural creation, production, dissemination and use. Retention of the Digital Spaces domain acts, therefore, as a useful ‘placeholder’ for future mapping updates. The growing importance of Digital spaces will be further discussed in Section 9.
48
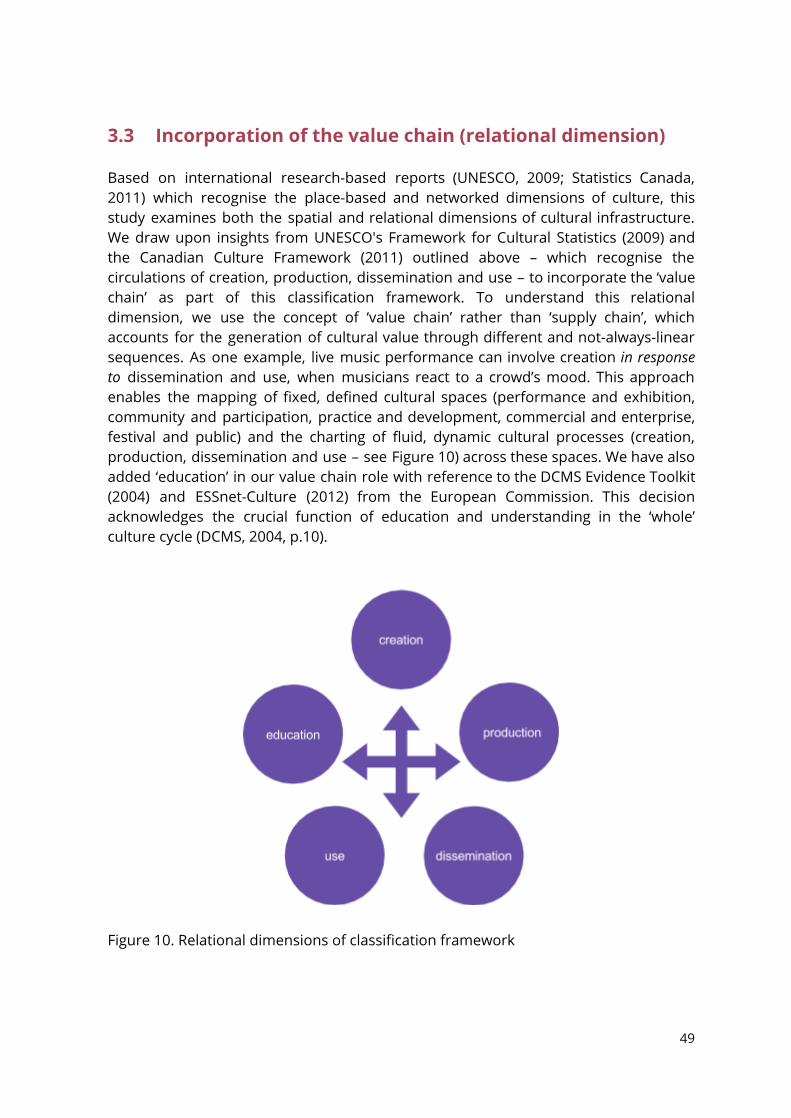
3.3 Incorporation of the value chain (relational dimension) Based on international research-based reports (UNESCO, 2009; Statistics Canada, 2011) which recognise the place-based and networked dimensions of culture, this study examines both the spatial and relational dimensions of cultural infrastructure. We draw upon insights from UNESCO's Framework for Cultural Statistics (2009) and the Canadian Culture Framework (2011) outlined above – which recognise the circulations of creation, production, dissemination and use – to incorporate the ‘value chain’ as part of this classification framework. To understand this relational dimension, we use the concept of ‘value chain’ rather than ‘supply chain’, which accounts for the generation of cultural value through different and not-always-linear sequences. As one example, live music performance can involve creation in response to dissemination and use, when musicians react to a crowd’s mood. This approach enables the mapping of fixed, defined cultural spaces (performance and exhibition, community and participation, practice and development, commercial and enterprise, festival and public) and the charting of fluid, dynamic cultural processes (creation, production, dissemination and use – see Figure 10) across these spaces. We have also added ‘education’ in our value chain role with reference to the DCMS Evidence Toolkit (2004) and ESSnet-Culture (2012) from the European Commission. This decision acknowledges the crucial function of education and understanding in the ‘whole’ culture cycle (DCMS, 2004, p.10).
Figure 10. Relational dimensions of classification framework
49
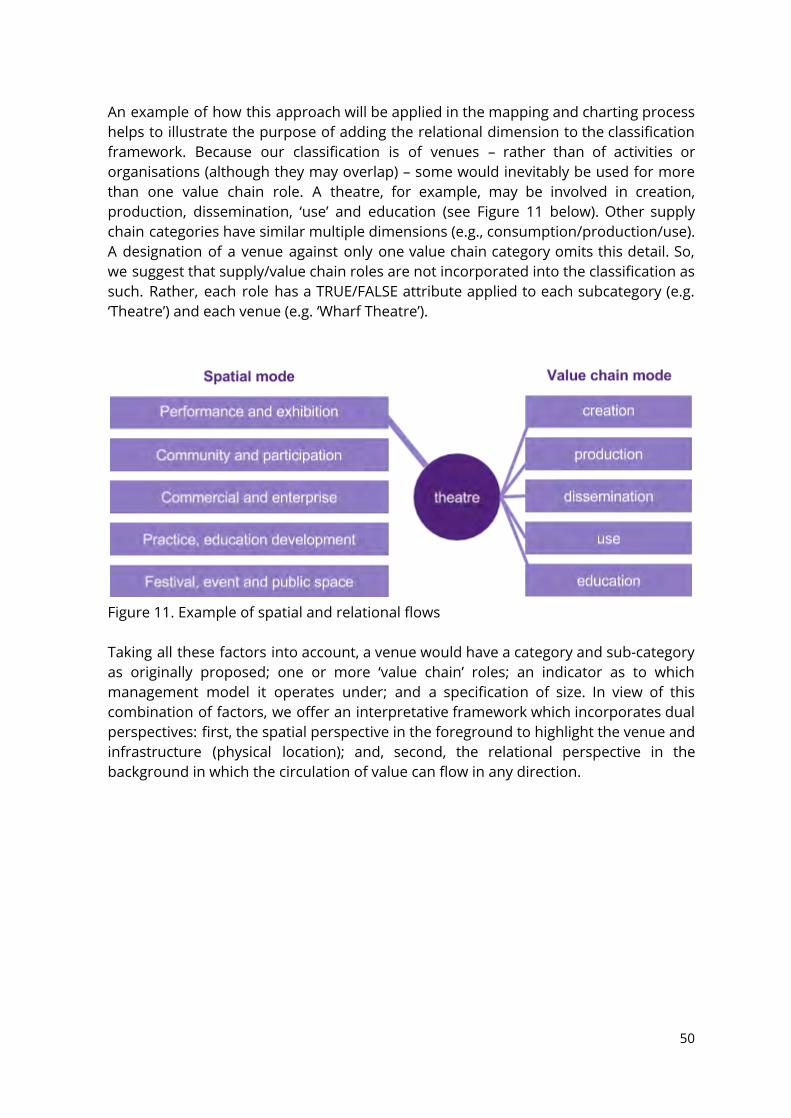
An example of how this approach will be applied in the mapping and charting process helps to illustrate the purpose of adding the relational dimension to the classification framework. Because our classification is of venues – rather than of activities or organisations (although they may overlap) – some would inevitably be used for more than one value chain role. A theatre, for example, may be involved in creation, production, dissemination, ‘use’ and education (see Figure 11 below). Other supply chain categories have similar multiple dimensions (e.g., consumption/production/use). A designation of a venue against only one value chain category omits this detail. So, we suggest that supply/value chain roles are not incorporated into the classification as such. Rather, each role has a TRUE/FALSE attribute applied to each subcategory (e.g. ‘Theatre’) and each venue (e.g. ‘Wharf Theatre’).
Figure 11. Example of spatial and relational flows Taking all these factors into account, a venue would have a category and sub-category as originally proposed; one or more ‘value chain’ roles; an indicator as to which management model it operates under; and a specification of size. In view of this combination of factors, we offer an interpretative framework which incorporates dual perspectives: first, the spatial perspective in the foreground to highlight the venue and infrastructure (physical location); and, second, the relational perspective in the background in which the circulation of value can flow in any direction.
50
3.4 Application to this study (relevance and impact) In terms of the project output, this classification framework supports dual activities regarding cultural infrastructure and venues in the City of Sydney: i) Mapping 〠ǂxed spaces (spatial dimensions): examining the quantitative aspects of cultural venues and infrastructure, such as total number (across the City of Sydney and within villages) and size in total floorspace ii) Charting the ‘value chain’ (relational dimensions): exploring the existing or emerging cultural flows around multiple spaces (e.g. creation, production, use, dissemination and education). This framework has multiple applications for the exploration and analysis of cultural venues and infrastructure. For instance, it recognises the complexity of cultural circulation and aligns strongly with existing standards (Statistics Canada, 2011; UNESCO, 2009). In addition, it enables a more nuanced, in-depth analysis while still providing a clear, robust and replicable foundation for studies of cultural infrastructure and venues. In considering how these dimensions might transfer to ESRI/ArcGIS, this framework makes it possible to respond to different queries at a more fine-grained level: to show, for instance, all medium-sized non-government operated galleries, and how they are used in different ways. The framework can, therefore, be utilised to examine the Cultural Venues and Infrastructure Database by planning, policymaking and public audiences in a range of ways. This classification framework provides parameters for mapping cultural infrastructure and venues, as well as of charting the ‘value chain’ of how these spaces are utilised. This approach provides a strong basis for future studies, as well as for planning and community engagement, especially in relation to examining creative clusters/precincts, planning and regulatory requirements, rental and property prices, and size and operating systems.
51
4. METHODOLOGY
4.1 Methodological challenges Having adopted a broad definition of cultural facilities—whereby not only formal exhibition and performance venues, but also public spaces, festivals and the creative industries have been considered an integral part of the cultural infrastructure—a major methodological and practical challenge has been that of dealing with a number of different and often non interchangeable sources of data. Another important concern of the research team has been to move from the pure domain of specific Geographic Information Systems (GIS) to the more accessible domain of Geographic Visualisation, which combines GIS instruments with more user-friendly visual tools. This shift allows the creation of research outputs that can be consulted by practitioners with different forms of expertise, and can also be used as means of engagement with the wider public. A third effort of the team has concerned with the mapping of informal, ad hoc and less known cultural venues in the City of Sydney LGA. To address this information gap, the team has decided to crowd-source information from the cultural community through an online survey. Addressing the three issues mentioned above—the complexity of data sources, the usability of research outputs, and the need to map informal cultural space—has informed the methodological choices of the research, which are described in more detail in the three following sections.
4.2 Data sources To produce maps that would offer an insight into the cultural infrastructure of the city, the project has gathered information from various sources, some of which are already in the form of GIS shapefiles, and collated them onto the main map of the LGA, which is also a GIS file containing the building outlines of the whole city. However, many of the sources, not least the crowdsourced information, did not come in the form of a GIS file, but from various other databases and from the public survey. To create a single map from sources that were different in format (ie., PDF, XLS, etc.), and which presented different attributes for each single entry, the team has constructed a single database that generates the visual information for the maps, and also contains additional information that could be visualised according to the needs of the City of Sydney. The final database allows access to data about each single element mapped in order to navigate and filter the various attributes (category, size, etc), and also to understand which is the original source of each
52
single piece of information. The geospatial data also included in the final collection allows future visualisations of the cultural infrastructure. According to the five spatial categories described in the previous sections, the wide and holistic definition of cultural infrastructure encompasses venues that are not usually categorised as strictly cultural, like public parks and the various spaces of the creative industries. As for public spaces like parks, public art locations, community and neighbourhood facilities, education facilities and major cultural venues, the City provided GIS shapefiles that have been included in the database and categorised through a simple manual process. Each entry has been assigned a category, a sub-category, and related attributes. LGA GIS FILES > categorisation > database > 秜ᇘnal map Similarly, to map cultural venues that belong to the creative industries, the team used the 2012 City of Sydney Floorspace and Employment Survey (FES) as the major data source. This research was conducted by the City of Sydney in 2012, part of the data have been used in the Creative Industries Sector Report to identify creative industries locations and hubs. The FES database—which was coded according to Australian and New Zealand Standard Industrial Classification (ANZSIC)—was much larger than that needed for the sectoral industries. Therefore, the team manually selected each code containing relevant information, and assigned categories and attributes to the original data, and then added them to the final database (the full list of ANZSIC codes used in the project can be found in Appendix 2). FES DATABASE > selection of ANZSICs > categorisation > database > 秜ᇘnal map The team was also provided with other sources of information, including previous research by the City, official reports like the World Cities Culture Report Sydney. Informal ad-hoc yellow pages searches were also conducted. These databases are very different from the previous ones, not only regarding file format, but also in that they do not contain geocoded attributes for data entries. If they contain spatial information, this is limited to the address of the venue, which is not a format that can be immediately translated into a GIS map. For this reason, these data have been processed in a more complex way. First, the data have been exported to a single file format (that chosen for the database). Second, the entries have been compared to those already existing in the database, in order not to have duplicates. Third, each entry has been categorised. Fourth, each entry has been endowed with the missing geocoded information, using a bulk geoencoding service called BatchGeo™. Other sources > export to single 秜ᇘle > categorisation > geo codi秜ᇘcation > database > 秜ᇘnal map The last source of information has been the survey data, which is based on the responses to the questionnaire, and is aimed at mapping more informal and ancillary cultural activities in the LGA. The questions have been designed to produce the key attributes for the database: category, sub-category, size,
53
government/non-government, and location. Thanks to a user-friendly form builder (JotForm™), a mapping tool has been added to the questionnaire in order to engineer the attribution of geocoded information to the crowdsourced data (the discussion and evaluation of the crowdsourcing survey are outlined in Section 8). Questionnaire responses > database > 秜ᇘnal map The final database, comprising FES data along with lists of venues compiled from other surveys, is essential for export to a consolidated ArcGIS file. The database allows for other kinds of data manipulation and analysis, including the brief summaries by spatial and value chain categories outlined in Section 5 and more detailed case study exemplified in Section 6. The full list of data sources used for the compilation of the master database is provided in Appendix 4. 4.3 From GIS to GeoViz Geographic Information Systems (GIS) are software that allow researchers to manage geographic data and display results on a map. From its inception in the late 1960s in Canada (Foresman, 1998), GIS science has become a widely used epistemic tool to research and understand territorial patterns and connections. Various proprietary and open-source devices are now available, and it is common for local administrations to use such tools for urban planning purposes, as well as for other functions that require us to visualise data on a map. However, from the very beginning many pointed out the limits of purely quantitative research and visualisations based on GIS (Goodchild, 1988; Couclelis, 2003). In more recent years, GIS experts have addressed this drawback in various ways, conceiving research practices based on a mix of qualitative and quantitative geographic information, or based on forms of engagement, like the participatory GIS (Rambaldi et al., 2005) that allow a wider variety of data to be represented on the same platform. Despite these advancements, research still shows that GIS tools are based on very specific forms of software expertise that make it difficult to communicate geographic information, both internally for policy making purposes, and externally as a tool of public engagement (Elwood, 2006). On the other hand, the liberalisation of GPS technology (satellite geopositioning system), the birth of Yahoo! Maps, Google Maps, and the phenomenon of Volunteer Geographic Information (VGI) (Goodchild, 2007) highlight an increasing public familiarity with mapping devices and maps themselves that goes far beyond the domain of professional cartographic expertise. For these reasons, researchers like Jacques Bertin (1983) and Alan MacEachren (MacEachren and Kraak, 2001) have suggested that the concept of Geographic Visualisation might advance the possibilities of GIS itself, by combining it with more interactive, user-friendly maps and other visualisations and trends in the field of VGI.
54
The research team has acknowledged this tendency in GIS research (Wright, 2012; Sui, 2012), and recognised the limits of a purely cartographic approach to mapping the cultural infrastructure of the city. Although the City of Sydney expressed reservations about our proposal to create interactive maps, we believe that interactive maps and user-friendly mapping platform creation may offer scope for valuable development of this mapping project in future.
4.4 The crowd sourcing survey A crowd-sourced mapping exercise was also conceived in the form of a survey in attempting to map beyond what is already mapped (for example, in the FES data) and perhaps to reveal more fragile, tenuous forms of infrastructure that underpin informal and ad-hoc cultural activities. The survey, which was delivered to cultural organisations and institutions, and spread through snowballing to individual artists and cultural practitioners, was structured according to the framework described above. Its aim was to capture cultural venues not represented in the floor space data. It was designed to be easy, quick and user-friendly, within the limits of online forms, and was divided into sections that allowed the research team to filter participants on the basis of key answers. The clarity of the questions was assessed through a small number of test respondents, including experts in the field and lay users. To create the form, the team employed an online tool called Jotform, which is a wysiwyg (what you see is what you get) web service (ie., a platform that allows a visual composition of the front-end elements of a web page, in this case the online survey). The crowd-sourced survey questionnaire can be found in Appendix 3, and an evaluation of it provided in Section 8.
55
5. FINDINGS AND DISCUSSION
5.1 Approach As discussed in our interim report, the data used in the analysis are generated by both ‘synthetic’ and ‘analytic’ approaches. In terms of the ‘synthetic’ data, we used the 2012 Floorspace and Employment Survey (FES) data supplied by the City of Sydney, which mainly covered the venues of cultural/creative industries in the City of Sydney LGA. Each record in the FES includes an ANZSIC (Australian and New Zealand Standard Industry Classification) code that identified the main industry associated with that venue. We mapped, respectively, our spatial and value chain categories to ANZSIC codes. We then used that mapping to link those categories to specific venues, and imported these augmented data into ArcGIS . Our goal was to demonstrate how cultural venues in the FES data can be summarised and mapped according to two types of cultural classification – what we refer to above as ‘spatial’ and ‘value chain’ flows (Section 3).
With regard to the ‘analytic’ data, we used the separate spreadsheets of cultural venues supplied by the City of Sydney, including lists of theatres, cinemas, music venues, and cultural buildings, the data collected from the crowd-sourced survey, and additional ad hoc searches of industry directories, websites, festival brochures and past research reports on cultural infrastructure and venues. Since, we had no ANZSIC or other classificatory information, we manually applied individual spatial and value chain designations to these records. The complete list of both ‘synthetic’ and ‘analytic’ data sources used in the project can be found in Appendix 4.
Table 5 shows the total entries of venues that we initially collected for this project. The extract from the 2012 FES database contains 5,260 venues, each with a primary ANZSIC designation. Our list of venues compiled from City of Sydney sources that do not include floorspace data is 1,128 in total. Other venues extracted from the FES data in shapefile format – such as those that are not conspicuously cultural but can be used for cultural events (e.g. public parks) – totalled 268. We also expected that an additional 50-100 non-overlapping venues would be identified via our crowdsourcing survey. Table 5 summarises our initial data source statistics.
56
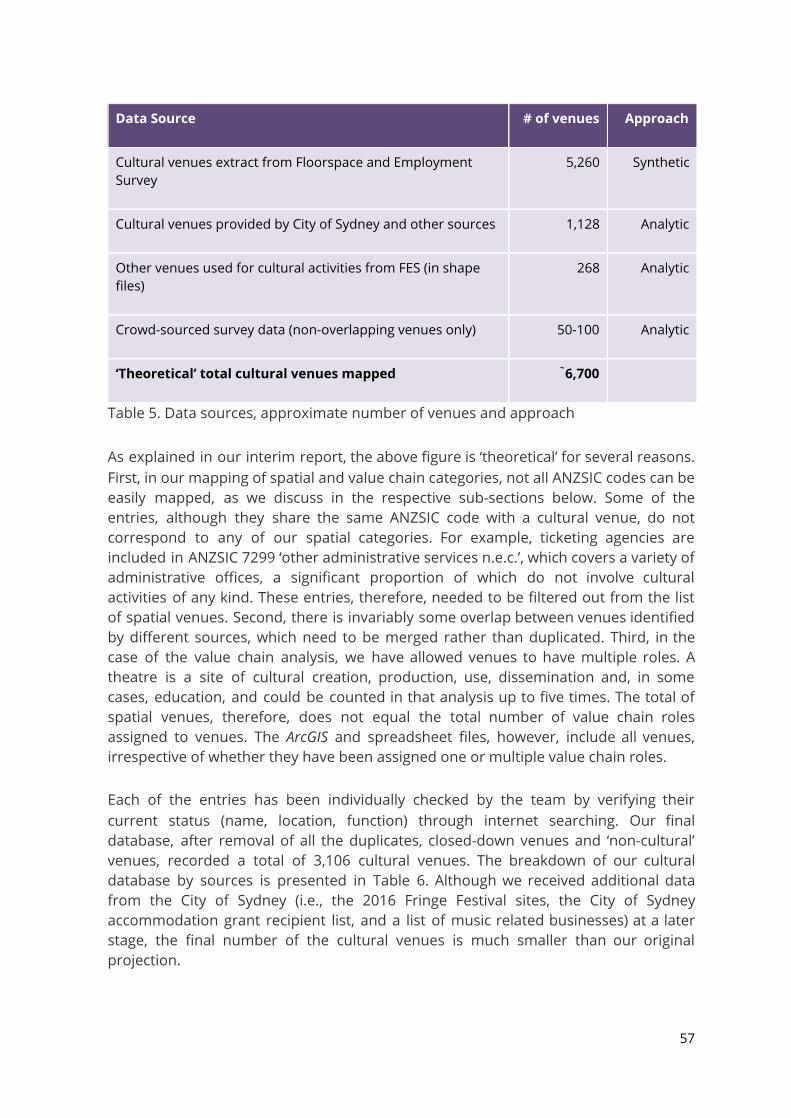
Data Source # of venues Approach
Cultural venues extract from Floorspace and Employment Survey
5,260 Synthetic
Cultural venues provided by City of Sydney and other sources 1,128 Analytic
Other venues used for cultural activities from FES (in shape files)
268 Analytic
Crowd-sourced survey data (non-overlapping venues only) 50-100 Analytic
‘Theoretical’ total cultural venues mapped ̃6,700
Table 5. Data sources, approximate number of venues and approach As explained in our interim report, the above figure is ‘theoretical’ for several reasons. First, in our mapping of spatial and value chain categories, not all ANZSIC codes can be easily mapped, as we discuss in the respective sub-sections below. Some of the entries, although they share the same ANZSIC code with a cultural venue, do not correspond to any of our spatial categories. For example, ticketing agencies are included in ANZSIC 7299 ‘other administrative services n.e.c.’, which covers a variety of administrative offices, a significant proportion of which do not involve cultural activities of any kind. These entries, therefore, needed to be filtered out from the list of spatial venues. Second, there is invariably some overlap between venues identified by different sources, which need to be merged rather than duplicated. Third, in the case of the value chain analysis, we have allowed venues to have multiple roles. A theatre is a site of cultural creation, production, use, dissemination and, in some cases, education, and could be counted in that analysis up to five times. The total of spatial venues, therefore, does not equal the total number of value chain roles assigned to venues. The ArcGIS and spreadsheet files, however, include all venues, irrespective of whether they have been assigned one or multiple value chain roles. Each of the entries has been individually checked by the team by verifying their current status (name, location, function) through internet searching. Our final database, after removal of all the duplicates, closed-down venues and ‘non-cultural’ venues, recorded a total of 3,106 cultural venues. The breakdown of our cultural database by sources is presented in Table 6. Although we received additional data from the City of Sydney (i.e., the 2016 Fringe Festival sites, the City of Sydney accommodation grant recipient list, and a list of music related businesses) at a later stage, the final number of the cultural venues is much smaller than our original projection.
57
As shown in Table 6, a substantial number of entries have been removed from the original data set. In particular, we removed nearly two thirds of the data (67%) from the FES for two reasons: first, through data checking and verifying processes, we discovered that a large amount of data contained in the FES extract did not constitute cultural venues per se . For example, musical instrument retailing, coded as ANZSIC 4279 ‘Other stored based retailing n.e.c.’, is embedded in a wide range of retail shops, many of which do not have any significant cultural role. This issue reflects the difficulty of matching cultural venues with corresponding ANZSIC codes, as even at the ‘4 digit’ level they are still too broad to align with our classification at the sub-category level. Second, our major data source—the FES—was conducted in 2012. During our data validating process, we removed many venues/organisations that have closed down. Whilst such change may reflect the natural business cycle of individual companies or the re-structuring of a particular industrial sector, it inevitably affected the total number of cultural venues mapped in this project and the accuracy of our maps. For example, in the advertising services sector we noticed that many businesses have closed down, been renamed or merged with other advertising companies. A similar pattern was found in the performance venues category for the live music sector (e.g. hotels, bars, cafes and clubs). We noticed that a large number of bars and clubs within the City of Sydney have closed down, possibly as a consequence of the introduction of the ‘lock-out’ laws since 2014. Another major discrepancy between the ‘theoretical’ and ‘actual’ dataset is the number of crowdsourcing survey responses received. As mentioned earlier, we originally expected to receive about 80-100 completed questionnaires and to identify around 50 non-overlapping cultural venues. However, despite our best efforts to promote the survey via various media, and to create an additional customised version for the live music sector, by the closing date (31 August 2016) of the survey, only 45 questionnaires were received, among which only 17 non-overlapping cultural venues were identified and subsequently added into the master database. The difficulties concerning the crowdsourced survey is discussed in Section 8 below. It is also worth noting that, although 3,106 cultural venues are recorded in our database, not all the venues can be shown on a map. This is because some of the identified cultural venues in our database could not be linked to a shapefile , and hence needed to be excluded in our final maps . These include venues with addresses that are not accurate enough to determine the exact building, items such as statues or other public art installations which are not represented in the shapefiles, and venues in newly-constructed buildings or buildings which are not present in the shapefile for other reasons. As a result, only 2,792 geo-located cultural venues that can be linked to the building shapefiles are shown in our final maps.
58
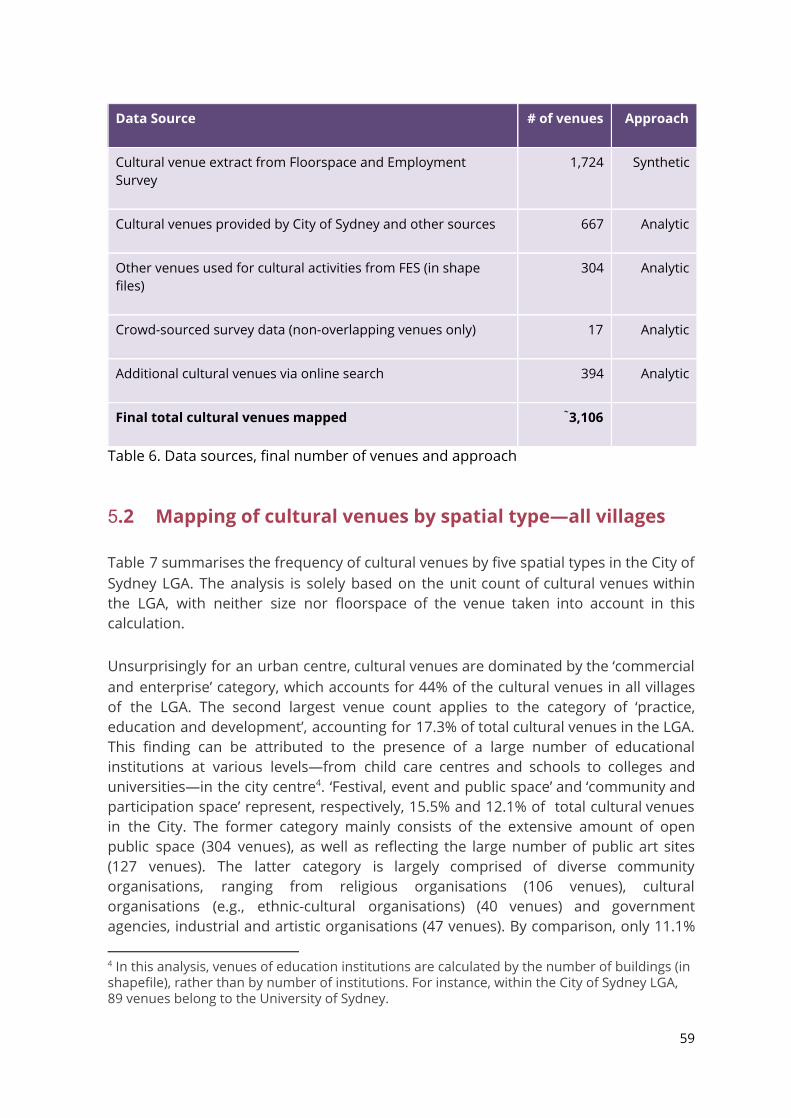
Data Source # of venues Approach
Cultural venue extract from Floorspace and Employment Survey
1,724 Synthetic
Cultural venues provided by City of Sydney and other sources 667 Analytic
Other venues used for cultural activities from FES (in shape files)
304 Analytic
Crowd-sourced survey data (non-overlapping venues only) 17 Analytic
Additional cultural venues via online search 394 Analytic
Final total cultural venues mapped ̃3,106
Table 6. Data sources, final number of venues and approach
5 .2 Mapping of cultural venues by spatial type—all villages Table 7 summarises the frequency of cultural venues by five spatial types in the City of Sydney LGA. The analysis is solely based on the unit count of cultural venues within the LGA, with neither size nor floorspace of the venue taken into account in this calculation. Unsurprisingly for an urban centre, cultural venues are dominated by the ‘commercial and enterprise’ category, which accounts for 44% of the cultural venues in all villages of the LGA. The second largest venue count applies to the category of ‘practice, education and development’, accounting for 17.3% of total cultural venues in the LGA. This finding can be attributed to the presence of a large number of educational institutions at various levels—from child care centres and schools to colleges and universities—in the city centre . ‘Festival, event and public space’ and ‘community and 4
participation space’ represent, respectively, 15.5% and 12.1% of total cultural venues in the City. The former category mainly consists of the extensive amount of open public space (304 venues), as well as reflecting the large number of public art sites (127 venues). The latter category is largely comprised of diverse community organisations, ranging from religious organisations (106 venues), cultural organisations (e.g., ethnic-cultural organisations) (40 venues) and government agencies, industrial and artistic organisations (47 venues). By comparison, only 11.1%
4 In this analysis, venues of education institutions are calculated by the number of buildings (in shapefile), rather than by number of institutions. For instance, within the City of Sydney LGA, 89 venues belong to the University of Sydney.
59
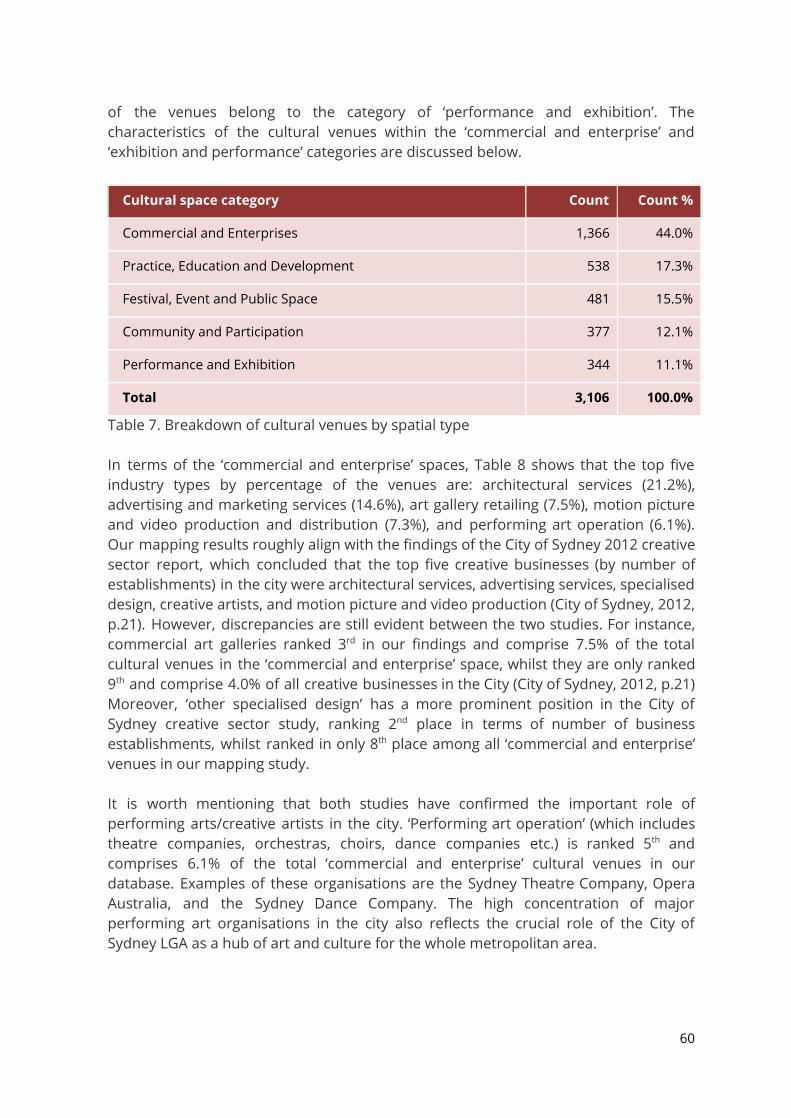
of the venues belong to the category of ‘performance and exhibition’. The characteristics of the cultural venues within the ‘commercial and enterprise’ and ‘exhibition and performance’ categories are discussed below.
Cultural space category Count Count %
Commercial and Enterprises 1,366 44.0%
Practice, Education and Development 538 17.3%
Festival, Event and Public Space 481 15.5%
Community and Participation 377 12.1%
Performance and Exhibition 344 11.1%
Total 3,106 100.0%
Table 7. Breakdown of cultural venues by spatial type In terms of the ‘commercial and enterprise’ spaces, Table 8 shows that the top five industry types by percentage of the venues are: architectural services (21.2%), advertising and marketing services (14.6%), art gallery retailing (7.5%), motion picture and video production and distribution (7.3%), and performing art operation (6.1%). Our mapping results roughly align with the findings of the City of Sydney 2012 creative sector report, which concluded that the top five creative businesses (by number of establishments) in the city were architectural services, advertising services, specialised design, creative artists, and motion picture and video production (City of Sydney, 2012, p.21). However, discrepancies are still evident between the two studies. For instance, commercial art galleries ranked 3 rd in our findings and comprise 7.5% of the total cultural venues in the ‘commercial and enterprise’ space, whilst they are only ranked 9 th and comprise 4.0% of all creative businesses in the City (City of Sydney, 2012, p.21) Moreover, ‘other specialised design’ has a more prominent position in the City of Sydney creative sector study, ranking 2 nd place in terms of number of business establishments, whilst ranked in only 8 th place among all ‘commercial and enterprise’ venues in our mapping study. It is worth mentioning that both studies have confirmed the important role of performing arts/creative artists in the city. ‘Performing art operation’ (which includes theatre companies, orchestras, choirs, dance companies etc.) is ranked 5 th and comprises 6.1% of the total ‘commercial and enterprise’ cultural venues in our database. Examples of these organisations are the Sydney Theatre Company, Opera Australia, and the Sydney Dance Company. The high concentration of major performing art organisations in the city also reflects the crucial role of the City of Sydney LGA as a hub of art and culture for the whole metropolitan area.
60
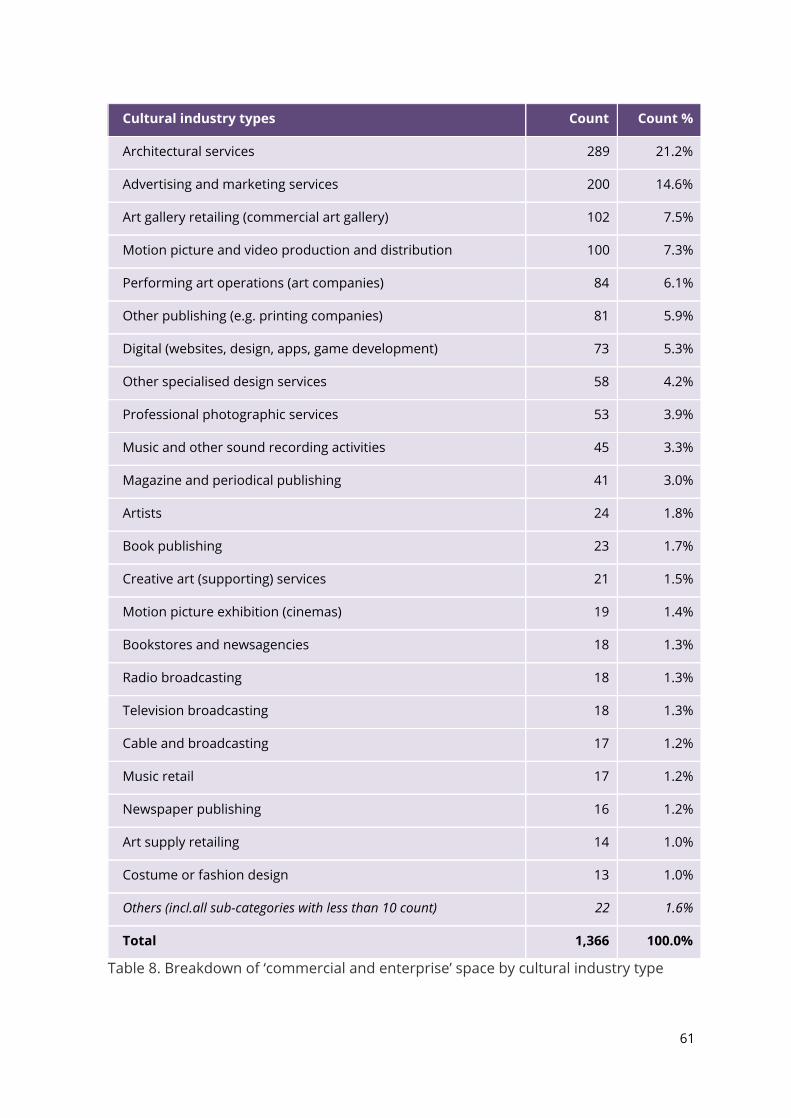
Cultural industry types Count Count %
Architectural services 289 21.2%
Advertising and marketing services 200 14.6%
Art gallery retailing (commercial art gallery) 102 7.5%
Motion picture and video production and distribution 100 7.3%
Performing art operations (art companies) 84 6.1%
Other publishing (e.g. printing companies) 81 5.9%
Digital (websites, design, apps, game development) 73 5.3%
Other specialised design services 58 4.2%
Professional photographic services 53 3.9%
Music and other sound recording activities 45 3.3%
Magazine and periodical publishing 41 3.0%
Artists 24 1.8%
Book publishing 23 1.7%
Creative art (supporting) services 21 1.5%
Motion picture exhibition (cinemas) 19 1.4%
Bookstores and newsagencies 18 1.3%
Radio broadcasting 18 1.3%
Television broadcasting 18 1.3%
Cable and broadcasting 17 1.2%
Music retail 17 1.2%
Newspaper publishing 16 1.2%
Art supply retailing 14 1.0%
Costume or fashion design 13 1.0%
Others (incl.all sub-categories with less than 10 count) 22 1.6%
Total 1,366 100.0%
Table 8. Breakdown of ‘commercial and enterprise’ space by cultural industry type
61
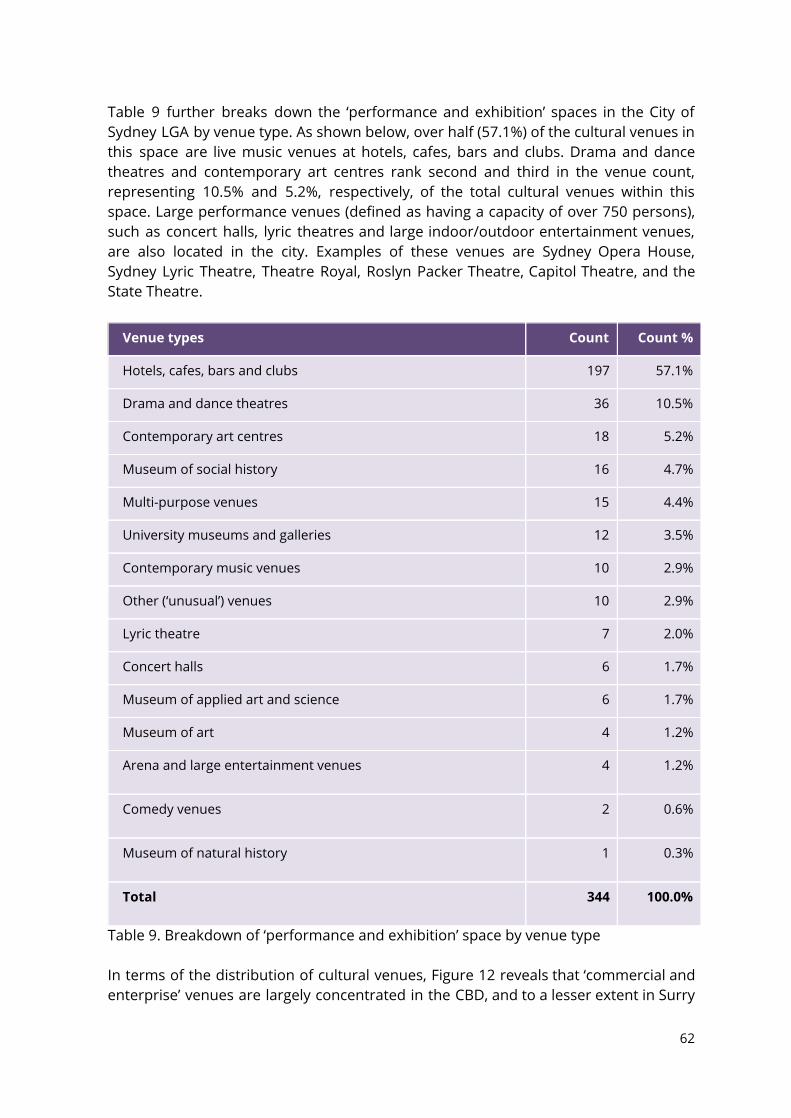
Table 9 further breaks down the ‘performance and exhibition’ spaces in the City of Sydney LGA by venue type. As shown below, over half (57.1%) of the cultural venues in this space are live music venues at hotels, cafes, bars and clubs. Drama and dance theatres and contemporary art centres rank second and third in the venue count, representing 10.5% and 5.2%, respectively, of the total cultural venues within this space. Large performance venues (defined as having a capacity of over 750 persons), such as concert halls, lyric theatres and large indoor/outdoor entertainment venues, are also located in the city. Examples of these venues are Sydney Opera House, Sydney Lyric Theatre, Theatre Royal, Roslyn Packer Theatre, Capitol Theatre, and the State Theatre.
Venue types Count Count %
Hotels, cafes, bars and clubs 197 57.1%
Drama and dance theatres 36 10.5%
Contemporary art centres 18 5.2%
Museum of social history 16 4.7%
Multi-purpose venues 15 4.4%
University museums and galleries 12 3.5%
Contemporary music venues 10 2.9%
Other (‘unusual’) venues 10 2.9%
Lyric theatre 7 2.0%
Concert halls 6 1.7%
Museum of applied art and science 6 1.7%
Museum of art 4 1.2%
Arena and large entertainment venues 4 1.2%
Comedy venues 2 0.6%
Museum of natural history 1 0.3%
Total 344 100.0%
Table 9. Breakdown of ‘performance and exhibition’ space by venue type In terms of the distribution of cultural venues, Figure 12 reveals that ‘commercial and enterprise’ venues are largely concentrated in the CBD, and to a lesser extent in Surry
62
Hills (Crown and Baptist Street Village), Ultimo (Harris Street Village) and Alexandria (Green Square Village). A similar pattern can be identified for the ‘performance and exhibition’ venues. There is a concentration of ‘performance and exhibition’ venues in the CBD (along George Street and Pitt Street) and a smaller concentration of ‘performance and exhibition’ venues in Darlinghurst and Paddington (Oxford Street Village) along Oxford Street. These are clusters of hotels, bars, cafes and clubs for live music performance. ‘Community and participation’ venues are relatively scattered across the City, with a small concentration of cultural clubs (such as the China Cultural Centre, Korean Cultural Office, Hellenic Club, Irish Club, etc.) along Castlereagh and Elizabeth Streets. The ‘Festival, event and public space’ category is largely constituted by open public space (i.e. parks and reserves) spread throughout the City. Examples of notable ‘green’ space are the Royal Botanic Gardens, The Domain, Hyde Park, Jubilee Park, Victoria Park, Prince Alfred Park, Moore Park and Sydney Park. ‘Practice, education and development’ spaces are mostly found in the western side of City, in Ultimo and Camperdown, where the campuses of University of Technology Sydney (UTS) and the University of Sydney are located, as well as in the north of the CBD, including some design and music schools (e.g., SAE Institute and the Sydney Conservatorium of Music). A small concentration of development spaces and artist-run art galleries can be found in Surry Hills and Chippendale. Figure 13 is a heat map of all the cultural venues in the City of Sydney LGA. The darker colour represents a higher density of cultural venues. It shows that the highest density of cultural venues can be found in Surry Hills (Crown and Baptist Street Village), 5
where a cultural hub has emerged in an area characterised by a large number of creative/cultural firms (notably architectural, advertising and digital services), and development and co-working spaces. The second highest density of cultural venues can be found in the CBD (between Wynyard, Martin Place, St James and Town Hall), where venues of different spatial types can be found and may be drawn by the location advantage of a CBD. A smaller concentration of cultural venues can be found along Oxford Street between Darlinghurst and Paddington, which can be attributed to the concentration of live music venues such as hotels, bars and clubs in the area.
5 Our findings relating to the density of cultural venues in the City are different from those in the 2012 City of Sydney creative sector report, in which the CBD and Harbour recorded the highest density of creative businesses, whilst Crown and Baptist Streets (Surry Hills) came a close second. We believe that the differences in the findings are mainly caused by the classification method that we used in our study, which also includes non-commercial cultural venues (e.g. community and educational cultural venues and public space).
63
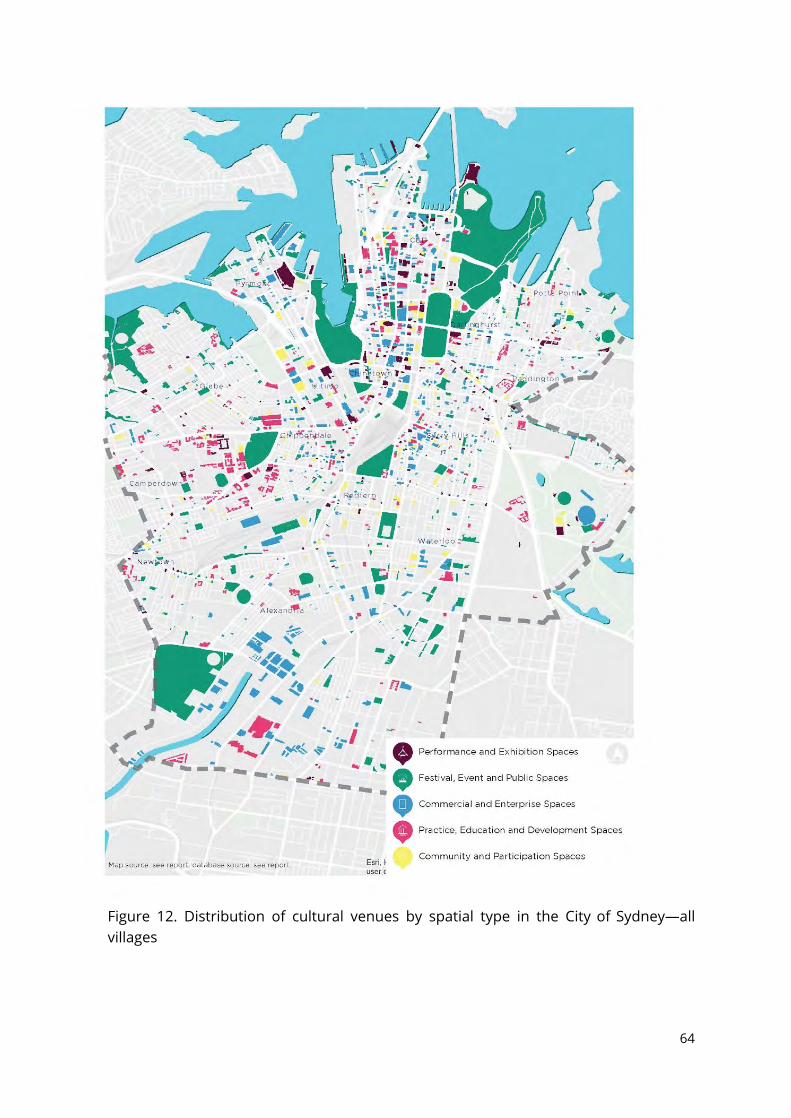
Figure 12. Distribution of cultural venues by spatial type in the City of Sydney—all villages
64
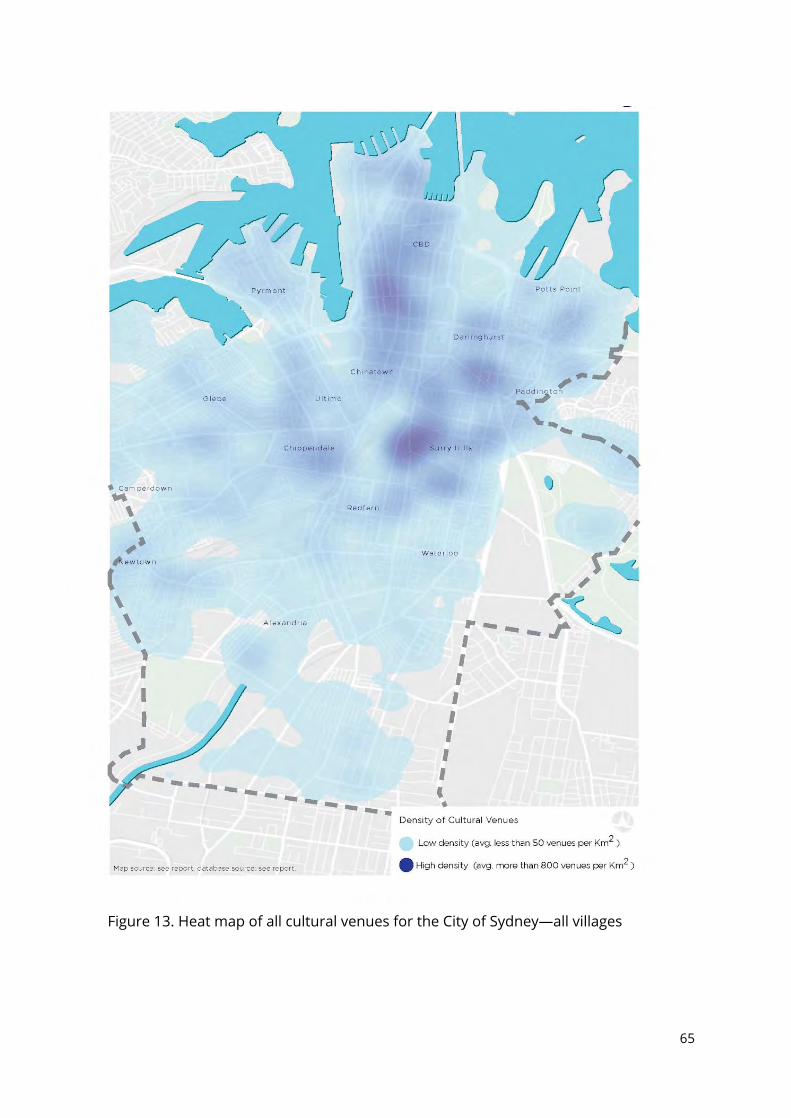
Figure 13. Heat map of all cultural venues for the City of Sydney—all villages
65
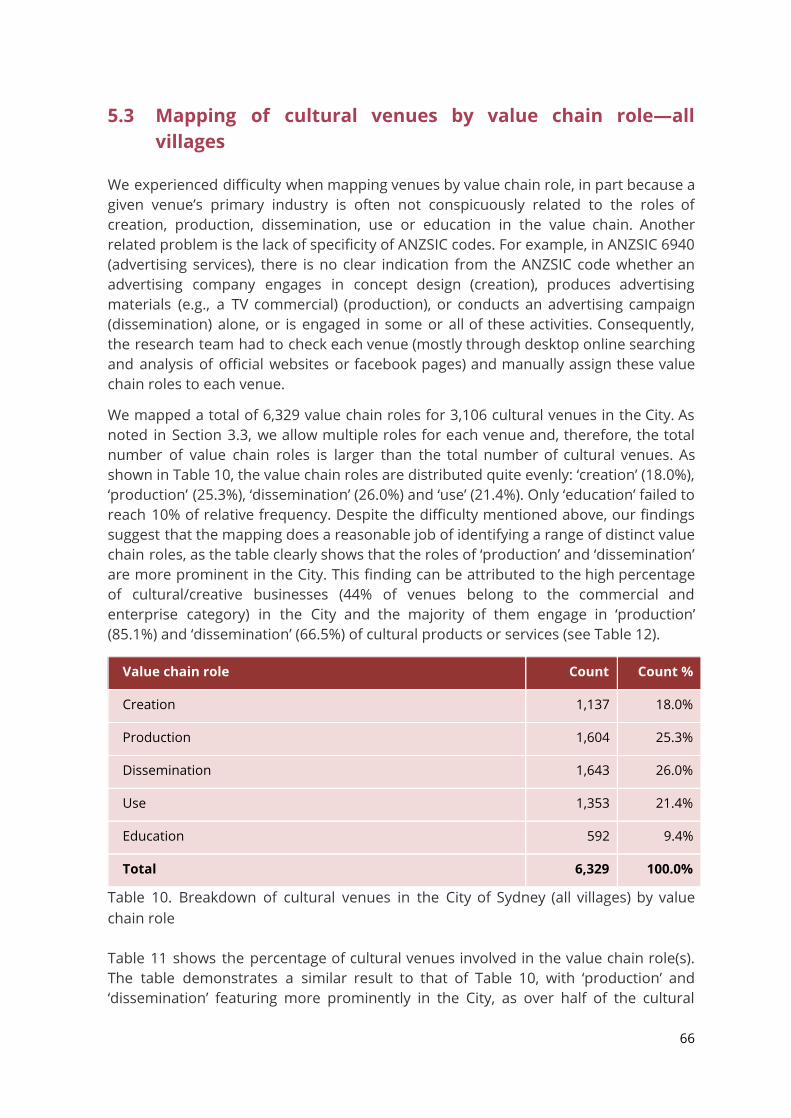
5.3 Mapping of cultural venues by value chain role—all villages
We experienced difficulty when mapping venues by value chain role, in part because a given venue’s primary industry is often not conspicuously related to the roles of creation, production, dissemination, use or education in the value chain. Another related problem is the lack of specificity of ANZSIC codes. For example, in ANZSIC 6940 (advertising services), there is no clear indication from the ANZSIC code whether an advertising company engages in concept design (creation), produces advertising materials (e.g., a TV commercial) (production), or conducts an advertising campaign (dissemination) alone, or is engaged in some or all of these activities. Consequently, the research team had to check each venue (mostly through desktop online searching and analysis of official websites or facebook pages) and manually assign these value chain roles to each venue.
We mapped a total of 6,329 value chain roles for 3,106 cultural venues in the City. As noted in Section 3.3, we allow multiple roles for each venue and, therefore, the total number of value chain roles is larger than the total number of cultural venues. As shown in Table 10, the value chain roles are distributed quite evenly: ‘creation’ (18.0%), ‘production’ (25.3%), ‘dissemination’ (26.0%) and ‘use’ (21.4%). Only ‘education’ failed to reach 10% of relative frequency. Despite the difficulty mentioned above, our findings suggest that the mapping does a reasonable job of identifying a range of distinct value chain roles, as the table clearly shows that the roles of ‘production’ and ‘dissemination’ are more prominent in the City. This finding can be attributed to the high percentage of cultural/creative businesses (44% of venues belong to the commercial and enterprise category) in the City and the majority of them engage in ‘production’ (85.1%) and ‘dissemination’ (66.5%) of cultural products or services (see Table 12).
Value chain role Count Count %
Creation 1,137 18.0%
Production 1,604 25.3%
Dissemination 1,643 26.0%
Use 1,353 21.4%
Education 592 9.4%
Total 6,329 100.0%
Table 10. Breakdown of cultural venues in the City of Sydney (all villages) by value chain role Table 11 shows the percentage of cultural venues involved in the value chain role(s). The table demonstrates a similar result to that of Table 10, with ‘production’ and ‘dissemination’ featuring more prominently in the City, as over half of the cultural
66
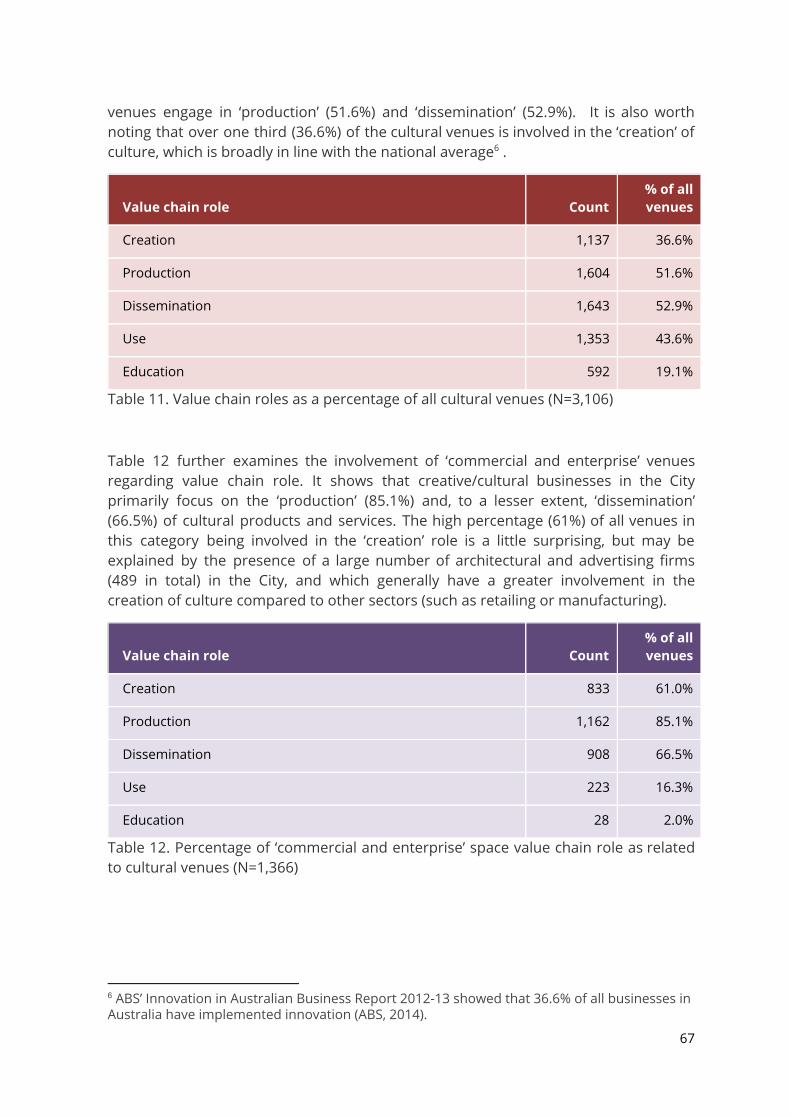
venues engage in ‘production’ (51.6%) and ‘dissemination’ (52.9%). It is also worth noting that over one third (36.6%) of the cultural venues is involved in the ‘creation’ of culture, which is broadly in line with the national average . 6
Value chain role Count % of all venues
Creation 1,137 36.6%
Production 1,604 51.6%
Dissemination 1,643 52.9%
Use 1,353 43.6%
Education 592 19.1%
Table 11. Value chain roles as a percentage of all cultural venues (N=3,106)
Table 12 further examines the involvement of ‘commercial and enterprise’ venues regarding value chain role. It shows that creative/cultural businesses in the City primarily focus on the ‘production’ (85.1%) and, to a lesser extent, ‘dissemination’ (66.5%) of cultural products and services. The high percentage (61%) of all venues in this category being involved in the ‘creation’ role is a little surprising, but may be explained by the presence of a large number of architectural and advertising firms (489 in total) in the City, and which generally have a greater involvement in the creation of culture compared to other sectors (such as retailing or manufacturing).
Value chain role Count % of all venues
Creation 833 61.0%
Production 1,162 85.1%
Dissemination 908 66.5%
Use 223 16.3%
Education 28 2.0%
Table 12. Percentage of ‘commercial and enterprise’ space value chain role as related to cultural venues (N=1,366)
6 ABS’ Innovation in Australian Business Report 2012-13 showed that 36.6% of all businesses in Australia have implemented innovation (ABS, 2014).
67
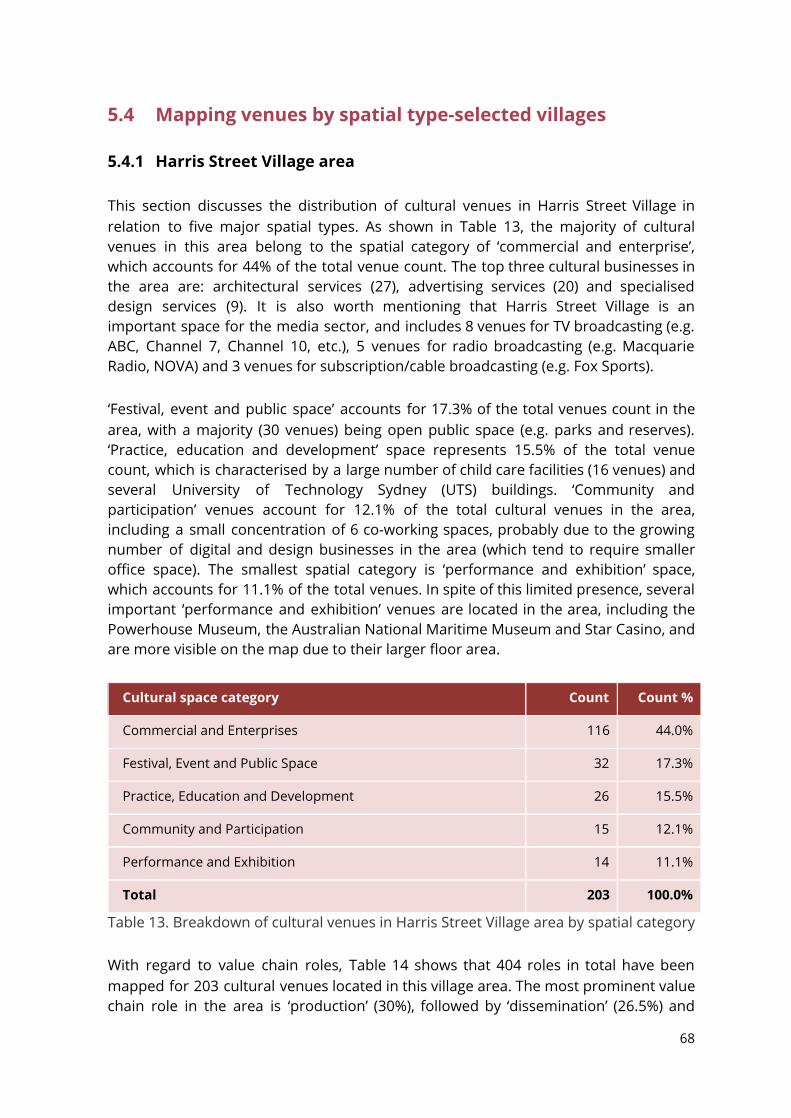
5.4 Mapping venues by spatial type-selected villages 5.4.1 Harris Street Village area This section discusses the distribution of cultural venues in Harris Street Village in relation to five major spatial types. As shown in Table 13, the majority of cultural venues in this area belong to the spatial category of ‘commercial and enterprise’, which accounts for 44% of the total venue count. The top three cultural businesses in the area are: architectural services (27), advertising services (20) and specialised design services (9). It is also worth mentioning that Harris Street Village is an important space for the media sector, and includes 8 venues for TV broadcasting (e.g. ABC, Channel 7, Channel 10, etc.), 5 venues for radio broadcasting (e.g. Macquarie Radio, NOVA) and 3 venues for subscription/cable broadcasting (e.g. Fox Sports). ‘Festival, event and public space’ accounts for 17.3% of the total venues count in the area, with a majority (30 venues) being open public space (e.g. parks and reserves). ‘Practice, education and development’ space represents 15.5% of the total venue count, which is characterised by a large number of child care facilities (16 venues) and several University of Technology Sydney (UTS) buildings. ‘Community and participation’ venues account for 12.1% of the total cultural venues in the area, including a small concentration of 6 co-working spaces, probably due to the growing number of digital and design businesses in the area (which tend to require smaller office space). The smallest spatial category is ‘performance and exhibition’ space, which accounts for 11.1% of the total venues. In spite of this limited presence, several important ‘performance and exhibition’ venues are located in the area, including the Powerhouse Museum, the Australian National Maritime Museum and Star Casino, and are more visible on the map due to their larger floor area.
Cultural space category Count Count %
Commercial and Enterprises 116 44.0%
Festival, Event and Public Space 32 17.3%
Practice, Education and Development 26 15.5%
Community and Participation 15 12.1%
Performance and Exhibition 14 11.1%
Total 203 100.0%
Table 13. Breakdown of cultural venues in Harris Street Village area by spatial category With regard to value chain roles, Table 14 shows that 404 roles in total have been mapped for 203 cultural venues located in this village area. The most prominent value chain role in the area is ‘production’ (30%), followed by ‘dissemination’ (26.5%) and
68
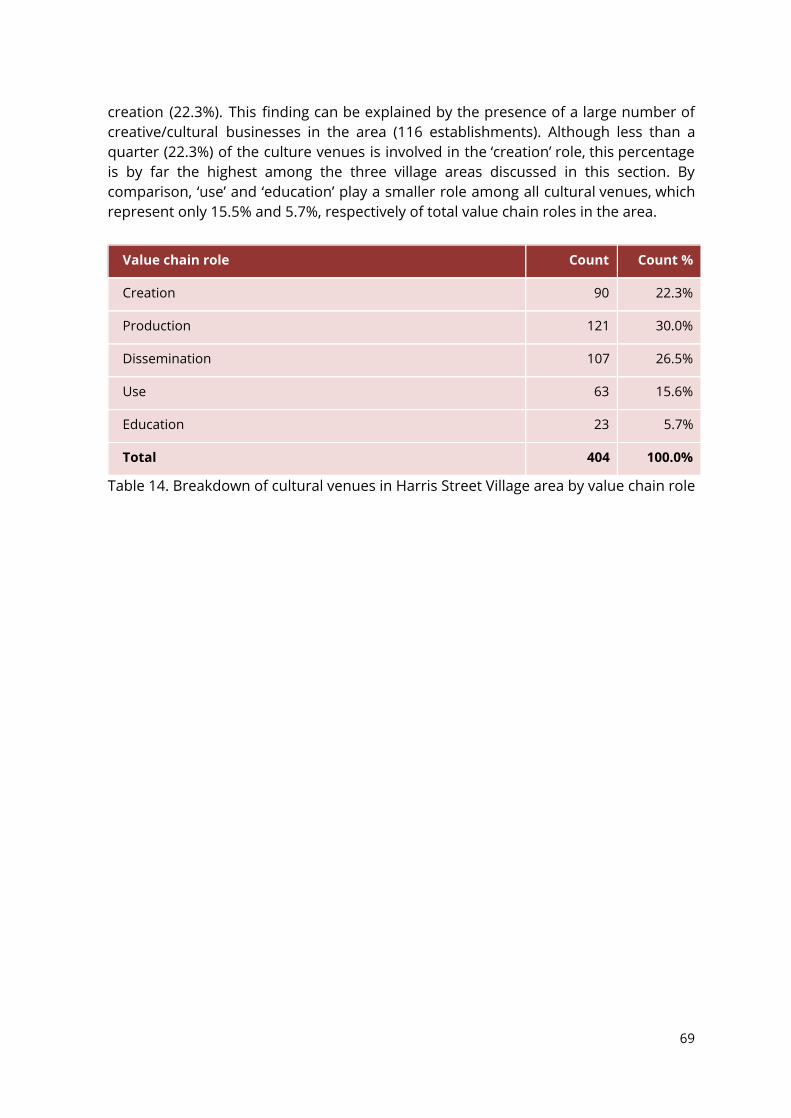
creation (22.3%). This finding can be explained by the presence of a large number of creative/cultural businesses in the area (116 establishments). Although less than a quarter (22.3%) of the culture venues is involved in the ‘creation’ role, this percentage is by far the highest among the three village areas discussed in this section. By comparison, ‘use’ and ‘education’ play a smaller role among all cultural venues, which represent only 15.5% and 5.7%, respectively of total value chain roles in the area.
Value chain role Count Count %
Creation 90 22.3%
Production 121 30.0%
Dissemination 107 26.5%
Use 63 15.6%
Education 23 5.7%
Total 404 100.0%
Table 14. Breakdown of cultural venues in Harris Street Village area by value chain role
69
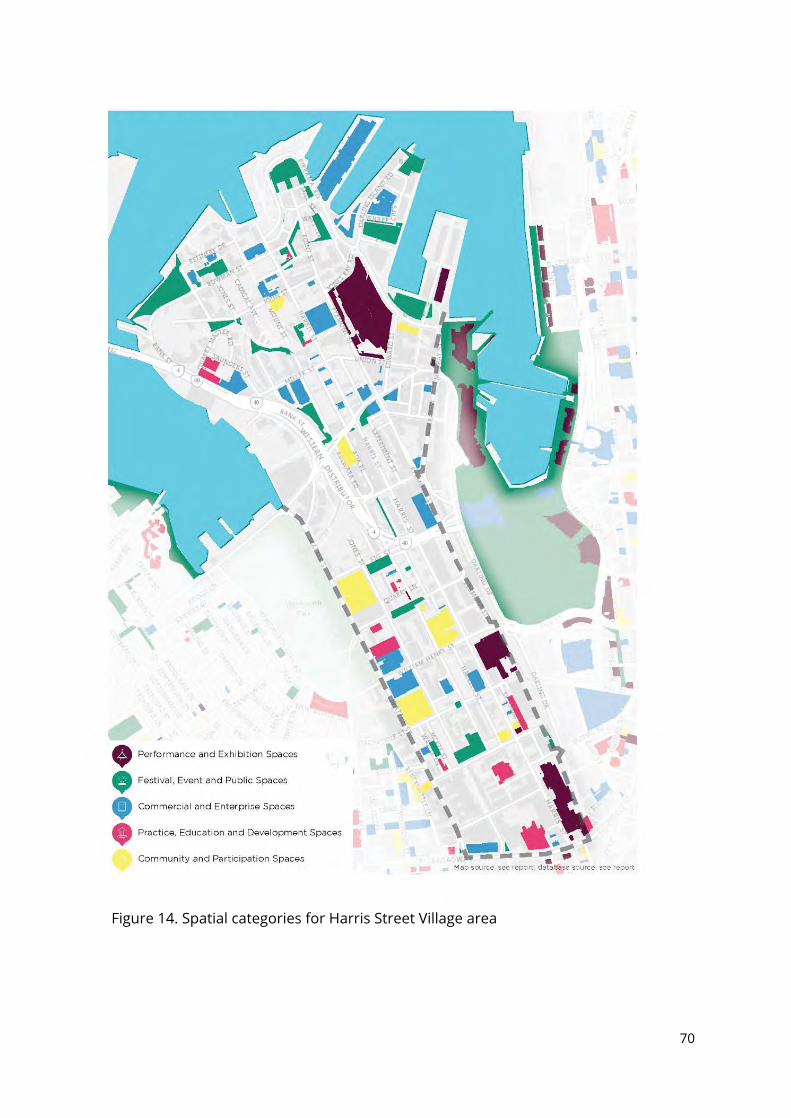
Figure 14. Spatial categories for Harris Street Village area
70
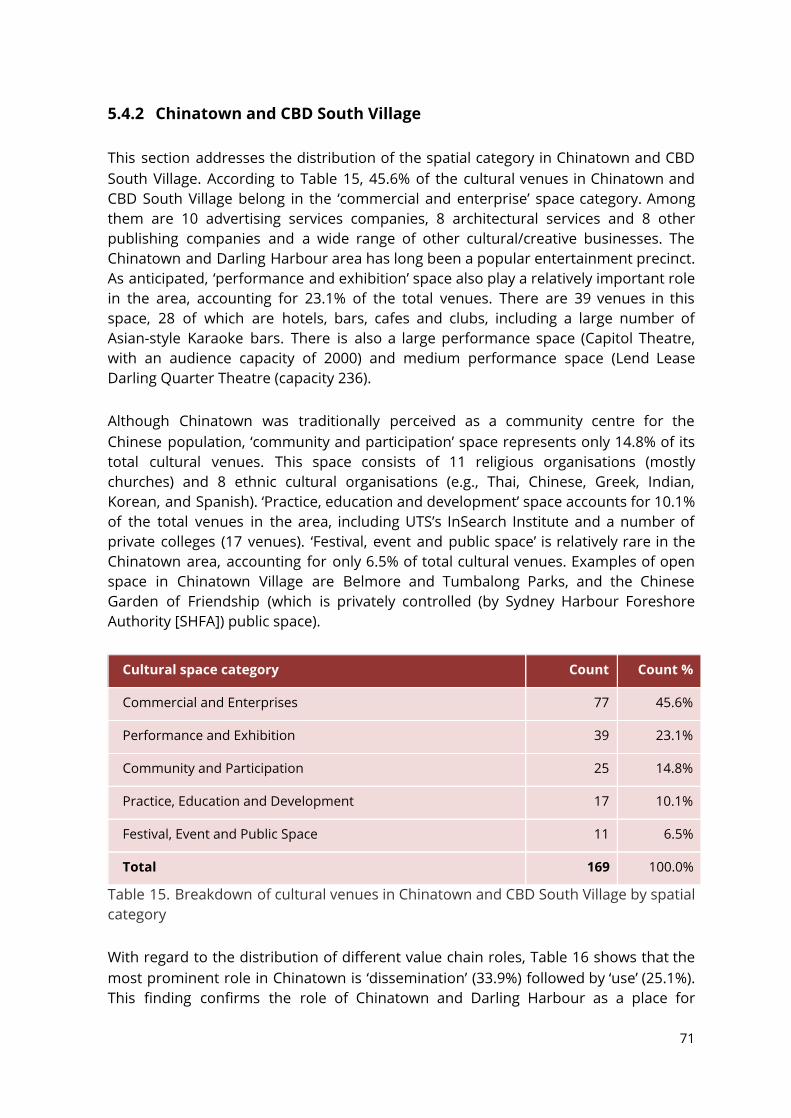
5.4.2 Chinatown and CBD South Village This section addresses the distribution of the spatial category in Chinatown and CBD South Village. According to Table 15, 45.6% of the cultural venues in Chinatown and CBD South Village belong in the ‘commercial and enterprise’ space category. Among them are 10 advertising services companies, 8 architectural services and 8 other publishing companies and a wide range of other cultural/creative businesses. The Chinatown and Darling Harbour area has long been a popular entertainment precinct. As anticipated, ‘performance and exhibition’ space also play a relatively important role in the area, accounting for 23.1% of the total venues. There are 39 venues in this space, 28 of which are hotels, bars, cafes and clubs, including a large number of Asian-style Karaoke bars. There is also a large performance space (Capitol Theatre, with an audience capacity of 2000) and medium performance space (Lend Lease Darling Quarter Theatre (capacity 236). Although Chinatown was traditionally perceived as a community centre for the Chinese population, ‘community and participation’ space represents only 14.8% of its total cultural venues. This space consists of 11 religious organisations (mostly churches) and 8 ethnic cultural organisations (e.g., Thai, Chinese, Greek, Indian, Korean, and Spanish). ‘Practice, education and development’ space accounts for 10.1% of the total venues in the area, including UTS’s InSearch Institute and a number of private colleges (17 venues). ‘Festival, event and public space’ is relatively rare in the Chinatown area, accounting for only 6.5% of total cultural venues. Examples of open space in Chinatown Village are Belmore and Tumbalong Parks, and the Chinese Garden of Friendship (which is privately controlled (by Sydney Harbour Foreshore Authority [SHFA]) public space).
Cultural space category Count Count %
Commercial and Enterprises 77 45.6%
Performance and Exhibition 39 23.1%
Community and Participation 25 14.8%
Practice, Education and Development 17 10.1%
Festival, Event and Public Space 11 6.5%
Total 169 100.0%
Table 15. Breakdown of cultural venues in Chinatown and CBD South Village by spatial category With regard to the distribution of different value chain roles, Table 16 shows that the most prominent role in Chinatown is ‘dissemination’ (33.9%) followed by ‘use’ (25.1%). This finding confirms the role of Chinatown and Darling Harbour as a place for
71
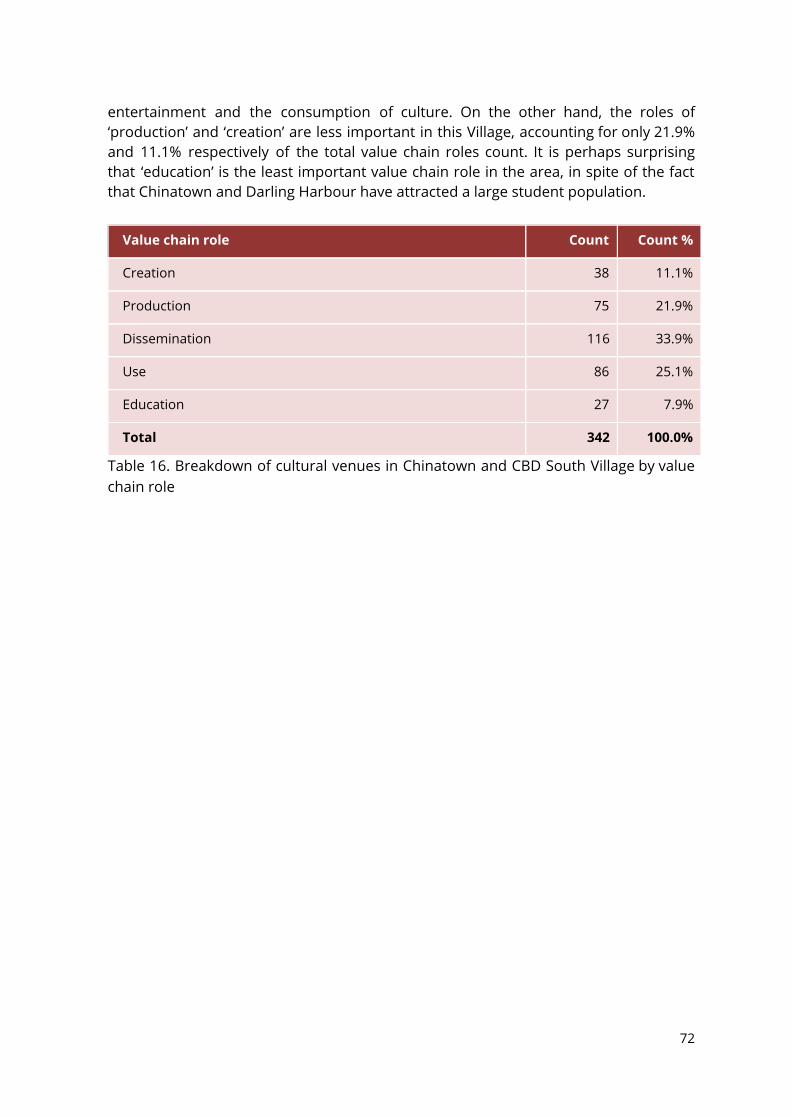
entertainment and the consumption of culture. On the other hand, the roles of ‘production’ and ‘creation’ are less important in this Village, accounting for only 21.9% and 11.1% respectively of the total value chain roles count. It is perhaps surprising that ‘education’ is the least important value chain role in the area, in spite of the fact that Chinatown and Darling Harbour have attracted a large student population.
Value chain role Count Count %
Creation 38 11.1%
Production 75 21.9%
Dissemination 116 33.9%
Use 86 25.1%
Education 27 7.9%
Total 342 100.0%
Table 16. Breakdown of cultural venues in Chinatown and CBD South Village by value chain role
72
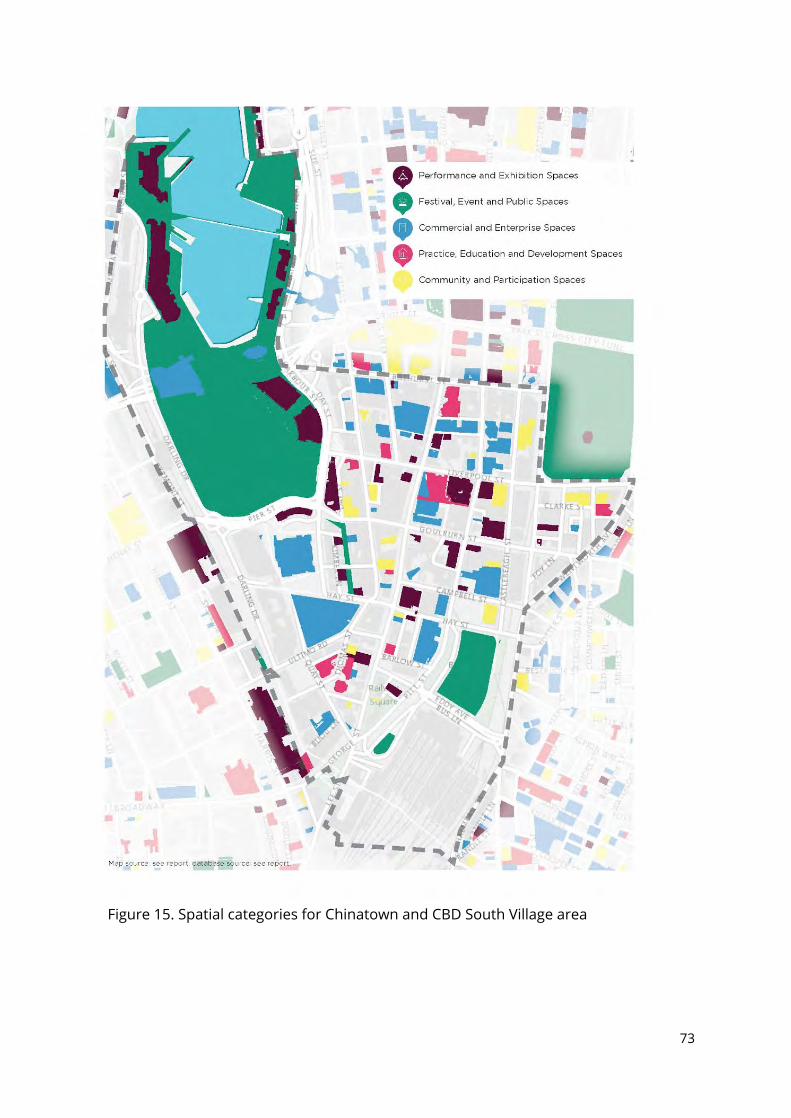
Figure 15. Spatial categories for Chinatown and CBD South Village area
73
5.4.3 Green Square and City South Village This section discusses the distribution of cultural venues in Green Square and City South Village in relation to their spatial types. Table 17 demonstrates that the majority of cultural venues in the area belong to the category ‘commercial and enterprise’, which accounts for 63.7% of the total venues count. Different from the Harris Street and Chinatown Villages, the largest cultural/creative businesses sector in the area is ‘other publishing’ (e.g. printing companies) (26 venues), followed by advertising services and commercial art galleries, (both having 14 venues). The cluster of printing shops in the area is probably due to the zoning policy, where the south western side of the Village is designed as an ‘enterprise corridor’ (City of Sydney, 2012d) where large industrial spaces are available for these businesses. ‘Festival, event and public space’ accounts for the second largest percentage of the total venue count (15.8%) in the area, which can be attributed to the presence of 30 open public space venues (e.g. parks and reserves). ‘Practice, education and development’ space represents 12.6% of the total number of cultural venues, which consists of 10 child care centres and several schools/art schools (e.g., Village on Broadway), 4 development venues (e.g. studio) and 2 rehearsal facilities. ‘Community and participation’ space accounts for only 7.4% of the cultural venues in the area, including 5 co-working spaces and 5 religious organisations (churches, temples etc). It is, perhaps, not surprising that there is little community space in the Village, as the FES data from 2012 would not capture much of the recent large-scale building and development . The substantial number of new residents in recently constructed high 7
rise apartments in Zetland, Alexandria and Waterloo (City of Sydney, 2015) will require such community space. Similarly, there will need to be much more ‘performance and exhibition’ space in the village, as it currently accounts for less than 1% of the total venue count. The only exhibition space in the Village is a cluster of commercial art galleries (classified as ‘commercial and enterprise’ space) in Danks Street, Waterloo.
7 According to City of Sydney’s Residential Monitor, 4,044 residential dwellings have been completed in Green Square and City South Village between 2010 to 2015, another 9,000 new dwellings are expected to be constructed in the next five years (City of Sydney, 2015).
74
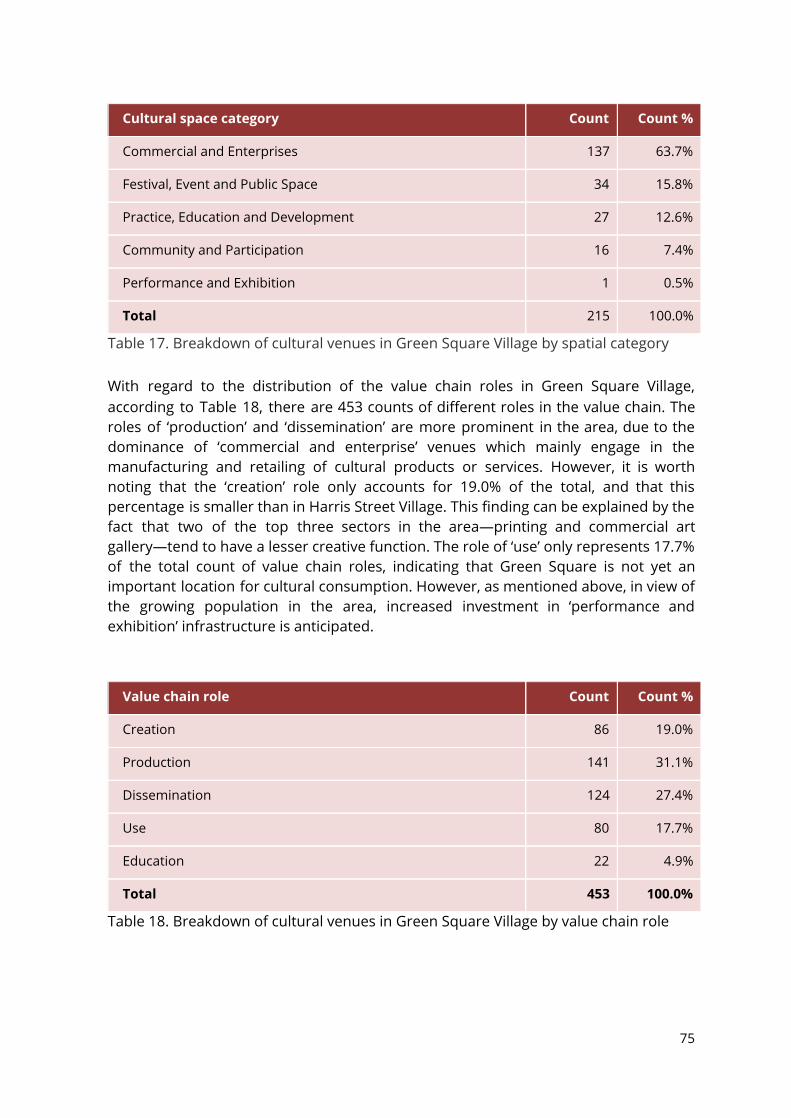
Cultural space category Count Count %
Commercial and Enterprises 137 63.7%
Festival, Event and Public Space 34 15.8%
Practice, Education and Development 27 12.6%
Community and Participation 16 7.4%
Performance and Exhibition 1 0.5%
Total 215 100.0%
Table 17. Breakdown of cultural venues in Green Square Village by spatial category With regard to the distribution of the value chain roles in Green Square Village, according to Table 18, there are 453 counts of different roles in the value chain. The roles of ‘production’ and ‘dissemination’ are more prominent in the area, due to the dominance of ‘commercial and enterprise’ venues which mainly engage in the manufacturing and retailing of cultural products or services. However, it is worth noting that the ‘creation’ role only accounts for 19.0% of the total, and that this percentage is smaller than in Harris Street Village. This finding can be explained by the fact that two of the top three sectors in the area—printing and commercial art gallery—tend to have a lesser creative function. The role of ‘use’ only represents 17.7% of the total count of value chain roles, indicating that Green Square is not yet an important location for cultural consumption. However, as mentioned above, in view of the growing population in the area, increased investment in ‘performance and exhibition’ infrastructure is anticipated.
Value chain role Count Count %
Creation 86 19.0%
Production 141 31.1%
Dissemination 124 27.4%
Use 80 17.7%
Education 22 4.9%
Total 453 100.0%
Table 18. Breakdown of cultural venues in Green Square Village by value chain role
75
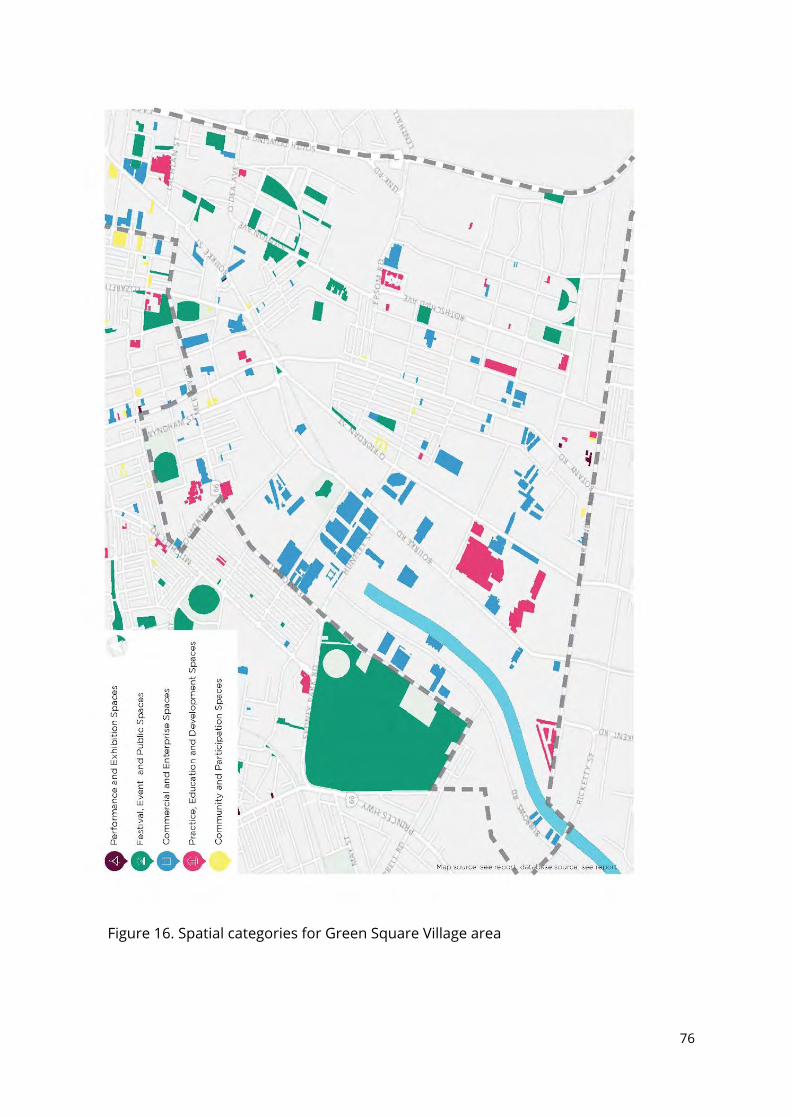
Figure 16. Spatial categories for Green Square Village area
76
5.4.4 A brief comparison of the three village areas
The above analysis of Harris Street Village, Chinatown and CBD South Village and Green Square Village areas shows their diꩲ�erences in terms of the characteristics of their cultural venues. Although ‘commercial and enterprise‘ space accounts for the majority of the cultural venues in all three villages, each is dominated by diꩲ�erent industry sectors and, therefore, there is variation in the importance of diꩲ�erent value chain roles in these villages. For instance, Harris Street Village has the highest number of architecture, advertising, and design 㘷rms and a cluster of media and digital companies. As a result, the ‘production’ and ‘dissemination’ roles are prominent and the Village has the highest percentage of creative function.
By contrast, Chinatown has a less central role relating to creative/cultural businesses. Not only has the Village 33% fewer ‘commercial and enterprise’ spaces than Harris Street Village, but also these spaces tend to play a smaller role in cultural ‘creation’. In fact, among the three Villages, Chinatown and CBD South Village has the smallest ‘creation’ role percentage. However, it has the highest ‘performance and exhibition’ space proportion among the three Villages (23.1%) and, as a result, the value chain roles of ‘dissemination’ and ‘use’ are more prominent in the area. As noted, this 㘷nding con㘷rms the role of Chinatown and CBD South Village as a precinct of entertainment and cultural consumption.
When comparing the three Villages, Green Square has the highest number of cultural venues, although these are largely ‘commercial and enterprise’ spaces. This 㘷nding mainly relates to the zoning design of the Village. However, since the major creative/cultural businesses in the area mainly engage in manufacturing and retailing activities, the ‘creation’ role is less prominent than in Harris Street Village. Green Square Village also has fewer ‘community and participation’ spaces than Chinatown Village, and its ‘performance and exhibition’ space is negligible. As Green Square is one of the fastest growing areas in the City of Sydney in population terms, the City has committed substantial resources to build community facilities and infrastructure. Cultural investment in this area should be an important consideration, with a clear need for more ‘community and participation’ spaces like the Green Square Creative Centre and the Community Hall. These spaces, and those dedicated to ‘practice, education and development’, will need to be supplemented by new ‘performance and exhibition spaces’ that will, among other functions, provide outlets for locally produced culture.
77
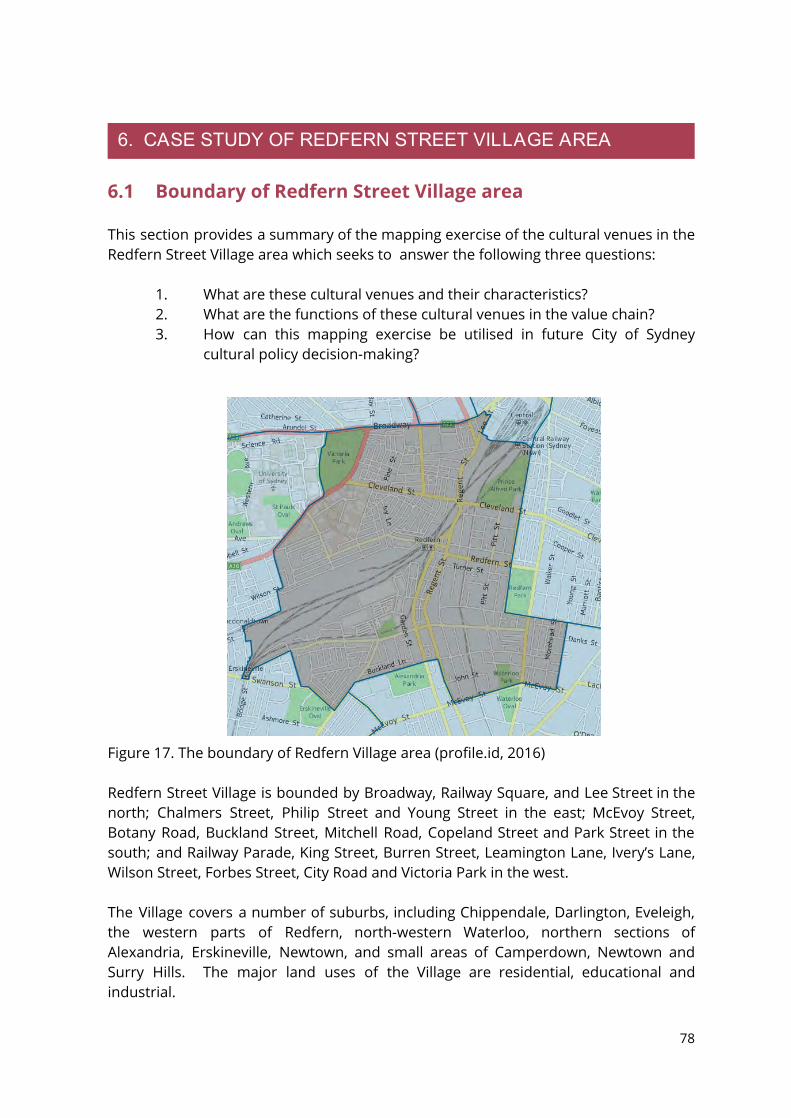
6. CASE STUDY OF REDFERN STREET VILLAGE AREA
6.1 Boundary of Redfern Street Village area This section provides a summary of the mapping exercise of the cultural venues in the Redfern Street Village area which seeks to answer the following three questions:
1. What are these cultural venues and their characteristics? 2. What are the functions of these cultural venues in the value chain? 3. How can this mapping exercise be utilised in future City of Sydney
cultural policy decision-making?
Figure 17. The boundary of Redfern Village area (profile.id, 2016) Redfern Street Village is bounded by Broadway, Railway Square, and Lee Street in the north; Chalmers Street, Philip Street and Young Street in the east; McEvoy Street, Botany Road, Buckland Street, Mitchell Road, Copeland Street and Park Street in the south; and Railway Parade, King Street, Burren Street, Leamington Lane, Ivery’s Lane, Wilson Street, Forbes Street, City Road and Victoria Park in the west. The Village covers a number of suburbs, including Chippendale, Darlington, Eveleigh, the western parts of Redfern, north-western Waterloo, northern sections of Alexandria, Erskineville, Newtown, and small areas of Camperdown, Newtown and Surry Hills. The major land uses of the Village are residential, educational and industrial.
78
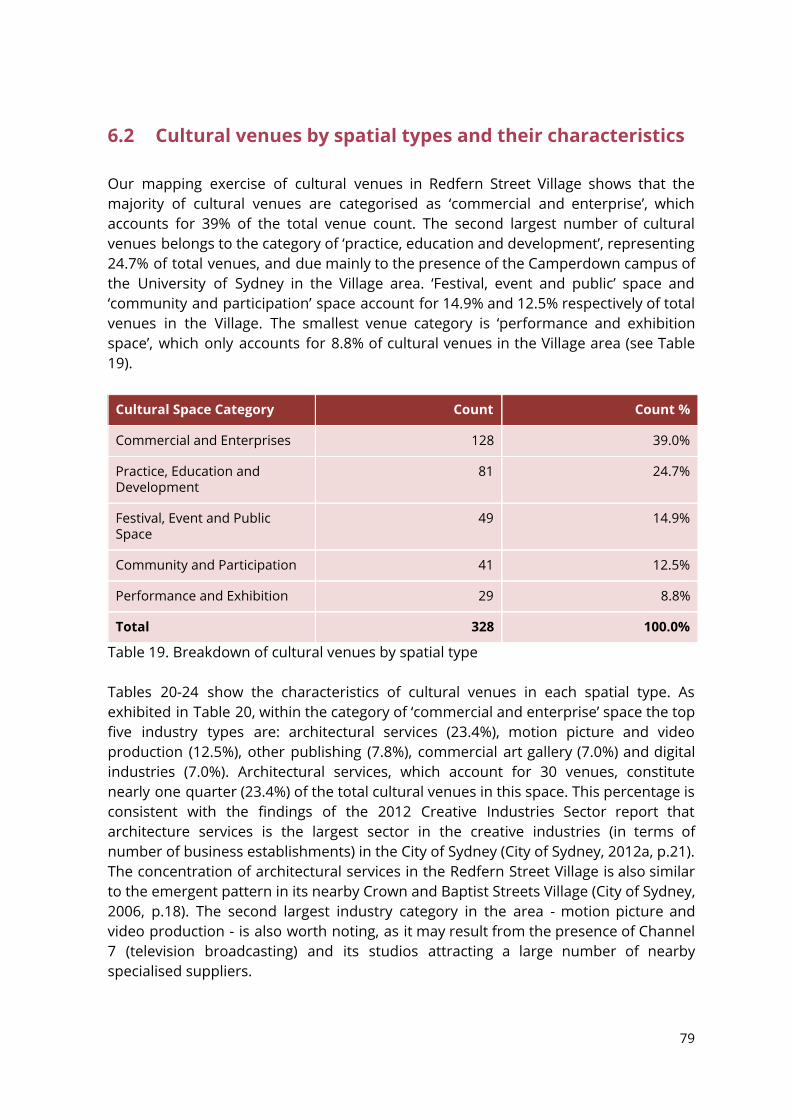
6.2 Cultural venues by spatial types and their characteristics Our mapping exercise of cultural venues in Redfern Street Village shows that the majority of cultural venues are categorised as ‘commercial and enterprise’, which accounts for 39% of the total venue count. The second largest number of cultural venues belongs to the category of ‘practice, education and development’, representing 24.7% of total venues, and due mainly to the presence of the Camperdown campus of the University of Sydney in the Village area. ‘Festival, event and public’ space and ‘community and participation’ space account for 14.9% and 12.5% respectively of total venues in the Village. The smallest venue category is ‘performance and exhibition space’, which only accounts for 8.8% of cultural venues in the Village area (see Table 19).
Cultural Space Category Count Count %
Commercial and Enterprises 128 39.0%
Practice, Education and Development
81 24.7%
Festival, Event and Public Space
49 14.9%
Community and Participation 41 12.5%
Performance and Exhibition 29 8.8%
Total 328 100.0%
Table 19. Breakdown of cultural venues by spatial type Tables 20-24 show the characteristics of cultural venues in each spatial type. As exhibited in Table 20, within the category of ‘commercial and enterprise’ space the top five industry types are: architectural services (23.4%), motion picture and video production (12.5%), other publishing (7.8%), commercial art gallery (7.0%) and digital industries (7.0%). Architectural services, which account for 30 venues, constitute nearly one quarter (23.4%) of the total cultural venues in this space. This percentage is consistent with the findings of the 2012 Creative Industries Sector report that architecture services is the largest sector in the creative industries (in terms of number of business establishments) in the City of Sydney (City of Sydney, 2012a, p.21). The concentration of architectural services in the Redfern Street Village is also similar to the emergent pattern in its nearby Crown and Baptist Streets Village (City of Sydney, 2006, p.18). The second largest industry category in the area - motion picture and video production - is also worth noting, as it may result from the presence of Channel 7 (television broadcasting) and its studios attracting a large number of nearby specialised suppliers.
79
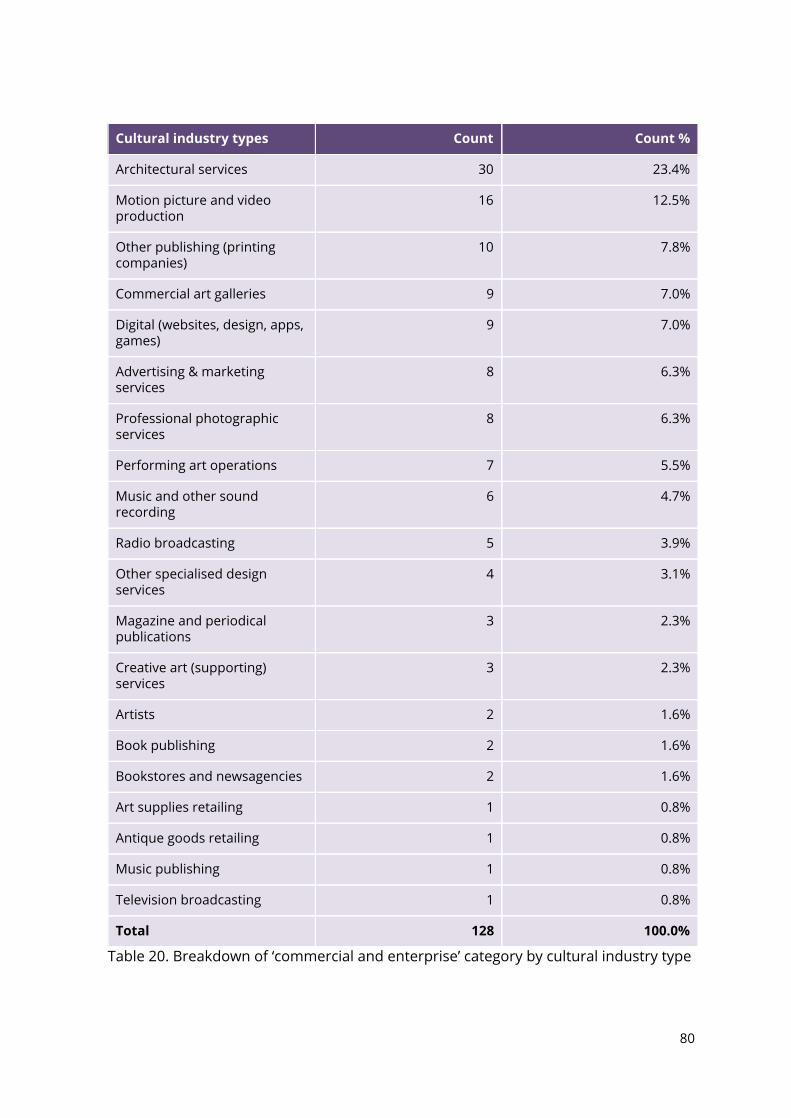
Cultural industry types Count Count %
Architectural services 30 23.4%
Motion picture and video production
16 12.5%
Other publishing (printing companies)
10 7.8%
Commercial art galleries 9 7.0%
Digital (websites, design, apps, games)
9 7.0%
Advertising & marketing services
8 6.3%
Professional photographic services
8 6.3%
Performing art operations 7 5.5%
Music and other sound recording
6 4.7%
Radio broadcasting 5 3.9%
Other specialised design services
4 3.1%
Magazine and periodical publications
3 2.3%
Creative art (supporting) services
3 2.3%
Artists 2 1.6%
Book publishing 2 1.6%
Bookstores and newsagencies 2 1.6%
Art supplies retailing 1 0.8%
Antique goods retailing 1 0.8%
Music publishing 1 0.8%
Television broadcasting 1 0.8%
Total 128 100.0%
Table 20. Breakdown of ‘commercial and enterprise’ category by cultural industry type
80
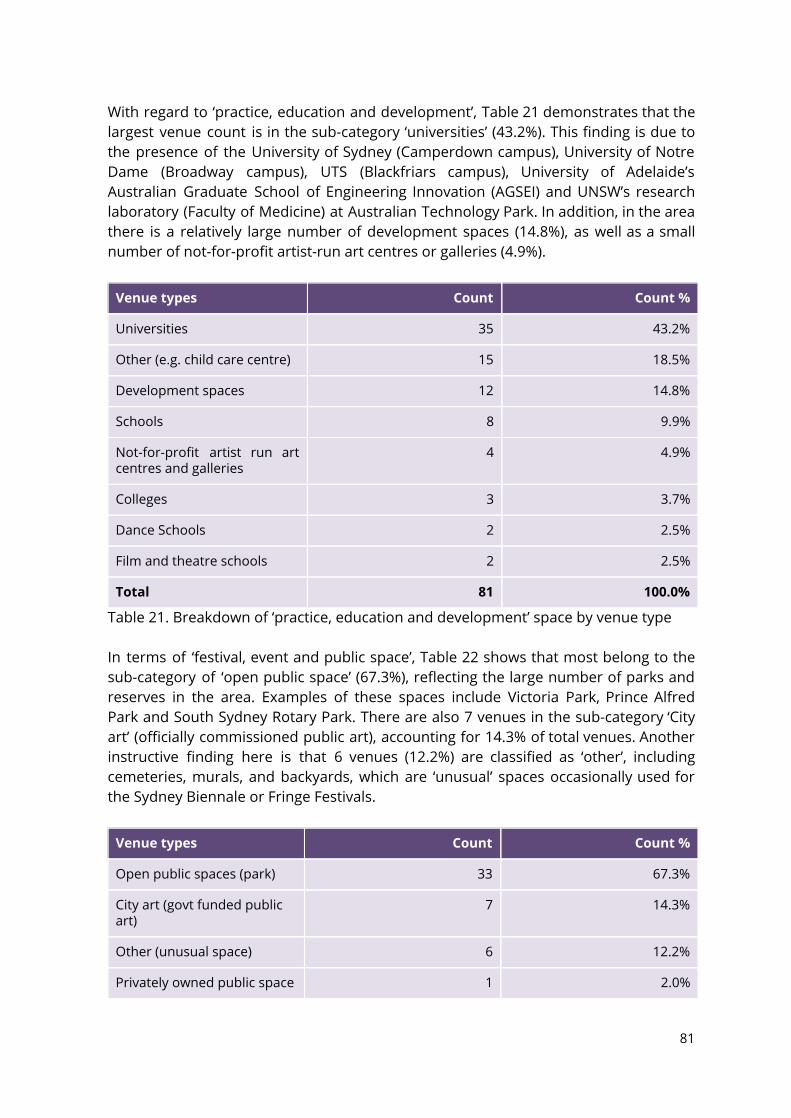
With regard to ‘practice, education and development’, Table 21 demonstrates that the largest venue count is in the sub-category ‘universities’ (43.2%). This finding is due to the presence of the University of Sydney (Camperdown campus), University of Notre Dame (Broadway campus), UTS (Blackfriars campus), University of Adelaide’s Australian Graduate School of Engineering Innovation (AGSEI) and UNSW’s research laboratory (Faculty of Medicine) at Australian Technology Park. In addition, in the area there is a relatively large number of development spaces (14.8%), as well as a small number of not-for-profit artist-run art centres or galleries (4.9%).
Venue types Count Count %
Universities 35 43.2%
Other (e.g. child care centre) 15 18.5%
Development spaces 12 14.8%
Schools 8 9.9%
Not-for-profit artist run art centres and galleries
4 4.9%
Colleges 3 3.7%
Dance Schools 2 2.5%
Film and theatre schools 2 2.5%
Total 81 100.0%
Table 21. Breakdown of ‘practice, education and development’ space by venue type In terms of ‘festival, event and public space’, Table 22 shows that most belong to the sub-category of ‘open public space’ (67.3%), reflecting the large number of parks and reserves in the area. Examples of these spaces include Victoria Park, Prince Alfred Park and South Sydney Rotary Park. There are also 7 venues in the sub-category ‘City art’ (officially commissioned public art), accounting for 14.3% of total venues. Another instructive finding here is that 6 venues (12.2%) are classified as ‘other’, including cemeteries, murals, and backyards, which are ‘unusual’ spaces occasionally used for the Sydney Biennale or Fringe Festivals.
Venue types Count Count %
Open public spaces (park) 33 67.3%
City art (govt funded public art)
7 14.3%
Other (unusual space) 6 12.2%
Privately owned public space 1 2.0%
81
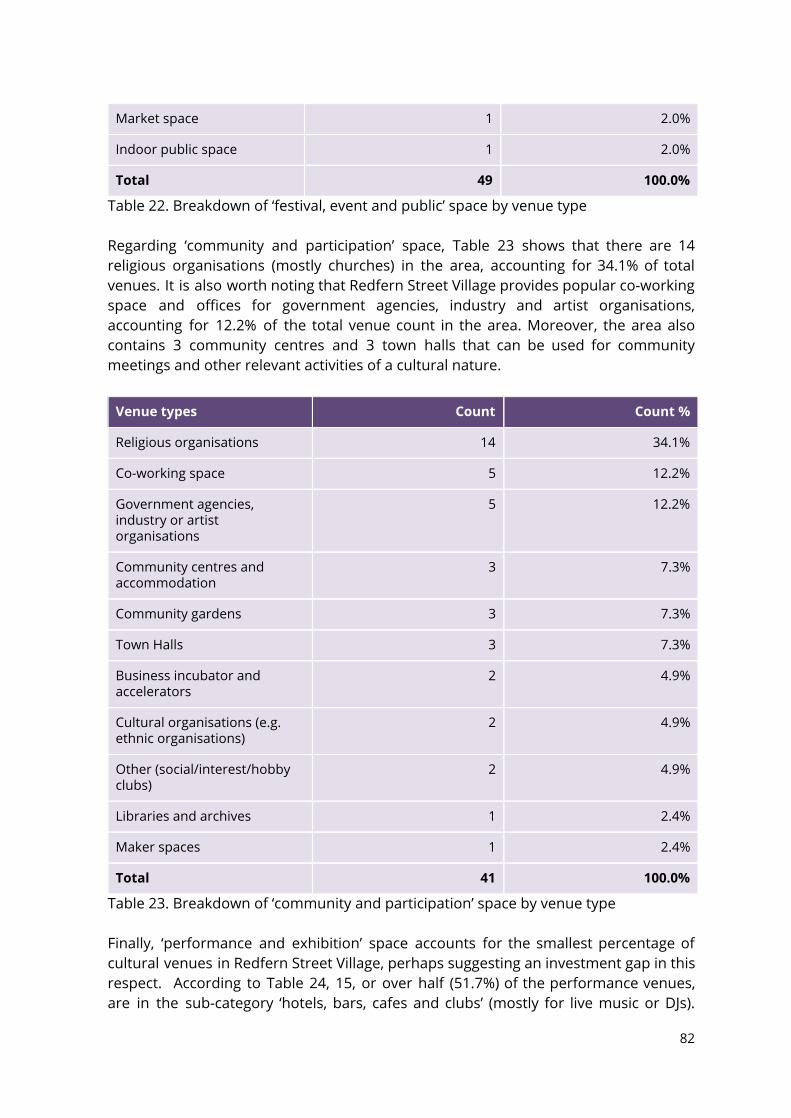
Market space 1 2.0%
Indoor public space 1 2.0%
Total 49 100.0%
Table 22. Breakdown of ‘festival, event and public’ space by venue type Regarding ‘community and participation’ space, Table 23 shows that there are 14 religious organisations (mostly churches) in the area, accounting for 34.1% of total venues. It is also worth noting that Redfern Street Village provides popular co-working space and offices for government agencies, industry and artist organisations, accounting for 12.2% of the total venue count in the area. Moreover, the area also contains 3 community centres and 3 town halls that can be used for community meetings and other relevant activities of a cultural nature.
Venue types Count Count %
Religious organisations 14 34.1%
Co-working space 5 12.2%
Government agencies, industry or artist organisations
5 12.2%
Community centres and accommodation
3 7.3%
Community gardens 3 7.3%
Town Halls 3 7.3%
Business incubator and accelerators
2 4.9%
Cultural organisations (e.g. ethnic organisations)
2 4.9%
Other (social/interest/hobby clubs)
2 4.9%
Libraries and archives 1 2.4%
Maker spaces 1 2.4%
Total 41 100.0%
Table 23. Breakdown of ‘community and participation’ space by venue type Finally, ‘performance and exhibition’ space accounts for the smallest percentage of cultural venues in Redfern Street Village, perhaps suggesting an investment gap in this respect. According to Table 24, 15, or over half (51.7%) of the performance venues, are in the sub-category ‘hotels, bars, cafes and clubs’ (mostly for live music or DJs).
82
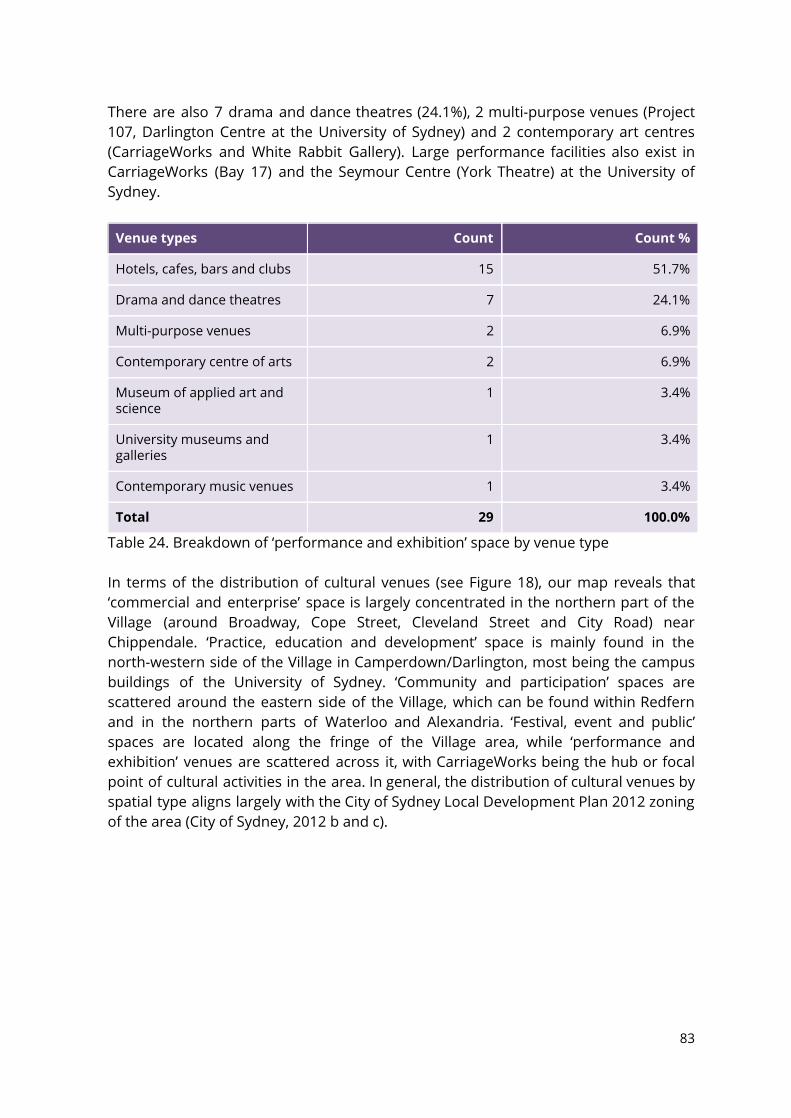
There are also 7 drama and dance theatres (24.1%), 2 multi-purpose venues (Project 107, Darlington Centre at the University of Sydney) and 2 contemporary art centres (CarriageWorks and White Rabbit Gallery). Large performance facilities also exist in CarriageWorks (Bay 17) and the Seymour Centre (York Theatre) at the University of Sydney.
Venue types Count Count %
Hotels, cafes, bars and clubs 15 51.7%
Drama and dance theatres 7 24.1%
Multi-purpose venues 2 6.9%
Contemporary centre of arts 2 6.9%
Museum of applied art and science
1 3.4%
University museums and galleries
1 3.4%
Contemporary music venues 1 3.4%
Total 29 100.0%
Table 24. Breakdown of ‘performance and exhibition’ space by venue type In terms of the distribution of cultural venues (see Figure 18), our map reveals that ‘commercial and enterprise’ space is largely concentrated in the northern part of the Village (around Broadway, Cope Street, Cleveland Street and City Road) near Chippendale. ‘Practice, education and development’ space is mainly found in the north-western side of the Village in Camperdown/Darlington, most being the campus buildings of the University of Sydney. ‘Community and participation’ spaces are scattered around the eastern side of the Village, which can be found within Redfern and in the northern parts of Waterloo and Alexandria. ‘Festival, event and public’ spaces are located along the fringe of the Village area, while ‘performance and exhibition’ venues are scattered across it, with CarriageWorks being the hub or focal point of cultural activities in the area. In general, the distribution of cultural venues by spatial type aligns largely with the City of Sydney Local Development Plan 2012 zoning of the area (City of Sydney, 2012 b and c).
83
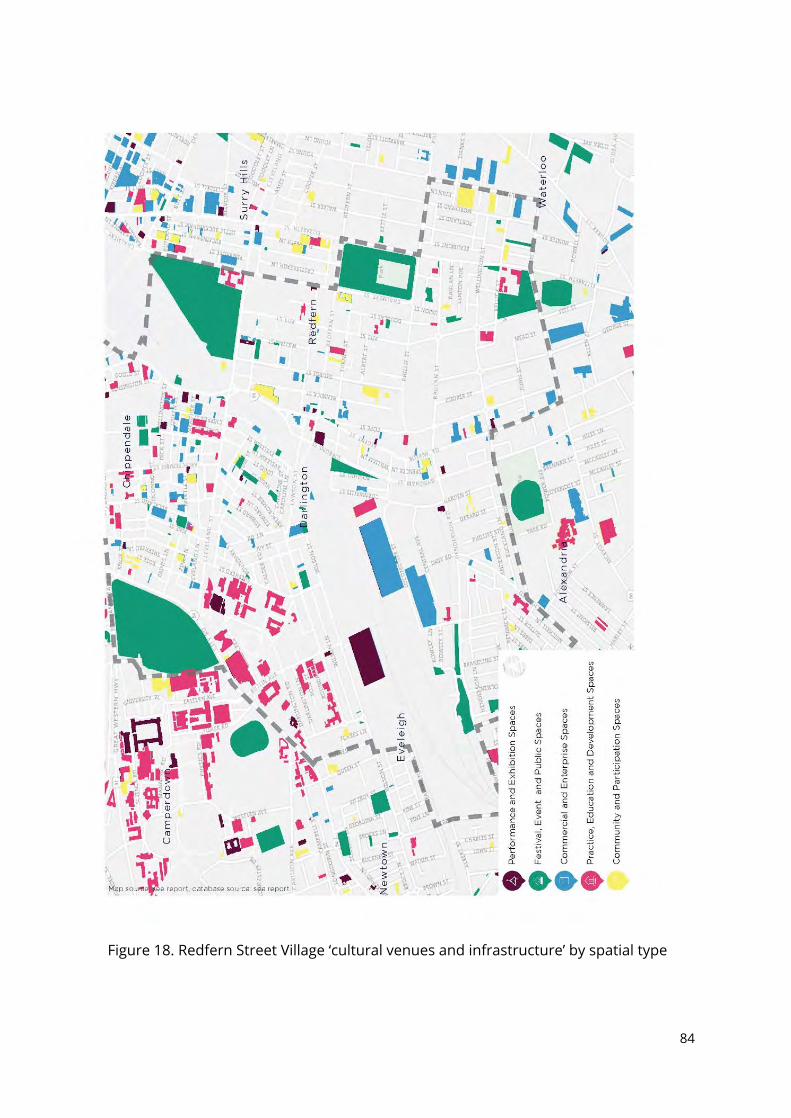
Figure 18. Redfern Street Village ‘cultural venues and infrastructure’ by spatial type
84
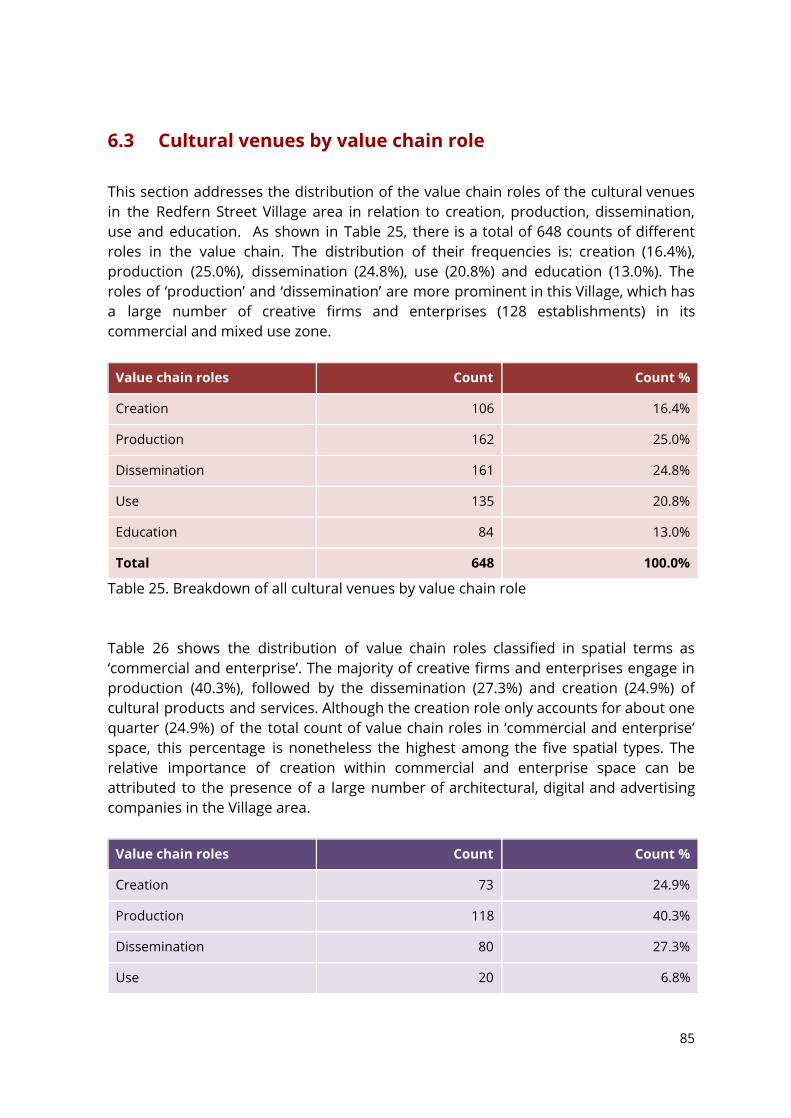
6.3 Cultural venues by value chain role This section addresses the distribution of the value chain roles of the cultural venues in the Redfern Street Village area in relation to creation, production, dissemination, use and education. As shown in Table 25, there is a total of 648 counts of different roles in the value chain. The distribution of their frequencies is: creation (16.4%), production (25.0%), dissemination (24.8%), use (20.8%) and education (13.0%). The roles of ‘production’ and ‘dissemination’ are more prominent in this Village, which has a large number of creative firms and enterprises (128 establishments) in its commercial and mixed use zone.
Value chain roles Count Count %
Creation 106 16.4%
Production 162 25.0%
Dissemination 161 24.8%
Use 135 20.8%
Education 84 13.0%
Total 648 100.0%
Table 25. Breakdown of all cultural venues by value chain role Table 26 shows the distribution of value chain roles classified in spatial terms as ‘commercial and enterprise’. The majority of creative firms and enterprises engage in production (40.3%), followed by the dissemination (27.3%) and creation (24.9%) of cultural products and services. Although the creation role only accounts for about one quarter (24.9%) of the total count of value chain roles in ‘commercial and enterprise’ space, this percentage is nonetheless the highest among the five spatial types. The relative importance of creation within commercial and enterprise space can be attributed to the presence of a large number of architectural, digital and advertising companies in the Village area.
Value chain roles Count Count %
Creation 73 24.9%
Production 118 40.3%
Dissemination 80 27.3%
Use 20 6.8%
85
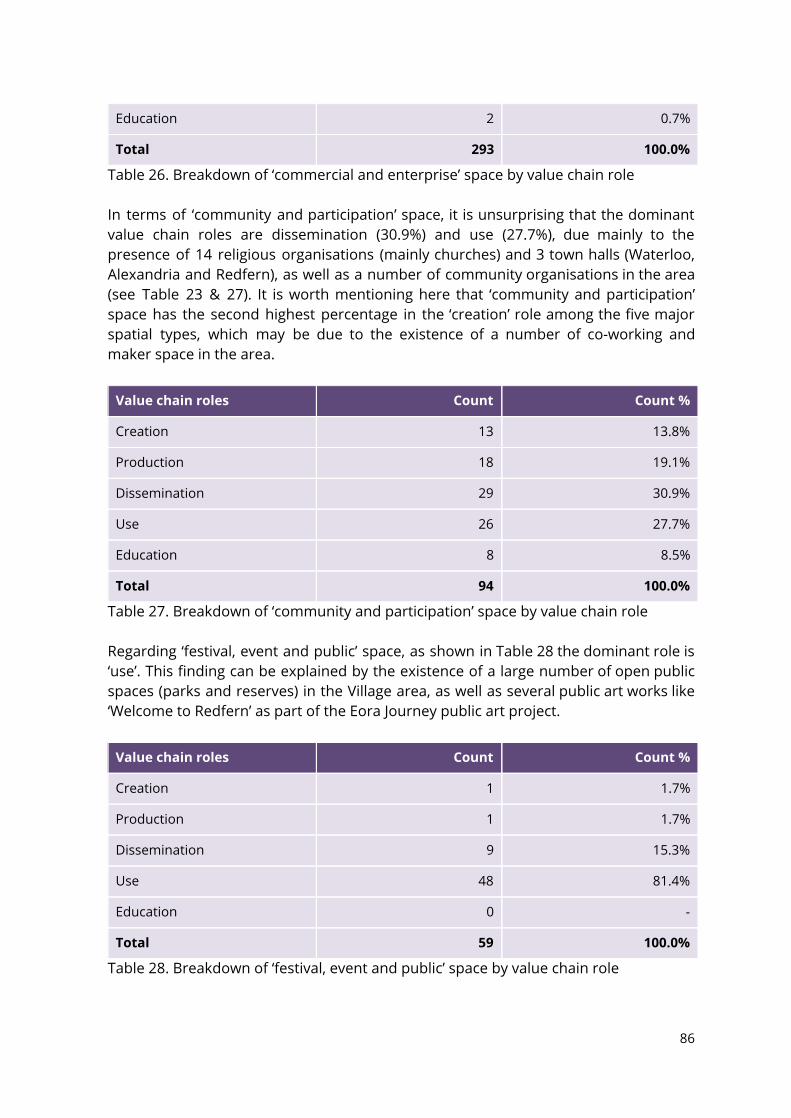
Education 2 0.7%
Total 293 100.0%
Table 26. Breakdown of ‘commercial and enterprise’ space by value chain role In terms of ‘community and participation’ space, it is unsurprising that the dominant value chain roles are dissemination (30.9%) and use (27.7%), due mainly to the presence of 14 religious organisations (mainly churches) and 3 town halls (Waterloo, Alexandria and Redfern), as well as a number of community organisations in the area (see Table 23 & 27). It is worth mentioning here that ‘community and participation’ space has the second highest percentage in the ‘creation’ role among the five major spatial types, which may be due to the existence of a number of co-working and maker space in the area.
Value chain roles Count Count %
Creation 13 13.8%
Production 18 19.1%
Dissemination 29 30.9%
Use 26 27.7%
Education 8 8.5%
Total 94 100.0%
Table 27. Breakdown of ‘community and participation’ space by value chain role Regarding ‘festival, event and public’ space, as shown in Table 28 the dominant role is ‘use’. This finding can be explained by the existence of a large number of open public spaces (parks and reserves) in the Village area, as well as several public art works like ‘Welcome to Redfern’ as part of the Eora Journey public art project.
Value chain roles Count Count %
Creation 1 1.7%
Production 1 1.7%
Dissemination 9 15.3%
Use 48 81.4%
Education 0 -
Total 59 100.0%
Table 28. Breakdown of ‘festival, event and public’ space by value chain role
86
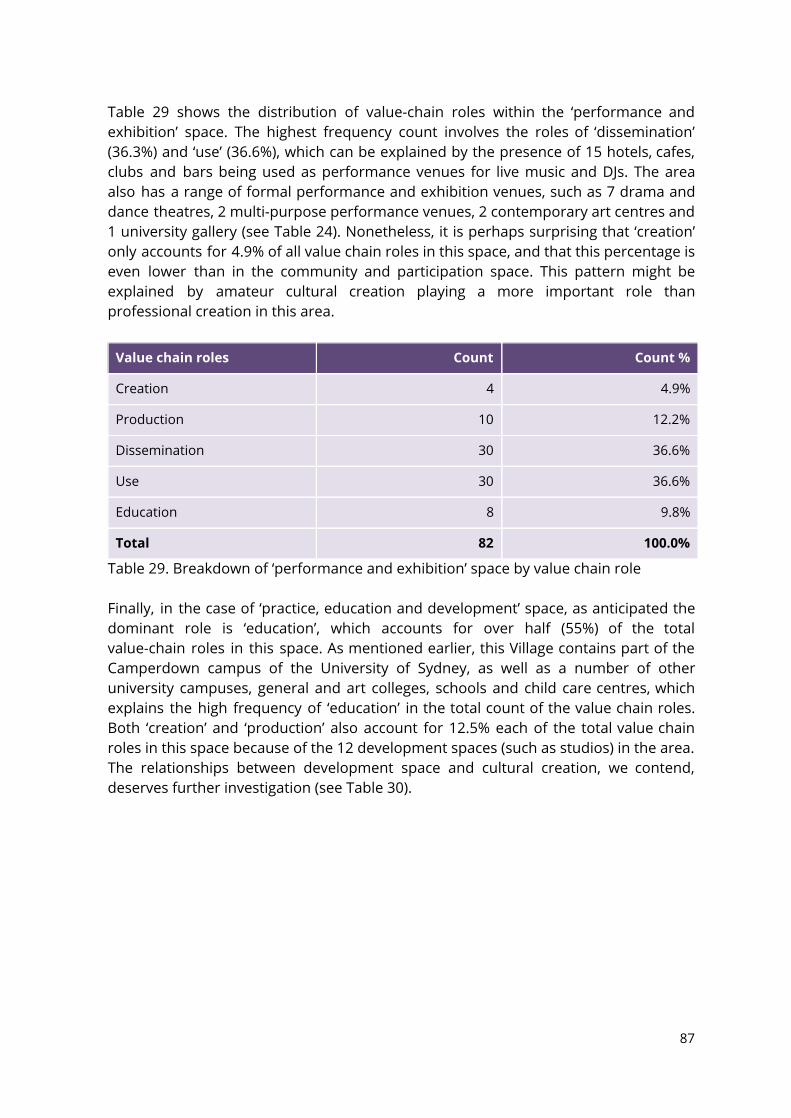
Table 29 shows the distribution of value-chain roles within the ‘performance and exhibition’ space. The highest frequency count involves the roles of ‘dissemination’ (36.3%) and ‘use’ (36.6%), which can be explained by the presence of 15 hotels, cafes, clubs and bars being used as performance venues for live music and DJs. The area also has a range of formal performance and exhibition venues, such as 7 drama and dance theatres, 2 multi-purpose performance venues, 2 contemporary art centres and 1 university gallery (see Table 24). Nonetheless, it is perhaps surprising that ‘creation’ only accounts for 4.9% of all value chain roles in this space, and that this percentage is even lower than in the community and participation space. This pattern might be explained by amateur cultural creation playing a more important role than professional creation in this area.
Value chain roles Count Count %
Creation 4 4.9%
Production 10 12.2%
Dissemination 30 36.6%
Use 30 36.6%
Education 8 9.8%
Total 82 100.0%
Table 29. Breakdown of ‘performance and exhibition’ space by value chain role Finally, in the case of ‘practice, education and development’ space, as anticipated the dominant role is ‘education’, which accounts for over half (55%) of the total value-chain roles in this space. As mentioned earlier, this Village contains part of the Camperdown campus of the University of Sydney, as well as a number of other university campuses, general and art colleges, schools and child care centres, which explains the high frequency of ‘education’ in the total count of the value chain roles. Both ‘creation’ and ‘production’ also account for 12.5% each of the total value chain roles in this space because of the 12 development spaces (such as studios) in the area. The relationships between development space and cultural creation, we contend, deserves further investigation (see Table 30).
87
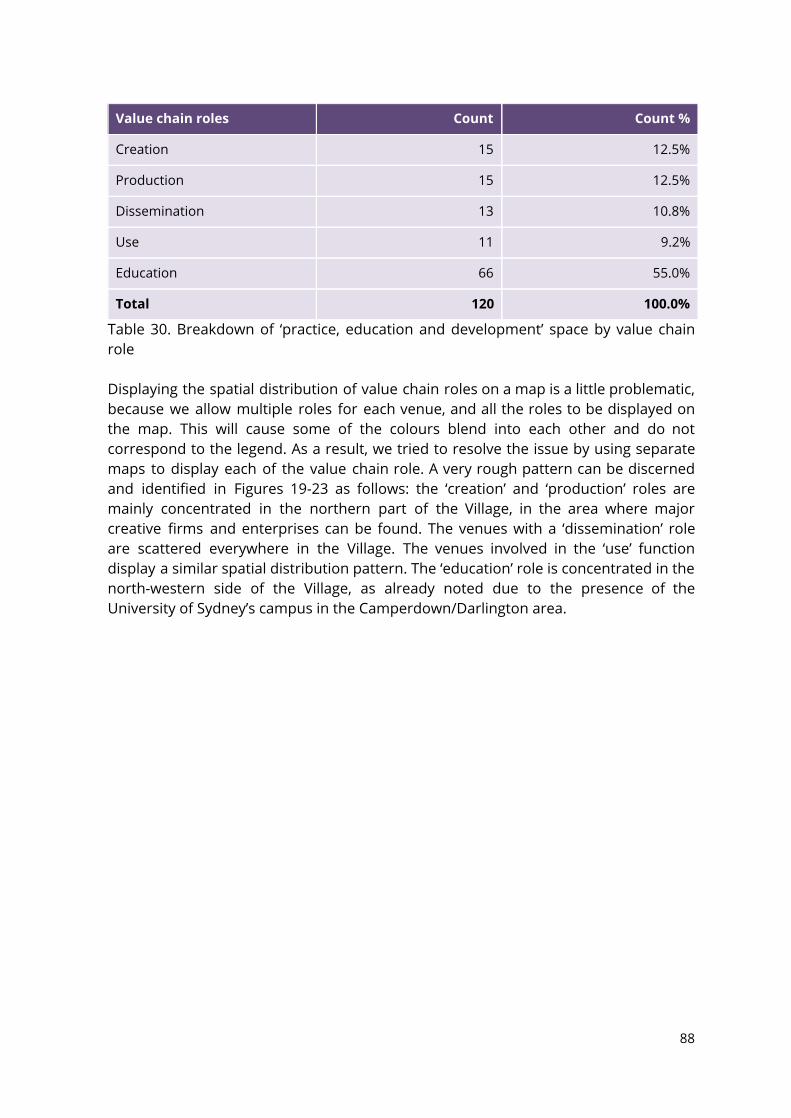
Value chain roles Count Count %
Creation 15 12.5%
Production 15 12.5%
Dissemination 13 10.8%
Use 11 9.2%
Education 66 55.0%
Total 120 100.0%
Table 30. Breakdown of ‘practice, education and development’ space by value chain role Displaying the spatial distribution of value chain roles on a map is a little problematic, because we allow multiple roles for each venue, and all the roles to be displayed on the map. This will cause some of the colours blend into each other and do not correspond to the legend. As a result, we tried to resolve the issue by using separate maps to display each of the value chain role. A very rough pattern can be discerned and identified in Figures 19-23 as follows: the ‘creation’ and ‘production’ roles are mainly concentrated in the northern part of the Village, in the area where major creative firms and enterprises can be found. The venues with a ‘dissemination’ role are scattered everywhere in the Village. The venues involved in the ‘use’ function display a similar spatial distribution pattern. The ‘education’ role is concentrated in the north-western side of the Village, as already noted due to the presence of the University of Sydney’s campus in the Camperdown/Darlington area.
88
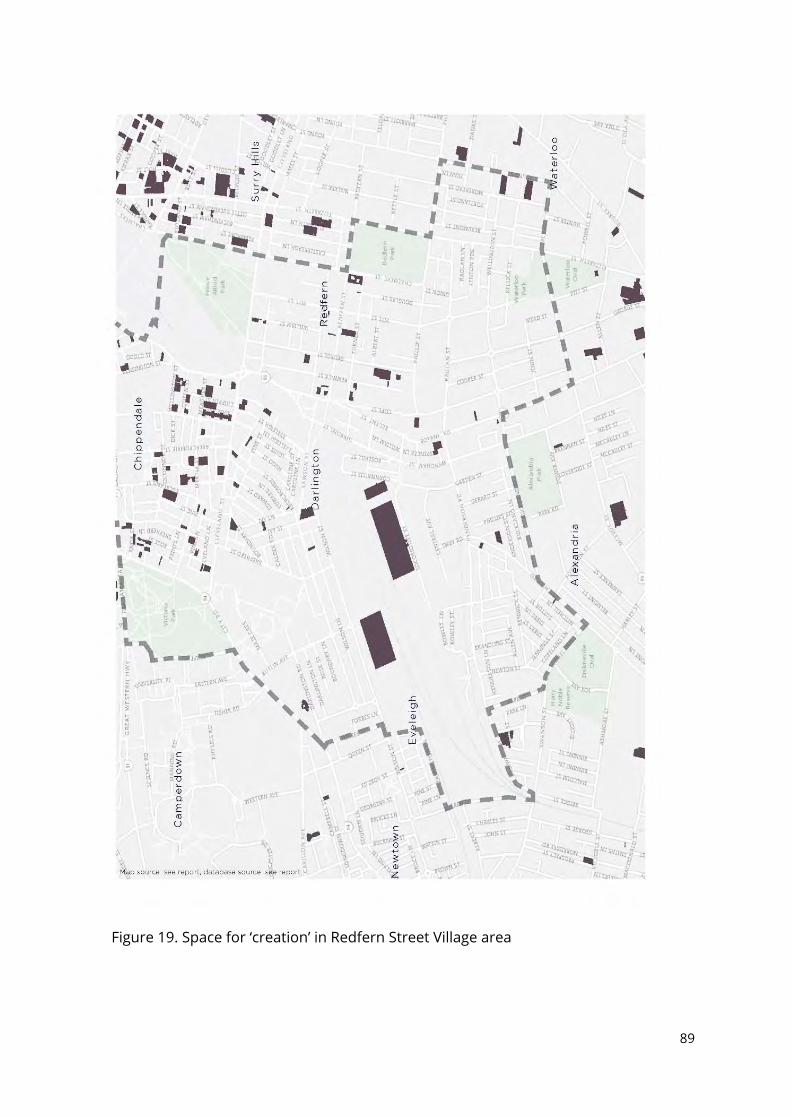
Figure 19. Space for ‘creation’ in Redfern Street Village area
89
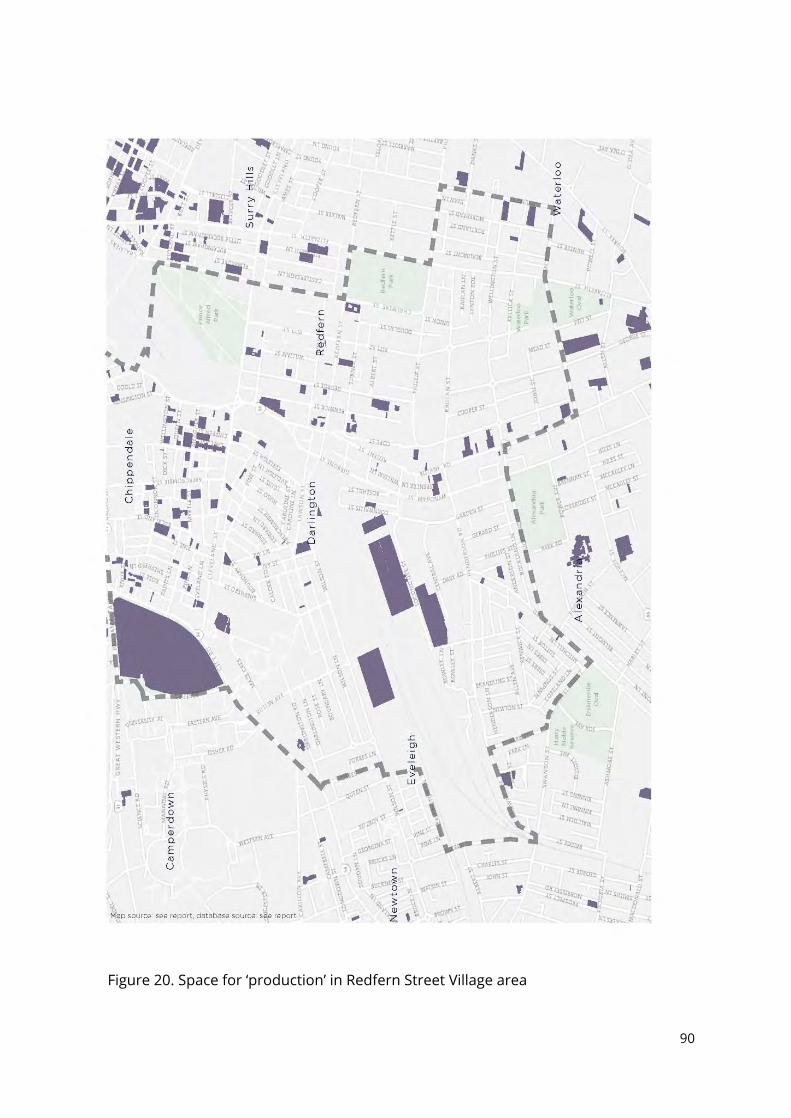
Figure 20. Space for ‘production’ in Redfern Street Village area
90
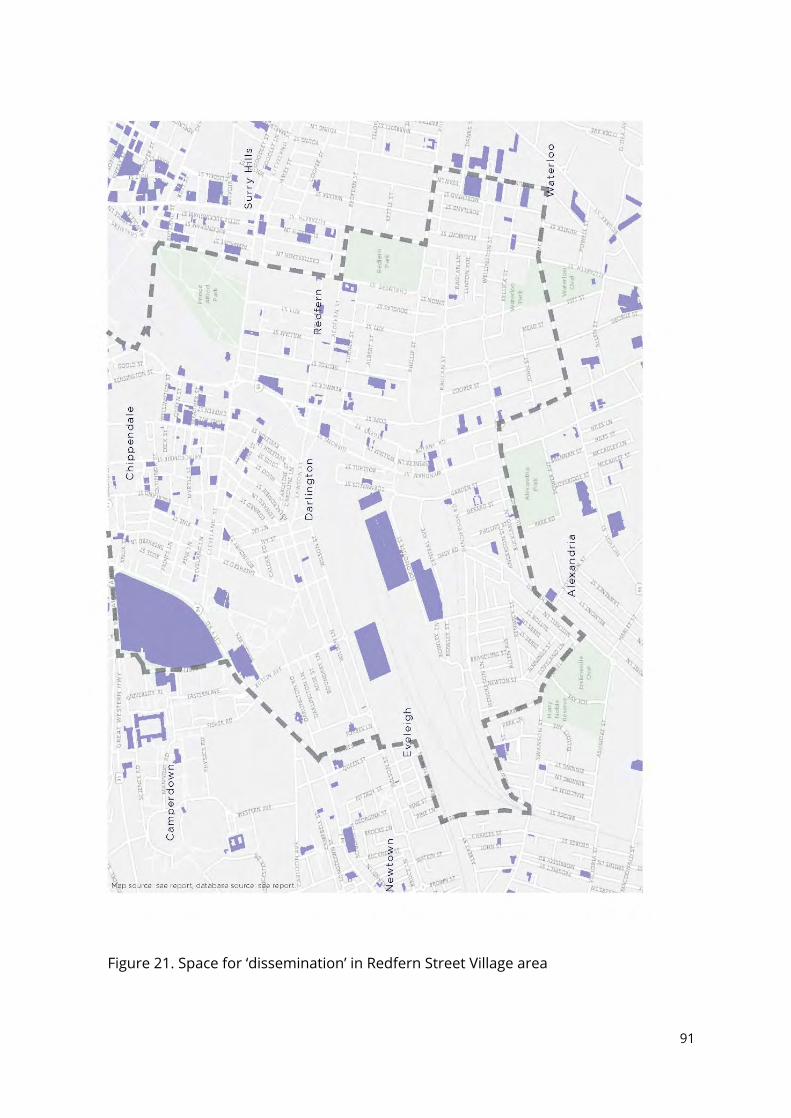
Figure 21. Space for ‘dissemination’ in Redfern Street Village area
91
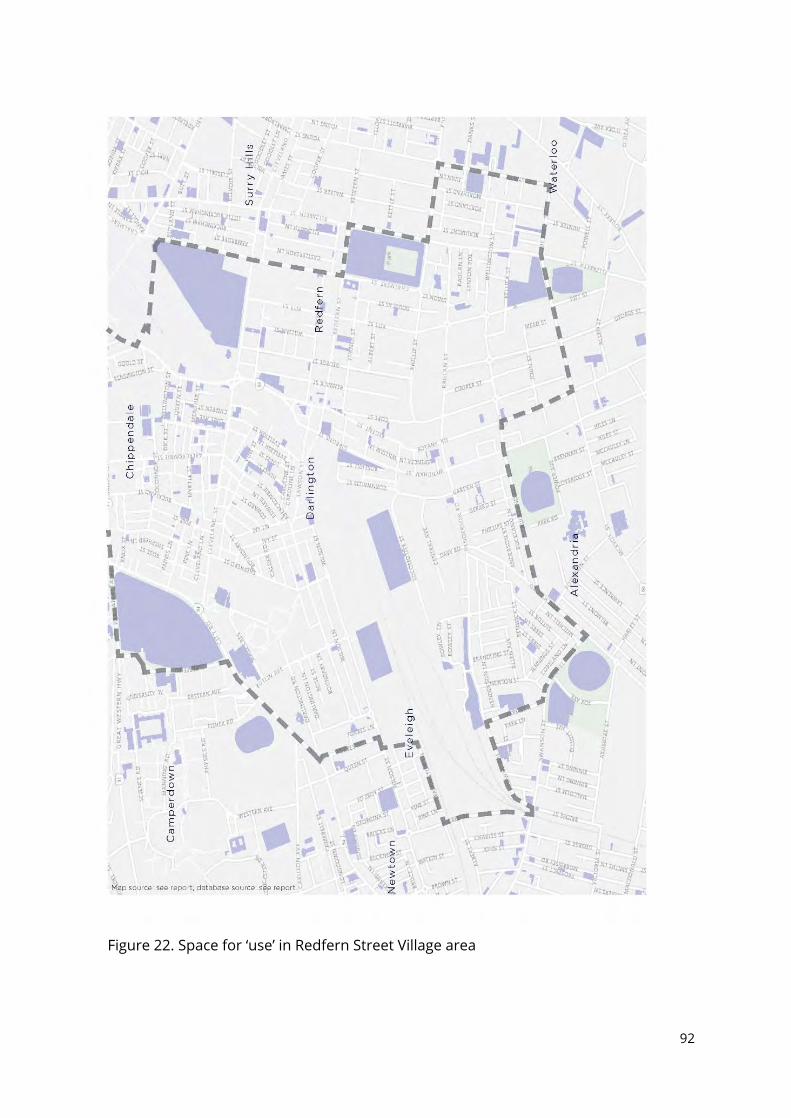
Figure 22. Space for ‘use’ in Redfern Street Village area
92
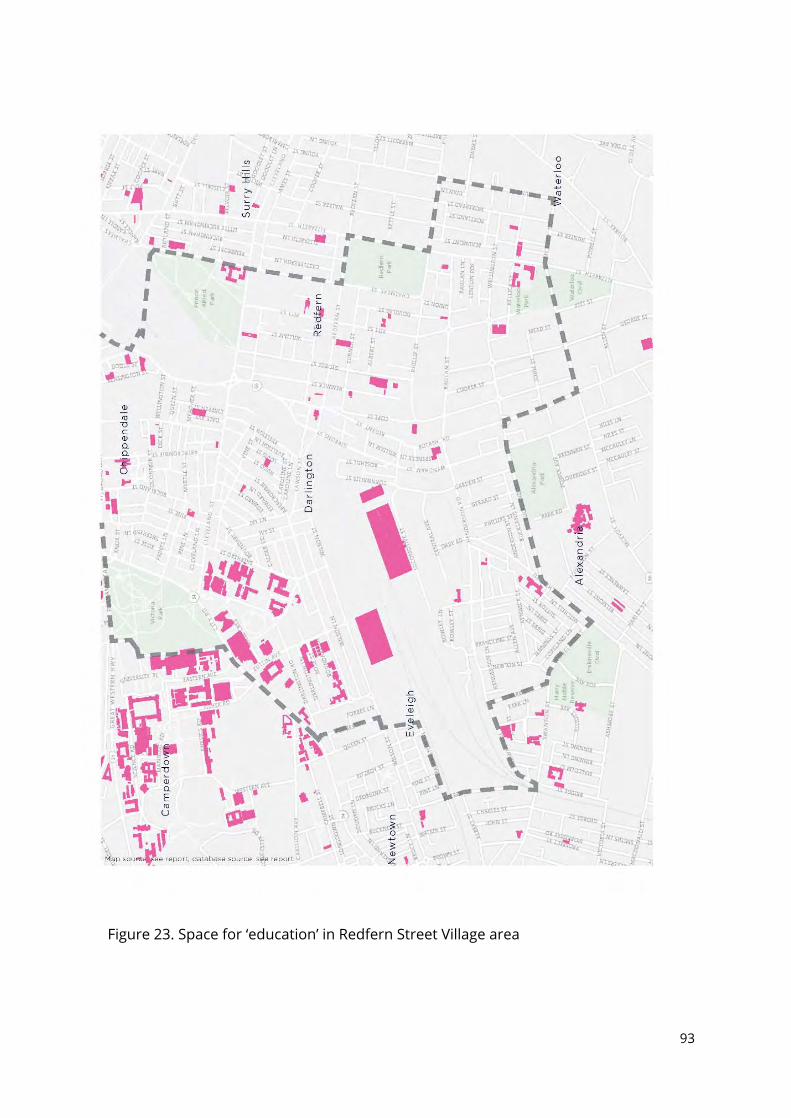
Figure 23. Space for ‘education’ in Redfern Street Village area
93
6.4 Implications for City of Sydney cultural policy making This mapping exercise aligns with a particular aim of City of Sydney’s Cultural Policy and Action Plan (2014), which is to ‘[m]ap neighbourhood cultural activity and infrastructure, and plan for ways to serve neighbourhoods by identifying gaps and promoting current cultural assets’ (p.42). Briefly described below are two urban initiative elements that can potentially draw upon this mapping exercise: first, how development proposals may impact upon current cultural assets; and, second, how to understand better existing strengths and patterns of ‘creative clusters’ (alongside gaps requiring support and/or further research).
Development proposals
This mapping exercise can inform exploration and analysis of existing and future development proposals from multiple sectors which potentially impact on cultural infrastructure and activity in City of Sydney villages. Extracting data and producing maps based on specific cultural spaces and value chains can enhance discussions, responses and strategies in relation to government, cultural industry and commercially-led development proposals. Examples of such developments in the Redfern Street Village include:
i) Government-led developments UrbanGrowth NSW (NSW Government’s urban transformation agency) is leading the Central to Eveleigh Urban Transformation and Transport Program, which seeks to ‘help to meet current and future needs for local residents and a growing global Sydney by providing new community facilities and open space, a mix of new housing and employment opportunities, and improved connections across the rail corridor’ (UrbanGrowth NSW, 2016). With concerns about population density and levels of community consultation, Sydney Lord Mayor Clover Moore (re-elected in September 2016) is keen to understand more about how the Council and the State government can progress the development in a stronger partnership alongside closer community consultation (Visentin, 2016).
ii) Cultural industry-led developments Based on their 2016-2021 report, Carriageworks is seeking government funding and private investment to expand the precinct and, consequently, its programming, alongside infrastructure initiatives such as: ‘Bay 19 will be converted into a 200-seat cinema, while other buildings will house subsidised artists' studios and rehearsal spaces and a workspace for start-up companies and independent creatives’ (Taylor, 2016)
94
iii) Commercially-led developments
An example of commercially-led, mixed-use development is an 18-storey complex at 88 Regent Street proposed by Thirdi Group and Milligan Group developers; the proposal includes retail and commercial suites, child care centre and 82 luxury apartments (The Urban Developer, 2016)
Creative clusters
This mapping exercise can also assist in highlighting particular aspects of creative clusters across City of Sydney villages (cultural spaces and value chain roles), thereby augmenting existing data or identifying specific gaps for future inquiry. In relation to urban development, as discussed later in Section 8, ‘creative clusters’ are identified as ‘multiplicities of people, practices, buildings, spaces, networks and forms of governance’ (Wood et al., 2015, p.8). Further studies can build upon our mapping of spaces and activities by exploring these other dimensions that are associated with creative cluster development. Additional data visualisation can also inform the spatial and relational dimensions that we have preliminarily identified. For example, clusters where artists and creative workers reside are highlighted in a recent map produced by Fairfax media (Davies, 2016) in which, among other locales, the suburbs of Redfern and Chippendale were identified as key areas that attract artists and creative workers. This map was developed using ‘postcode data from the membership lists of the Australian Performing Rights Association, which collects royalties for songwriters and Copyright Agency/Viscopy, which collects copyright for authors and artists’. Professor Chris Gibson (University of Wollongong) describes the evolving geography of these creative clusters thus:
Creative Sydney is a shifting thing. In the 1920s it was Kings Cross; in the 1970s and 1980s it was Paddington, Surry Hills and Glebe. In the 1990s Newtown, then into the 2000s Bondi, Marrickville, Chippendale. (quoted in Davies, 2016)
Furthermore, examining in more fine-grained detail the array of institutions and enterprise networks across City of Sydney villages that contribute to creative clusters is another opportunity which can build on the work to date. In a study of ‘creative clusters, creative people and creative networks’ in the United Kingdom, Mateos-Garcia and Bakhshi (2016) describe how: ‘Creative clusters don’t just consist of businesses and workers […] they are made up of other important local institutions such as universities and business networks too. Measuring these institutions can help policymakers identify a wider set of strengths and weaknesses in the cultural ecosystem, and design suitable interventions in it’ (Mateos-Garcia and Bakhshi, 2016 p.7).
95
6.5 Section summary This mapping exercise provides a brief snapshot of the cultural spaces and value chain characteristics specific to Redfern Street Village. It illustrates a preliminary mapping of how cultural venues are distributed in this area and provides initial insights into their relationships to processes of creation, production, dissemination, use and education. Such a visualisation and analysis of a specific village area demonstrates how this mapping and data collection process provides a foundation for current and future City of Sydney research, policy and community initiatives. For example, a future City of Sydney study can update the database to map cultural infrastructure changes in the area, based on how cultural spaces and value chain dimensions evolve (knowledge that could be richly augmented with qualitative research). In more immediate terms, this mapping exercise provides an additional resource for multi-sectoral negotiations and dialogue in response to major development proposals impacting on Redfern Street Village. Decisions stemming from these proposals will significantly enable or constrain the future of cultural spaces, activities and other features of ‘creative clusters’ in the locale. For this reason, clearly communicating current cultural assets and gaps is vital. Redfern Street Village is under increasing scrutiny due to urban and cultural developments strongly impacting on the area. The role of policy making in recognising the complex dynamics and distribution of cultural practices is significant. As Professor Brendan Gleeson (University of Melbourne) states:
There is a strong role for public policy in protecting culture in the suburbs … As cities become more polymorphous, we need to give attention to investing in new cultural manifestations . (quoted in Davies, 2016)
Recognising the complexity of cultural development and the ‘micro-dynamics’ of infrastructure, networks and agents ‘allows us to identify the emergence of structures and organisational forms that support and facilitate the connectivity and growth of the system’ (Comunian, 2010, p.7). As is highlighted in this mapping exercise, understanding the distribution of cultural venues and activities in specific villages is a key starting point for exploring such complexity. Cultural mapping can, therefore, be utilised to stimulate dialogue and discussion across the City of Sydney’s (2014) ‘strategic priority areas’; that is, to support how challenges are addressed and opportunities augmented in support of the vision that all residents, workers, businesses, industries, institutions and visitors can fully contribute to, and engage with, the ‘cultural and creative life’ of Sydney.
96
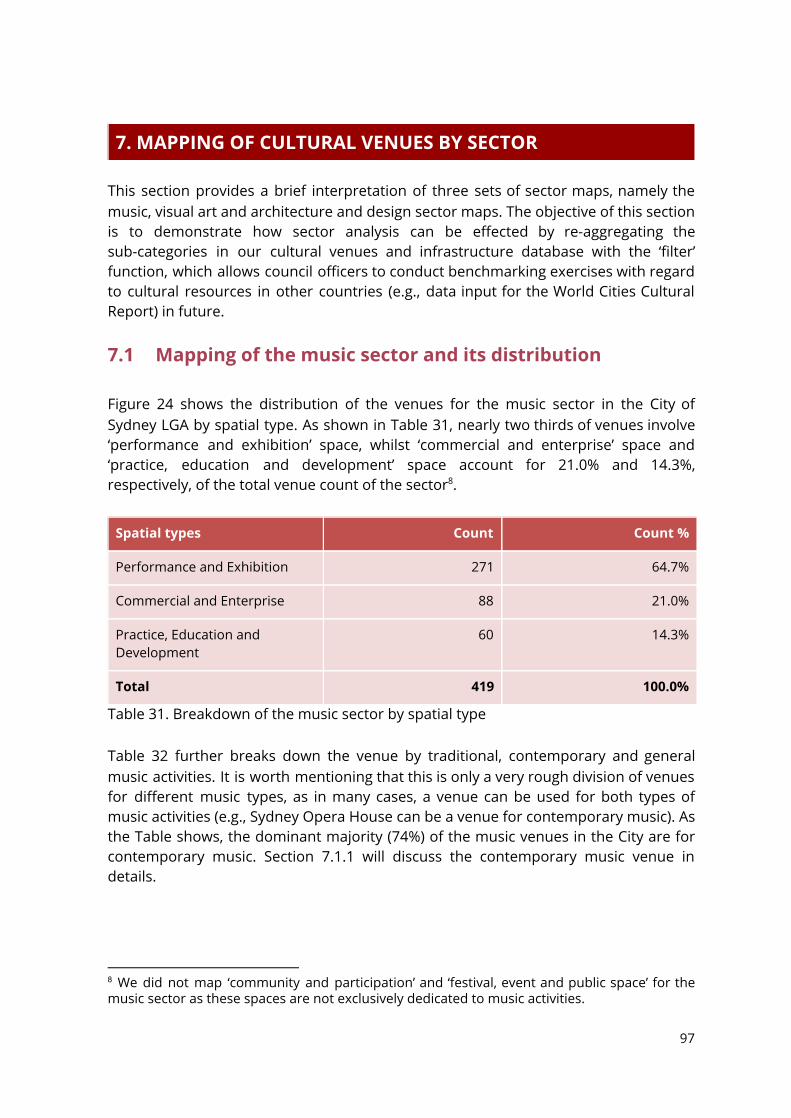
7. MAPPING OF CULTURAL VENUES BY SECTOR This section provides a brief interpretation of three sets of sector maps, namely the music, visual art and architecture and design sector maps. The objective of this section is to demonstrate how sector analysis can be effected by re-aggregating the sub-categories in our cultural venues and infrastructure database with the ‘filter’ function, which allows council officers to conduct benchmarking exercises with regard to cultural resources in other countries (e.g., data input for the World Cities Cultural Report) in future.
7.1 Mapping of the music sector and its distribution Figure 24 shows the distribution of the venues for the music sector in the City of Sydney LGA by spatial type. As shown in Table 31, nearly two thirds of venues involve ‘performance and exhibition’ space, whilst ‘commercial and enterprise’ space and ‘practice, education and development’ space account for 21.0% and 14.3%, respectively, of the total venue count of the sector . 8
Spatial types Count Count %
Performance and Exhibition 271 64.7%
Commercial and Enterprise 88 21.0%
Practice, Education and Development
60 14.3%
Total 419 100.0%
Table 31. Breakdown of the music sector by spatial type Table 32 further breaks down the venue by traditional, contemporary and general music activities. It is worth mentioning that this is only a very rough division of venues for different music types, as in many cases, a venue can be used for both types of music activities (e.g., Sydney Opera House can be a venue for contemporary music). As the Table shows, the dominant majority (74%) of the music venues in the City are for contemporary music. Section 7.1.1 will discuss the contemporary music venue in details.
8 We did not map ‘community and participation’ and ‘festival, event and public space’ for the music sector as these spaces are not exclusively dedicated to music activities.
97
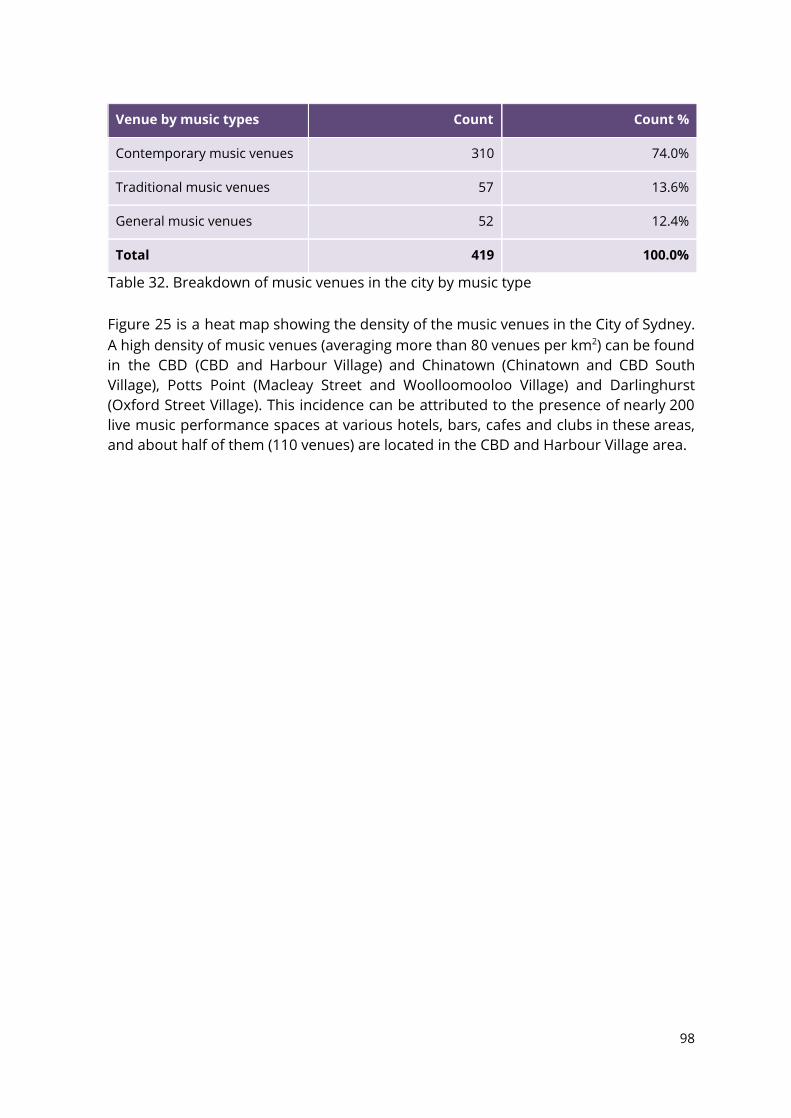
Venue by music types Count Count %
Contemporary music venues 310 74.0%
Traditional music venues 57 13.6%
General music venues 52 12.4%
Total 419 100.0%
Table 32. Breakdown of music venues in the city by music type Figure 25 is a heat map showing the density of the music venues in the City of Sydney. A high density of music venues (averaging more than 80 venues per km 2 ) can be found in the CBD (CBD and Harbour Village) and Chinatown (Chinatown and CBD South Village), Potts Point (Macleay Street and Woolloomooloo Village) and Darlinghurst (Oxford Street Village). This incidence can be attributed to the presence of nearly 200 live music performance spaces at various hotels, bars, cafes and clubs in these areas, and about half of them (110 venues) are located in the CBD and Harbour Village area.
98
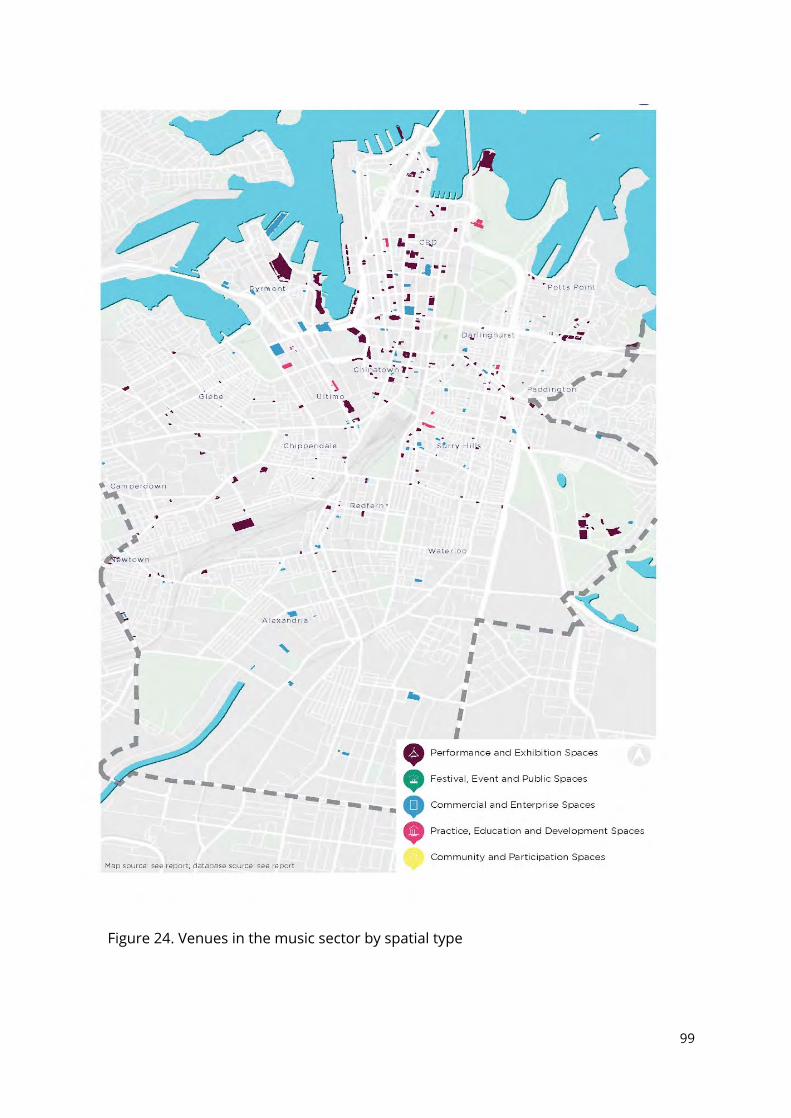
Figure 24. Venues in the music sector by spatial type
99
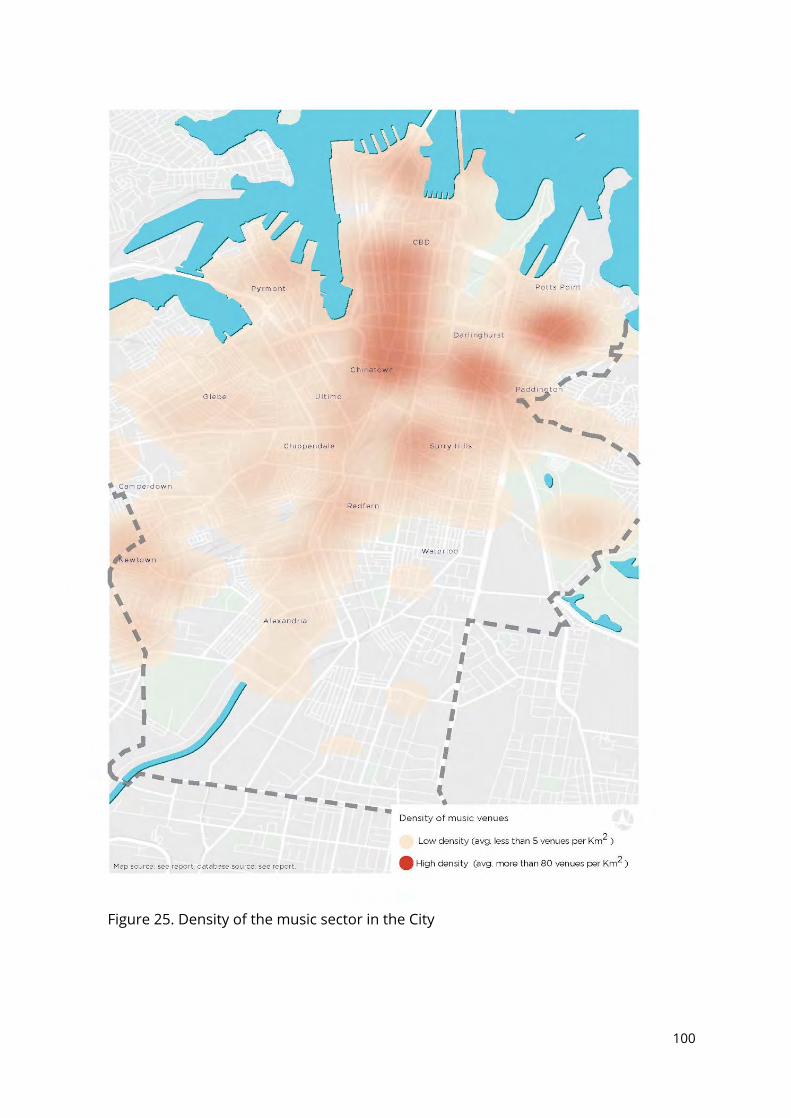
Figure 25. Density of the music sector in the City
100
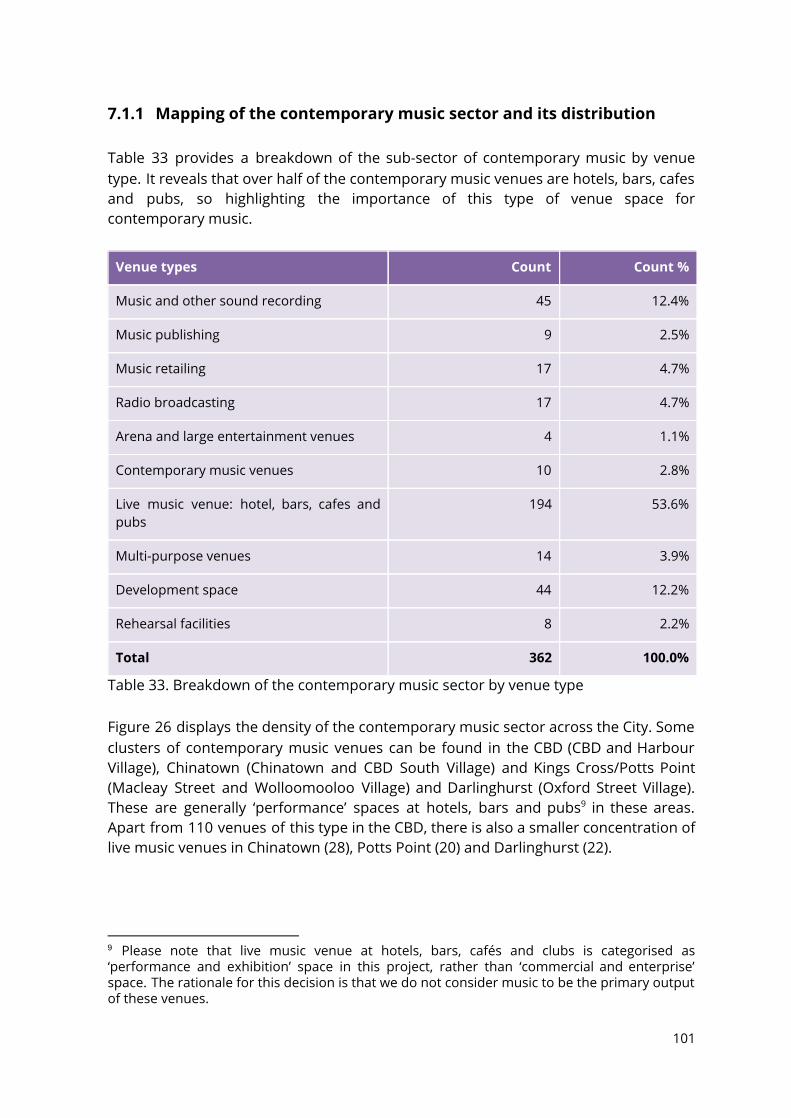
7.1.1 Mapping of the contemporary music sector and its distribution Table 33 provides a breakdown of the sub-sector of contemporary music by venue type. It reveals that over half of the contemporary music venues are hotels, bars, cafes and pubs, so highlighting the importance of this type of venue space for contemporary music.
Venue types Count Count %
Music and other sound recording 45 12.4%
Music publishing 9 2.5%
Music retailing 17 4.7%
Radio broadcasting 17 4.7%
Arena and large entertainment venues 4 1.1%
Contemporary music venues 10 2.8%
Live music venue: hotel, bars, cafes and pubs
194 53.6%
Multi-purpose venues 14 3.9%
Development space 44 12.2%
Rehearsal facilities 8 2.2%
Total 362 100.0%
Table 33. Breakdown of the contemporary music sector by venue type Figure 26 displays the density of the contemporary music sector across the City. Some clusters of contemporary music venues can be found in the CBD (CBD and Harbour Village), Chinatown (Chinatown and CBD South Village) and Kings Cross/Potts Point (Macleay Street and Wolloomooloo Village) and Darlinghurst (Oxford Street Village). These are generally ‘performance’ spaces at hotels, bars and pubs in these areas. 9
Apart from 110 venues of this type in the CBD, there is also a smaller concentration of live music venues in Chinatown (28), Potts Point (20) and Darlinghurst (22).
9 Please note that live music venue at hotels, bars, cafés and clubs is categorised as ‘performance and exhibition’ space in this project, rather than ‘commercial and enterprise’ space. The rationale for this decision is that we do not consider music to be the primary output of these venues.
101
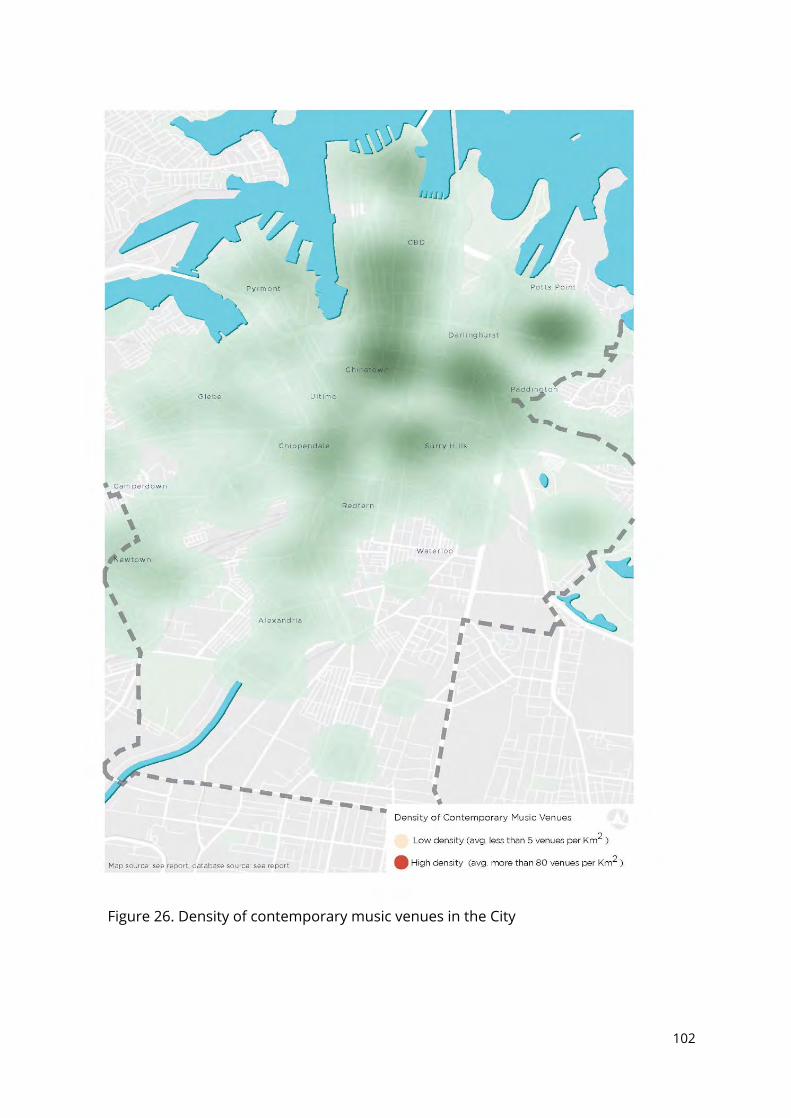
Figure 26. Density of contemporary music venues in the City
102
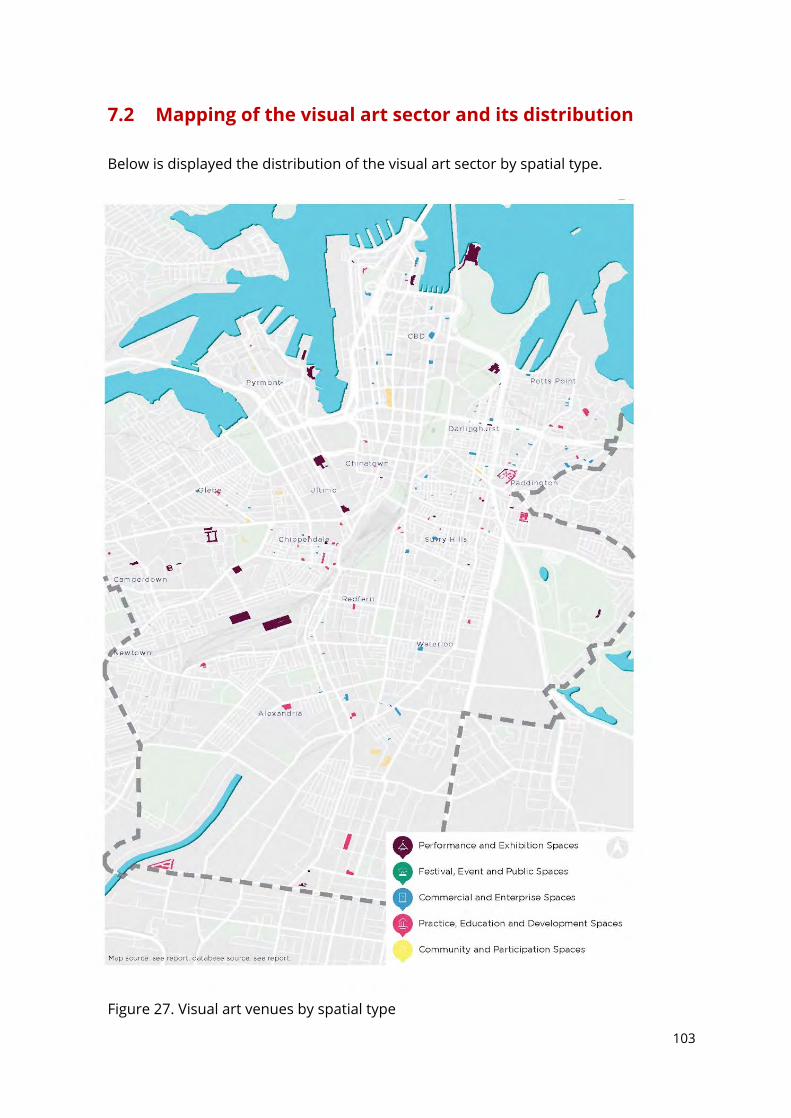
7.2 Mapping of the visual art sector and its distribution Below is displayed the distribution of the visual art sector by spatial type.
Figure 27. Visual art venues by spatial type
103
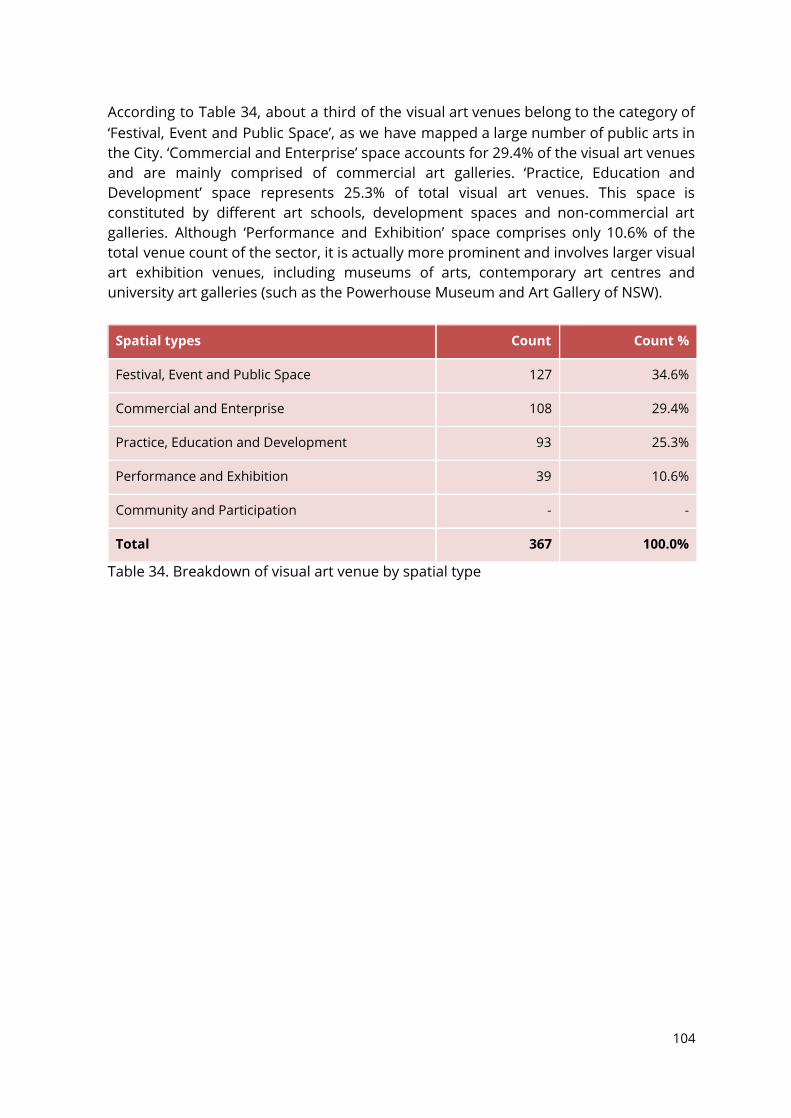
According to Table 34, about a third of the visual art venues belong to the category of ‘Festival, Event and Public Space’, as we have mapped a large number of public arts in the City. ‘Commercial and Enterprise’ space accounts for 29.4% of the visual art venues and are mainly comprised of commercial art galleries. ‘Practice, Education and Development’ space represents 25.3% of total visual art venues. This space is constituted by different art schools, development spaces and non-commercial art galleries. Although ‘Performance and Exhibition’ space comprises only 10.6% of the total venue count of the sector, it is actually more prominent and involves larger visual art exhibition venues, including museums of arts, contemporary art centres and university art galleries (such as the Powerhouse Museum and Art Gallery of NSW).
Spatial types Count Count %
Festival, Event and Public Space 127 34.6%
Commercial and Enterprise 108 29.4%
Practice, Education and Development 93 25.3%
Performance and Exhibition 39 10.6%
Community and Participation - -
Total 367 100.0%
Table 34. Breakdown of visual art venue by spatial type
104
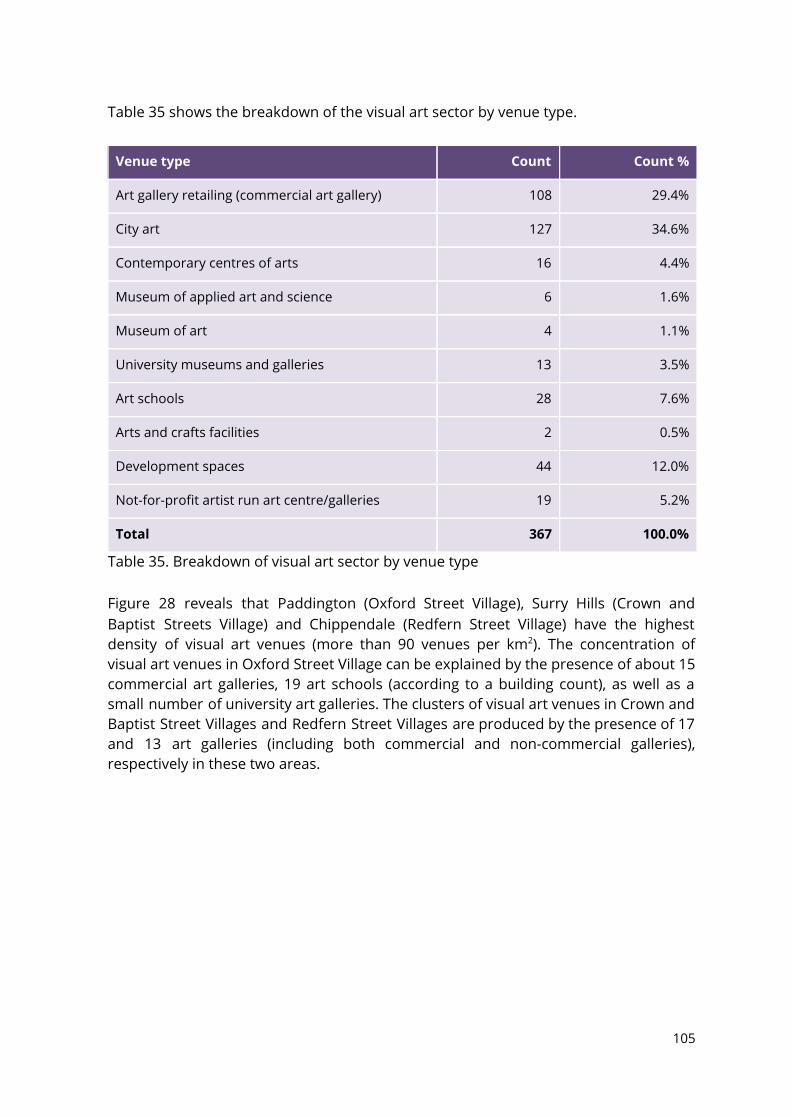
Table 35 shows the breakdown of the visual art sector by venue type.
Venue type Count Count %
Art gallery retailing (commercial art gallery) 108 29.4%
City art 127 34.6%
Contemporary centres of arts 16 4.4%
Museum of applied art and science 6 1.6%
Museum of art 4 1.1%
University museums and galleries 13 3.5%
Art schools 28 7.6%
Arts and crafts facilities 2 0.5%
Development spaces 44 12.0%
Not-for-profit artist run art centre/galleries 19 5.2%
Total 367 100.0%
Table 35. Breakdown of visual art sector by venue type Figure 28 reveals that Paddington (Oxford Street Village), Surry Hills (Crown and Baptist Streets Village) and Chippendale (Redfern Street Village) have the highest density of visual art venues (more than 90 venues per km 2 ). The concentration of visual art venues in Oxford Street Village can be explained by the presence of about 15 commercial art galleries, 19 art schools (according to a building count), as well as a small number of university art galleries. The clusters of visual art venues in Crown and Baptist Street Villages and Redfern Street Villages are produced by the presence of 17 and 13 art galleries (including both commercial and non-commercial galleries), respectively in these two areas.
105
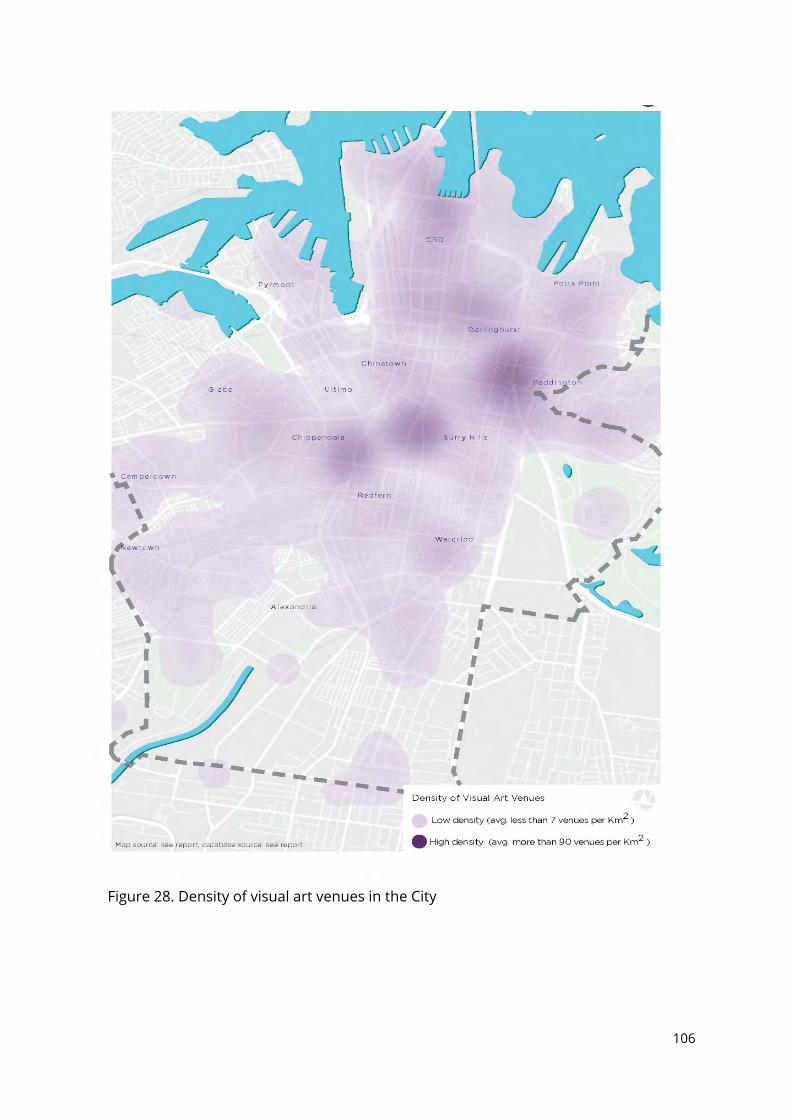
Figure 28. Density of visual art venues in the City
106
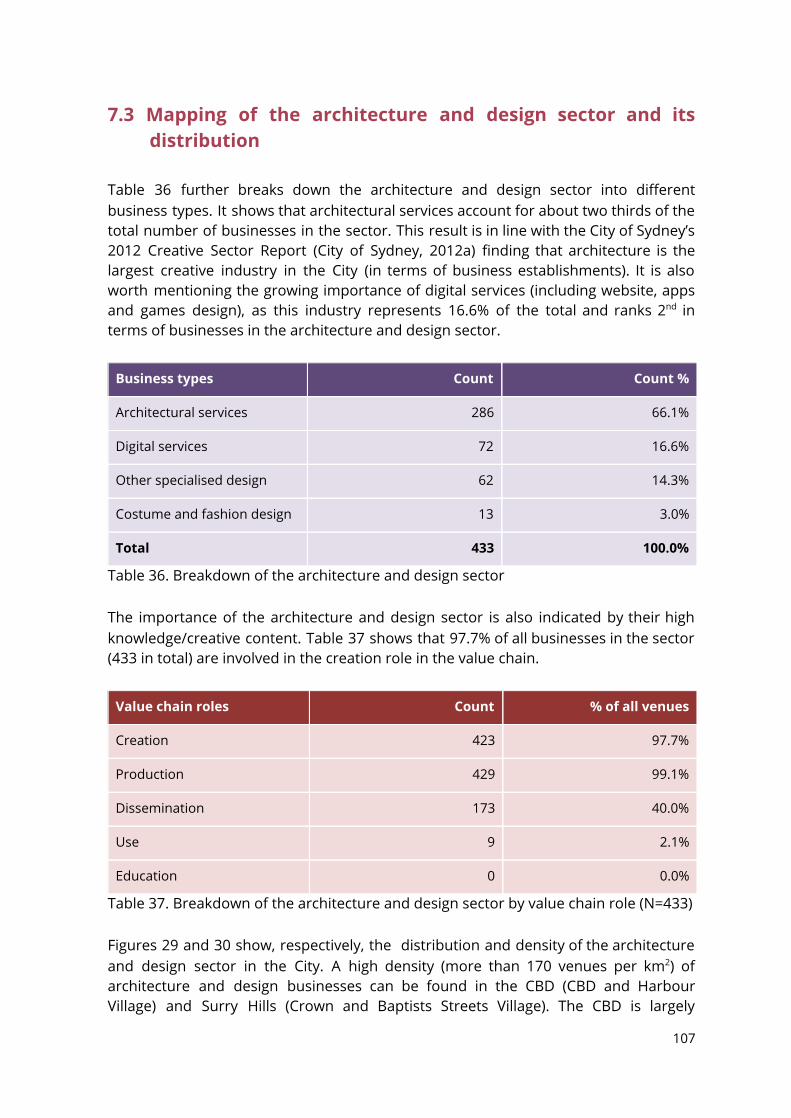
7.3 Mapping of the architecture and design sector and its distribution
Table 36 further breaks down the architecture and design sector into different business types. It shows that architectural services account for about two thirds of the total number of businesses in the sector. This result is in line with the City of Sydney’s 2012 Creative Sector Report (City of Sydney, 2012a) finding that architecture is the largest creative industry in the City (in terms of business establishments). It is also worth mentioning the growing importance of digital services (including website, apps and games design), as this industry represents 16.6% of the total and ranks 2 nd in terms of businesses in the architecture and design sector.
Business types Count Count %
Architectural services 286 66.1%
Digital services 72 16.6%
Other specialised design 62 14.3%
Costume and fashion design 13 3.0%
Total 433 100.0%
Table 36. Breakdown of the architecture and design sector The importance of the architecture and design sector is also indicated by their high knowledge/creative content. Table 37 shows that 97.7% of all businesses in the sector (433 in total) are involved in the creation role in the value chain.
Value chain roles Count % of all venues
Creation 423 97.7%
Production 429 99.1%
Dissemination 173 40.0%
Use 9 2.1%
Education 0 0.0%
Table 37. Breakdown of the architecture and design sector by value chain role (N=433) Figures 29 and 30 show, respectively, the distribution and density of the architecture and design sector in the City. A high density (more than 170 venues per km 2 ) of architecture and design businesses can be found in the CBD (CBD and Harbour Village) and Surry Hills (Crown and Baptists Streets Village). The CBD is largely
107

dominated by architecture services, as over 100 architectural firms are located there, whilst digital and specialised design services are less prominent in the area (each only counting for only 10 businesses). Surry Hills, on the other hand, has fewer architectural firms than in the CBD (78 architectural firms), but the area has a larger number of digital and specialised design services (24 for digital and 20 for specialised design services).
108
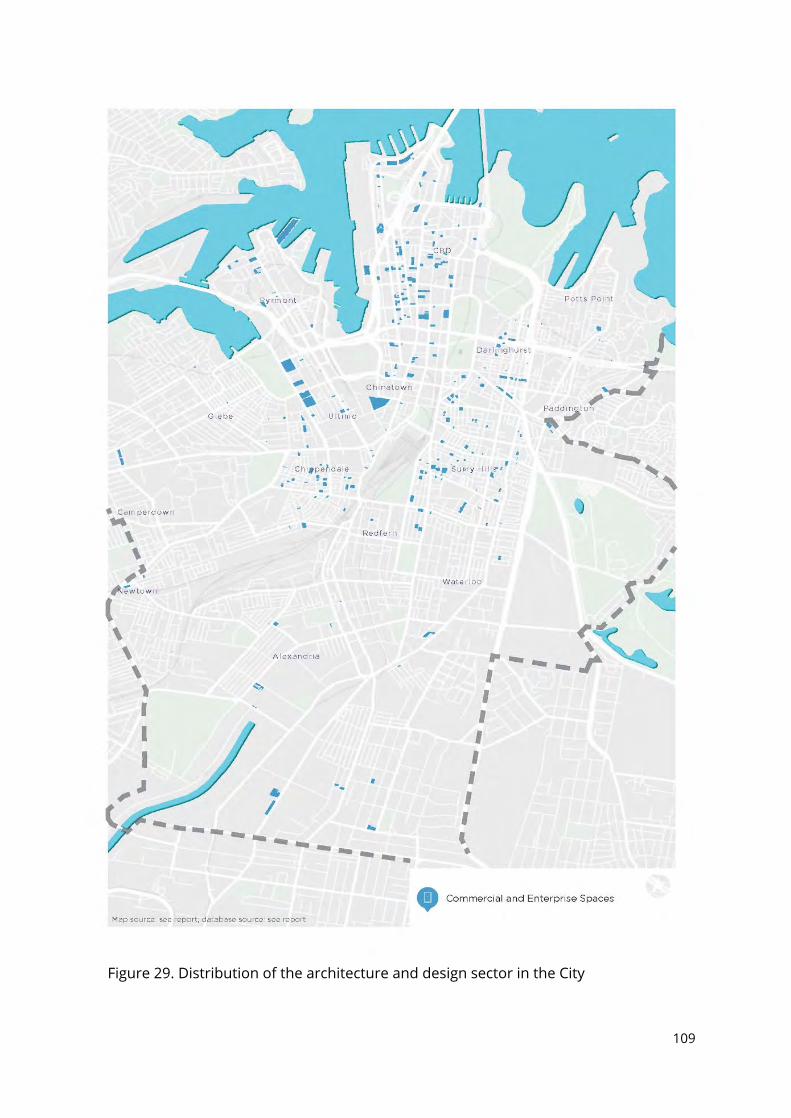
Figure 29. Distribution of the architecture and design sector in the City
109
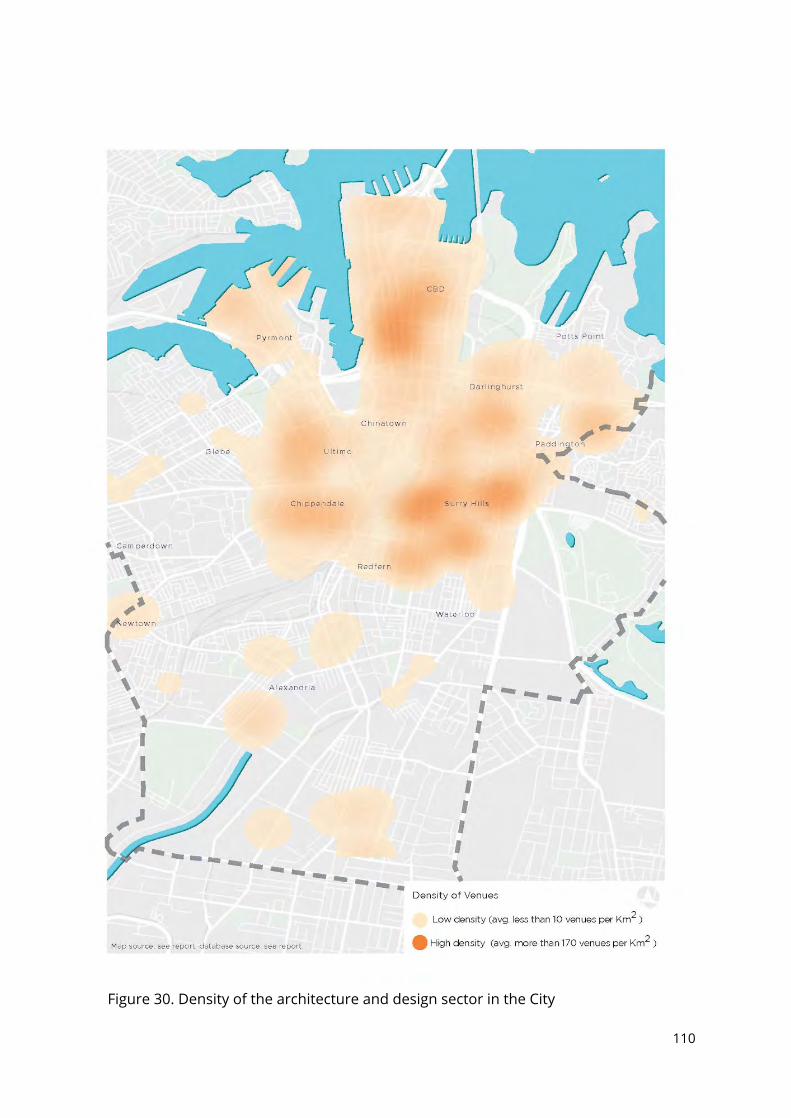
Figure 30. Density of the architecture and design sector in the City
110
8. EVALUATION OF METHODOLOGY
8.1 Rationale for the methodology This section evaluates the methodology that we have proposed and tested in this project. As explained in our interim report, our methodology is driven by two approaches—a top-down ‘theoretical’ approach, and a bottom-up ‘data driven’ approach. As for the theoretical approach, the design of our framework has been based on different theories of culture and international models of cultural classification (e.g. UNESCO) (see Section 2). As a result, we have designed a classification framework which is largely in line with international models, and at the same time flexible enough to capture a broad range of cultural activities and practices in different settings. Summing up, our classification framework has the following advantages. It:
● Provides a comprehensive framework to cover the full scope of cultural venues and organisations, and to capture both professional and leisure/amateur cultural practices
● Aligns with the City of Sydney’s Cultural Policy and Action Plan and other related strategies (e.g. public art strategy, live music and performance action plan) in the designation of the five major spatial domains
● Avoids hierarchical and polarised classification, but showing distinctive value created in each domain
● Highlights the cross-disciplinary and relational nature of cultural production and circulation through the mapping of value chain roles
● Has the ability to capture the specific characteristics of the the City of Sydney (e.g. global city, cultural diversity, urban fine-grained, key industrial sectors)
● An innovative methodology that can be replicated, and is easy to further update and develop in the future by the inclusion of placeholders for new cultural domain (e.g digital domain)
With regard to the bottom-up ‘data-driven’ approach, we were pragmatic in our data collection and the design of our sub-categories. We have used a readily available dataset—the 2012 Floorspace and Employment survey (FES)—as the base data for our cultural mapping exercise. The availability of this dataset also influenced how we design the sub-categories in our spatial domains. For instance, the sub-categories contained in the ‘Commercial and Enterprise’ spaces are broadly aligned with the ANZSIC codes used in the FES (the problems in relation to the use of ANZSIC will be discussed in section 8.3.1). We then refined our sub-categories according to the information gathered from the data validating and checking processes which enabled
111
us to remove excessive sub-categories that are not grounded by actual venues in the City of Sydney. Our classification method to break down cultural activities into different sub-categories—a small unit based on venue/organisation type—also gives a number of advantages over the ‘sectoral approach’ commonly used by major international frameworks. For instance, our method enables council officers or researchers to re-aggregate data in the database to conduct a benchmarking exercise with other countries (e.g. by comparing different cultural sectors in the World Cities Cultural Report). At the same time it makes possible the capture of the dynamic and evolving practices and definitions of culture, such as the emergence of different cultural activities (e.g. digital and media) or the incorporation of film and digital art into the category of the visual arts. Despite the advantages of our framework and classification method mentioned above, our categorisation of venues cannot be entirely accurate. Rather, our results should be regarded as a ‘snapshot’ of cultural activities in the City at a certain point of time. The section below explains the limitations of our methods and summarises some of the challenges we have faced. This reflection of our methodology will draw out lessons for future iterations of this cultural mapping exercise. 8.2. Limitations of the framework 8.2.1. Challenges with the spatial domains/categories The biggest challenge we came across in this project was to establish a standard definition of ‘culture’, to identify what is and isn’t considered to be ‘cultural activity’, and then design parameters systematically to organise different cultural activities into our classification framework. As discussed earlier (Section 3), the framework employed the following five spatial domains:
● Performance and Exhibition ● Commercial and Enterprise ● Community and Participation ● Practice, Development and Practice ● Festival, Event and Public Space
It is never easy to classify culture, which is fluid and constantly changing, while cultural activities can happen everywhere. Limiting culture to a predetermined set of infrastructure and venues can, therefore, be problematic. Take music as an example, it can happen in a concert hall, in businesses, at hotels or bars, or even at a community hall or school. Therefore, if we only focus on musical activity that takes place in a formal setting or in physical infrastructure such as a concert hall, we will inevitably privilege professional or commercial music activities, whilst overlooking many leisure or amateur music practices which are an integral part of the cultural
112
‘system’ or ‘ecology’ of music (Potts, 2007). As a result, we decided to broaden the cultural mapping exercise to include not only cultural venues but also different types of cultural enterprise and organisation (sometimes it is difficult to differentiate cultural venues from organisations as they can overlap). Paying too much attention to physical venues (fixity or materiality of culture) can result in the neglect of the flows and relations that are essential elements in the ecology of culture (Bavinton, 2011). A key challenge has been that of identifying what kinds of cultural activity should be included or excluded, and how to assign them consistently to their rightful ‘domain’ in our comprehensive framework. Here, we have adopted a practical approach by categorising more ambiguous or hard-to-define items on a case-by-case basis. Appendix 5 summarises some of our discussions and the reasons why some sub-categories have been included or excluded. Some cultural sectors, such as sports and leisure (e.g., playing fields, amusement, and gaming centres) and tourism (e.g., heritage buildings or historical sites) have been excluded at the request of the City of Sydney, although they are classified as culture in other international frameworks. 8.2.2 Challenges with the value chain roles
In addition to the spatial domains and sub-categories, as mentioned in Section 3.3 we have included a value chain dimension in our classification framework, which is divided into the following five roles:
● Creation ● Production ● Dissemination ● Use ● Education
We have modified the typical industry supply-chain model into a more appropriate list of value chain roles—a series of interlinked processes—that draw on the similar concept of ‘culture cycle’ or ‘creative chain’ used in major international frameworks. However, assigning value chain roles to cultural venues or organisations is by no means an easy task. In particular, there is no information about value chain roles that is readily available (the FES data which is classified according to ANZSIC and only vaguely imply certain value chain roles such as manufacturing, wholesaling or retailing). Therefore, we had to check all the venues and organisations manually to determine their respective value chain roles. This is a very time-consuming and laborious process and requires considerable fine-grained research work. Our major approach has been to check the website or facebook page of each venue or organisation to identify their respective value chain roles. We are aware, however, that this can only be an approximation of the actual roles played by particular venues. We have identified some limitations in relation to the categorisation of value chain roles in the process of the research. First, it is not always easy to distinguish the value
113
chain roles as in reality they tend to be interconnected. For example, in the digital sector the processes of ‘creation’ and ‘production’ frequently combine in ways that cannot be disentangled. Also, some cultural products such as music can be downloaded from a website, so in that sense, a web page can be a site for ‘dissemination’ and ‘use’. This blurring of the boundaries between different value chain roles has complicated our categorisation, leading us to allow multiple value chain roles to be assigned to each venue. Moreover, the generic nature of the value chain roles makes it difficult to capture the specificity of cultural production and practices in different sectors/domains. This is a familiar problem of specificity versus breadth - almost any work with a creative idea or concept can be classified as ‘creation’. However, in reality, the artistic creation of a painting is very different from the industrial design such as in architecture. Even in the same industry, say fashion design, there is a whole spectrum of activities that we classified as ‘creation’ but are very different in their cultural ‘value’ or ‘content’. A broad definition of value chain roles means that such differences cannot be registered, although the simultaneous inclusion of spatial types partially counters this limitation. Finally, it has been difficult to assign value chain roles for venues in the ‘community and participation’ and ‘festival, event and public space’ domains, because unlike in the industry sectors, they do not follow the usual sequence of cultural production processes. For example, it is difficult to get the value chain roles to fit in the sub-category of ‘government, industrial and artistic organisations’, as they are organisations that enable and support cultural creation and production but they don’t do these things themselves. Whilst some international framework such as the ESSnet has created a separate value chain role for these organisations—management and regulation (ESSnet-Culture, 2012, p.29), in the absence of this value chain category in our framework, we have to put them in ‘creation’, ‘production’ and ‘dissemination’ but not ‘use’ and ‘education’. Further thought needs to be put into the inclusion of value chain roles in future cultural mapping exercises.
8.3 Limitations of the data collection As explained previously in Section 4, our data mainly come from an existing dataset from the City of Sydney 2012 Floorspace and Employment Survey (FES) and already compiled lists of cultural venues supplied by the City of Sydney, complemented with our search of online directories for under-represented categories identified in the database and the use of a crowd-sourced survey with the intention to capture informal, ad hoc spaces which are less known to the City. This section discusses the limitations of our data sources and some of the challenges we faced. 8.3.1 Challenges with ANZSIC classi秜ᇘcation and FES
Over half of our data (55%) comes from the City of Sydney’s 2012 FES. The advantage of using FES data has been explained elsewhere in the report. It is mainly because of
114
its extensive coverage of all business establishments across the whole city. Each entry is linked to a geocode, thus enabling us to map these venues easily and with improved accuracy. However, mapping cultural venues with FES data is not a straightforward process. As Section 5.1 revealed, we originally collected 5,620 entries from the FES, but after the data cleaning process (to get rid of the irrelevant entries), only 1,724 entries were retained in our master database. The FES, therefore, may not be the best data source for mapping culture. One the problems of the FES lies in its classification system, which is based on Australian Bureau of Statistics (ABS)’s ANZSIC in relation to industrial outputs. Whilst it is understandable that FES has to use the ANZSIC classification to align with national statistical standards, using it to identify cultural activities is problematic. ANZSIC is a classification system developed for more traditional industrial sectors, and does not have a separate ‘division’ for the cultural industries. Except for the sub-division 900 ‘Creative and Performing Art Activities’ (including 9001, 9002, 9003), which is entirely relevant to the cultural sector, other culture activities are scattered everywhere and hidden in different divisions, groups and classes, and thus needed to be separately identified. For example, to identify art gallery retailing, we needed to look up the ANZSIC 4279 ‘other retail store based retailing’, which covers a wide range of retail stores, the majority of which do not sell ‘cultural products’. In fact, not only do many cultural activities not have a separate ‘class code’ in the ANZSIC system, even at 4 digit level, they are also usually contained in the categories referred to as ‘n.e.c.’ (not elsewhere classified), making it even harder to separate them from other non-cultural activities. Examples are ‘musical instruments manufacturing’, which is contained in ANZSIC 2599 ‘Other manufacturing n.e.c.’, and ‘theatre and concert booking services’, which is buried within ANZSIC 7299 ‘other administrative services n.e.c.’. Another drawback of using FES and ANZSIC is that non-economic/market activities are poorly served under the ANZSIC classification system. As already stated, ANZSIC is designed to capture statistical data for industrial or commercial outputs. Informal sectors, social activities, voluntary organisations or other associations (e.g., cultural or interest groups), which are included in our classification framework, are not covered comprehensively in ANZSIC and FES. For example, we noticed that the sub-category ‘artist’ is relatively under-represented in our FES database. We believe that this is because many artists, musicians and writers tend to work as a freelancers or are involved in part-time work, so they do not have a proper business registration for themselves, and so are unable to be captured in the FES data. We also discovered that many performance venues such as a school halls or community centres are not contained in the FES, as ANZSIC 9003 ‘performing art venue operations’ mainly covers commercial or formal performing art venues. Therefore, in order to fill these data gaps in the FES, we had to supplement the database by conducting our own online search. Moreover, as we only obtained one year of FES data that was conducted almost five years ago, we have been unable to capture the changes of cultural venues over time or the recent development of cultural venues and new cultural activities in the City.
115
For example, during our data checking we noted that many bars and clubs have been closed (which may have been caused by the introduction of ‘Lock-out’ laws in 2014). However, we cannot draw a more definite conclusion due to the absence of the long-term comparative data. Also, as described in our other recent study (Wong et al, 2016) in Chinatown and CBD South Village, there is large-scale construction of new performance venues (ICC Sydney Theatre) and community facility (library) in Darling Square. But, as our main data source dated back to 2012, we were unable to reflect these new developments. Similarly, in Green Square Village the FES data were unable to reveal more recent changes in cultural venues (e.g., new schools, community or creative centres) driven by the rapid population growth and high rise developments in the area. Whilst we recognise that the FES is an important and useful data source, future cultural mapping research needs to reconcile additional records with the FES dataset to retrieve a more accurate consolidated database. 8.3.2 Limitations of the crowd-sourcing survey
The crowd-sourcing survey was released on 28 June and closed on 31 August, 2016. During this period, we obtained 45 responses. Of these, we identified 17 new, non-overlapping cultural venues, which were added to the consolidated database. Our original target was 50-100 new cultural venues. The survey was intended to collect information on informal, ad hoc, non-obvious cultural spaces and venues through nomination by local informants. However, the effectiveness of the survey has been hampered by a number of factors. First, it was difficult to get people to participate and share information, despite a major effort by both the ICS research team and the City of Sydney to promote and distribute the survey, including ICS’ website and facebook page, twitter, ICS’s own mailing list, the cultural organisations list compiled by the research team, the City of Sydney’s ‘Sydney Your Say’ website, the City’s accommodation grant recipients and mailing list. The survey was also sent to the National Association for the Visual Arts (NAVA) and Sydney Fringe Festival organisers. We also created a customised version of the survey for the live music sector, which was distributed through the City of Sydney’s live music sector list, and for which we received 10 responses, of which 3 were related to new venues. This experience points to a certain lack of responsiveness to survey method on the part of the cultural community. Second, some design issues of the survey may have contributed to the problems. For instance, the questionnaire contained too many questions (about 20 in one module) and may have taken too long to complete. A simpler survey, without requiring participants to select the most appropriate domain and sub-category to describe their cultural activities, would have worked better (although necessarily limited in scope and depth). Moreover, from the feedback we obtained at the end of survey, we
116

noticed that some participants found it too difficult to point to the exact location of their venue by dragging the red pin on the map. While the principle of a crowd-sourcing survey to capture ‘informal’ and ‘hidden’ cultural venues is undeniably useful, more thought needs to be given to the size, structure and distribution of the survey to ensure a greater response rate.
117
9. RECOMMENDATIONS AND FUTURE DIRECTIONS FOR
CULTURAL MAPPING Recommendations for future cultural mapping are highlighted in relation to the six priorities that the City of Sydney has identified in order to ‘optimise Sydney’s strengths, address its most pressing challenges and refocus the City of Sydney’s role in building a distinctive and vibrant city’ (City of Sydney, 2014a, p.24). These priorities include: 1) Precinct distinctiveness and creativity in the public domain 2) New avenues for creative participation 3) Sector sustainability: surviving and thriving 4) Improving access, creating markets 5) Sharing knowledge 6) Global engagement Our recommendations emerge from the design, development and analysis of the Cultural Venues and Infrastructure Database communicated in this report. Overall the database aims to inform the City of Sydney’s proposed Cultural Infrastructure Plan (City of Sydney, 2014a, p.64), as well as to provide a foundation for future cultural resource data collection and knowledge sharing (to expand and enrich the database and the City of Sydney’s work in the cultural sector). Our suggestions strongly resonate with the multi-faceted and open-ended process of ‘deep mapping’ (Roberts, 2016), a key driver of future research and the approach for expanding upon the Cultural Venues and Infrastructure Database built to date. The ethos behind this approach is ‘to present place as always open to the addition of supplementary voices, democratically positioning existent past, present and future knowledge and, thereby, building a structure of connectedness’ (Springett, 2015, p.629). Outlined below are recommendations for future research based upon ‘deep mapping’ and the City of Sydney priorities. 1) Precinct distinctiveness and creativity in the public domain This priority seeks the following outcomes: ‘Creativity to be more frequent and visible in the city’s public domain and its precincts through a critical mass of activity – large and small scale, temporary and permanent. Initiatives should amplify and explore the unique characteristics and histories of each village and reinvigorate urban spaces and infrastructure with creative imagination.’ (City of Sydney, 2014a, p.41). Three research avenues related to this priority area are described below:
118
● Developing further understandings of non-traditional cultural spaces and activities Through the development of our cultural mapping classification framework, we identified ‘Festival, Event and Public Space’ as one of five key domains. This initial mapping provides a foundation for future qualitative and quantitative research to understand better the barriers and constraints for engaging with cultural experiences outside traditional cultural venues. This avenue relates to the goal to ‘ensure initiatives that contribute to unique creative experiences and interventions in the public domain are supported and encouraged’ (City of Sydney, 2014a, p.41)
● Creating a ‘time series analysis’ of infrastructure usage and stakeholder experiences over a 12-month period within a speci秜ᇘc village
The Cultural Venues and Infrastructure Database provides a snapshot of cultural infrastructure which could be richly augmented by temporal data (e.g., collecting usage and experience patterns of these spaces over a year within a specific village). Temporally mapping such utilisation and experiential aspects could provide richer understandings of these spaces in the City of Sydney. Through identifying patterns related to scheduling, trends and responses, a ‘time series analysis’ (ABS, 2016) can inform more nuanced cultural planning and policymaking. This avenue relates to the goal to ‘support accessible cultural and creative experiences and events through year-round initiatives in partnership with artists, business and community stakeholders’ (City of Sydney, 2014a, p.41)
● Exploring the network of governance and administrative processes which enable and constrain cultural infrastructure and activity (e.g. regulations, event application and approvals)
In relation to urban development, ‘creative clusters’ are identified as ‘multiplicities of people, practices, buildings, spaces, networks and forms of governance’ (Wood et al. 2015, p.8). Reflecting the project’s objectives, the Cultural Venues and Infrastructure Database currently integrates data based on particular aspects of creative clusters (i.e. cultural spaces and value chain roles). Research exploring the limitations within the current network of governance and administrative processes, alongside opportunities for change, is required in order to add to a more holistic picture of creative cluster enablers and constraints. Identifying opportunities to partner with cultural organisations to expand the Cultural Venues and Infrastructure Database is another research opportunity to support this priority area. For example, the Live Music Office (2016) ‘ works to increase opportunities for live music in Australia by identifying and advocating for better policy, regulation and strategy’. It has created a user-generated Live Music Map to ‘bring the live music sector closer together’. The map displays music venues, radio stations, recording and rehearsal studios, music education centres, production and backline organisations, agents and promoters, and music organisations. Another potential research partner could be the Australasian Performing Right Association-Australasian
119
Mechanical Copyright Owners Society (APRA-AMCOS). This organisation has investigated how live music making in Australia is related to a range of commercial, civic and individual benefits (APRA-AMCOS, 2014/15). Their report highlights a number of areas for future research, including the ‘benefits non-users of live music might receive from live music activity in their community, and how they value this’ (p.3). These ideas relate to the goal to ‘facilitate public domain events, and continuous improvement of the event application and approvals processes, to enable ongoing opportunities for creative and innovative activity’ (City of Sydney, 2014a, p. 41) 2) New avenues for creative participation This priority focuses on the following outcomes: ‘Activity that supports and encourages individual creative expression by ensuring opportunities are visible, accessible and sustainable’ (City of Sydney, 2014a, p.51). Two research avenues aligned with this priority area are described below:
● Creating a centralised, cultural web portal/digital platform for promoting information, facilities, equipment and events
Through the development of our cultural mapping classification framework, we identified ‘Practice, Education and Development Space’ as one of five key domains, mapping related venues across the City of Sydney. Connected to this finding, key challenges identified as part of the ‘new avenues for creative participation’ priority include: a shortfall in programs, facilities and workshop, lack of centralised information and affordable access to equipment, and limited linking between existing activities and community networks; community suggestions that include developing a web portal to communicate what is on offer, as well as linking to existing equipment-share platforms (p.49). A future project which focuses on co-designing cultural web portal/digital platform could centralise and integrate these data in visually appealing and user-friendly ways. This suggestion relates to the following goals: first, to ‘meet latent community demand for consistent, affordable, high-quality skill development and creative participation programs, especially visual arts and craft-based practice’ (City of Sydney, 2014a, p.51); and second, to ‘support access to shared workspace, tools and equipment that support creative expression and experimentation by the public’ (City of Sydney, 2014a, p.51)
● Examining how creative hub models can be sustained, scaled and support creative participation
Emerging types of sub-categories identified in the development of the Cultural Venues and Infrastructure Database were co-working spaces, makerspaces and hackerspaces. The ‘Creative HubKit’ (British Council, 2015) highlights how hubs ‘play a huge role in developing our creative economy and use their physical and/or virtual space for networking and organisational development to support individuals, organisations, businesses and projects on a short or long term basis’ (p.7). These hubs have a range
120
of models, spanning, ‘collectives, co-operatives, labs, incubators and can be static, mobile or online’ (p.5). Conducting qualitative and quantitative research with creative hub practitioners and users would enhance understanding of how these hubs connect to creative participation, as well as how they can be sustained and scaled. This idea relates to the goal to ‘ensure opportunities for creative participation are based on sustainable financial models’ (City of Sydney, 2014a, p.51) 3) Sector sustainability: surviving and thriving This priority seeks the following outcomes: ‘A city in which the business and creative opportunities for local artists, creative workers and cultural organisations are supported and expanded, leading to greater sector sustainability, productivity gains and innovation.’ (City of Sydney, 2014a, p.66). Outlined below are some research avenues which connect to this priority area:
● Exploring local and global initiatives to co-design a齰︘ordable housing and work spaces for artists
A key challenge to sector sustainability spans affordable housing and lack of work spaces, ‘including rehearsal rooms, studios and meeting rooms’ (City of Sydney, 2014a, p.58). While existing spaces in the City of Sydney have been mapped, researching local needs and ideas alongside successful international initiatives could inform future plans to create new spaces and convert existing spaces to support artists, creative workers and cultural organisations. In addition, spatial analysis of industries, in relation to locations of value chain roles, new developments, and perhaps other public information, would provide rich contextual data (real estate prices per square metre would be a relevant metric for the location of small cultural venues in particular). This avenue connects with the following goal: ‘deliver an increased number of affordable, accessible, creative workspaces throughout the city for temporary and long-term use, customised for a diversity of art-form disciplines, including relevant tools, equipment and facilities to promote a diversity of creative practice.’ (City of Sydney, 2014a, p.66)
● Identifying opportunities related to capacity building and centralising promotion of industry-speci秜ᇘc training, mentorships, networks and infrastructure
Key challenges identified for sector sustainability include, ‘access to and awareness of training, mentorships and business advice; access to business and creative networks; and access to equipment and infrastructure that can facilitate art-form practice’ (City of Sydney, 2014a, p.56). Qualitative and quantitative research would contribute to richer understandings of the existing capacity building opportunities available – alongside their spread and take-up across the City of Sydney villages. The identified gap in centralised information could be addressed via the collection and addition of this information to the proposed ‘cultural web portal/digital platform’ (see Section 1). This resource would visualise village-specific opportunities aligned with the current Cultural Venues and Infrastructure Database. Qualitative interviews with people involved in organisations representing different spatial types and value chain roles
121
could inform this research direction. In addition, more detailed data collection based on relevant industry associations, as well as specific tailored maps for those industries, could be explored. This avenue relates to the following goals: ‘support the financial sustainability of the cultural sector through support for training, mentorships, partnership opportunities and business development’; as well as to ‘Promote financing and funding models based on partnerships, and capitalise on crowdfunding and other philanthropic opportunities.’ (City of Sydney, 2014a, p.66). 4) Improving access, creating markets This priority seeks the following outcomes: ‘Higher levels of participation and engagement in Sydney’s cultural and creative life are evident across the diversity of the community.’ (City of Sydney, 2014a, p.82). Two research avenues aligning with this priority area are described below:
● Examining how technology software, infrastructure and hardware can be blended to support a齰︘ordability, travel, information and analytics
Exploring the intersection between technology software, infrastructure and hardware (such as websites, location-based apps, wi-fi hot-spots, kiosks and beacons) is another area of future research to enhance understandings of cultural spaces and activities in the digital age. This report identifies ‘Digital Space’ as a developing area of cultural infrastructure created or enhanced by new technologies. Qualitative and quantitative research would help raise awareness of existing connections between software, infrastructure and hardware, as well as identify new opportunities. For example, by digitally connecting with new audiences and consumers; supporting wayfinding between venues and villages; as well as examining the physical analytics of movements in museum and cultural spaces (Stuart, 2014). This avenue aligns with the following goal: ‘develop actionable, consumer-focused initiatives to maximise the markets for the city’s cultural offerings.’ (City of Sydney, 2014a, p.82)
● Exploring the needs and interests of diverse and non-traditional audiences Researching how access to cultural infrastructure and engagement with cultural events could be enhanced for people with a disability and young people is another avenue to explore. It would generate more nuanced insights into the needs and perspectives of particular audiences, and also into how infrastructure and events can be planned to support wider access to the arts. This idea aligns with the following goal: ‘support the city’s cultural infrastructure, services and programs to respond to diverse markets with diverse needs including people living with a disability and young people.’ (City of Sydney, 2014a, p.82)
122
5) Sharing knowledge This priority is focused on the following outcomes: ‘The creative use of existing resources, institutional structures, new technologies, and the skills and experiences of our diverse communities has expanded the community’s access to lifelong learning and knowledge sharing.’ (City of Sydney, 2014a, p.91). The interactive maps, library roadshow and public space projections proposed below correspond to the goal ‘extend and develop access to information and ideas through targeted partnerships, a refreshed focus on user needs and new ways of leveraging the city’s cultural capital’ (City of Sydney, 2014a, p.91).
● Co-designing interactive maps for community members, cultural practitioners and policymakers
A series of interactive maps, together with an online, user-friendly interactive mapping platform, could be co-designed with a range of stakeholders to visualise, search and annotate data relating to cultural venues and infrastructure in the city. The interactive mapping platform can be developed to include additional features such as a venue directory and a self-registration system, in order to enable the dissemination and sharing of venue information with the broader community and with cultural professionals. The potential power of maps for knowledge sharing and brokering is significant. For example, in an attempt to protect creative nightlife in Berlin, a ‘group has lobbied to create a map of music venues that developers must consult before breaking ground on new projects, to avoid retroactive noise complaints when new residential buildings bump up against established clubs.’ (Sisson, 2016). By engaging with wider cultural stakeholders and communities in this online platform, this crowd-sourcing initiative could:
- Improve understanding of the locations of cultural venues and infrastructure - Update venues and contact details provided voluntarily by stakeholders and
community - Assess the current quality of cultural ventures and infrastructure (e.g., by
providing user reviews on specific venues).
The co-design of interactive maps based on the current Cultural Venues and Infrastructure Database could be the first phase (or modular element) of a longer-term project co-designing a ‘cultural web portal/digital platform’ (see Sections 1) which would require substantive data collection and development resourcing.
● Planning a ‘library roadshow’ to raise community awareness of cultural spaces and activities
Libraries are key information intermediaries providing valuable technology access and social support, and are ‘opening up spaces for new community uses’ (City of Sydney, 2014a, p.88). A series of public presentations of this project’s outputs at City of Sydney libraries is a way of sharing knowledge about this its outputs to date with diverse
123
members of the community. If future projects were supported to develop interactive maps and the cultural web portal/digital platform, then these types of community event could also showcase how to visualise, search and annotate the maps. These public presentations would take place in local libraries across the ten village areas, i.e., CBD and Harbour, Chinatown and CBD South, Crown and Baptist Streets, Glebe Point Road, Green Square and City South, Harris Street, King Street, Macleay Street and Woolloomooloo, Oxford Street and Redfern Street. Additional public presentations could take place in public spaces (e.g., Martin Place Amphitheatre).
● Developing academic-artist-government initiatives to co-create public space projections
Visual projections have become increasingly common in many public urban spaces during festivals and other events (McQuire, 2014). Visualising and projecting the data from the Cultural Infrastructure Database in new and interesting ways is an exciting opportunity to connect Sydney residents, visitors and practitioners to statistics, stories and simulations of cultural spaces and activities. For example, visualising cultural data about a particular village, or questions asking ‘Did you know …?’ could raise awareness and interest in unexpected ways. Projecting such visualisations onto City of Sydney venues to showcase data in aesthetic and engaging ways could occur during regular festival events (e.g. Sydney Festival, Vivid Festival) or as part of village-specific strategies to promote wayfinding or events (e.g., ‘Pine Street Creative Art Centre is a 2-minute walk this way’; ‘Free drumming workshop this Saturday evening’). 6) Global engagement This priority seeks the following outcomes: ‘A globally connected city that responds and contributes to international cultural practice, welcomes international ideas and networks, and supports opportunities for engagement between local cultural initiatives and international visitors’ (City of Sydney, 2014a, p. 99). Two research avenues aligning with this priority area are described below:
● Identifying culturally and linguistically diverse infrastructure and initiatives so as to leverage links between local and global culturally diverse networks
Identified during the data collection process for this project were a number of venues related to multicultural and international cultural activity (eg Chinese language advertising firms). Researching the patterns of culturally diverse infrastructure, as well as the presence of multicultural activities and artists, can help raise awareness of how these existing spaces, initiatives and networks could be leveraged or supported to expand both local and global engagement. This avenue aligns with the goal to ‘develop projects and partnerships that foster international cultural connections with local results.’ (City of Sydney, 2014a, p.99)
124
● Identifying and examining ‘underground’ cultural attractions and venues Expanding the range of ‘curated walking tours of key cultural sites, including lesser-known and underground cultural attractions’ (City of Sydney, 2014a, p.100) is an action related to this priority. Data collected for the Cultural Venues and Infrastructure Database have the potential to contribute strongly to physical wayfinding strategies (City of Sydney, 2016b), as well as digitally-supported cultural wayfinding (Sydney Culture Walks, 2016). Qualitative research is required to identify and understand these alternative spaces and activities, alongside examining how existing ‘hidden city secrets’ (Hidden City Secrets, 2016) are communicated. This idea relates to the goal to ‘support growth of the local visitor economy through targeted cultural initiatives.’ (City of Sydney, 2014a, p.99)
125
10. CONCLUSION This report offers a detailed and flexible resource to inform the development of the City of Sydney’s cultural infrastructure. It is, therefore, primarily intended to function as foundational information for the continued construction and refinement of the City’s cultural policy. Section 9 above has outlined a series of recommendations drawn from the present project and suggested ways in which future cultural mapping research can consolidate and extend the substantial work conducted to date. This Conclusion also briefly engages with conceptual issues that provide further guidance for cultural infrastructure development. In the process of designing and conducting this research, the team grappled with several key issues relating to what constitutes culture, how it can be classified, and precisely what can be mapped. It was also concerned with what counts as cultural infrastructure, and, especially, the relationship between venues and other infrastructural forms. The research worked specifically with two dimensions of cultural infrastructure - the spatial and the relational. It drew from the City’s Cultural Policy and Action Plan the series of spatial types that framed the classification system and then articulated them with the elements of the value chain within a framework that helps overcome the limitations imposed by attaching a label to a fixed space. This is one useful way of dealing with the problem of dynamism and complexity that ‘snapshot’, one-dimensional mapping cannot overcome. ‘Cultural complexity’ requires a corresponding ‘cultural intelligence’ (Ang, 2011) to enable effective interventions in a field that is subject to constant change. For example, when developing the City of Sydney’s (2013a) after-dark policy OPEN Sydney: Future Directions for Sydney at Night. Strategy and Action Plan 2013-2030 , it was necessary to redress the tendency towards ‘venue centrism’ that is preoccupied with the concentration and management of licensed venues at the expense of understanding the dynamic flow of people and activities across the cityscape (Bavinton, 2011; Rowe and Bavinton, 2011). This report, similarly, has offered a more complex picture of space, use, activity and cultural relationships than is typical of many mapping exercises. In drawing on various cultural models and approaches from across the world, this Mapping Culture report has embraced the multi-faceted nature of cultural space and practice, registering the importance of taking into account new developments that will inevitably disrupt spatial classifications and infrastructural functions (for example, multiple, overlapping uses and digital cultures). It has carefully attended to representations of the cultural present at both meso and micro levels, while preparing the ground for replicating and advancing the research, and elaborating upon its classificatory schemes and methodological instruments. In pointing to several
126

promising areas for deepening and widening knowledge of the City of Sydney’s cultural infrastructure as it is broadly conceived, we have highlighted ways in which the City can make a series of innovative interventions in the cultural sphere. The City, we propose, is well positioned to achieve international recognition as a leader in urban cultural policy through a ‘culturally intelligent’ approach to infrastructural mapping.
127
11. REFERENCES
11.1 Articles and Reports Adorno, T. and Horkheimer, M. (1979/1947) Dialectic of Enlightenment , London: Verso. Ang, I. (2011) Navigating Complexity: From Cultural Critique to Cultural Intelligence, Continuum , 25 (6), 779-94. Australian Bureau of Statistics (2016) Time Series Analysis: The Basics, available from http://www.abs.gov.au/websitedbs/D3310114.nsf/home/Time+Series+Analysis:+The+Basics (accessed on 30 September 2016). Australian Bureau of Statistics (2014) Innovation in Australian Business: Summary, available from http://www.abs.gov.au/ausstats/[email protected]/mf/8158.0 (accessed on 19 September 2016). Australasian Performing Right Association Limited - Australasian Mechanical Copyright Owners Society [APRA AMCOS] (2014/2015) The economic and cultural value of live music in Australia, 2014, available from http://apraamcos.com.au/broadcast/LiveMusic-report-FINAL.pdf (accessed on 21 September 2016). Bavinton, N. (2011) ‘To Socialise with Random Strangers’: Cultures of Consumption in Night-Time Urban Space . PhD thesis, University of Western Sydney. Bertin, J. (1983) Semiology of Graphics: Diagrams, Networks, Maps . Madison: U Wisconsin Press. British Council (2015) Creative HubKit, available from http://creativeconomy.britishcouncil.org/media/uploads/files/Creative_HubKit.pdf (accessed on 22 September 2016). Canadian Urban Institute (2013) London Cultural Profile Report, Canadian Urban Institute, available from https://www.london.ca/About-London/culture/Documents/London%20Cultural%20Profile%20Presentation%20to%20CCC.pdf (accessed on 16 June 2016). City of Sydney (2006) Creative Industries Sector Report, unpublished report from the City of Sydney.
128
City of Sydney (2012a) Creative Industries Sector and Information and Communications Technology Sector Report 2012, unpublished report from the City of Sydney. City of Sydney (2012b) Local Environment Plan: Land Zoning Map - Sheet LZN_009, available from http://www.legislation.nsw.gov.au/maps/0979fc91-2cec-4c44-953e-657a9726786f/7200_COM_LZN_009_005_20150717.pdf (accessed on 7 September 2016). City of Sydney (2012c) Local Environment Plan: Land Zoning Map - Sheet LZN_010, available from http://www.legislation.nsw.gov.au/maps/bc8b232c-e6dc-4094-9f97-bb5f5d0fac59/7200_COM_LZN_010_005_20150717.pdf (accessed on 7 September 2016). City of Sydney (2012d) Local Environment Plan: Land Zoning Map-Sheet LZN_011, available from http://www.legislation.nsw.gov.au/maps/9b509e5c-86ba-4c44-89fc-7281fa594367/7200_COM_LZN_011_005_20150717.pdf (accessed on 19 September 2016). City of Sydney (2013a) OPEN Sydney: Future Directions for Sydney at Night. Strategy and Action Plan 2013-2030. Sydney: City of Sydney. City of Sydney (2013b) How to open a Pop-up Space in the City of Sydney. Sydney: CIty of Sydney, available from http://www.cityofsydney.nsw.gov.au/__data/assets/pdf_file/0017/190052/How-to-open-a-pop-up-retail-guide.pdf (accessed on 30 September 2016). City of Sydney (2014a) Creative City: Cultural Policy and Action Plan 2014-2024. Sydney: City of Sydney. City of Sydney (2014b) Live Music and Performance Action Plan. Sydney: City of Sydney. City of Sydney (2015) Residential Monitor June 2015, available from http://www.cityofsydney.nsw.gov.au/__data/assets/pdf_file/0008/246860/REPORT-Residential-Monitor-June-2015.pdf (accessed 19 on September 2016). City of Sydney (2016a) Request for Quotation no: 1916—For Mapping Cultural venues and infrastructure in the City of Sydney Local Government Area. City of Sydney (2016b) New Ideas for Old Buildings: Findings of the Creative Spaces and the Built Environment Forum. Discussion Paper March 2016. Sydney: City of Sydney.
129
City of Sydney (2016c) Wayfinding Signage, available from http://www.cityofsydney.nsw.gov.au/vision/towards-2030/transport-and-access/liveable-green-network/wayfinding-signage#page-element-dload (accessed on 23 September 2016). City of Toronto (2014) Making Space for Culture: Community Consultation Summaries, April 2014 , Toronto: City of Toronto, Cultural Services. Comunian, R. (2010) Rethinking the Creative City: The Role of Complexity, Networks and Interactions in the Urban Creative Economy, Urban Studies , September (6), 1-23, doi: 10.1177/0042098010370626. Confederation of Societies of Authors and Composers [CISAC] (2015) Cultural Times: The first global map of cultural and creative industries, The international Confederation of Societies of Authors and Composers, available from http://www.worldcreative.org/ (accessed on 28 June 2016). Cosgrove, D. (2008) Cultural Cartography: Maps and Mapping in Cultural Geography, Annales de Géographie, n° 660-661 (2): 159–78, http://doi.org/10.3917/ag.660.0159 . Couclelis, H. (2003) The Certainty of Uncertainty: GIS and the Limits of Geographic Knowledge. Transactions in GIS , 7 (2), 165-175. Crawhall, N. (2008) The Role of Participatory Cultural Mapping in Promoting Intercultural Dialogue - ‘We are not Hyenas ’. Concept Paper prepared for UNESCO, Division of Cultural Policies and Intercultural Dialogue, February 2007, available from http://portal.unesco.org/culture/en/files/37746/12197593145The_role_of_participatory_cultural_mapping_in_promoting_intercultural_dialogue.pdf/The%2Brole%2Bof%2Bparticipatory%2Bcultural%2Bmapping%2Bin%2Bpromoting%2Bintercultural%2Bdialogue.pdfom (accessed on 30 September 2016). Creative City Network of Canada [CCNC] (2008). Cultural Infrastructure: An Integral Component of Canadian Communities. Creative City News, available from https://www.creativecity.ca/database/files/library/News_5_E.pdf (accessed on 30 September 2016). Creative City Network of Canada [CCNC] (2010) Cultural Mapping Toolkit , British Columbia: Legacies Now and Creative City Network of Canada. Cultural Asset Mapping in Regional Australia [CAMRA] (2013) All Culture is Local: Good Practice in Regional Cultural Mapping & Planning from Local Government. Broadway: University of Technology. Cunningham, S. (2005) Creative Enterprises, in Hartley, S. (ed) Creative industries , Malden, MA: Blackwell Publisher, 282-298.
130
Cunningham, S. and Higgs, P. (2008) Creative Industries Mapping: Where have we come from and Where are we Going? Creative Industries Journal, 1 (1), 7-30. Davies, A. (8 April 2016) Mapping Sydney’s Creative Clusters, Sydney Morning Herald , available from http://www.smh.com.au/nsw/boho-sydney-mapping-our-creative-clusters-20160407-go1dbo.html (accessed on 6 September 2016) Department for Culture, Media and Sports [DCMS] (1998) Creative Industries Mapping Documents 1998, London: DCMS, available from: https://www.gov.uk/government/publications/creative-industries-mapping-documents-1998 (accessed on 17 June 2016). DCMS (2001) Creative Industries Mapping Document 2001, London: DCMS, available from https://www.gov.uk/government/publications/creative-industries-mapping-documents-2001 (accessed on 17 June 2016). DCMS (2004) DCMS Evidence Toolkit, London: DCMS, available from https://www.gov.uk/government/uploads/system/uploads/attachment_data/file/88403/DET_Technical_Report_August2004.pdf (accessed on 17 June 2016). DCMS (2013) CASE Programme, London: DCMS, available from https://www.gov.uk/guidance/case-programme (accessed on 18 June 2016). DCMS (2015) Creative Industry Economic Estimate, London: DCMS, available from https://www.gov.uk/government/uploads/system/uploads/attachment_data/file/499683/CIEE_Methodology.pdf (accessed on 26 June 2016) Elwood, S. (2006) Critical Issues in Participatory GIS: Deconstructions, Reconstructions, and New Research Directions, Transactions in GIS, 10 (5), 693-708. ERA et al (2003) A Map of Toronto’s Cultural Facilities: A Cultural Facilities Analysis, Prepared by ERA Architects Inc., Urban Intelligence Inc. and CUesta Systems Inc. for Rita Davies, Managing Director of Culture, Division of Economic Development, Culture and Tourism, Toronto. ESSnet-Culture (2012) European Statistical System Network on Culture (ESSnet-Culture) Final Report, available from http://ec.europa.eu/culture/library/reports/ess-net-report_en.pdf (accessed on 26 June 2016). Flew, T. (2011) The Creative Industries: Culture and Policy , Thousand Oaks, California: Sage.
131
Foresman, T. W. (ed.) (1998) The History of Geographic Information Systems: Perspectives from the Pioneers . Upper Saddle, NJ: Prentice Hall. Garnham, N. (2011) The Political Economy of Communication Revisited, in Wasko, J., Murdock, G. and Souza, H. (eds.) The Handbook of Political Economy of Communications , Malden, MA: Wiley Blackwell. Gibson, C. R. (2010) Place Making: Mapping Culture, Creating Places: Collisions of Science and Art, Local-Global: Identity, Security, Community , 7, 66-83. Goodchild, M. F. (1988) Stepping Over the Line: Technological Constraints and the New Cartography, The American Cartographer (special issue on the history of GIS), 15, 311–22. Goodchild, M. F. (2007) Citizens as Sensors: the World of Volunteered Geography, GeoJournal , 69 (4), 211-221. Harrington, A. (2004) Art and Social Theory , Cambridge: Polity Press. Hartley, J. (ed.) (2005) Creative Industries , Malden, MA: Blackwell Publisher. Hartley, J. Jason, P., Cunningham, S. Flew, T., Keane, M. and Banks, J. (2012) Key Concepts in Creative Industries , London: Sage Publications. Hesmondhalgh, D. (2013) The Cultural Industries , 3rd edition, London: Sage Publications. Hesmondhalgh, D. and Pratt, A. (2005) Cultural Industries and Cultural Policy, International Journal of Cultural Policy , 11 (1), 1-14. Hidden City Secrets (2016) Hidden Bars, available from http://www.hiddencitysecrets.com.au/bars-sydney/hidden-bars/ (accessed on 22 September 2016). Keane, M. (ed) (2016) Handbook of Cultural and Creative Industries in China, Cheltenham: Edward Elgar Publishing. MacEachren, A. M., and Kraak, M. J. (2001) Research Challenges in Geovisualization. Cartography and Geographic Information Science , 28 (1), 3-12. Martin Prosperity Institute et al (2011) From the Ground Up: Growing Toronto’s Cultural sector , Prepared for the City of Toronto by: Martin Prosperity Institute, University of Waterloo, University of Toronto at Scarborough, OCAD University, E.R.A. Architects Inc., Wavelength/Music Gallery, Mary Traill, Toronto.
132
Mateos-Garcia, J. and Bakhshi, H. (2016) The Geography of Creativity in the UK: Creative Clusters, Creative People and Creative Networks , England: NESTA. McQuire, S. (2014) Let there be Light: Behind the Trend of Illuminating Cities for Art, available from https://theconversation.com/let-there-be-light-behind-the-trend-of-illuminating-cities-for-art-26449 (accessed on 29 September 2016) Municipal Cultural Planning Incorporated [MCPI] (2010) Cultural Resource Mapping: A Guide for Municipalities, available from http://www.ontariomcp.ca/toolkits/CulturalResourceMapping_digital.pdf (accessed on 28 June 2016). National Council for Voluntary Organisations [NCVO]. Using Participatory Mapping to Explore Participation in Three Communities. Project Report for Pathways through Participation, available from http://pathwaysthroughparticipation.org.uk/resources/index.html (accessed on 30 June, 2016). O’Connor, J. (2000) The De힣�nition of Cultural Industries, The European Journal of Arts Education , 2 (3),15-27. Poole, P. (2003) Cultural Mapping and Indigenous Peoples. A Report for UNESCO, available from http://www.iapad.org/wp-content/uploads/2015/07/cultural_mapping.pdfom (accessed on 30 September 2016). Potts, J. (2007) Art & Innovation: an evolutionary economic view of the creative industries, UNESCO Observatory e-journal, available from http://education.unimelb.edu.au/__data/assets/pdf_힣�le/0017/1105721/art-innovation.pdf (accessed on 26 June 2016). pro힣�le.id (2016) Community Pro힣�le: Redfern Street Village Centre, pro힣�le.id , available from http://pro힣�le.id.com.au/sydney/about?WebID=440 (accessed on 5 September 2016). Rambaldi, G., Kwaku Kyem, P. A., Mbile, P., McCall, M., and Weiner, D. (2005) Participatory Spatial Information Management and Communication in Developing Countries. Proceedings of the Mapping for Change International Conference, Nairobi, Kenya, 7-10 September 2005. Roberts, L. (2016) Deep Mapping and Spatial Anthropology. Humanities, 5 (1), 5.
133
Rowe, D. and Bavinton, N. (2011) Tender for the Night: After-Dark Cultural Complexities in the Night-Time Economy, Continuum: Journal of Media & Cultural Studies , 25(6): 811-25 . Sisson, P. (6 September 2016) How Night Mayors are Proving the Economic and Cultural Value of Robust Nightlife, available from http://www.curbed.com/2016/9/6/12814920/club-nightlife-dance-music-night-mayor-club-commission (accessed on 23 September 2016). Springett, S. (2015) Going Deeper or Flatter: Connecting Deep Mapping, Flat Ontologies and the Democratizing of Knowledge. Humanities, 4 , 623-636. Statistics Canada (2011) Conceptual Framework for Culture Statistics 2011, available from http://www.statcan.gc.ca/pub/87-542-x/87-542-x2011001-eng.pdf (accessed on 5 June 2016). Stevenson, D., Rowe, D. and McKay, K. (2010) Convergence in British Cultural Policy: The Social, the Cultural and the Economic, The Journal of Arts Management, Law, and Society, 40 (4), 248-65. Stevenson, D., McKay, K. and Rowe, D. (2010) Tracing British Cultural Policy Domains: Contexts, Collaborations, and Constituencies, International Journal of Cultural Policy, 16 (2), 159-72. Stuart, P. (11 February 2014) Museums 2.0 – How iBeacons will Revolutionise Museum and Cultural Spaces, available from http://preloaded.com/museums-20-how-ibeacons-will-revolutionise-museum-and-cultural-spaces/ (accessed 23 on September 2016). Sui, D. (2012) Beyond Mathematics and the Deflationary Turn: Fundamental Concepts in GIScience – To Whom and for what Ends? In: Harvey, F. (ed.), Are there fundamental principles in Geographic Information Science? Seattle: CreateSpace. Sweet Reason (2011) Planning Sydney’s Cultural Facilities, Report prepared by Sweet Reason Pty Ltd, commissioned by Arts NSW, available from http://www.arts.nsw.gov.au/index.php/creative-spaces/planning-sydneys-cultural-facilities/review-of-sydneys-cultural-facilities/ (accessed on 28 June 2016). Sydney Culture Walks (2016). Sydney Culture Walks, available from http://www.sydneyculturewalksapp.com/ (accessed 23 September 2016). Sydney Fringe Festival [SFF] (2015). 2015 Sydney Fringe Festival: Findings of the Pop-Up Theatre Pilot Project, Sydney: Sydney Fringe Festival.
134
Taylor, A. (13 March 2016) Carriageworks joins Cultural Building Boom with $50 million Plan to Expand, Sydney Morning Herald , available from http://www.smh.com.au/entertainment/art-and-design/carriageworks-joins-cultural-building-boom-with-50-million-plan-to-expand-20160309-gneowa.html (accessed on 6 September 2016). The Urban Developer (22 August 2016) 88 On Regent Development to Transform Redfern, The Urban Developer , available from https://www.theurbandeveloper.com/88-on-regent-development-to-transform-redfern/ (accessed on 6 September 2016). Throsby, D. (2008) The Concentric Circles Model of the Cultural Industries, Cultural Trends , 17 (3), 147-164. United Nations Educational, Scientific and Cultural Organisation [UNESCO] (2001) UNESCO Universal declaration on Cultural Diversity , Paris: UNESCO. UNESCO (2007) Statistics on Cultural Industries: Framework for the Elaboration of the National Data Capacity Building Project , available from http://www.intracen.org/uploadedFiles/intracenorg/Content/About_ITC/Where_are_we_working/Multi-country_programmes/CARIFORUM/stat_clt_industries.pdf (accessed on 15 June 2016). UNESCO (2009) The 2009 UNESCO Framework for Cultural Statistics (FCS ), UNESCO Institute for Statistics, available from http://www.uis.unesco.org/culture/Documents/framework-cultural-statistics-culture-2009-en.pdf (accessed on 15 June 2016). UrbanGrowth NSW (2016) About the Program, available from http://www.centraltoeveleigh.com.au/ (accessed on 6 September 2016). Visentin, L. (8 August 2016) Development Decisions: City of Sydney a ‘Crucial Partner’, says Rob Stokes, Sydney Morning Herald , available from http://www.smh.com.au/nsw/development-decisions-city-of-sydney-a-crucial-partner-says-rob-stokes-20160808-gqniok.html (accessed on 6 September 2016). Vivid Festival (2016) BJÖRK DIGITAL Exhibition, available from http://www.vividsydney.com/event/general-vivid-sydney/björk-digital-exhibition (accessed on 30 September 2016). Walmsley, B. (2012) Towards a Balanced Scorecard: A Critical Analysis of the Culture and Sport Evidence (CASE) programme, Cultural Trends , 21 (4), 325-334. Williams, R. (1981) Culture . London: Fontana.
135
Wood, S., Dovey, K. and Pike, L. (2015) Urban Dimensions of Creative Clustering: Mix/Adaptation/Networks/Ambivalence , State of Australian Cities Conference 2015, available from http://soacconference.com.au/wp-content/uploads/2016/02/Wood.pdf (accessed on 7 September 2016). Wong, A., Anderson, K., Ang, I. and McNeill, D. (2016) Sydney’s Chinatown in the Asian Century: From Ethnic Enclave to Global Hub, Parramatta: Western Sydney University Institute for Culture and Society, available from http://uws.edu.au/__data/assets/pdf_file/0009/1086885/sydneys_chinatown_in_the_asian_century_research_report.pdf (accessed on 27 September 2016). Wright, D. (2012) Theory and Application in a post-GISystems World. International Journal of Geographical Information Science, 26 (12), 2197-2209. 11.2 Websites City of Melbourne Map http://maps.melbourne.vic.gov.au/
City of Sydney http://www.cityofsydney.nsw.gov.au/
Cultural Map Malta https://www.culturemapmalta.com/
Cultural Map of Dumfries and Galloway http://info.dumgal.gov.uk/culturalmap/Map
DCMS
https://www.gov.uk/government/organisations/department-for-culture-media-sport
Dublin Dashboard http://www.dublindashboard.ie/pages/index
Live Music Map livemusicoffice.com.au/livemusicmap/
London Tech City Map http://www.techcitymap.com/index.html#/
PAM Project Map http://holyoke.creativecommunityweb.org/cultural-map/
Seattle Cultural Space Inventory Map https://data.seattle.gov/
St Thomas Cultural Map http://www.stthomasculture.ca/
UNESCO http://www.uis.unesco.org/
Vancouver Cultural Map http://www.statcan.gc.ca/
136
12. THE PROJECT TEAM Lead consultant Distinguished Professor Ien Ang Professor Ang is one of the leaders in cultural studies worldwide, with interdisciplinary work spanning many areas of the humanities and social sciences. She has collaborated extensively with partner organisations including the NSW Premier’s Department, the Art Gallery of New South Wales, the Special Broadcasting Service, the Australia Council and the City of Sydney. She also recently chaired an Expert Working Group on Asia Literacy: Language and Beyond, for the Australian Council of Learned Academies' Securing Australia's Future program. Her latest publication is a report with Dr Philip Mar entitled Promoting diversity of cultural expression in arts in Australia for the Australia Council for the Arts, Sydney.
Lead consultant Professor David Rowe Professor Rowe has published extensively on the transformations in contemporary cultural life, especially in the key areas of cultural citizenship, sport, media, urban leisure, artistic practice and the politics of the public sphere. The impact of his research, which ranges across civic, national and global contexts, registers in policy development, media communication, public debate and advancement of internationally-oriented, interdisciplinary knowledge. His sustained high-level academic performance is evidenced by his being a Chief Investigator on three current ARC projects, Fellowship of both the Australian Academy of the Humanities and Academy of the Social Sciences in Australia, and his 2015 Western Sydney University Excellence Award as Researcher of the Year. Professor Rowe has been a research consultant to several government departments, local councils, professional organisations and community groups. Technical advisor Dr Liam Magee Dr Magee researches and publishes in the areas of urban development and digital technology, examining innovative ways software, databases, maps and networks can improve our cities. He has worked in the US, South Africa, Cambodia, Australia and India on urban and technology projects with World Vision, Accenture, Microsoft, FujiXerox and the City of Melbourne. Prior to his PhD, Dr. Magee worked as a software developer, manager and consultant in a number of start-ups and small businesses.
137
Project manager and research analyst Dr Alexandra Wong Dr Wong is experienced in project management, as is evidenced in her successful completion of two large-scale Australian Research Council funded projects between 2010 to 2015. She has used different qualitative and quantitative methods in her research, including interviews, participant observations, focus groups, survey questionnaires, and analysis of statistical data such as Australian Bureau of Statistics’ census data and the City of Sydney’s Floorspace and Employment Survey data. Her research interests include innovation clusters, cultural economy, urban theories, housing and multiculturalism.
Research analyst Dr Teresa Swist Dr Swist has been a research consultant for the Department of Communications and the Arts, as well as for the Commissioner for Children and Young People. She is currently an investigator on a multi- sectoral mapping project ‘Mapping Kolorob: Improving access to services in low income areas in Dhaka, Bangladesh using mobile technology’. Her thesis explored conceptions of creativity from professional, academic and student perspectives – and she has published in the areas of digital place-making, curation and creativity. Her research interests span participatory design and the intersections between community, technology, innovation, mapping and social change.
GIS specialist Mr Denis Rouillard During Mr Rouillard’s four years spent in creating customised spatial representations of environmental research data in South Africa and his 18 months as a GIS contractor in the UK utilities industry, he gained experience in the use of various GIS programs, including ArcGIS, IDRISI, ENVI and Smallworld. Mr Denis Rouillard is currently the GIS and Data Visualisation Specialist based at the University’s Urban Research Program. In this position he has been applying his knowledge of GIS towards delivering effective solutions in urban planning and human geography. Designer and project assistant Mr Andrea Pollio During Mr Pollio’s Bachelor and Masters studies, he completed a course in urban and parametric design which featured an introduction to GIS and other mapping tools. Between 2012 and 2013 Andrea collaborated with the European Union project Peripheria, working in a team to design an interactive participatory service for a
138

neighbourhood of Milan. On the design side, he has been involved in a startup as UX/UI designer and has good knowledge of digital prototyping and testing for usability. He has good expertise with CAD and basic knowledge of GIS, familiarity with interface testing tools – as well as Photoshop, InDesign and Illustrator software skills to apply to the final layout and other needs.
139
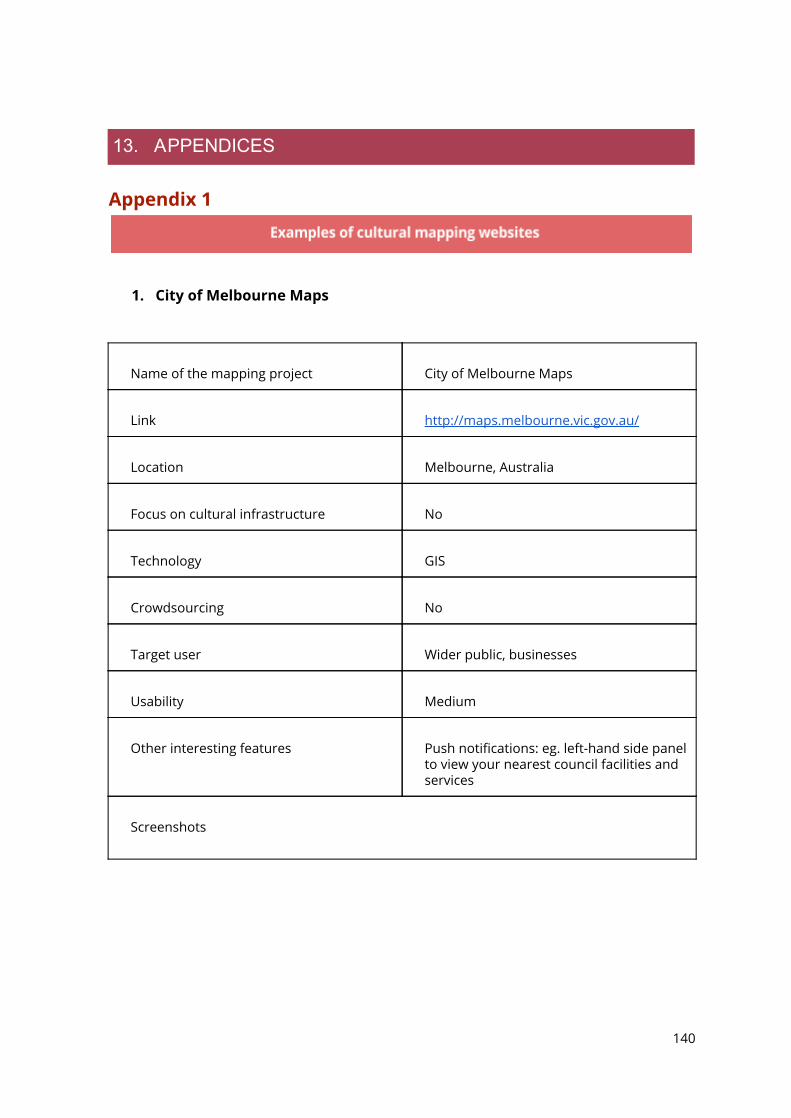
O 13. APPENDICES
Appendix 1
1. City of Melbourne Maps
Name of the mapping project
City of Melbourne Maps
Link
http://maps.melbourne.vic.gov.au/
Location
Melbourne, Australia
Focus on cultural infrastructure
No
Technology
GIS
Crowdsourcing
No
Target user
Wider public, businesses
Usability
Medium
Other interesting features
Push notifications: eg. left-hand side panel to view your nearest council facilities and services
Screenshots
140
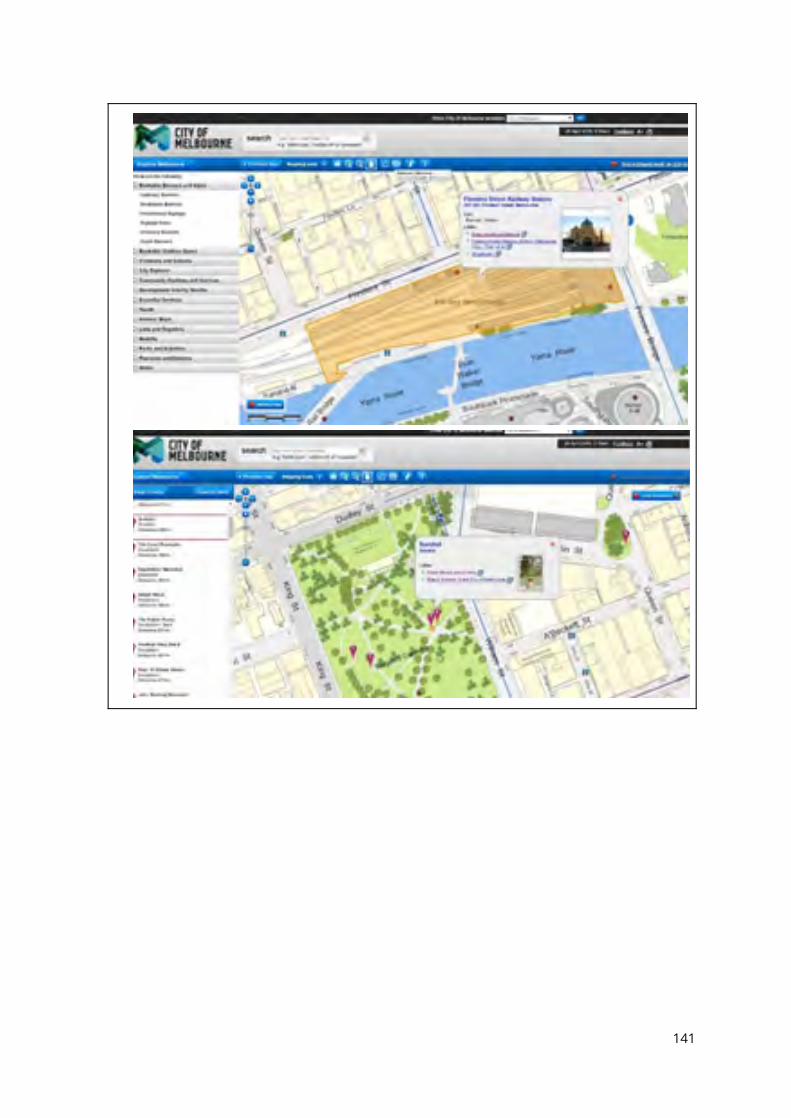
141
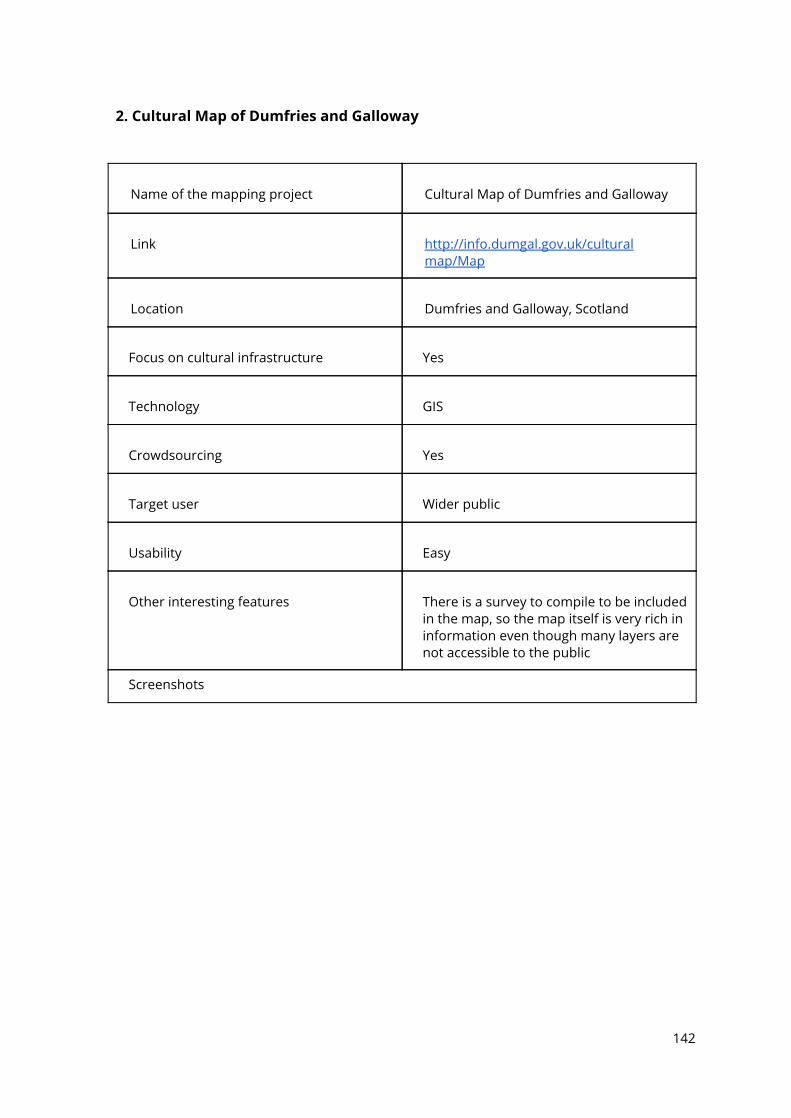
2. Cultural Map of Dumfries and Galloway
Name of the mapping project
Cultural Map of Dumfries and Galloway
Link
http://info.dumgal.gov.uk/cultural map/Map
Location
Dumfries and Galloway, Scotland
Focus on cultural infrastructure
Yes
Technology
GIS
Crowdsourcing
Yes
Target user
Wider public
Usability
Easy
Other interesting features
There is a survey to compile to be included in the map, so the map itself is very rich in information even though many layers are not accessible to the public
Screenshots
142
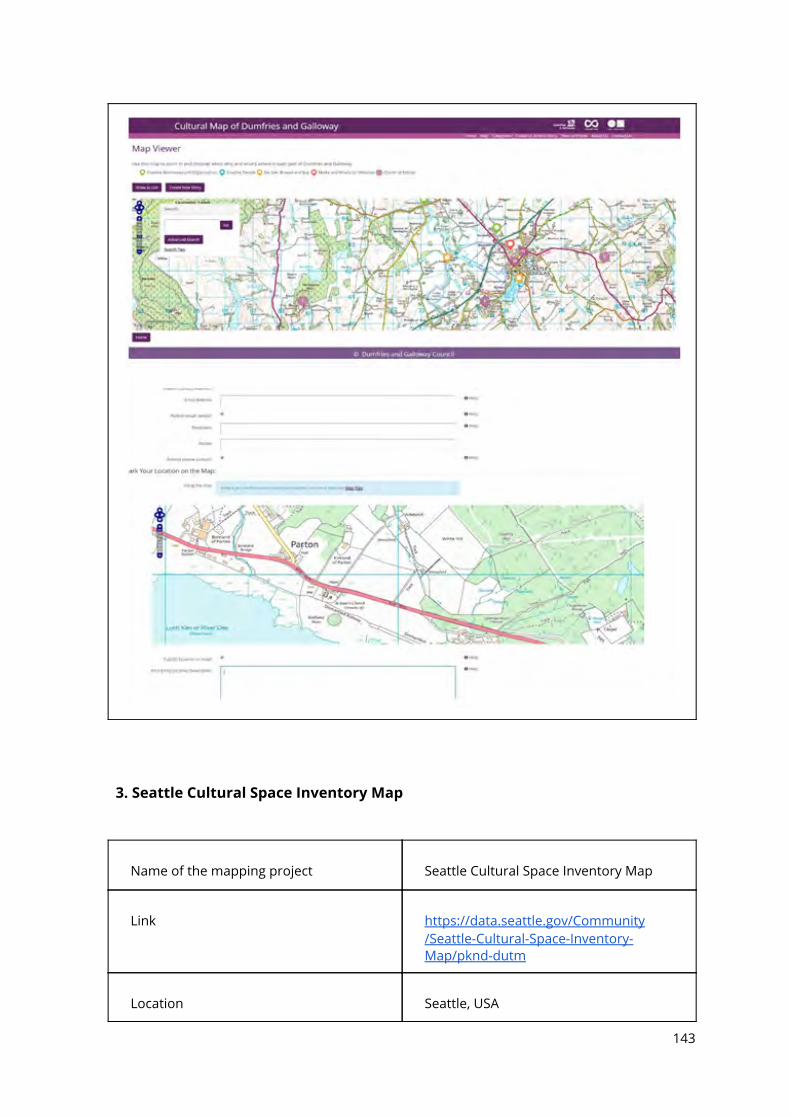
3. Seattle Cultural Space Inventory Map
Name of the mapping project
Seattle Cultural Space Inventory Map
Link
https://data.seattle.gov/Community /Seattle-Cultural-Space-Inventory- Map/pknd-dutm
Location
Seattle, USA
143
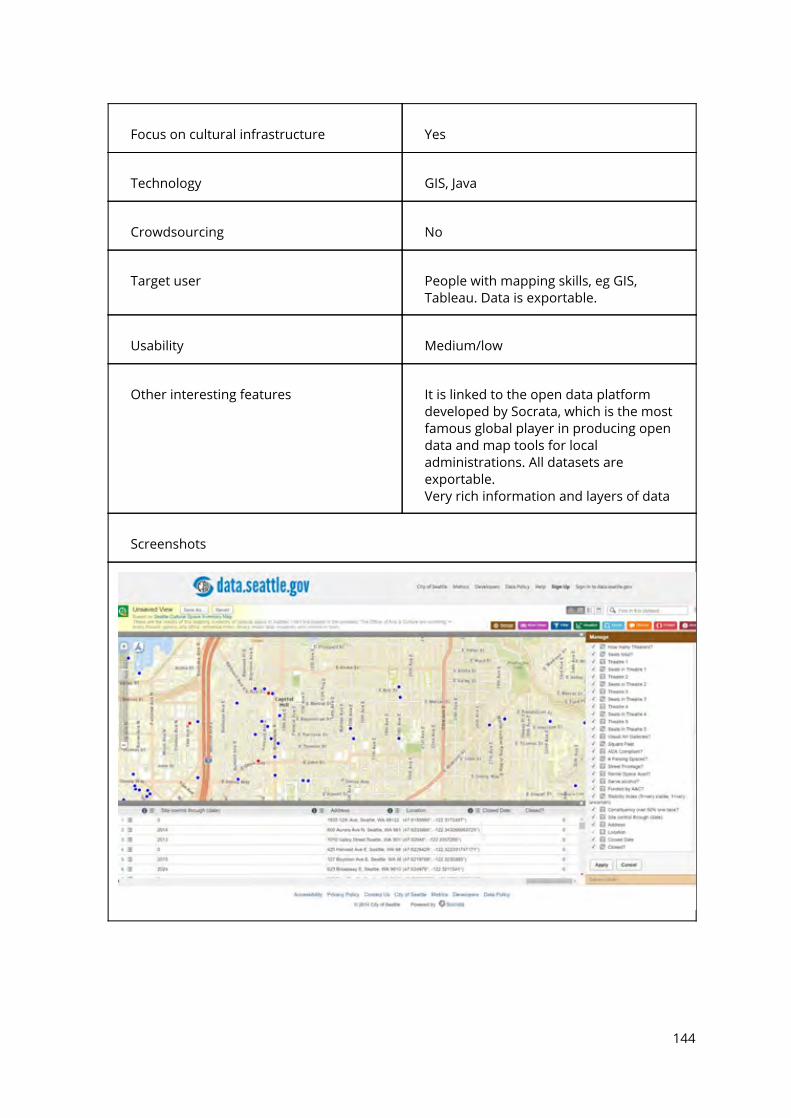
Focus on cultural infrastructure
Yes
Technology
GIS, Java
Crowdsourcing
No
Target user
People with mapping skills, eg GIS, Tableau. Data is exportable.
Usability
Medium/low
Other interesting features
It is linked to the open data platform developed by Socrata, which is the most famous global player in producing open data and map tools for local administrations. All datasets are exportable. Very rich information and layers of data
Screenshots
144
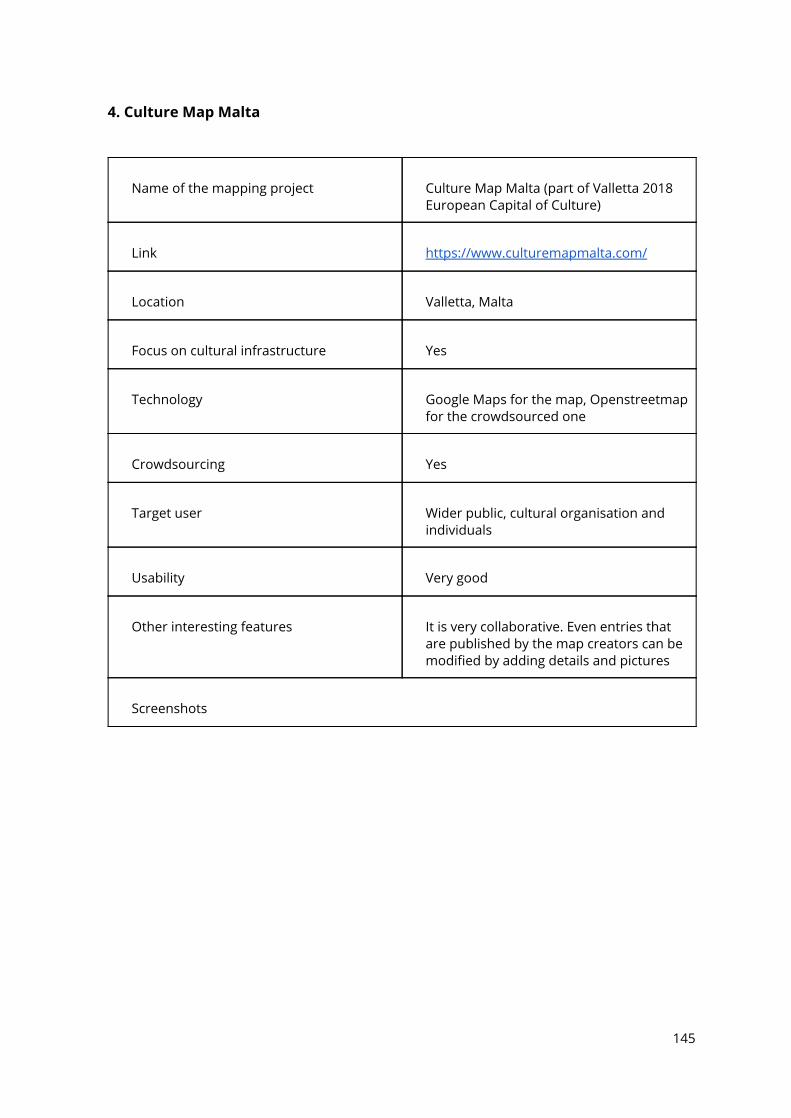
4. Culture Map Malta
Name of the mapping project
Culture Map Malta (part of Valletta 2018 European Capital of Culture)
Link
https://www.culturemapmalta.com/
Location
Valletta, Malta
Focus on cultural infrastructure
Yes
Technology
Google Maps for the map, Openstreetmap for the crowdsourced one
Crowdsourcing
Yes
Target user
Wider public, cultural organisation and individuals
Usability
Very good
Other interesting features
It is very collaborative. Even entries that are published by the map creators can be modified by adding details and pictures
Screenshots
145
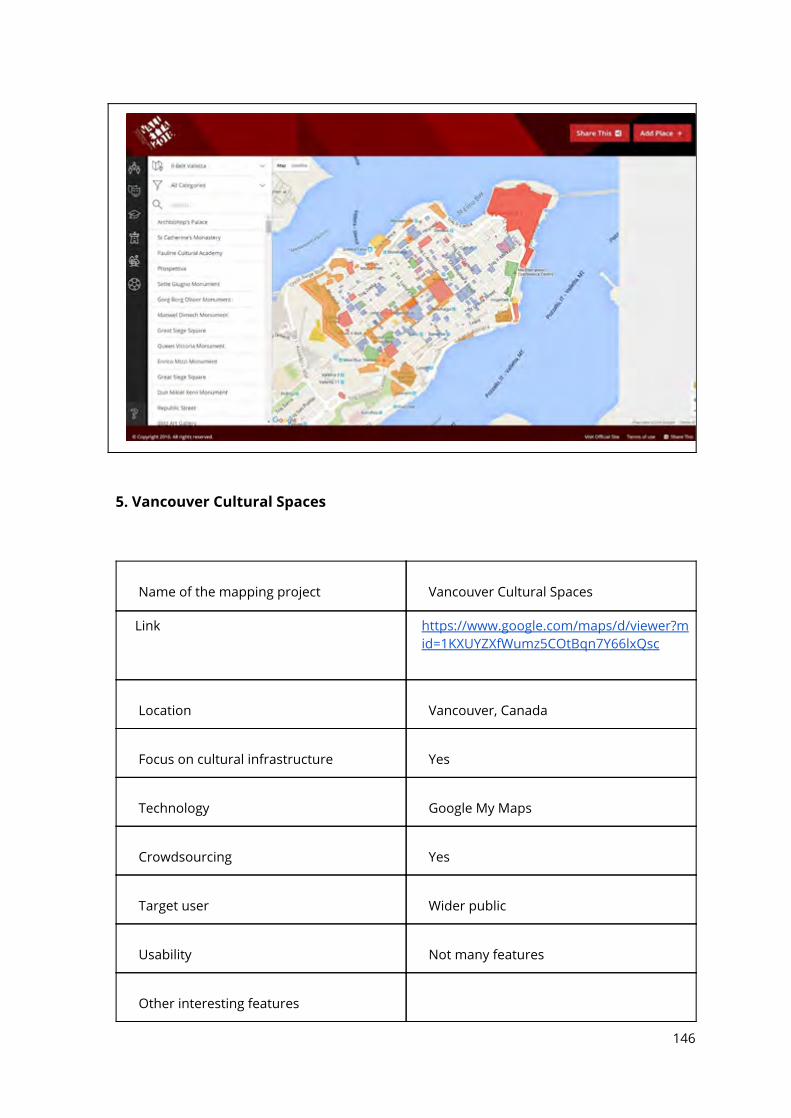
5. Vancouver Cultural Spaces
Name of the mapping project
Vancouver Cultural Spaces
Link https://www.google.com/maps/d/viewer?mid=1KXUYZXfWumz5COtBqn7Y66lxQsc
Location
Vancouver, Canada
Focus on cultural infrastructure
Yes
Technology
Google My Maps
Crowdsourcing
Yes
Target user
Wider public
Usability
Not many features
Other interesting features
146
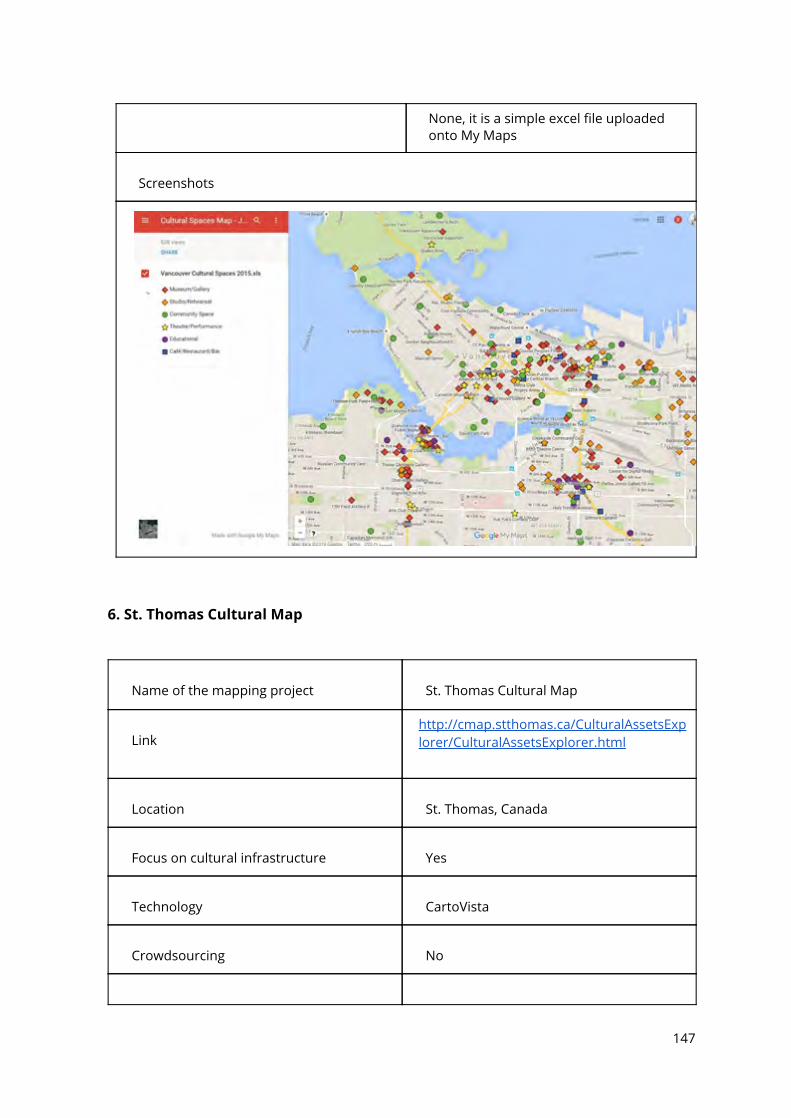
None, it is a simple excel file uploaded onto My Maps
Screenshots
6. St. Thomas Cultural Map
Name of the mapping project
St. Thomas Cultural Map
Link
http://cmap.stthomas.ca/CulturalAssetsExplorer/CulturalAssetsExplorer.html
Location
St. Thomas, Canada
Focus on cultural infrastructure
Yes
Technology
CartoVista
Crowdsourcing
No
147
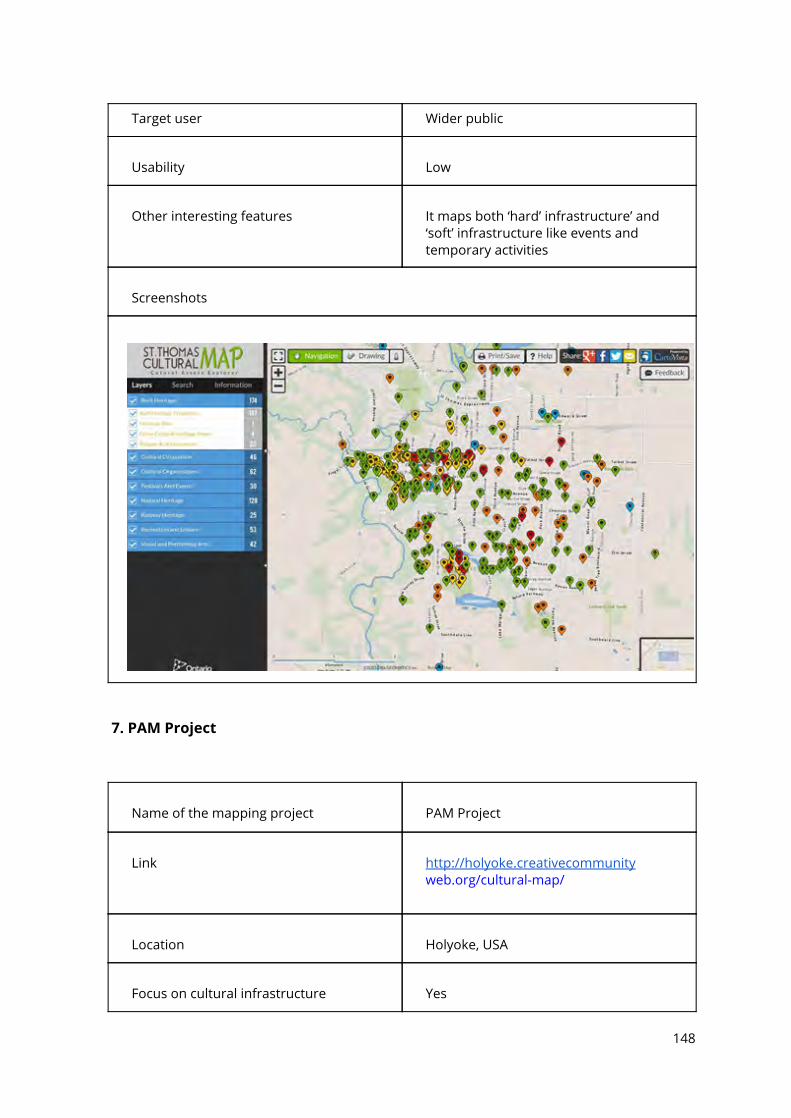
Target user Wider public
Usability
Low
Other interesting features
It maps both ‘hard’ infrastructure’ and ‘soft’ infrastructure like events and temporary activities
Screenshots
7. PAM Project
Name of the mapping project
PAM Project
Link
http://holyoke.creativecommunity web.org/cultural-map/
Location
Holyoke, USA
Focus on cultural infrastructure
Yes
148
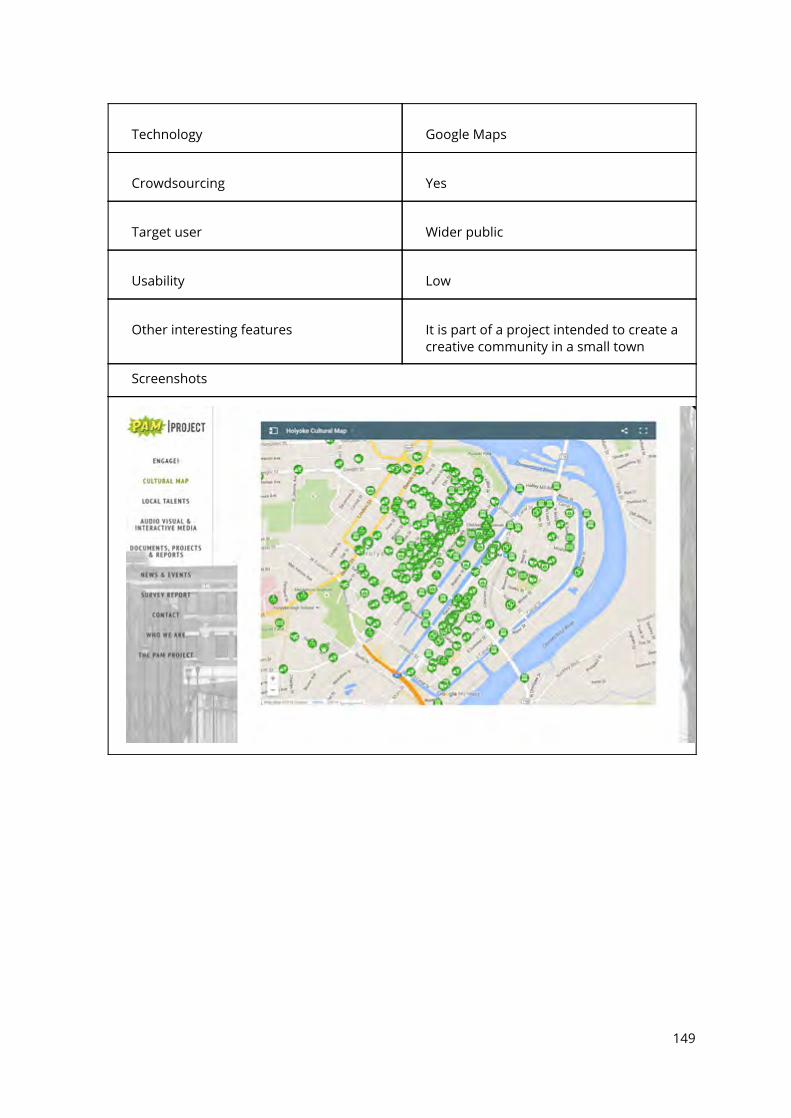
Technology
Google Maps
Crowdsourcing
Yes
Target user
Wider public
Usability
Low
Other interesting features
It is part of a project intended to create a creative community in a small town
Screenshots
149
8. Dublin Dashboard
Name of the mapping project
Dublin Dashboard
Link
http://www.dublindashboard.ie/pag es/index
Location
Dublin, Ireland
Focus on cultural infrastructure
No
Technology
GIS (ESRI)
Crowdsourcing
No
Target user
Wider Public, academia
Usability
Various maps
Other interesting features
It is part of the probably best known urban dashboard in the world, developed by Maynooth University under the guidance of Bob Kitchin
Screenshots
150
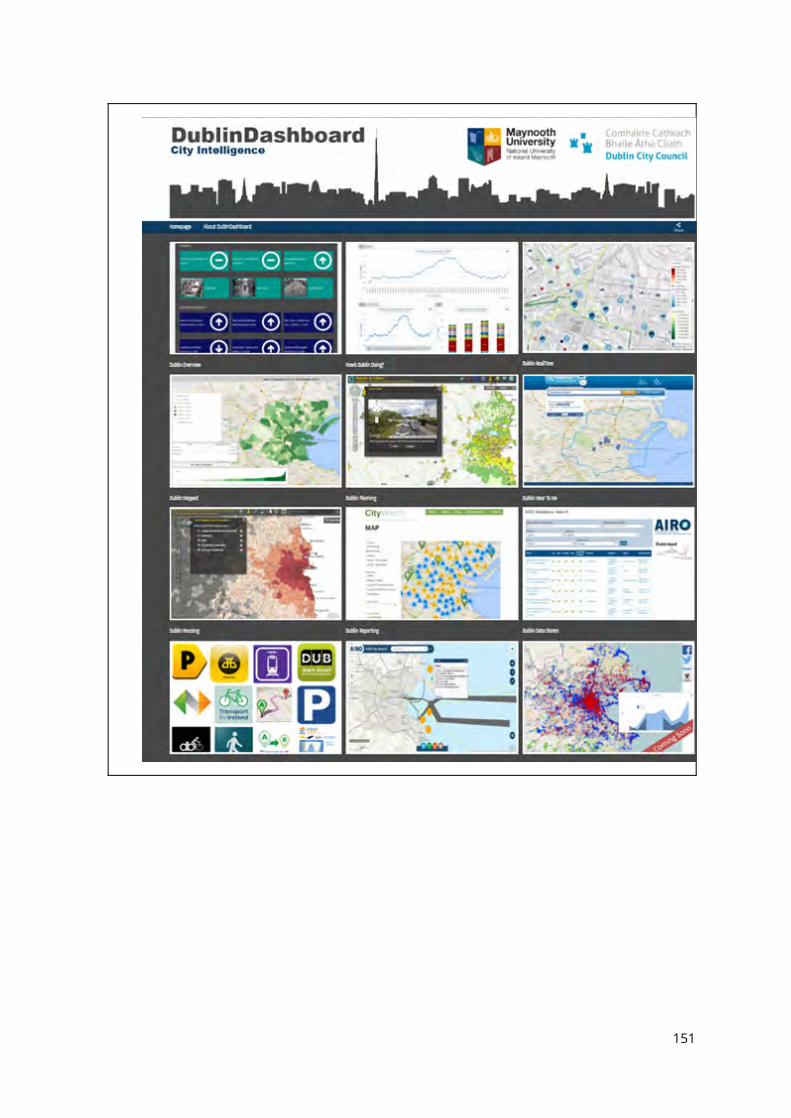
151
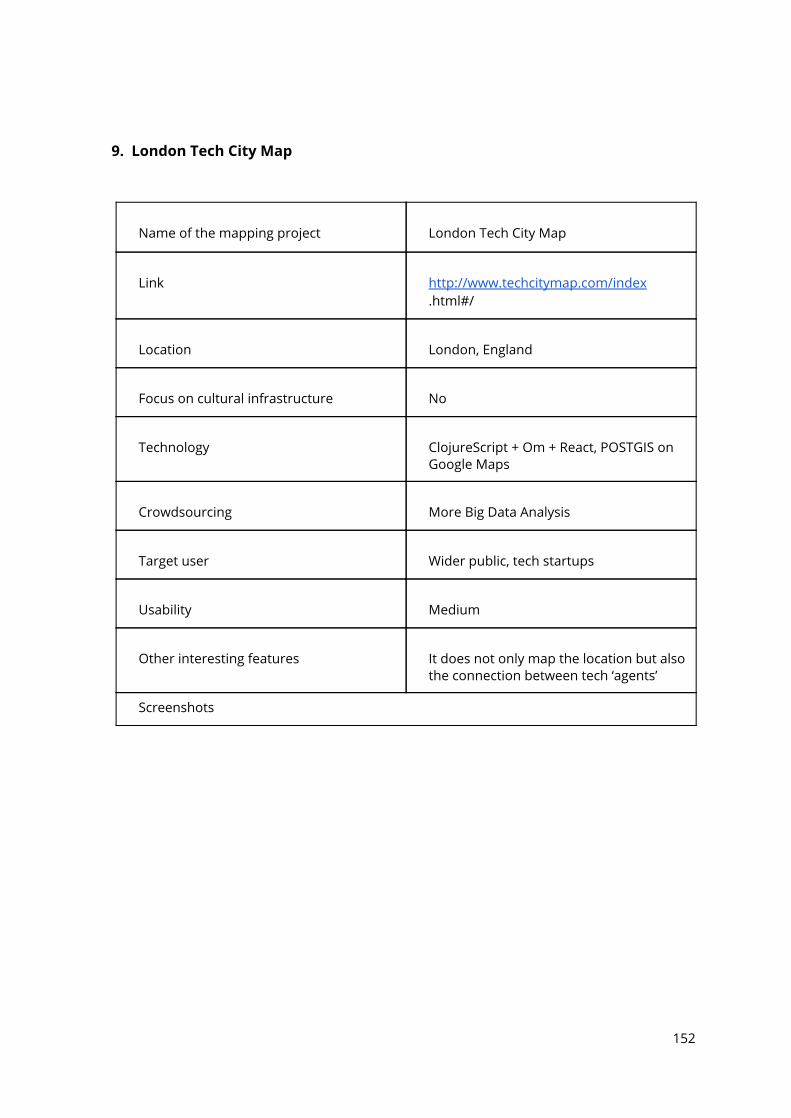
9. London Tech City Map
Name of the mapping project
London Tech City Map
Link
http://www.techcitymap.com/index .html#/
Location
London, England
Focus on cultural infrastructure
No
Technology
ClojureScript + Om + React, POSTGIS on Google Maps
Crowdsourcing
More Big Data Analysis
Target user
Wider public, tech startups
Usability
Medium
Other interesting features
It does not only map the location but also the connection between tech ‘agents’
Screenshots
152
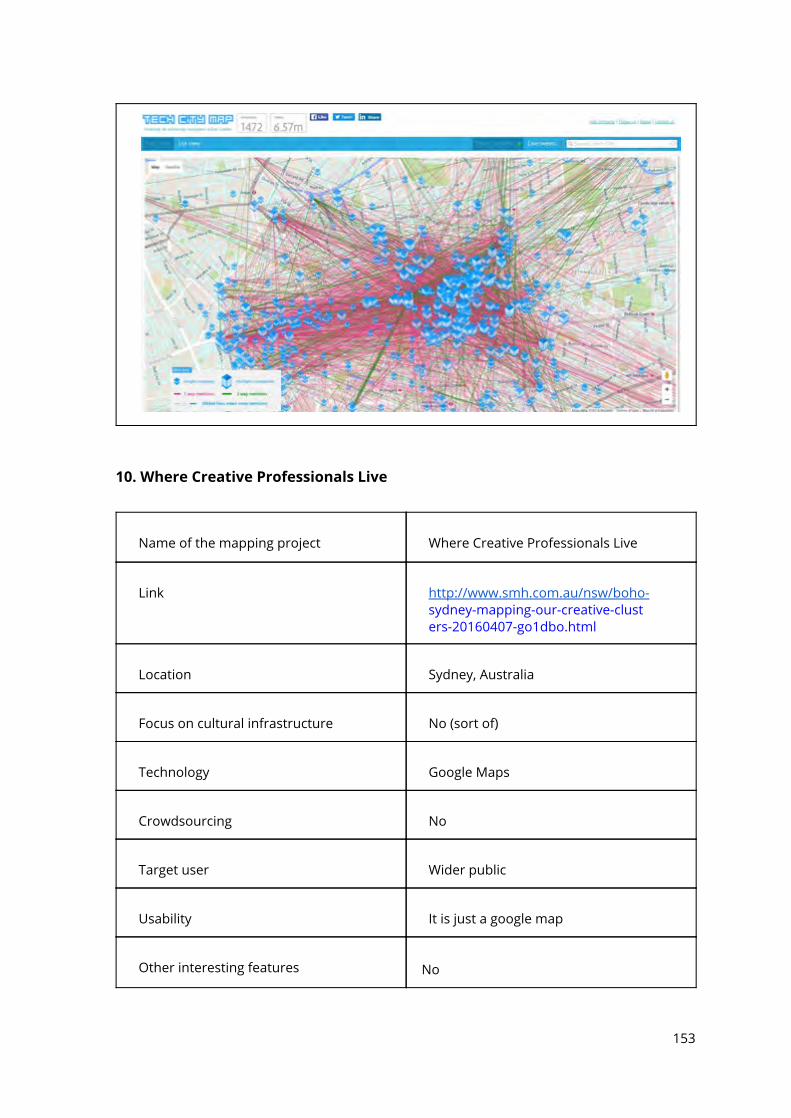
10. Where Creative Professionals Live
Name of the mapping project
Where Creative Professionals Live
Link
http://www.smh.com.au/nsw/boho- sydney-mapping-our-creative-clust ers-20160407-go1dbo.html
Location
Sydney, Australia
Focus on cultural infrastructure
No (sort of)
Technology
Google Maps
Crowdsourcing
No
Target user
Wider public
Usability
It is just a google map
Other interesting features
No
153
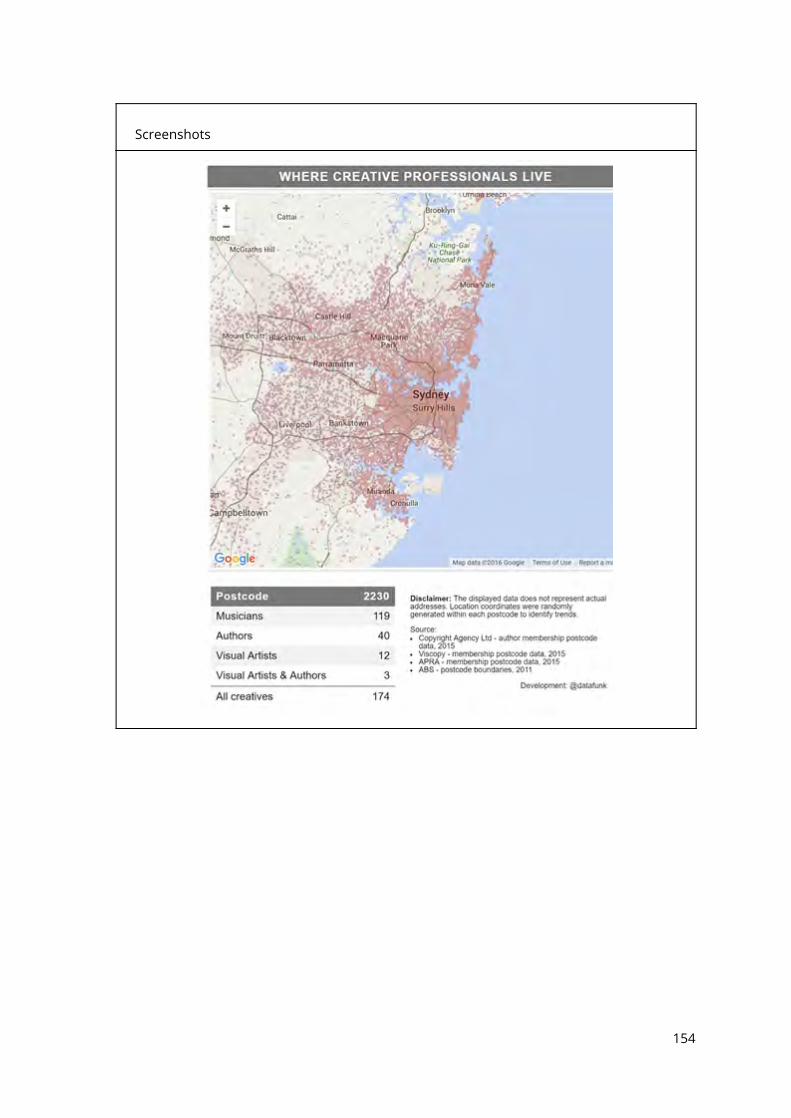
Screenshots
154
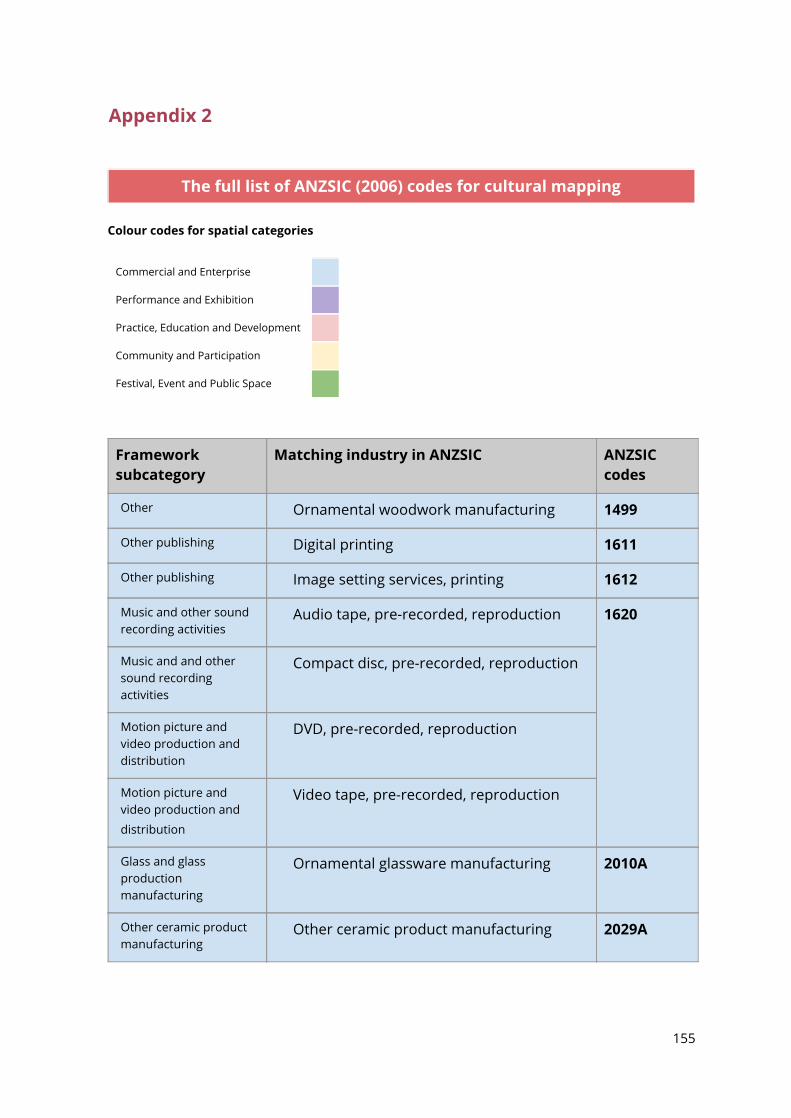
Appendix 2
The full list of ANZSIC (2006) codes for cultural mapping Colour codes for spatial categories
Commercial and Enterprise
Performance and Exhibition
Practice, Education and Development
Community and Participation
Festival, Event and Public Space
Framework subcategory
Matching industry in ANZSIC ANZSIC codes
Other Ornamental woodwork manufacturing 1499
Other publishing Digital printing 1611
Other publishing Image setting services, printing 1612
Music and other sound recording activities
Audio tape, pre-recorded, reproduction 1620
Music and and other sound recording activities
Compact disc, pre-recorded, reproduction
Motion picture and video production and distribution
DVD, pre-recorded, reproduction
Motion picture and video production and
distribution
Video tape, pre-recorded, reproduction
Glass and glass production manufacturing
Ornamental glassware manufacturing 2010A
Other ceramic product manufacturing
Other ceramic product manufacturing 2029A
155
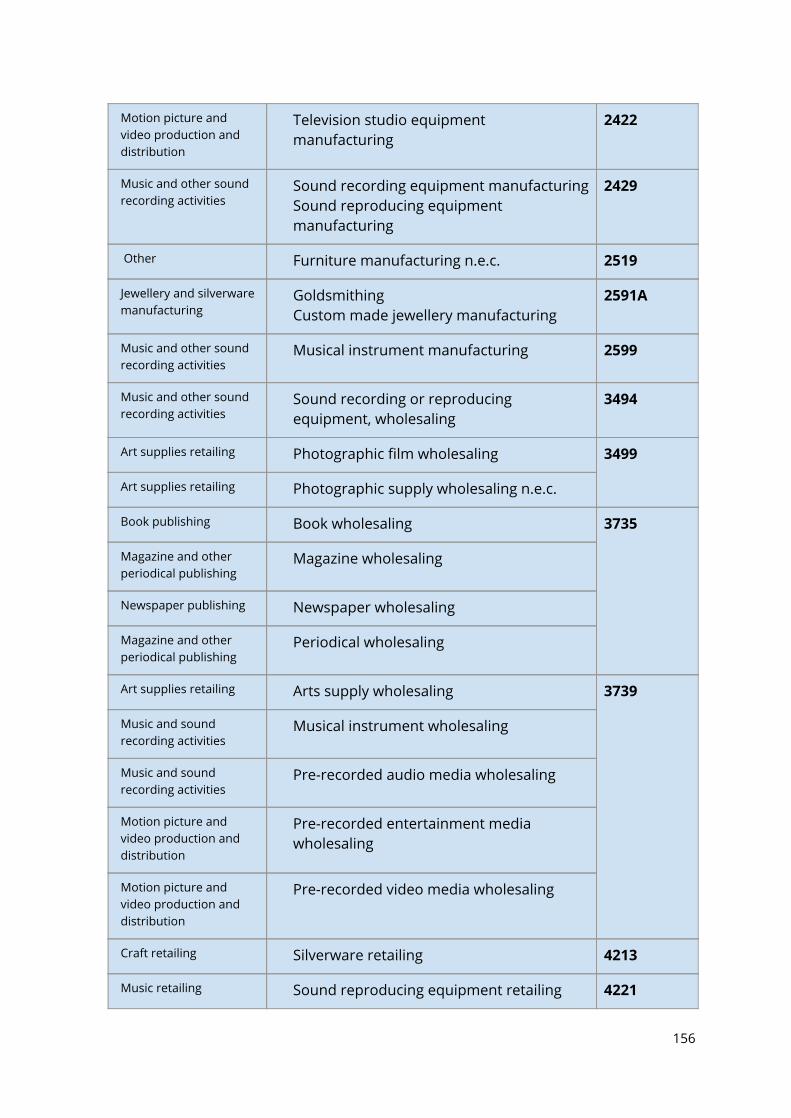
Motion picture and video production and distribution
Television studio equipment manufacturing
2422
Music and other sound recording activities
Sound recording equipment manufacturing Sound reproducing equipment manufacturing
2429
Other Furniture manufacturing n.e.c. 2519
Jewellery and silverware manufacturing
Goldsmithing Custom made jewellery manufacturing
2591A
Music and other sound recording activities
Musical instrument manufacturing 2599
Music and other sound recording activities
Sound recording or reproducing equipment, wholesaling
3494
Art supplies retailing Photographic film wholesaling 3499
Art supplies retailing Photographic supply wholesaling n.e.c.
Book publishing Book wholesaling 3735
Magazine and other periodical publishing
Magazine wholesaling
Newspaper publishing Newspaper wholesaling
Magazine and other periodical publishing
Periodical wholesaling
Art supplies retailing Arts supply wholesaling 3739
Music and sound recording activities
Musical instrument wholesaling
Music and sound recording activities
Pre-recorded audio media wholesaling
Motion picture and video production and distribution
Pre-recorded entertainment media wholesaling
Motion picture and video production and distribution
Pre-recorded video media wholesaling
Craft retailing Silverware retailing 4213
Music retailing Sound reproducing equipment retailing 4221
156
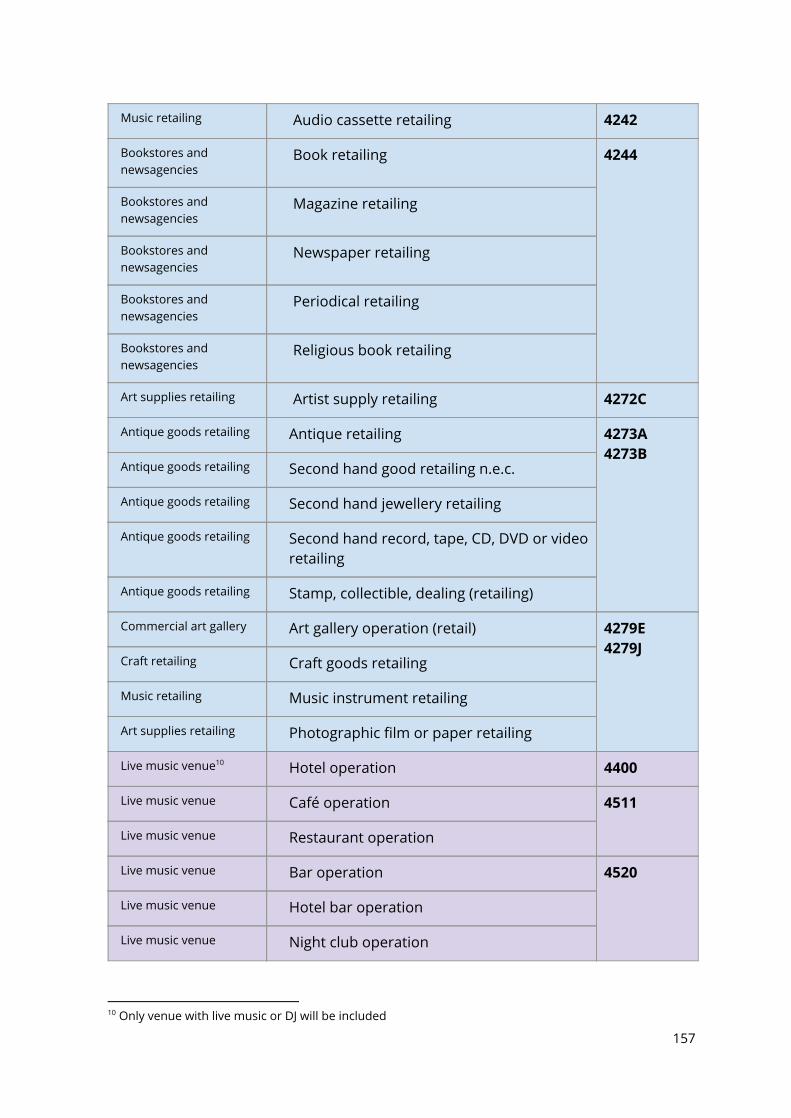
Music retailing Audio cassette retailing 4242
Bookstores and newsagencies
Book retailing 4244
Bookstores and newsagencies
Magazine retailing
Bookstores and newsagencies
Newspaper retailing
Bookstores and newsagencies
Periodical retailing
Bookstores and newsagencies
Religious book retailing
Art supplies retailing Artist supply retailing 4272C
Antique goods retailing Antique retailing 4273A 4273B
Antique goods retailing Second hand good retailing n.e.c.
Antique goods retailing Second hand jewellery retailing
Antique goods retailing Second hand record, tape, CD, DVD or video retailing
Antique goods retailing Stamp, collectible, dealing (retailing)
Commercial art gallery Art gallery operation (retail) 4279E 4279J
Craft retailing Craft goods retailing
Music retailing Music instrument retailing
Art supplies retailing Photographic film or paper retailing
Live music venue 10 Hotel operation 4400
Live music venue Café operation 4511
Live music venue Restaurant operation
Live music venue Bar operation 4520
Live music venue Hotel bar operation
Live music venue Night club operation
10 Only venue with live music or DJ will be included
157
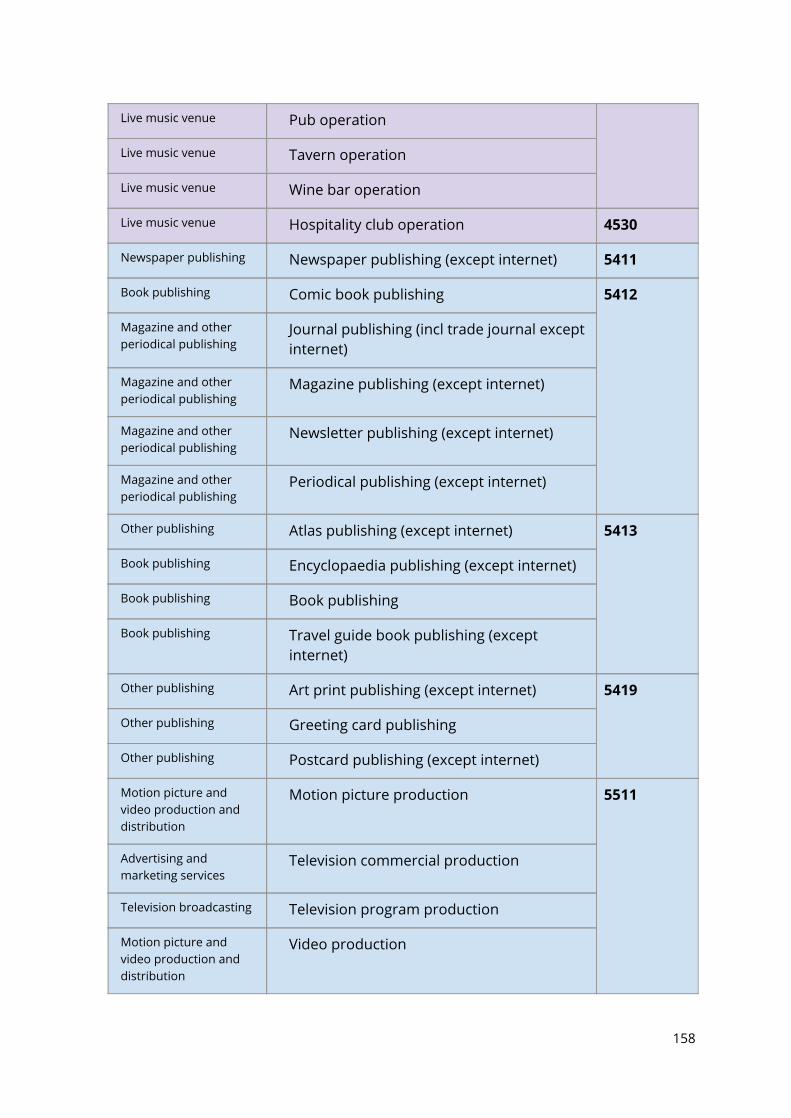
Live music venue Pub operation
Live music venue Tavern operation
Live music venue Wine bar operation
Live music venue Hospitality club operation 4530
Newspaper publishing Newspaper publishing (except internet) 5411
Book publishing Comic book publishing 5412
Magazine and other periodical publishing
Journal publishing (incl trade journal except internet)
Magazine and other periodical publishing
Magazine publishing (except internet)
Magazine and other periodical publishing
Newsletter publishing (except internet)
Magazine and other periodical publishing
Periodical publishing (except internet)
Other publishing Atlas publishing (except internet) 5413
Book publishing Encyclopaedia publishing (except internet)
Book publishing Book publishing
Book publishing Travel guide book publishing (except internet)
Other publishing Art print publishing (except internet) 5419
Other publishing Greeting card publishing
Other publishing Postcard publishing (except internet)
Motion picture and video production and distribution
Motion picture production 5511
Advertising and marketing services
Television commercial production
Television broadcasting Television program production
Motion picture and video production and distribution
Video production
158
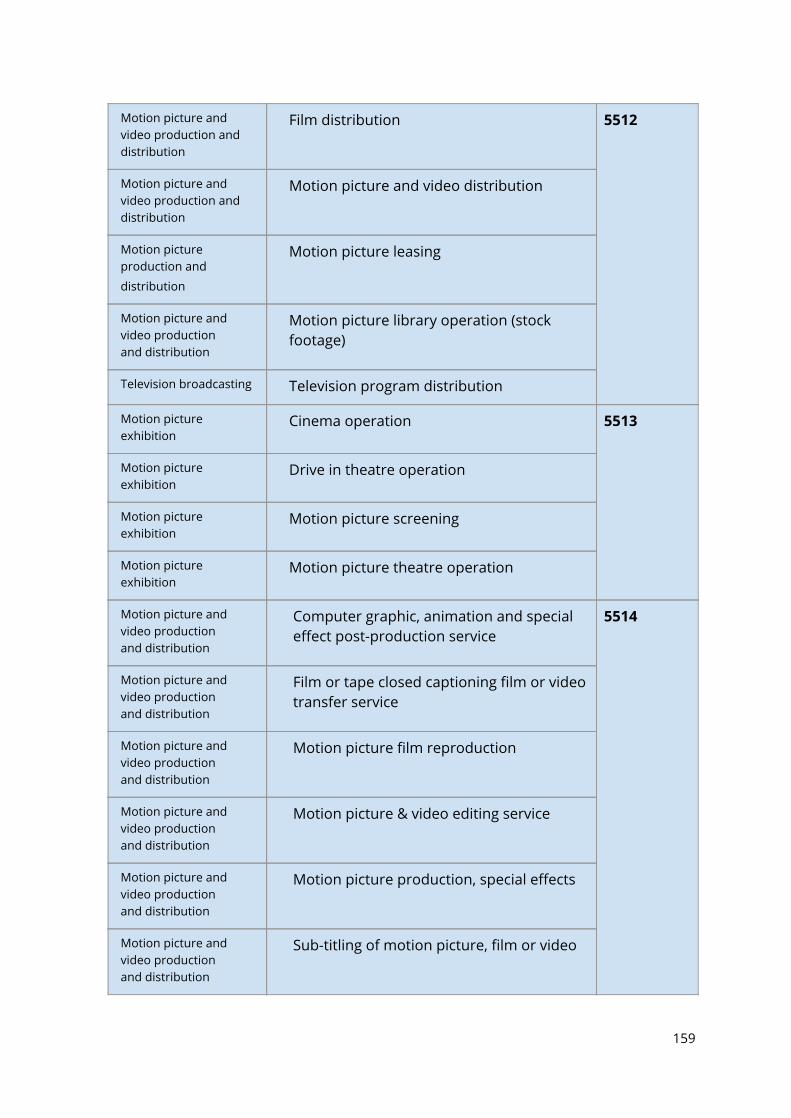
Motion picture and video production and distribution
Film distribution 5512
Motion picture and video production and distribution
Motion picture and video distribution
Motion picture production and
distribution
Motion picture leasing
Motion picture and video production and distribution
Motion picture library operation (stock footage)
Television broadcasting Television program distribution
Motion picture exhibition
Cinema operation 5513
Motion picture exhibition
Drive in theatre operation
Motion picture exhibition
Motion picture screening
Motion picture exhibition
Motion picture theatre operation
Motion picture and video production and distribution
Computer graphic, animation and special effect post-production service
5514
Motion picture and video production and distribution
Film or tape closed captioning film or video transfer service
Motion picture and video production and distribution
Motion picture film reproduction
Motion picture and video production and distribution
Motion picture & video editing service
Motion picture and video production and distribution
Motion picture production, special effects
Motion picture and video production and distribution
Sub-titling of motion picture, film or video
159
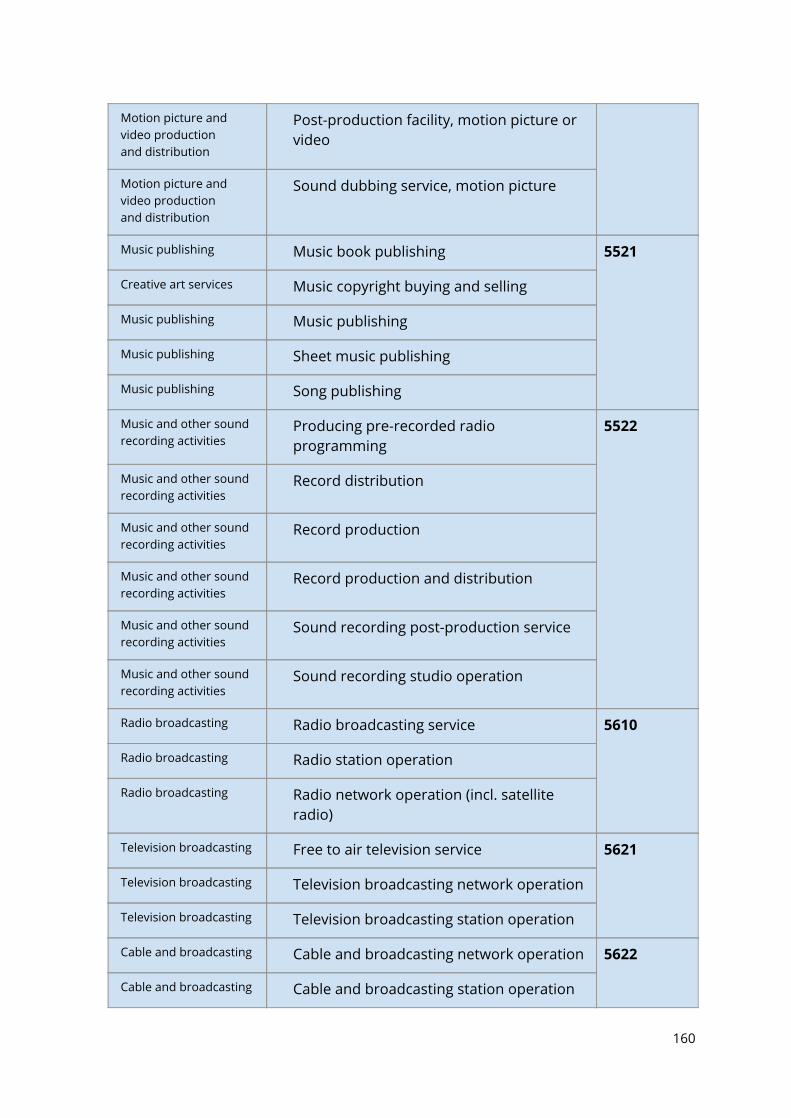
Motion picture and video production and distribution
Post-production facility, motion picture or video
Motion picture and video production and distribution
Sound dubbing service, motion picture
Music publishing Music book publishing 5521
Creative art services Music copyright buying and selling
Music publishing Music publishing
Music publishing Sheet music publishing
Music publishing Song publishing
Music and other sound recording activities
Producing pre-recorded radio programming
5522
Music and other sound recording activities
Record distribution
Music and other sound recording activities
Record production
Music and other sound recording activities
Record production and distribution
Music and other sound recording activities
Sound recording post-production service
Music and other sound recording activities
Sound recording studio operation
Radio broadcasting Radio broadcasting service 5610
Radio broadcasting Radio station operation
Radio broadcasting Radio network operation (incl. satellite radio)
Television broadcasting Free to air television service 5621
Television broadcasting Television broadcasting network operation
Television broadcasting Television broadcasting station operation
Cable and broadcasting Cable and broadcasting network operation 5622
Cable and broadcasting Cable and broadcasting station operation
160
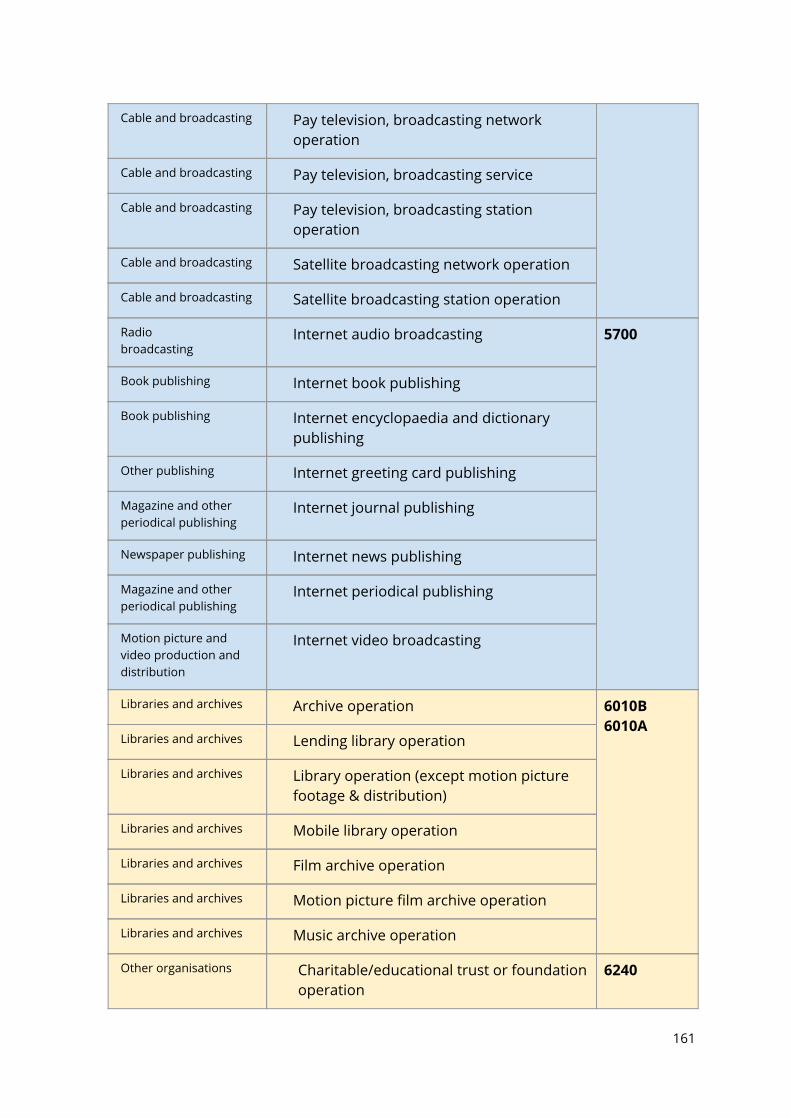
Cable and broadcasting Pay television, broadcasting network operation
Cable and broadcasting Pay television, broadcasting service
Cable and broadcasting Pay television, broadcasting station operation
Cable and broadcasting Satellite broadcasting network operation
Cable and broadcasting Satellite broadcasting station operation
Radio broadcasting
Internet audio broadcasting 5700
Book publishing Internet book publishing
Book publishing Internet encyclopaedia and dictionary publishing
Other publishing Internet greeting card publishing
Magazine and other periodical publishing
Internet journal publishing
Newspaper publishing Internet news publishing
Magazine and other periodical publishing
Internet periodical publishing
Motion picture and video production and distribution
Internet video broadcasting
Libraries and archives Archive operation 6010B 6010A
Libraries and archives Lending library operation
Libraries and archives Library operation (except motion picture footage & distribution)
Libraries and archives Mobile library operation
Libraries and archives Film archive operation
Libraries and archives Motion picture film archive operation
Libraries and archives Music archive operation
Other organisations Charitable/educational trust or foundation operation
6240
161
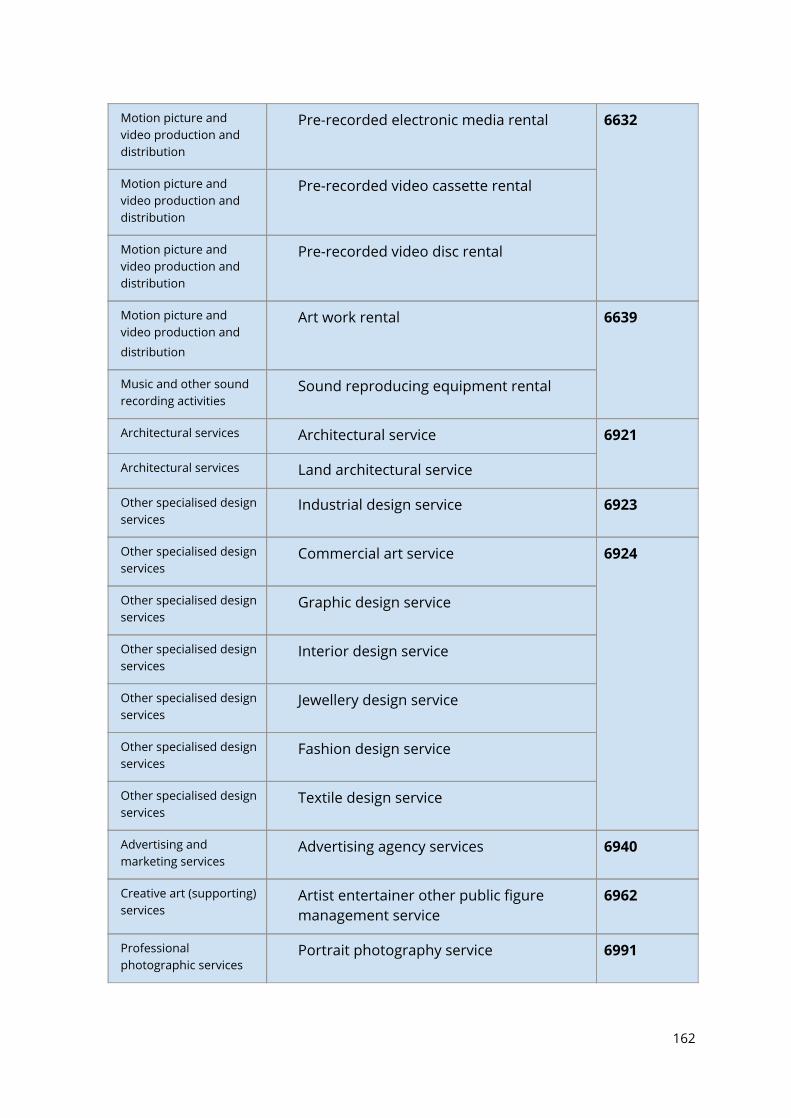
Motion picture and video production and distribution
Pre-recorded electronic media rental 6632
Motion picture and video production and distribution
Pre-recorded video cassette rental
Motion picture and video production and distribution
Pre-recorded video disc rental
Motion picture and video production and
distribution
Art work rental 6639
Music and other sound recording activities
Sound reproducing equipment rental
Architectural services Architectural service 6921
Architectural services Land architectural service
Other specialised design services
Industrial design service 6923
Other specialised design services
Commercial art service 6924
Other specialised design services
Graphic design service
Other specialised design services
Interior design service
Other specialised design services
Jewellery design service
Other specialised design services
Fashion design service
Other specialised design services
Textile design service
Advertising and marketing services
Advertising agency services 6940
Creative art (supporting) services
Artist entertainer other public figure management service
6962
Professional photographic services
Portrait photography service 6991
162
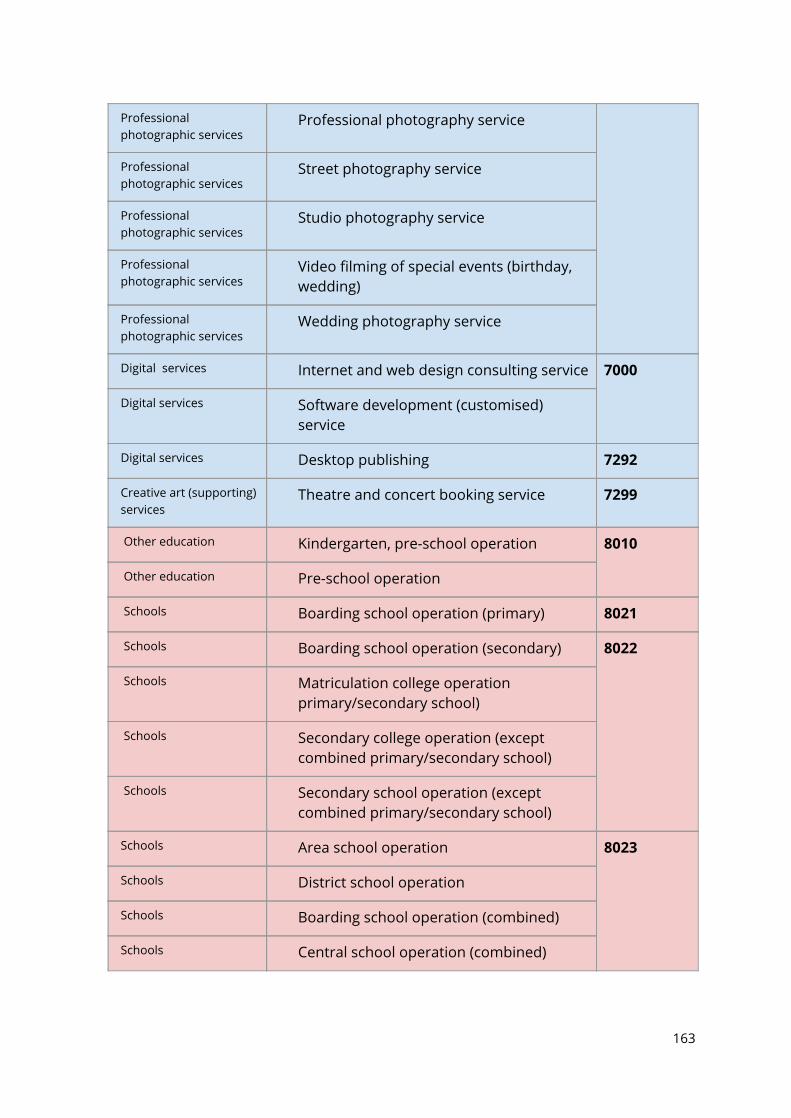
Professional photographic services
Professional photography service
Professional photographic services
Street photography service
Professional photographic services
Studio photography service
Professional photographic services
Video filming of special events (birthday, wedding)
Professional photographic services
Wedding photography service
Digital services Internet and web design consulting service 7000
Digital services Software development (customised) service
Digital services Desktop publishing 7292
Creative art (supporting) services
Theatre and concert booking service 7299
Other education Kindergarten, pre-school operation 8010
Other education Pre-school operation
Schools Boarding school operation (primary) 8021
Schools Boarding school operation (secondary) 8022
Schools Matriculation college operation primary/secondary school)
Schools Secondary college operation (except combined primary/secondary school)
Schools Secondary school operation (except combined primary/secondary school)
Schools Area school operation 8023
Schools District school operation
Schools Boarding school operation (combined)
Schools Central school operation (combined)
163
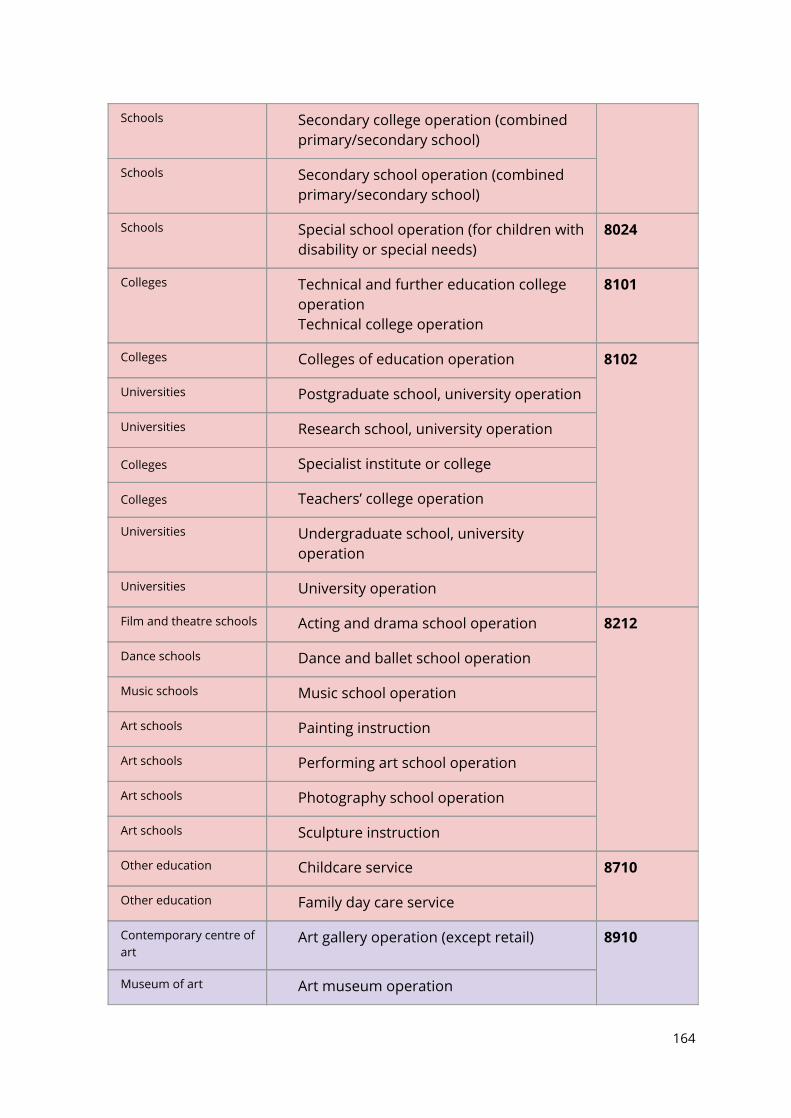
Schools Secondary college operation (combined primary/secondary school)
Schools Secondary school operation (combined primary/secondary school)
Schools Special school operation (for children with disability or special needs)
8024
Colleges Technical and further education college operation Technical college operation
8101
Colleges Colleges of education operation 8102
Universities Postgraduate school, university operation
Universities Research school, university operation
Colleges Specialist institute or college
Colleges Teachers’ college operation
Universities Undergraduate school, university operation
Universities University operation
Film and theatre schools Acting and drama school operation 8212
Dance schools Dance and ballet school operation
Music schools Music school operation
Art schools Painting instruction
Art schools Performing art school operation
Art schools Photography school operation
Art schools Sculpture instruction
Other education Childcare service 8710
Other education Family day care service
Contemporary centre of art
Art gallery operation (except retail) 8910
Museum of art Art museum operation
164
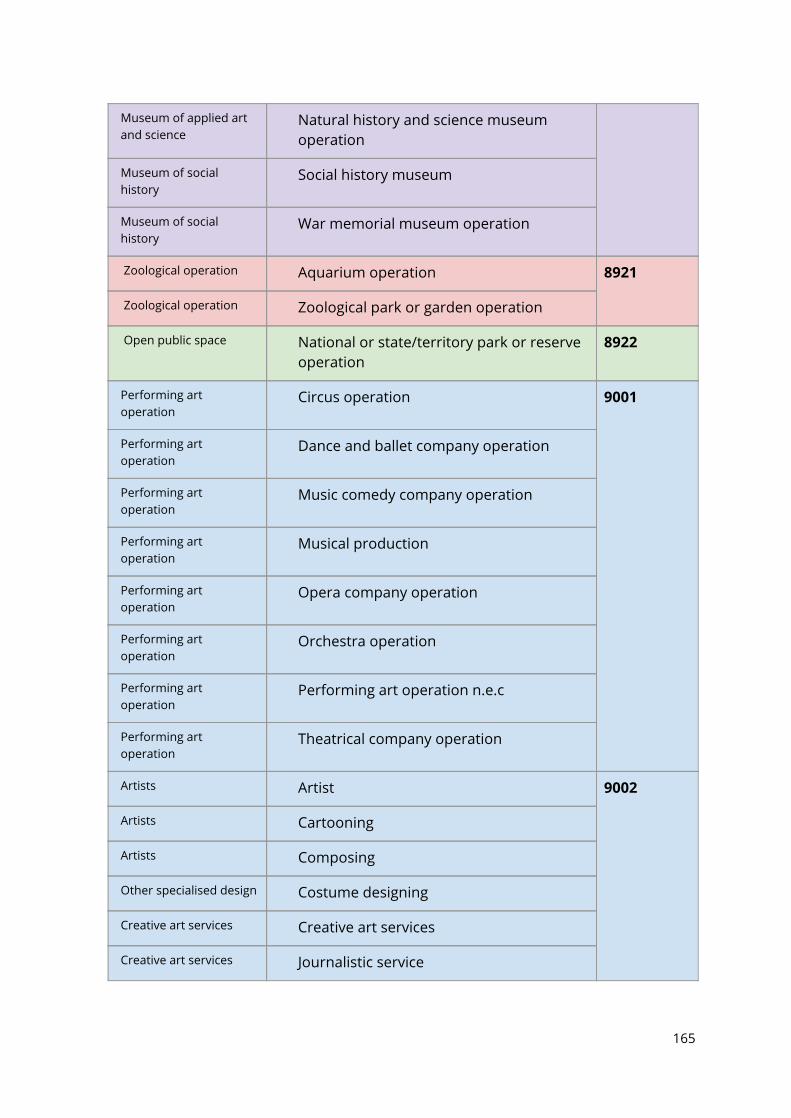
Museum of applied art and science
Natural history and science museum operation
Museum of social history
Social history museum
Museum of social history
War memorial museum operation
Zoological operation Aquarium operation 8921
Zoological operation Zoological park or garden operation
Open public space National or state/territory park or reserve operation
8922
Performing art operation
Circus operation 9001
Performing art operation
Dance and ballet company operation
Performing art operation
Music comedy company operation
Performing art operation
Musical production
Performing art operation
Opera company operation
Performing art operation
Orchestra operation
Performing art operation
Performing art operation n.e.c
Performing art operation
Theatrical company operation
Artists Artist 9002
Artists Cartooning
Artists Composing
Other specialised design Costume designing
Creative art services Creative art services
Creative art services Journalistic service
165
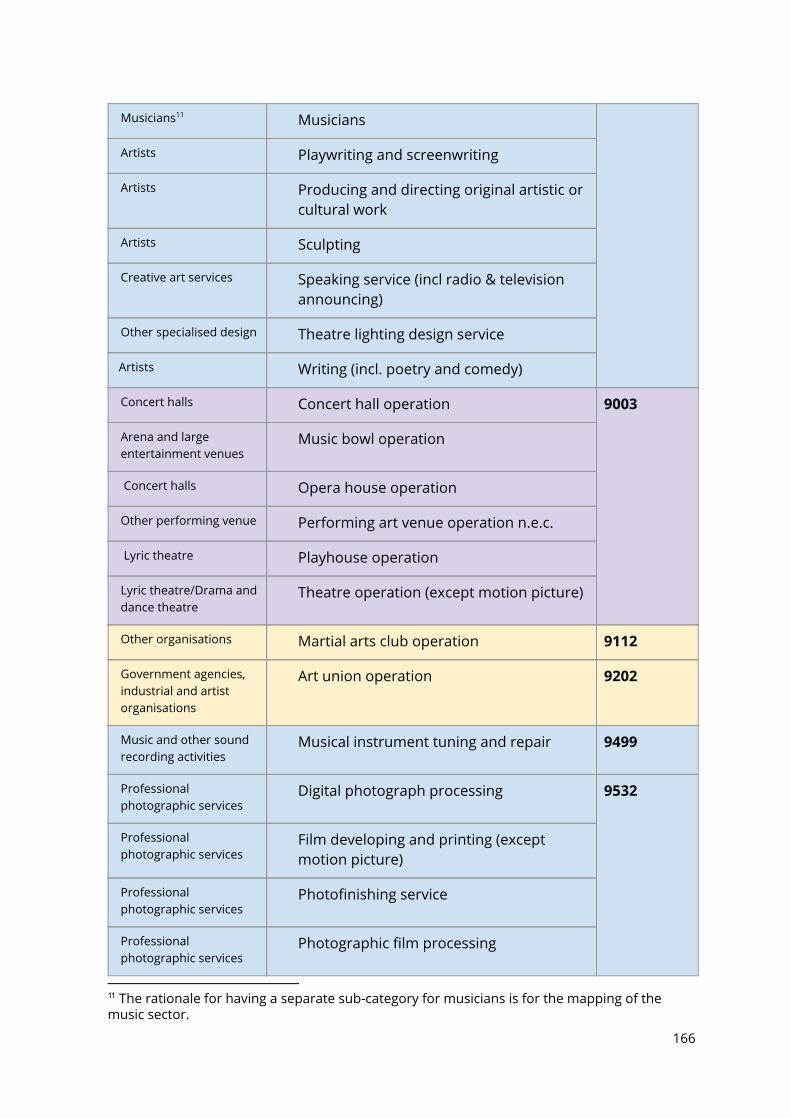
Musicians 11 Musicians
Artists Playwriting and screenwriting
Artists Producing and directing original artistic or cultural work
Artists Sculpting
Creative art services Speaking service (incl radio & television announcing)
Other specialised design Theatre lighting design service
Artists Writing (incl. poetry and comedy)
Concert halls Concert hall operation 9003
Arena and large entertainment venues
Music bowl operation
Concert halls Opera house operation
Other performing venue Performing art venue operation n.e.c.
Lyric theatre Playhouse operation
Lyric theatre/Drama and dance theatre
Theatre operation (except motion picture)
Other organisations Martial arts club operation 9112
Government agencies, industrial and artist organisations
Art union operation 9202
Music and other sound recording activities
Musical instrument tuning and repair 9499
Professional photographic services
Digital photograph processing 9532
Professional photographic services
Film developing and printing (except motion picture)
Professional photographic services
Photofinishing service
Professional photographic services
Photographic film processing
11 The rationale for having a separate sub-category for musicians is for the mapping of the music sector.
166
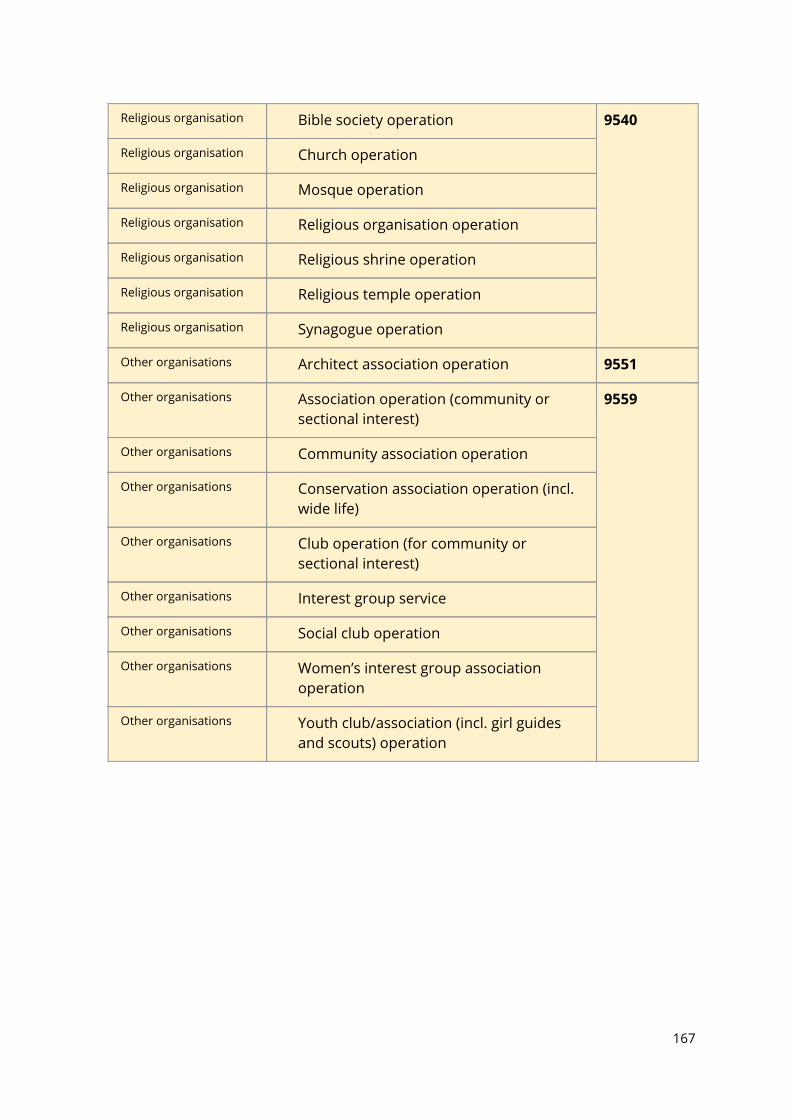
Religious organisation Bible society operation 9540
Religious organisation Church operation
Religious organisation Mosque operation
Religious organisation Religious organisation operation
Religious organisation Religious shrine operation
Religious organisation Religious temple operation
Religious organisation Synagogue operation
Other organisations Architect association operation 9551
Other organisations Association operation (community or sectional interest)
9559
Other organisations Community association operation
Other organisations Conservation association operation (incl. wide life)
Other organisations Club operation (for community or sectional interest)
Other organisations Interest group service
Other organisations Social club operation
Other organisations Women’s interest group association operation
Other organisations Youth club/association (incl. girl guides and scouts) operation
167
Appendix 3
The crowdsourcing survey questionnaire
AFF
Mapping of Cultural Venues and
Infrastructure in the City of Sydney
Introduction
Western Sydney University is conducting a short survey about the formal and informal cultural activities that take place in the City of Sydney. Its aim is to map the locations of cultural activities of various kinds in public spaces, specific venues, or in temporary locations.
The findings of this survey will lead to the creation of a series of digital maps of cultural venues and infrastructure in the City of Sydney. It can be used as an information source for arts/creative communities and businesses and inform policy decisions concerning both cultural infrastructure and urban planning.
The survey should take approximately 5 minutes to complete. Please note that your participation is voluntary and you can withdraw at any time. It is anonymous and your personal details will not be shared with others or revealed in the publication of findings.
If you have any questions about this research, you may contact Dr Teresa Swist, Research Fellow, Western Sydney University on 96859772 or at [email protected]
168
Consent
Do you agree to participate in this study? *
❏ Yes, I agree (continue to next section)
❏ No (select next to submit form)
Your Details
What is the name of your organisation? (Give us your name if individual artist) *
_______________________________________________________________________________________
Please provide the postcode where you or your organisation are based. * _______________________________________________________________________________________
What is the primary cultural activity of your organisation or project? *
❏ Creative businesses (e.g. architecture, design, commercial photography)
❏ Creative media (e.g. film, television, radio, newspaper)
❏ Performing arts (e.g. opera, theatre, music, dance, circus)
169
❏ Visual art or heritage (e.g. painting, sculpture, gallery, museum)
❏ Applied arts and crafts (e.g. ceramic, knitting, jewellery)
❏ Literary arts (e.g. poetry, fiction, literature)
❏ Community (e.g. market, family/kids’ events, Taichi in the park)
❏ Education or training (e.g. art school, workshop)
❏ Multi media (e.g. digital media)
❏ Other (specify) _______________________________________________________________________________________
Cultural activities in the City of Sydney
170
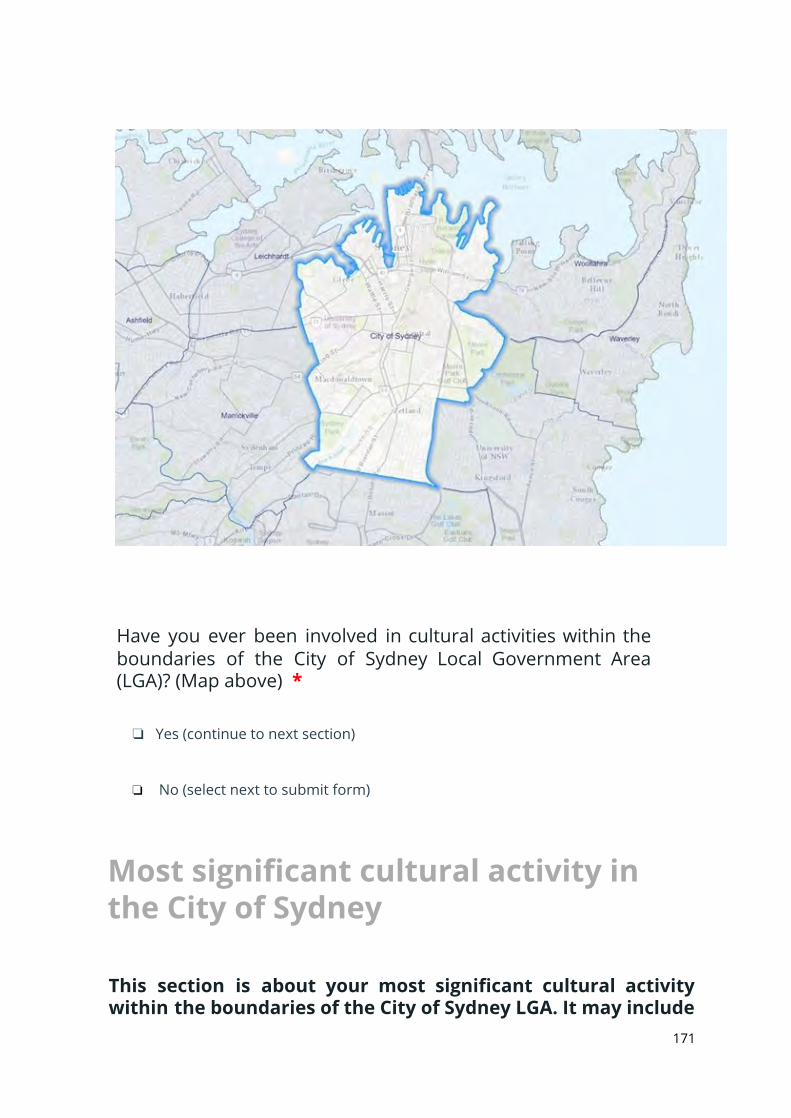
Have you ever been involved in cultural activities within the boundaries of the City of Sydney Local Government Area (LGA)? (Map above) *
❏ Yes (continue to next section)
❏ No (select next to submit form)
Most signi秜ᇘcant cultural activity in the City of Sydney
This section is about your most signi秜ᇘcant cultural activity within the boundaries of the City of Sydney LGA. It may include
171
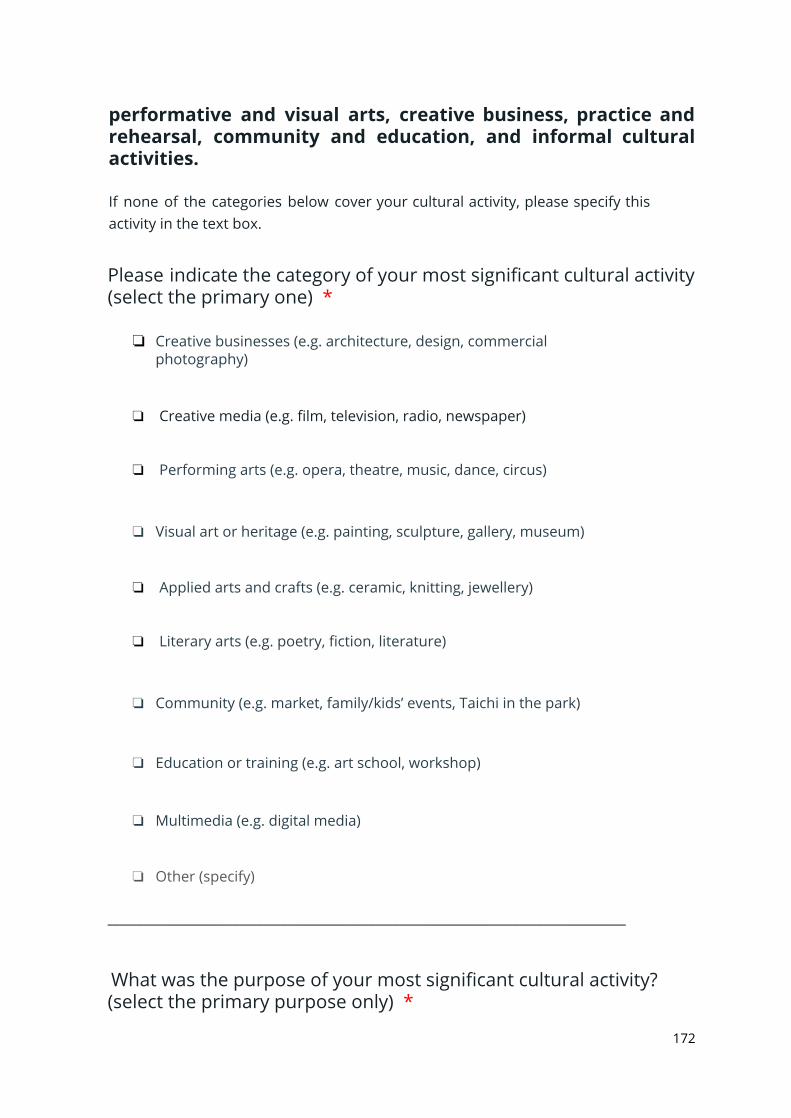
performative and visual arts, creative business, practice and rehearsal, community and education, and informal cultural activities. If none of the categories below cover your cultural activity, please specify this activity in the text box.
Please indicate the category of your most significant cultural activity (select the primary one) *
❏ Creative businesses (e.g. architecture, design, commercial photography)
❏ Creative media (e.g. film, television, radio, newspaper)
❏ Performing arts (e.g. opera, theatre, music, dance, circus)
❏ Visual art or heritage (e.g. painting, sculpture, gallery, museum)
❏ Applied arts and crafts (e.g. ceramic, knitting, jewellery)
❏ Literary arts (e.g. poetry, fiction, literature)
❏ Community (e.g. market, family/kids’ events, Taichi in the park)
❏ Education or training (e.g. art school, workshop)
❏ Multi media (e.g. digital media)
❏ Other (specify) _______________________________________________________________________________________ What was the purpose of your most significant cultural activity? (select the primary purpose only) *
172
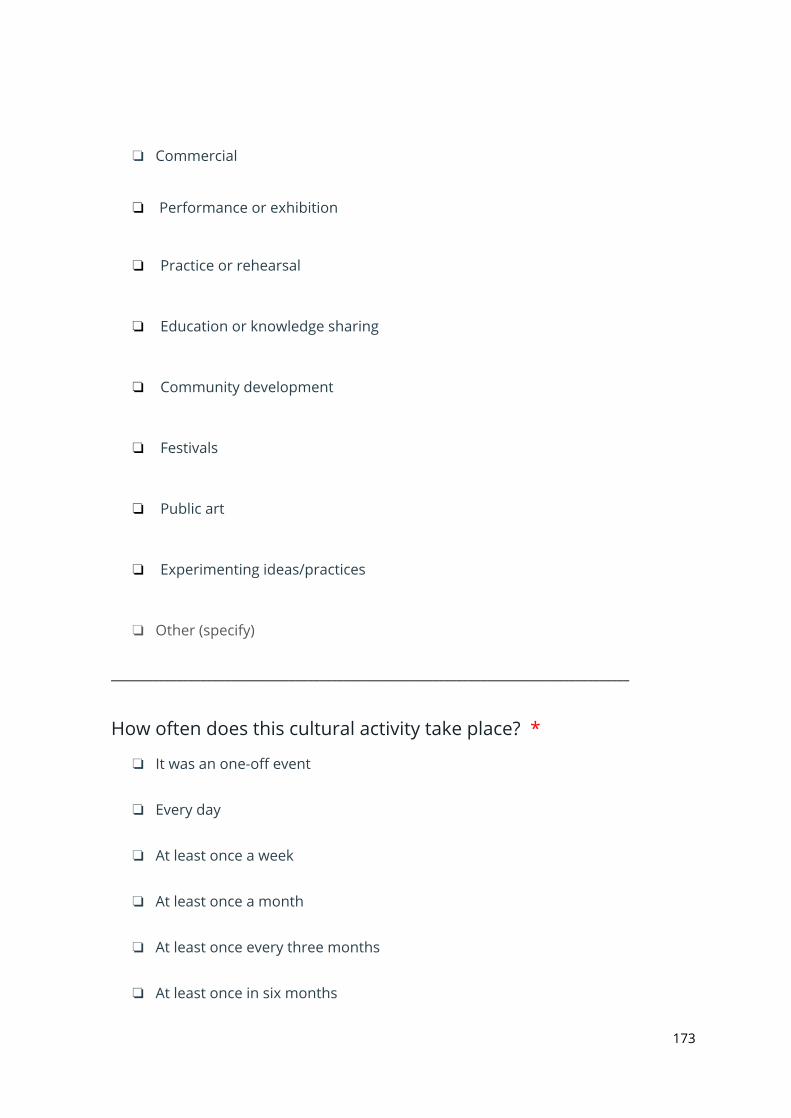
❏ Commercial
❏ Performance or exhibition
❏ Practice or rehearsal
❏ Education or knowledge sharing
❏ Community development
❏ Festivals
❏ Public art
❏ Experimenting ideas/practices
❏ Other (specify) _______________________________________________________________________________________
How often does this cultural activity take place? *
❏ It was an one -off event
❏ Every day
❏ At least once a week
❏ At least once a month
❏ At least once every three months
❏ At least once in six months
173
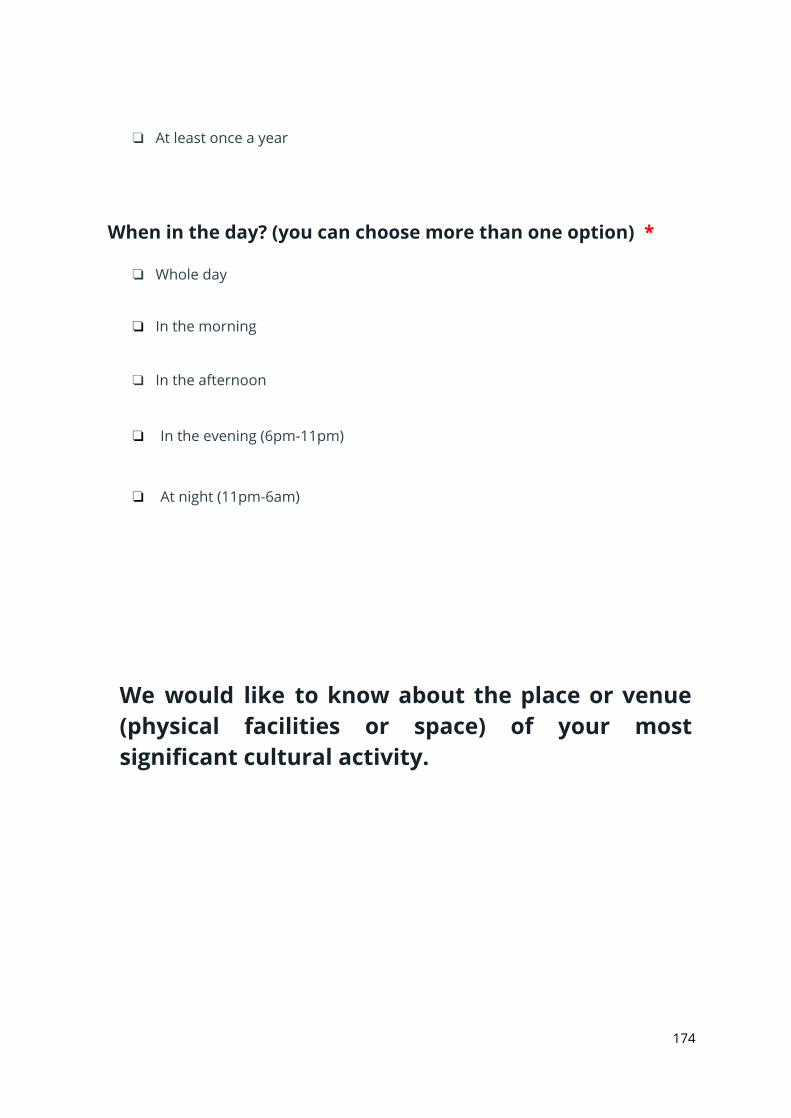
❏ At least once a year
When in the day? (you can choose more than one option) *
❏ Whole day
❏ In the morning
❏ In the afternoon
❏ In the evening (6pm- 11pm)
❏ At night (11pm- 6am)
We would like to know about the place or venue (physical facilities or space) of your most signi秜ᇘcant cultural activity.
174
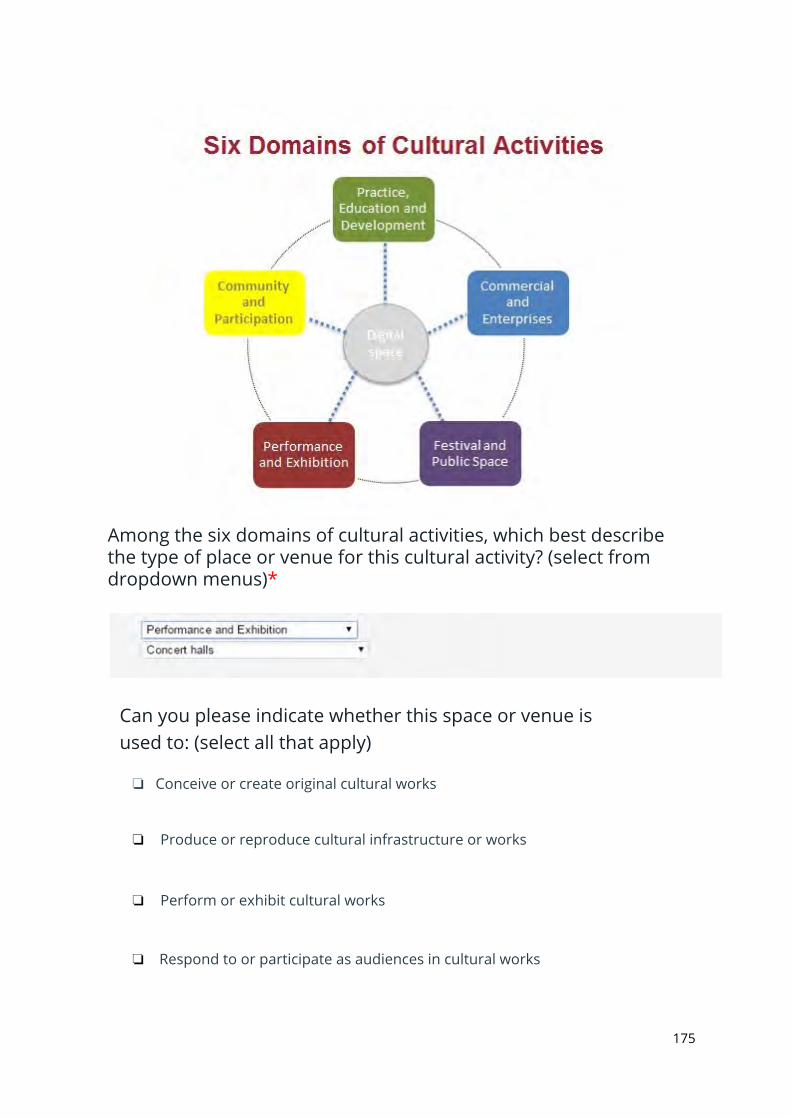
Among the six domains of cultural activities, which best describe the type of place or venue for this cultural activity? (select from dropdown menus) *
Can you please indicate whether this space or venue is used to: (select all that apply)
❏ Conceive or create original cultural works
❏ Produce or reproduce cultural infrastructure or works
❏ Perform or exhibit cultural works
❏ Respond to or participate as audiences in cultural works
175
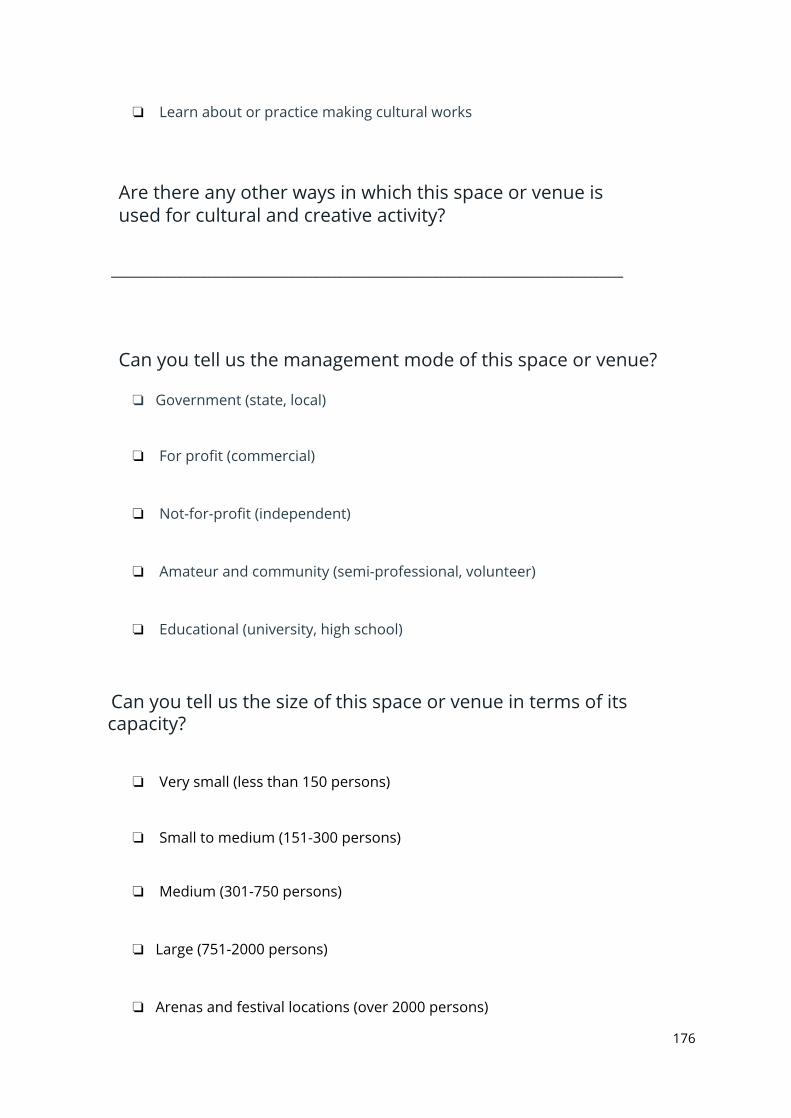
❏ Learn about or practice making cultural works
Are there any other ways in which this space or venue is used for cultural and creative activity?
______________________________________________________________________________________
Can you tell us the management mode of this space or venue?
❏ Government (state, local)
❏ For profit (commercial)
❏ Not- for- profit (independent)
❏ Amateur and community (semi -professional, volunteer)
❏ Educational (university, high school)
Can you tell us the size of this space or venue in terms of its capacity?
❏ Very small (less than 150 persons)
❏ Small to medium (151-300 persons)
❏ Medium (301-750 persons)
❏ Large (751-2000 persons)
❏ Arenas and festival locations (over 2000 persons)
176
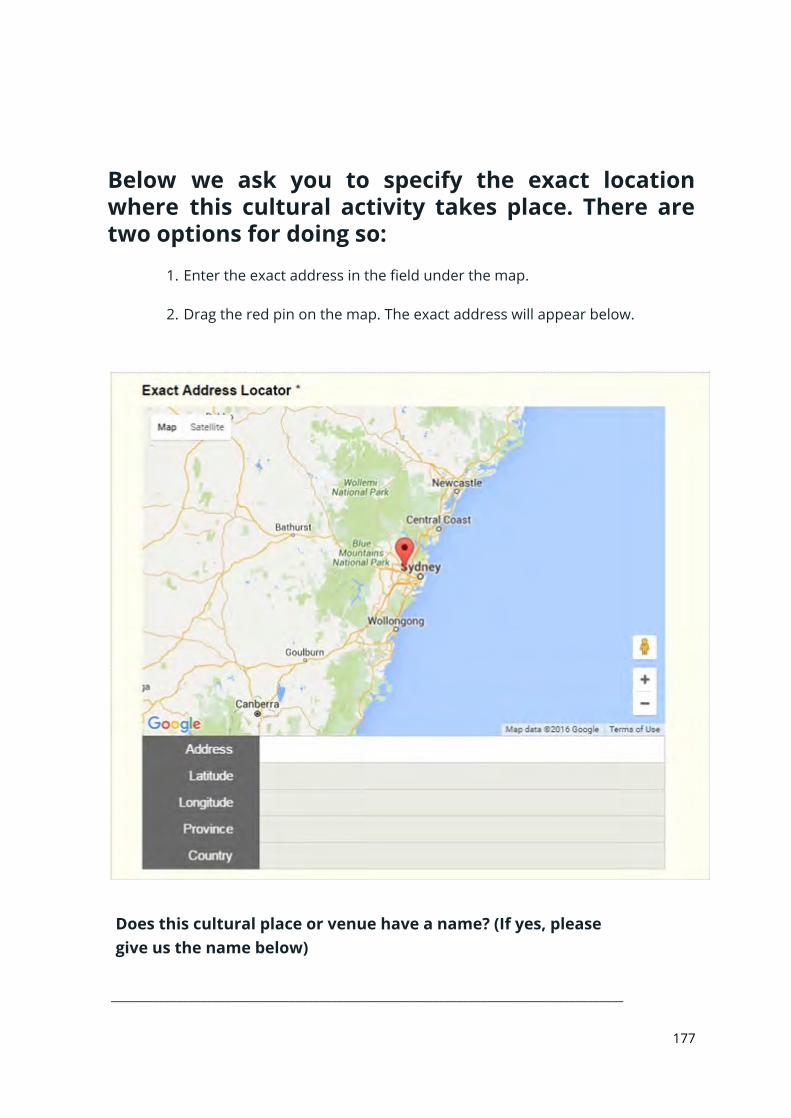
Below we ask you to specify the exact location where this cultural activity takes place. There are two options for doing so:
1. Enter the exact address in the field under the map.
2. Drag the red pin on the map. The exact address will appear below.
Does this cultural place or venue have a name? (If yes, please give us the name below)
______________________________________________________________________________________
177
Are you happy for your nominated place or venue to be made publicly available on the 秜ᇘnal interactive map? *
❏ Yes, please show my nominated place or venue on the final map
❏ No, do not show my nominated place or venue on the final map
Can you tell us more about this place or venue? (including secondary function, accessibility, equipment or any other comments)
______________________________________________________________________________________
Do you want to tell us about another cultural activity that you have been involved in? (You may enter up to two modules) *
❏ Yes (submit another module)
❏ No (submit form) This section is about another cultural activity that you have been involved in within the City of Sydney LGA. Thanks for adding more than one entry.
178
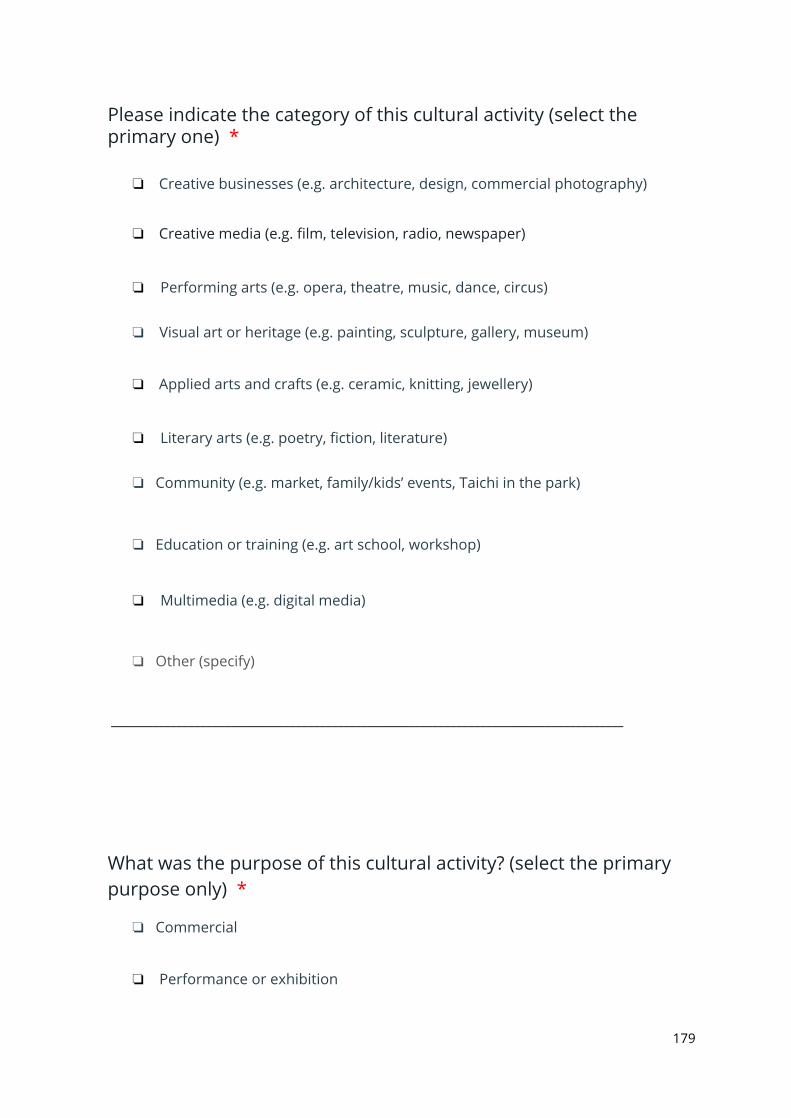
Please indicate the category of this cultural activity (select the primary one) *
❏ Creative businesses (e.g. architecture, design, commercial photography)
❏ Creative media (e.g. film, television, radio, newspaper)
❏ Performing arts (e.g. opera, theatre, music, dance, circus)
❏ Visual art or heritage (e.g. painting, sculpture, gallery, museum)
❏ Applied arts and crafts (e.g. ceramic, knitting, jewellery)
❏ Literary arts (e.g. poetry, fiction, literature)
❏ Community (e.g. market, family/kids’ events, Taichi in the park)
❏ Education or training (e.g. art school, workshop)
❏ Multi media (e.g. digital media)
❏ Other (specify) ______________________________________________________________________________________
What was the purpose of this cultural activity? (select the primary purpose only) *
❏ Commercial
❏ Performance or exhibition
179
❏ Practice or rehearsal
❏ Education or knowledge sharing
❏ Community development
❏ Festivals
❏ Public art
❏ Experimenting ideas/practices
❏ Other (specify) ______________________________________________________________________________________
How often does this cultural activity take place? *
❏ It was an one -off event
❏ Every day
❏ At least once a week
❏ At least once a month
❏ At least once every three months
❏ At least once in six months
❏ At least once a year
180
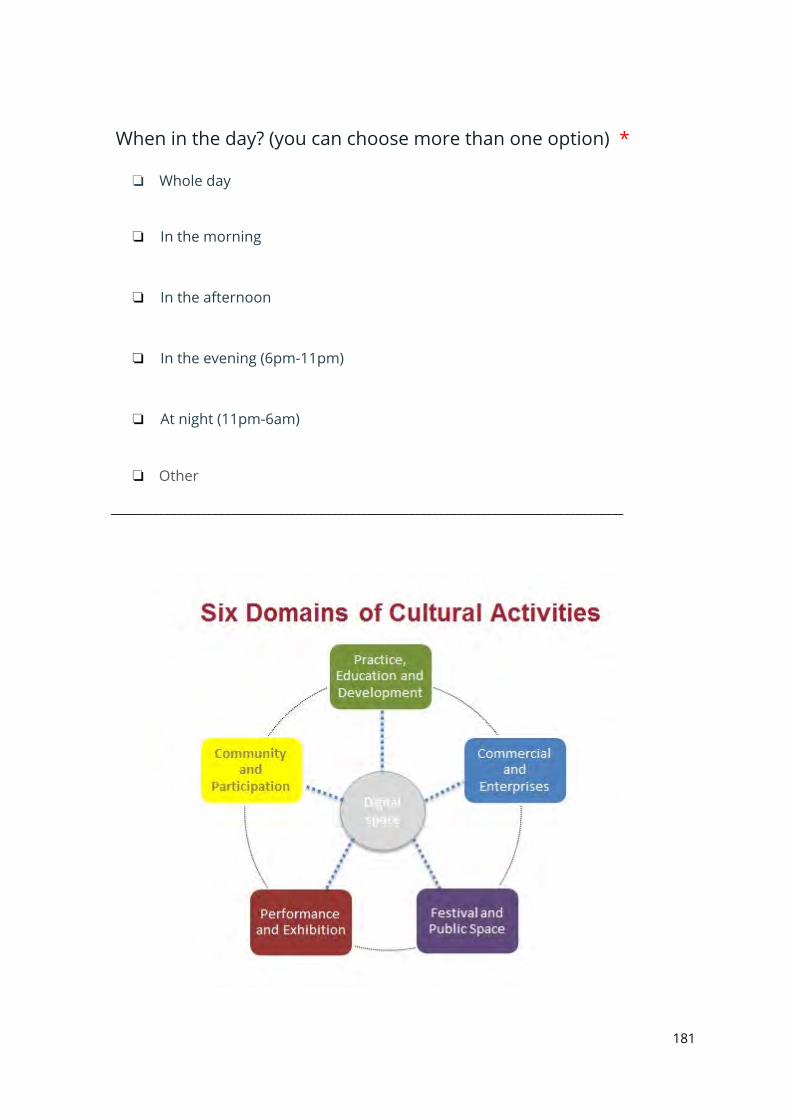
When in the day? (you can choose more than one option) *
❏ Whole day
❏ In the morning
❏ In the afternoon
❏ In the evening (6pm- 11pm)
❏ At night (11pm- 6am)
❏ Other ______________________________________________________________________________________
181
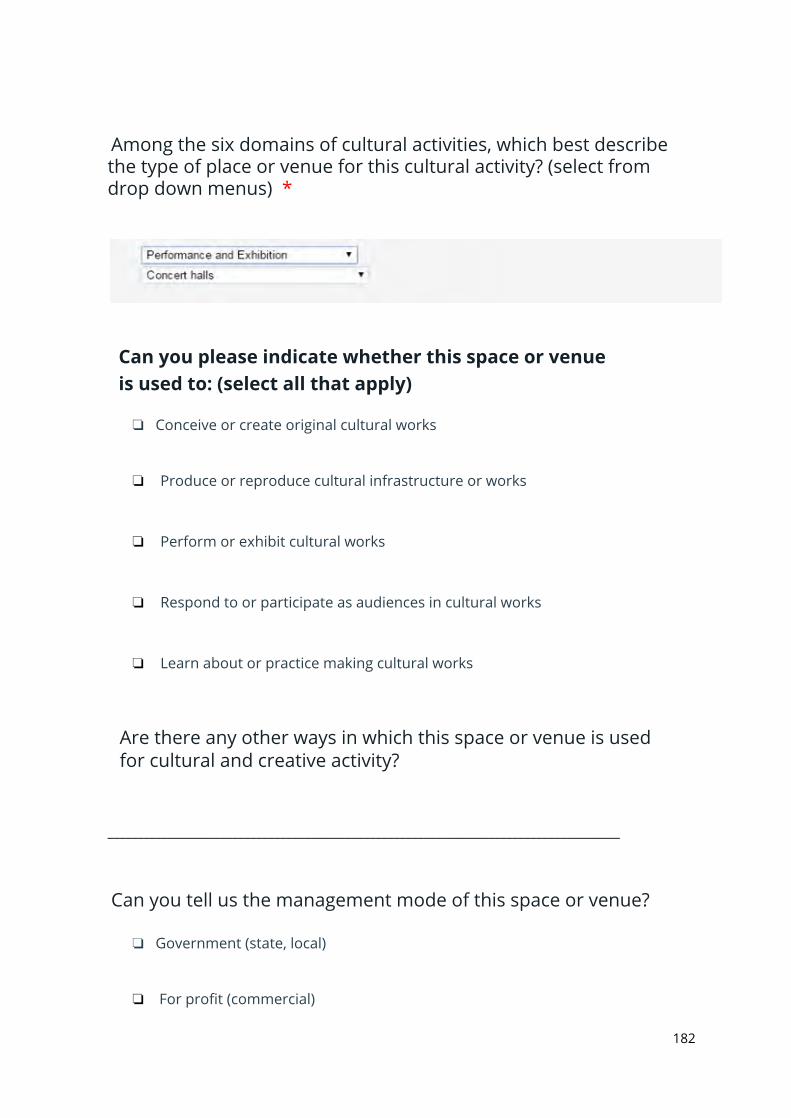
Among the six domains of cultural activities, which best describe the type of place or venue for this cultural activity? (select from drop down menus) *
Can you please indicate whether this space or venue is used to: (select all that apply)
❏ Conceive or create original cultural works
❏ Produce or reproduce cultural infrastructure or works
❏ Perform or exhibit cultural works
❏ Respond to or participate as audiences in cultural works
❏ Learn about or practice making cultural works
Are there any other ways in which this space or venue is used for cultural and creative activity?
______________________________________________________________________________________
Can you tell us the management mode of this space or venue?
❏ Government (state, local)
❏ For profit (commercial)
182
❏ Not- for- profit (independent)
❏ Amateur and community (semi -professional, volunteer)
❏ Educational (university, high school)
Can you tell us the size of this space or venue in terms of its capacity?
❏ Very small (less than 150 persons)
❏ Small to medium (151-300 persons)
❏ Medium (301-750 persons)
❏ Large (751-2000 persons)
❏ Arenas and festival locations (over 2000 persons)
Can you locate the place or venue on the map? (either type the exact address or drag the red pin on the map) *
183
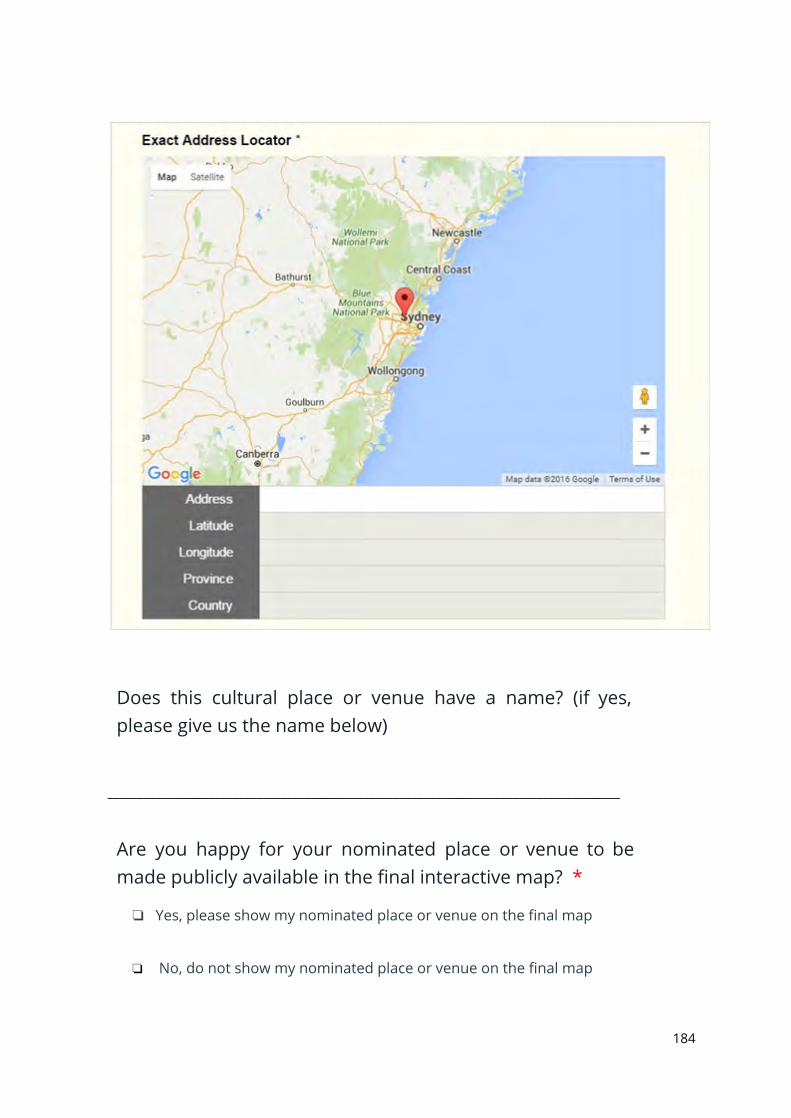
Does this cultural place or venue have a name? (if yes, please give us the name below)
______________________________________________________________________________________
Are you happy for your nominated place or venue to be made publicly available in the final interactive map? *
❏ Yes, please show my nominated place or venue on the final map
❏ No, do not show my nominated place or venue on the final map
184
Can you tell us more about this place or venue? (including secondary function, accessibility, equipment or any other comments)
______________________________________________________________________________________
Well done!
Thanks for taking the time to participate in this survey.
If you want to know more about this research, and be informed about its outcomes, please leave us your e mail address. We will only email you to let you know about the release of our interactive maps.
Your e mail ______________________________________________________________________________________
Submit
185
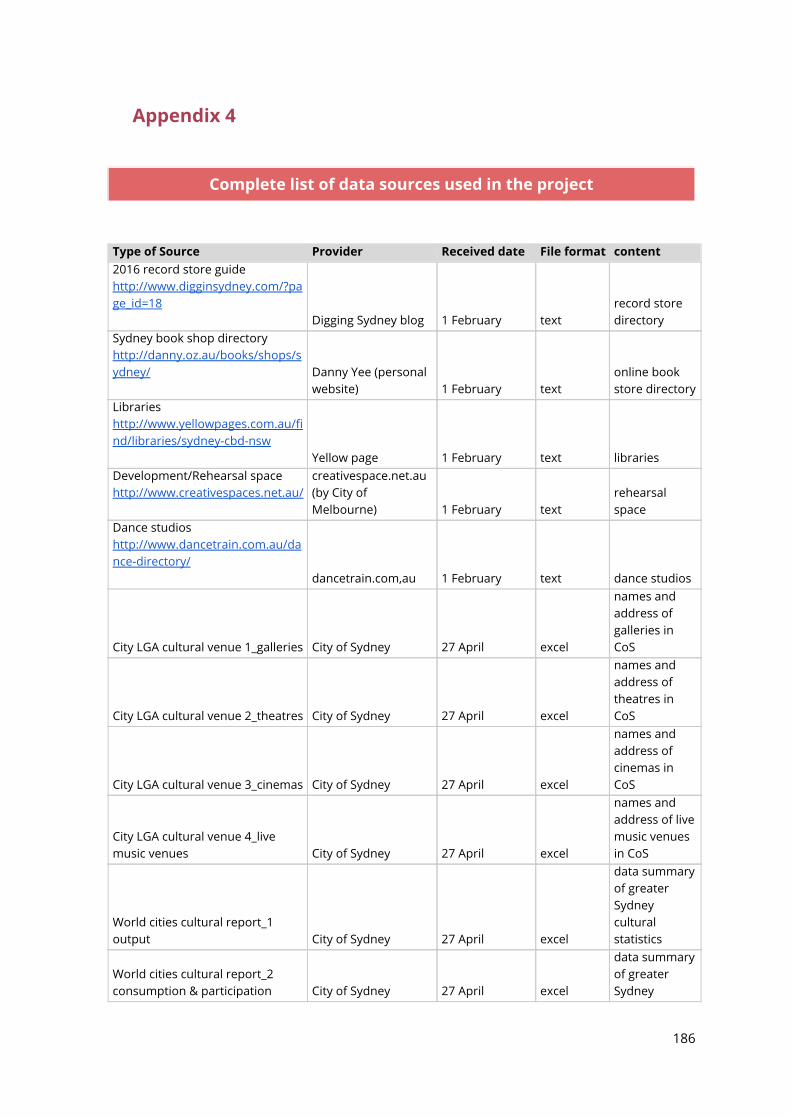
Appendix 4
Complete list of data sources used in the project
Type of Source Provider Received date File format content 2016 record store guide http://www.digginsydney.com/?page_id=18 Digging Sydney blog 1 February text
record store directory
Sydney book shop directory http://danny.oz.au/books/shops/sydney/
Danny Yee (personal website) 1 February text
online book store directory
Libraries http://www.yellowpages.com.au/find/libraries/sydney-cbd-nsw Yellow page 1 February text libraries Development/Rehearsal space http://www.creativespaces.net.au/
creativespace.net.au (by City of Melbourne) 1 February text
rehearsal space
Dance studios http://www.dancetrain.com.au/dance-directory/ dancetrain.com,au 1 February text dance studios
City LGA cultural venue 1_galleries City of Sydney 27 April excel
names and address of galleries in CoS
City LGA cultural venue 2_theatres City of Sydney 27 April excel
names and address of theatres in CoS
City LGA cultural venue 3_cinemas City of Sydney 27 April excel
names and address of cinemas in CoS
City LGA cultural venue 4_live music venues City of Sydney 27 April excel
names and address of live music venues in CoS
World cities cultural report_1 output City of Sydney 27 April excel
data summary of greater Sydney cultural statistics
World cities cultural report_2 consumption & participation City of Sydney 27 April excel
data summary of greater Sydney
186

cultural consumption
World cities cultural report_3 additional info City of Sydney 27 April excel
additional info on HE student no, most visited museum, top festival, heritage sites
World cities cultural report_4 contextual data City of Sydney 27 April excel
greater Sydney demographic data
World cities cultural report_5 Theatres & concert halls City of Sydney 27 April excel
list of theatres & concert halls by size categories in greater Sydney
World cities cultural report_6 galleries, museums, libraries City of Sydney 27 April excel
list of museums and galleries in greater Sydney
World cities cultural report_7 cinemas & video games arcades City of Sydney 27 April excel
list of cinemas & video games arcades in greater Sydney
World cities cultural report_8 students City of Sydney 27 April excel
list of HE and no of students in greater Sydney
Theatres comedy clubs & major halls City of Sydney 27 April text
list of theatres, comedy clubs, galleries & halls in greater Sydney
CoS list of cultural buildings City of Sydney 27 April excel
list of CoS controlled bldgs for cultural activities
Art NSW funded art organisations Arts NSW website 27 April text
2016 ACDP program funding
Sydney Fringe Festival guide 2015 Website 27 April text
Sydney Fringe festival 2015 program (with venue map)
CoS City Art City of Sydney 24 May shape file CoS public art CoS community facilities City of Sydney 24 May shape file libraries in CoS
CoS community gardens City of Sydney 24 May shape file community gardens
CoS cultural facilities City of Sydney 24 May shape file rehearsal space
187
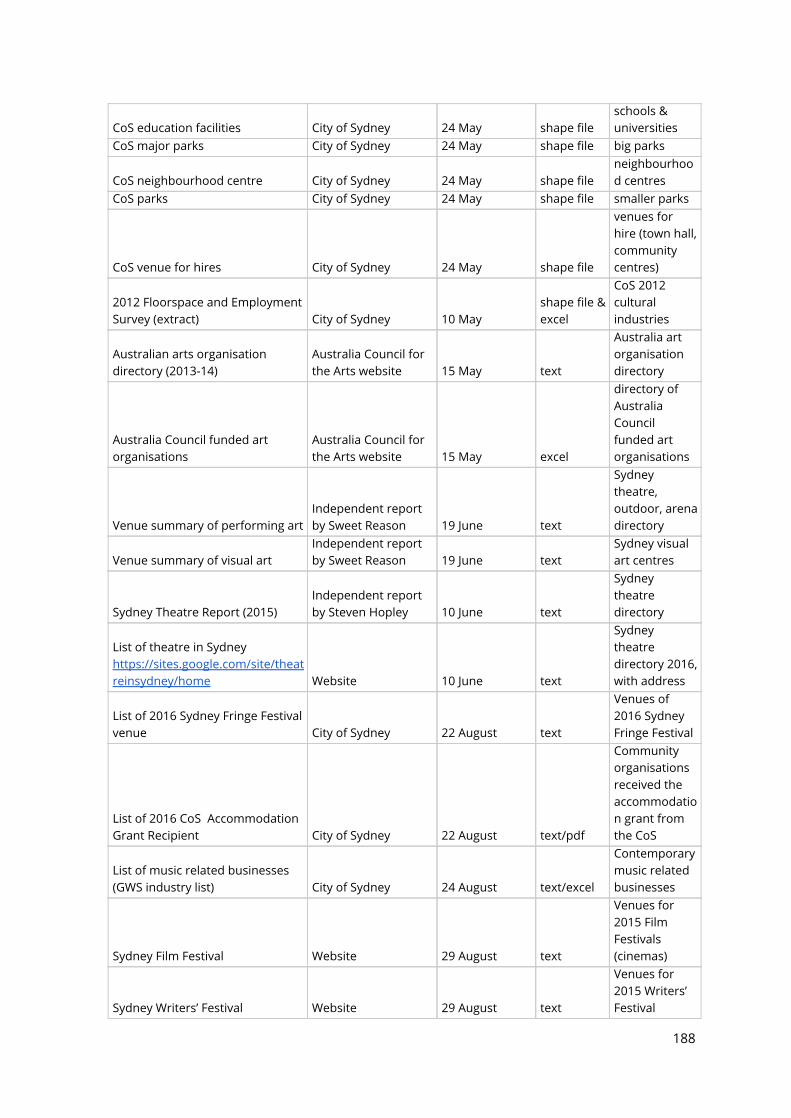
CoS education facilities City of Sydney 24 May shape file schools & universities
CoS major parks City of Sydney 24 May shape file big parks
CoS neighbourhood centre City of Sydney 24 May shape file neighbourhood centres
CoS parks City of Sydney 24 May shape file smaller parks
CoS venue for hires City of Sydney 24 May shape file
venues for hire (town hall, community centres)
2012 Floorspace and Employment Survey (extract) City of Sydney 10 May
shape file & excel
CoS 2012 cultural industries
Australian arts organisation directory (2013-14)
Australia Council for the Arts website 15 May text
Australia art organisation directory
Australia Council funded art organisations
Australia Council for the Arts website 15 May excel
directory of Australia Council funded art organisations
Venue summary of performing art Independent report by Sweet Reason 19 June text
Sydney theatre, outdoor, arena directory
Venue summary of visual art Independent report by Sweet Reason 19 June text
Sydney visual art centres
Sydney Theatre Report (2015) Independent report by Steven Hopley 10 June text
Sydney theatre directory
List of theatre in Sydney https://sites.google.com/site/theatreinsydney/home Website 10 June text
Sydney theatre directory 2016, with address
List of 2016 Sydney Fringe Festival venue City of Sydney 22 August text
Venues of 2016 Sydney Fringe Festival
List of 2016 CoS Accommodation Grant Recipient City of Sydney 22 August text/pdf
Community organisations received the accommodation grant from the CoS
List of music related businesses (GWS industry list) City of Sydney 24 August text/excel
Contemporary music related businesses
Sydney Film Festival Website 29 August text
Venues for 2015 Film Festivals (cinemas)
Sydney Writers’ Festival Website 29 August text
Venues for 2015 Writers’ Festival
188
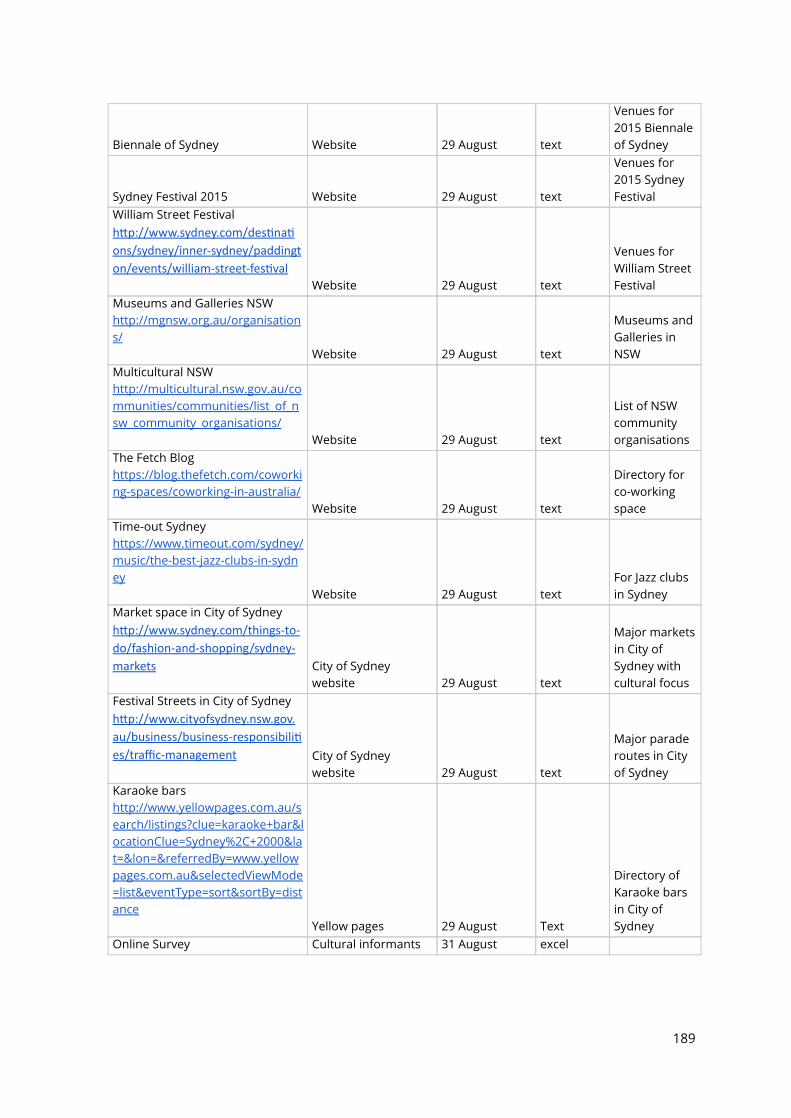
Biennale of Sydney Website 29 August text
Venues for 2015 Biennale of Sydney
Sydney Festival 2015 Website 29 August text
Venues for 2015 Sydney Festival
William Street Festival h℀ጅp://www.sydney.com/des℀甄na℀甄ons/sydney/inner‐sydney/paddington/events/william‐street‐fes℀甄val Website 29 August text
Venues for William Street Festival
Museums and Galleries NSW http://mgnsw.org.au/organisations/ Website 29 August text
Museums and Galleries in NSW
Multicultural NSW http://multicultural.nsw.gov.au/communities/communities/list_of_nsw_community_organisations/ Website 29 August text
List of NSW community organisations
The Fetch Blog https://blog.thefetch.com/coworking-spaces/coworking-in-australia/ Website 29 August text
Directory for co-working space
Time-out Sydney https://www.timeout.com/sydney/music/the-best-jazz-clubs-in-sydney Website 29 August text
For Jazz clubs in Sydney
Market space in City of Sydney h℀ጅp://www.sydney.com/things‐to‐do/fashion‐and‐shopping/sydney‐markets
City of Sydney website 29 August text
Major markets in City of Sydney with cultural focus
Festival Streets in City of Sydney h℀ጅp://www.cityofsydney.nsw.gov.au/business/business‐responsibili℀甄es/traffic‐management
City of Sydney website 29 August text
Major parade routes in City of Sydney
Karaoke bars http://www.yellowpages.com.au/search/listings?clue=karaoke+bar&locationClue=Sydney%2C+2000&lat=&lon=&referredBy=www.yellowpages.com.au&selectedViewMode=list&eventType=sort&sortBy=distance Yellow pages 29 August Text
Directory of Karaoke bars in City of Sydney
Online Survey Cultural informants 31 August excel
189
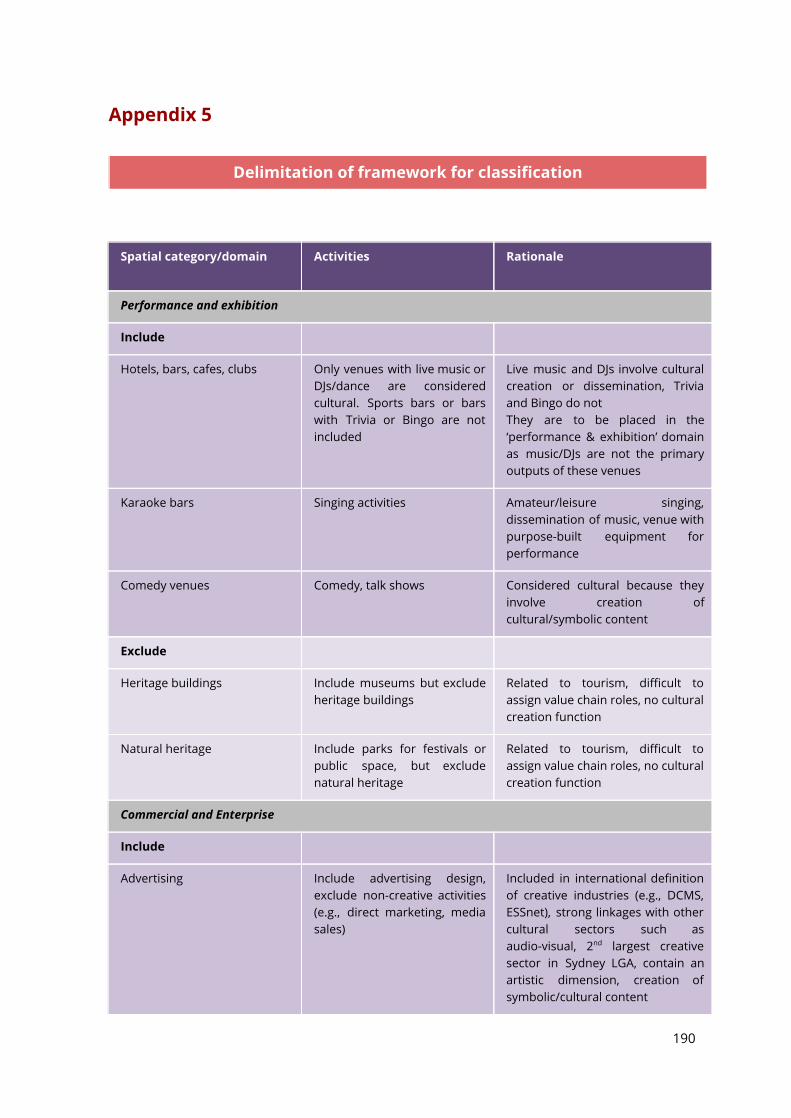
Appendix 5
Delimitation of framework for classi秜ᇘcation
Spatial category/domain Activities Rationale
Performance and exhibition
Include
Hotels, bars, cafes, clubs Only venues with live music or DJs/dance are considered cultural. Sports bars or bars with Trivia or Bingo are not included
Live music and DJs involve cultural creation or dissemination, Trivia and Bingo do not They are to be placed in the ‘performance & exhibition’ domain as music/DJs are not the primary outputs of these venues
Karaoke bars Singing activities Amateur/leisure singing, dissemination of music, venue with purpose-built equipment for performance
Comedy venues Comedy, talk shows Considered cultural because they involve creation of cultural/symbolic content
Exclude
Heritage buildings Include museums but exclude heritage buildings
Related to tourism, difficult to assign value chain roles, no cultural creation function
Natural heritage Include parks for festivals or public space, but exclude natural heritage
Related to tourism, difficult to assign value chain roles, no cultural creation function
Commercial and Enterprise
Include
Advertising Include advertising design, exclude non-creative activities (e.g., direct marketing, media sales)
Included in international definition of creative industries (e.g., DCMS, ESSnet), strong linkages with other cultural sectors such as audio-visual, 2 nd largest creative sector in Sydney LGA, contain an artistic dimension, creation of symbolic/cultural content
190
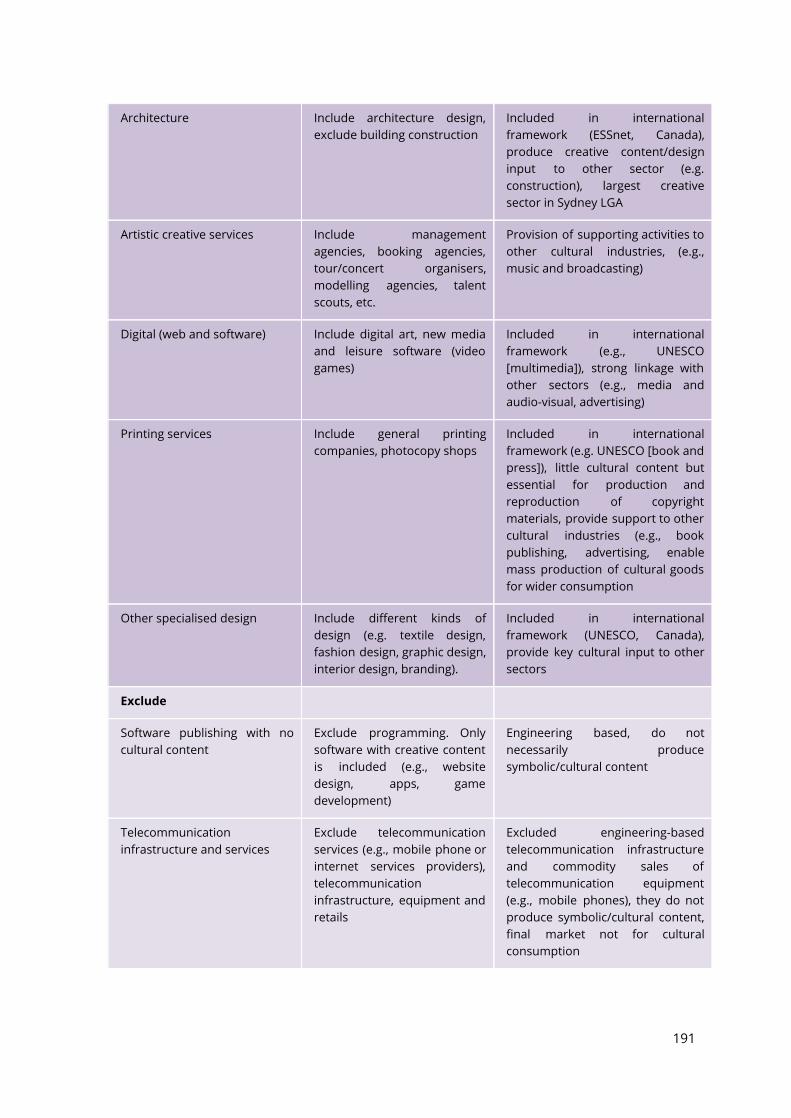
Architecture Include architecture design, exclude building construction
Included in international framework (ESSnet, Canada), produce creative content/design input to other sector (e.g. construction), largest creative sector in Sydney LGA
Artistic creative services Include management agencies, booking agencies, tour/concert organisers, modelling agencies, talent scouts, etc.
Provision of supporting activities to other cultural industries, (e.g., music and broadcasting)
Digital (web and software) Include digital art, new media and leisure software (video games)
Included in international framework (e.g., UNESCO [multimedia]), strong linkage with other sectors (e.g., media and audio-visual, advertising)
Printing services Include general printing companies, photocopy shops
Included in international framework (e.g. UNESCO [book and press]), little cultural content but essential for production and reproduction of copyright materials, provide support to other cultural industries (e.g., book publishing, advertising, enable mass production of cultural goods for wider consumption
Other specialised design Include different kinds of design (e.g. textile design, fashion design, graphic design, interior design, branding).
Included in international framework (UNESCO, Canada), provide key cultural input to other sectors
Exclude
Software publishing with no cultural content
Exclude programming. Only software with creative content is included (e.g., website design, apps, game development)
Engineering based, do not necessarily produce symbolic/cultural content
Telecommunication infrastructure and services
Exclude telecommunication services (e.g., mobile phone or internet services providers), telecommunication infrastructure, equipment and retails
Excluded engineering-based telecommunication infrastructure and commodity sales of telecommunication equipment (e.g., mobile phones), they do not produce symbolic/cultural content, final market not for cultural consumption
191
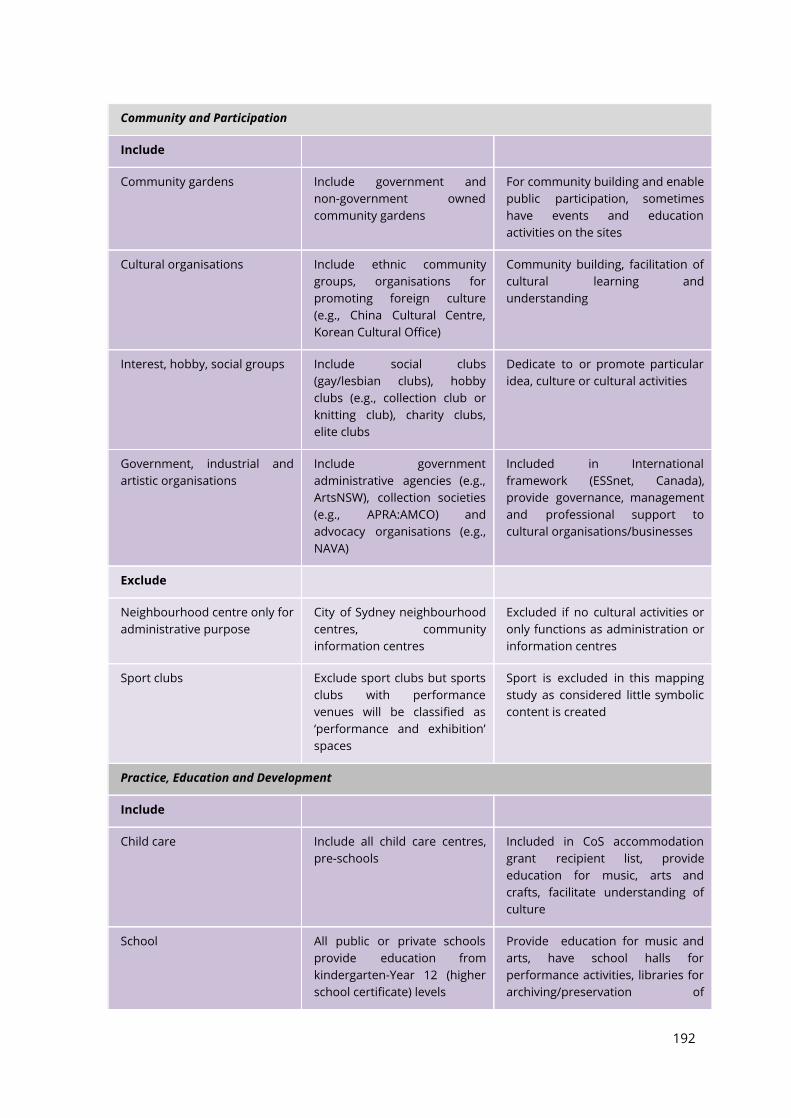
Community and Participation
Include
Community gardens Include government and non-government owned community gardens
For community building and enable public participation, sometimes have events and education activities on the sites
Cultural organisations Include ethnic community groups, organisations for promoting foreign culture (e.g., China Cultural Centre, Korean Cultural Office)
Community building, facilitation of cultural learning and understanding
Interest, hobby, social groups Include social clubs (gay/lesbian clubs), hobby clubs (e.g., collection club or knitting club), charity clubs, elite clubs
Dedicate to or promote particular idea, culture or cultural activities
Government, industrial and artistic organisations
Include government administrative agencies (e.g., ArtsNSW), collection societies (e.g., APRA:AMCO) and advocacy organisations (e.g., NAVA)
Included in International framework (ESSnet, Canada), provide governance, management and professional support to cultural organisations/businesses
Exclude
Neighbourhood centre only for administrative purpose
City of Sydney neighbourhood centres, community information centres
Excluded if no cultural activities or only functions as administration or information centres
Sport clubs Exclude sport clubs but sports clubs with performance venues will be classified as ‘performance and exhibition’ spaces
Sport is excluded in this mapping study as considered little symbolic content is created
Practice, Education and Development
Include
Child care Include all child care centres, pre-schools
Included in CoS accommodation grant recipient list, provide education for music, arts and crafts, facilitate understanding of culture
School All public or private schools provide education from kindergarten-Year 12 (higher school certificate) levels
Provide education for music and arts, have school halls for performance activities, libraries for archiving/preservation of
192

knowledge of culture, support and facilitate understanding of culture
Colleges All public or private colleges providing education for Certificate IV, diploma or advanced diploma levels, TAFE, Bible colleges
Provide education/training for music, arts, design, digital, media, religions, libraries for archiving/preservation of knowledge of culture, support and facilitate understanding of culture
Universities Include all public or private universities providing education for undergraduate and postgraduate degree levels University museums, galleries or theatres are classified separately as ‘performance and exhibition’ spaces
Included in international frameworks (UNESCO, Canada), provide education/training for music, fine arts, literature, design, digital, media, architecture, advertising etc. Conduct research to create, preserve or archive knowledge of culture, support and facilitate understanding of culture
Exclude
English language schools, coaching classes
Exclude English language school or coaching classes
Provided technical or practical education with little cultural content, not regarded as providing input to other cultural sectors
Festival, Event and Public Space
Include
Official public art CoS or other government commissioned or funded public art work (e.g., mural, street arts, laneways)
Included as City art is an integral part of CoS’ cultural policy and action plan, belongs to the visual art sector. Unable to map all public art at this stage, but seen as important to keep a record of the volume for future review
Markets Include markets with a cultural focus (e.g., art and craft markets in the Rocks)
Included as important to examine the temporary cultural space (space reverts to its core use afterwards), space of cultural dissemination and consumption, facilitate community building
Exclude
Unofficial public art (e.g., Graffiti)
Exclude general graffiti art Difficult to map as no formal record and exist everywhere, difficult to draw the line between graffiti art and vandalism
193
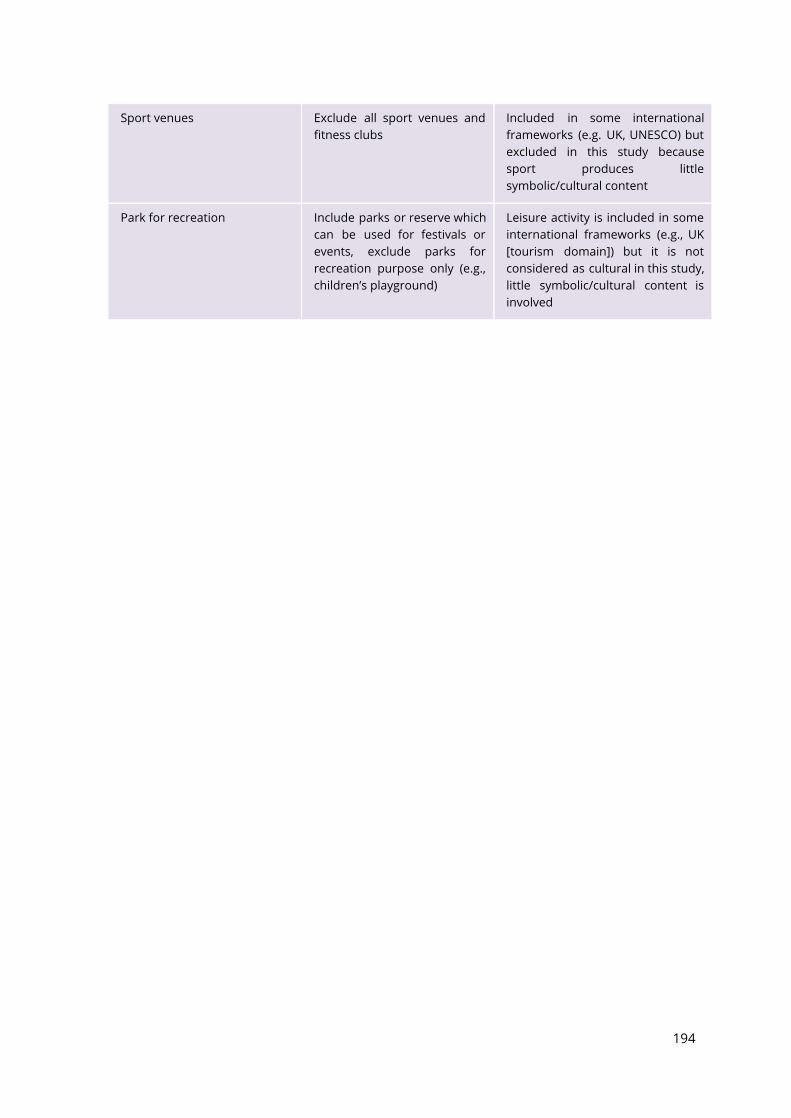
Sport venues Exclude all sport venues and fitness clubs
Included in some international frameworks (e.g. UK, UNESCO) but excluded in this study because sport produces little symbolic/cultural content
Park for recreation Include parks or reserve which can be used for festivals or events, exclude parks for recreation purpose only (e.g., children’s playground)
Leisure activity is included in some international frameworks (e.g., UK [tourism domain]) but it is not considered as cultural in this study, little symbolic/cultural content is involved
194

Western Sydney University84
CHINATOWN RESEARCH REPORT
WESTERNSYDNEY.EDU.AU