mapping ground subsidence induced by aquifer ...juanma/paperspdf/journals/rse/tomas05.pdf ·...
TRANSCRIPT

www.elsevier.com/locate/rse
Remote Sensing of Environm
Mapping ground subsidence induced by aquifer overexploitation using
advanced Differential SAR Interferometry: Vega Media of the
Segura River (SE Spain) case study
Roberto Tomas a,T, Yolanda Marquez b, Juan M. Lopez-Sanchez b, Jose Delgado c,
Pablo Blanco d, Jordi J. Mallorquı d, Monica Martınez e, Gerardo Herrera e, Joaquın Mulas e
aDepartamento de Expresion Grafica y Cartografıa, Escuela Politecnica Superior, Universidad de Alicante, P.O. Box 99, E-03080 Alicante, SpainbDepartamento de Fısica, Ingenierıa de Sistemas y Teorıa de la Senal (DFISTS), Escuela Politecnica Superior, Universidad de Alicante,
P.O. Box 99, E-03080 Alicante, SpaincDepartamento de Ciencias de la Tierra y Medioambiente, Facultad de Ciencias, Universidad de Alicante, P.O. Box 99, E-03080 Alicante, Spain
dDepartament de Teoria del Senyal i Comunicacions, Universitat Politecnica de Catalunya, c/Jordi Girona, 1-3, Ed. D-3, E-08034, Barcelona, SpaineRiesgos Geologicos, Subdireccion de Recursos Minerales y Geoambiente, Instituto Geologico y Minero de Espana (IGME), Ministerio de Ciencia y
Tecnologıa, c/ Rıos Rosas 23, E-28003 Madrid, Spain
Received 6 May 2005; received in revised form 2 August 2005; accepted 6 August 2005
Abstract
Differential SAR Interferometry (DInSAR) is a remote sensing technique with the well-proven ability to monitor ground deformations. In
this work we have applied an advanced DInSAR technique – the Coherent Pixels Technique (CPT) – , to study subsidence phenomena due
to the excessive pumping of groundwater in the Vega Media of the Segura River (SE Spain) from 1993 to the present. The settlement map
retrieved with DInSAR shows settlement of up to 8 cm at some points of the study area and has been compared with other data provided by
ground instruments to analyse the relationship with ground deformation. A correlation has been observed between these measurements and
the observations from on-site testing of piezometric groundwater fluctuations and borehole extensometric settlement. However, the
distribution of damaged buildings, well points and basements does not show a clear relationship with measured subsidence values because
the occurrence of damage also depends on the structural state of the buildings and the characteristics of their foundations. In addition, the
distribution of pumping wells is not indicative of the distribution of the volume of water withdrawal which is the real conditioning factor of
piezometric level changes. It can be concluded that the results obtained provide very useful spatial and temporal data about this phenomenon
in an urban area at a low cost. The data can be used for forecasting purposes and helps to define zones with future ground settlement problems
if the same conditions are repeated. This technique has also allowed the monitoring of ground subsidence in the Vega Media of Segura River
for a period (1993–1995) where no instrument information was available.
D 2005 Elsevier Inc. All rights reserved.
Keywords: Differential SAR Interferometry (DInSAR); Subsidence; Piezometric level; Urban areas
1. Introduction
Ground subsidence induced by excessive overexploitation
of aquifers is a common problem affecting our society. This
phenomenon involves the settlement of the surface of the
0034-4257/$ - see front matter D 2005 Elsevier Inc. All rights reserved.
doi:10.1016/j.rse.2005.08.003
T Corresponding author.
E-mail address: [email protected] (R. Tomas).
ground and affects wide areas. Civil structures built on these
areas must withstand these vertical (and sometimes horizon-
tal) ground deformations, and widespread damage occurs
when differential settlements cannot be accommodated for
beneath their foundations. It is estimated that there are over
150 cities in the world with serious problems of subsidence
due to excessive groundwater withdrawal (Hu et al., 2004).
For instance, well-known examples of subsidence include the
ent 98 (2005) 269 – 283

R. Tomas et al. / Remote Sensing of Environment 98 (2005) 269–283270
Po Valley (Italy), Mexico DC, Antelope and San Joaquin
Valley (USA), Bangkok (Thailand) and many other areas in
the world.
Subsidence has occurred in the metropolitan area of the
city of Murcia (SE Spain) as a result of excessive pumping
of groundwater during a drought period (1992–95). A
lowering of the piezometric level, 8 m approximately,
caused a maximum estimated ground settlement of 8 cm
(Martınez et al., 2004), and damaged over 150 buildings and
other structures. The cost of the damages was assessed by
local authorities to be over 50 million Euros (Mulas et al.,
2003; Rodrıguez Ortiz & Mulas, 2002) and had a significant
repercussion in the local society.
Knowledge of the spatial and temporal distribution of the
deformations is essential to delineate themost severely damaged
areas and to establish counter measures to mitigate (or even
eliminate) the causes that have led to this ground subsidence.
Moreover, this would allow us to predict future subsidence
processes resulting from further overexploitation of aquifers.
During the last decade, Differential Interferometry
Synthetic Aperture Radar (DInSAR) has become an
important remote sensing tool for estimating temporal and
spatial surface motions due to subsidence (Berardino et al.,
2002; Colesanti et al., 2001; Ferretti et al., 2000, 2001;
Galloway et al., 1998; Mora et al., 2003).
DInSAR has several important advantages over classical
methods used to measure subsidence deformation. One of
the main advantages of DInSAR is its high spatial coverage
in urban areas. If we compare DInSAR with other common
techniques, such as Differential Global Positioning System
(DGPS) and instrumental methods, the latter can only
measure ground deformations at a few discrete points, not
over a wide and continuous area. In the case of levelling
methods, they can cover a whole territory but the average
distance between benchmarks is much higher than DInSAR
resolution. In addition, complete levelling surveys cannot be
repeated frequently because the cost of carrying out the
measurements of a levelling network is very high. With
respect to the time repetition, DGPS is not time and cost
effective for measurements periods shorter than a year.
However, DInSAR could be used to set up a monthly or
annual monitoring service at moderate cost.
In this paper, subsidence due to overexploitation in the
Vega Media of the Segura River, located in the southeast of
Spain, is studied bymeans of an advancedDInSAR technique
called Coherent Pixels Technique (CPT,Mora, 2004; Mora et
al., 2003). The data set consists of 28 SAR images acquired
from April 1993 to October 2004. Due to the lack of suitable
images in 1992, we have been able to measure subsidence
only for part of the drought period that took place during
1992–95. The study has two main objectives. Firstly,
DInSAR will be used to determine the deformation of the
study zone, and the results will be compared with available
extensometric measurements and with modelled movement.
Secondly, the relationship between piezometric changes and
surface deformation will be analysed.
2. Description of the study area
2.1. Location and description of the problem
The study zone consists of a section of the Segura River
Valley (SE Spain) (Fig. 1). More specifically, the zone
monitored corresponds to the metropolitan area of the city
of Murcia. This area has developed by occupying the flood
plain of the Segura River, also known as the Vega Media.
This area covers a surface of 206 km2, with approximately
50% being cultivated land (Gumiel et al., 2001).
The sediment accumulated by the Segura River since the
Pliocenemakes up an aquifer that had been scarcely exploited
up to recent times, with the use of running river water being
more common. Nevertheless, recent population growth
(currently more than 400,000 inhabitants) and changes in
agricultural practices, from classical extensive to intensive
irrigated land, favoured the exploitation of this aquifer. In this
context, several drought periods, especially during years
1992 to 1995, led to an overexploitation of this aquifer.
2.2. Geological and geotechnical setting
The study area is located in the oriental sector of the
Betic Cordillera. A compressive stress field has acted since
the Upper Miocene in this sector and has led to the
development of a basin bounded by two active faults, the
Lorca-Alhama, to the north, and the Carrascoy-Bajo Segura,
to the south (Montenat et al., 1990). The sedimentary record
of the basin has been deformed as it has been deposited,
creating a broad syncline in which progressively younger
sediments have been deposited. The basement of the basin is
made up of old (Permian and Triassic), deformed materials
corresponding to the Internal Zones of the Betic Cordillera.
These materials also crop out along the edge of the Segura
River Valley (Figs. 1 and 2).
The basin fill consists of sedimentary Upper Miocene to
Quaternary rocks that can be divided into three units (Figs.
1 and 2). Older materials (Upper Miocene) mainly consist
of a thick sequence (more than 600 m) of marls (Ceron &
Pulido, 1996; Mulas et al., 2003). Above them, pliocene–
quaternary rocks consist of marls and clays interbedded
with several levels of conglomerates and sandstones,
deposited in a continental environment. These conglom-
erate levels are of great interest for hydrological purposes.
The overall thickness of these materials is about 150 m,
although they can reach 200 m in some places (Aragon et
al., 2004). At surface level, recent continental (meander,
channel, oxbow lakes, flood plain, alluvial fans, etc.)
sediments are found. Silts and clays are abundant in the
flood plain and oxbow deposits, while sand is common in
channel areas and in the alluvial fans formed in the relief
features around the valley. The thickness of the recent
sediments varies between 3 and 30 m (Rodrıguez Jurado et
al., 2000). Anthropic deposits can also be found at surface
level in certain places.

Fig. 1. (a) Situation and (b) geology of the Vega Media of the Segura River (based on Aragon et al., 2004).
R. Tomas et al. / Remote Sensing of Environment 98 (2005) 269–283 271
From a hydrological point of view, two units with aquifer
properties have traditionally been identified (Aragon et al.,
2004; Ceron & Pulido, 1996). The first, or surface, aquifer
consists of recent sediments. Since fine sediments are very
abundant, its hydrological properties are poor (vertical and
horizontal hydraulic conductivity varying between 0.03–0.1
m/day and 0.01–5 m/day, respectively) and it is scarcely
exploited. The second unit, or deep aquifer, is located
immediately below the recent sediments. It consists of a 10
to 30 m thick sequence of conglomerates with a matrix of
variable nature (sand, silt and clays) which is part of the
Pliocene – Quaternary sedimentary rocks. The horizontal
and vertical hydraulic conductivity of this aquifer vary
depending on site, but they are typically between 10–100
m/day and 1–50 m/day, respectively (Aragon et al., 2004).
This level of conglomerates is found at the top of the
Pliocene – Quaternary sedimentary rocks. Other conglom-
erate levels in this unit are also aquifers that sometimes are
exploited. The piezometric level of the deep aquifer is high
(Fig. 2), typically situated a few metres below ground level,
and completely saturating most of the surface sediments.
The recent sediments, or materials that constitute the
surface aquifer, are the most compressible in the zone. They
consist of a layer of medium to soft sediments, susceptible
to suffering consolidation due to variations (increases) in the
effective stresses acting on them. On the contrary, the
underlying conglomerates and marls are more rigid and
represent the geotechnical substratum of the zone, used as
the support level for deep foundations. Because of their
rigidity, no significant deformations due to effective stresses
increase are expected (Martınez et al., 2004).
3. Previous investigations and available data
During the 1992–95 drought period, excessive pumping
of the deep aquifer caused an average decrease of 5 to 8 m in
the piezometric level of the deep aquifer (Fig. 3). Associated
with this decrease, there was an increase in effective stresses
in the subsoil, causing consolidation of the clayey/silty
surface sediment layers. At surface level, this consolidation
became apparent with large areas of the metropolitan area

Fig. 2. Schematic geological cross section of the Vega Media of the Segura River (based on Aragon et al., 2004). (See location in Fig. 1).
R. Tomas et al. / Remote Sensing of Environment 98 (2005) 269–283272
Murcia suffering land subsidence. More than 300 complaints
were received, and more than 150 buildings and other
structures (sidewalks, roads, walls, etc.) suffered moderate
damage (Fig. 3). This was the first time that land subsidence
due to aquifer overexploitation had been noticed in an urban
area in Spain on such a scale, so no quantitative data about
ground vertical movements is available for this period. Later,
the Regional Government requested a field study of ground
movement, involving geotechnical surveys, field instrumen-
tation (extensometers) and topographical surveys.
The published data available consists of the results of
numerical modelling of ground consolidation due to low-
ering of the piezometric level (Fig. 4) and experimental
ground deformation measured with extensometers (Table 1
and Fig. 5) for a short period (Feb/2001–Dec/2003).
Meteorological data (accumulated rain) and time evolution
of the piezometric level of the deep aquifer (from 1972 up to
present) are also available (Fig. 3).
De Justo and Vazquez (1999) and Vazquez and De Justo
(2002) studied the consolidation process by means of one-
dimensional consolidation models. Advanced numerical
modelling of soil consolidation was carried out by Rodrıguez
Ortiz and Mulas (2002) and Martınez et al. (2004), using a
geotechnical model of the Vega Media which took into
account vertical and horizontal changes in soil stratigraphy
and its mechanical properties. This model was created from
several dozen geotechnical boreholes and undisturbed soil
samples that were tested. The results of this model show that,
for a 10 m lowering in the piezometric level, ground
settlement typically varies between 2 and 4 cm in the
downtown city of Murcia, while it is greater than 6 cm in
surrounding areas (Fig. 4). There is not a good correlation
between the results of this model and the distribution of
damage (Rodrıguez Ortiz & Mulas, 2002).
In 2001, 22 extensometers were installed in four areas of
maximum theoretical settlement (south and southeast of the
city). The results are shown in Table 1 (Peral et al., 2004). In
the aforementioned period, the piezometric level shows a
downward trend, superimposed on typical annual cyclical
changes, although absolute variations vary depending on the
area. Whatever the case, a small subsidence (between 4 and
14 mm) was detected, in agreement with such changes in
piezometric level.
4. Advanced DInSAR applied to the Murcia subsidence
study
The data processing required to obtain ground displace-
ments from SAR imagery is summarized in this section. A
detailed description of the whole algorithm can be consulted
in Mora et al. (2003) and Mora (2004), but this summary is
included here for the sake of completeness.
4.1. General methodology
The differential interferometric phase (Dcint) obtained
by combining two complex SAR images can be expressed
as the sum of several terms (Hanssen, 2001; Mora, 2004):
Dcint ¼ Dcflat þ Dctopo þ Dcmov þ Dcatmos þ Dcnoise ð1Þ
where Dcflat is the flat-earth component related to range
distance differences in absence of topography, Dctopo is the
topographic phase, Dcmov is the phase contribution due to
ground displacement occurring between the two SAR image
acquisitions, measured along the line of sight (LOS), Dcatmos
is the phase component due to atmospheric disturbances or
artefacts, and, finally, Dcnoise includes the remaining noise
sources. The first two terms in Eq. (1) can be expressed
analytically. More specifically, Dcflat is assumed to be
known, and Dctopo can be extracted from an external DEM.
In this study, we have made use of the Coherent Pixels
Technique (CPT) algorithm (Mora, 2004), which assumes
that the phase component linked to deformation (Dcmov)

Fig. 3. (a) Evolution of piezometric level and (b) accumulated precipitations in the Vega Media of the Segura River. Piezometer locations are shown in Fig. 1
(c) Comparison between the number of complaint reports and the evolution of the piezometric level in the city of Murcia during the 1994–97 period (data from
Mulas et al., 2003 and Aragon et al., 2004).
R. Tomas et al. / Remote Sensing of Environment 98 (2005) 269–283 273
can be broken down, as shown in Eq. (2), into two new
phase terms, one due to linear deformation (Dclinear) and
another due to non linear deformation (Dcnon-linear).
Dcmov ¼ Dclinear þ Dcnon�linear
¼ 4pkIDmIT þ 4p
kIDqnon�linear ð2Þ
where k is the radar wavelength, Dm is the velocity
increment between pixels, T is the temporal separation
between both SAR acquisitions, and Dqnon-linear is the non-
linear term of the surface deformation.
.
The CPT application is divided into two main steps,
corresponding to the extraction of both linear and non-
linear components. Firstly, the retrieval of the linear term
includes the estimation of both the mean velocity
deformation and the DEM error. These are calculated by
adjusting a model function applied only over those pixels
of the scene that show good interferometric coherence over
time. The non-linear term is then estimated by applying
spatio-temporal filtering to extract the contribution of
atmospheric artefacts and the low and high-resolution
components of the non-linear deformation. Atmospheric
isolation is possible because of the different behaviour of
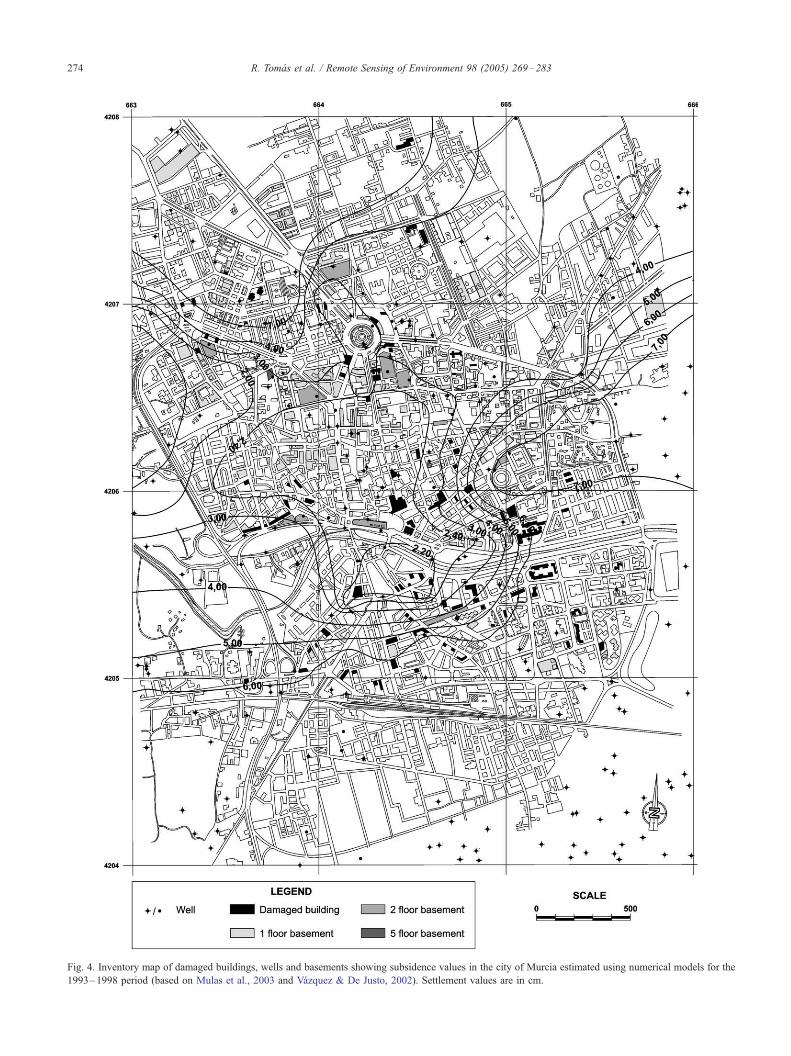
Fig. 4. Inventory map of damaged buildings, wells and basements showing subsidence values in the city of Murcia estimated using numerical models for the
1993–1998 period (based on Mulas et al., 2003 and Vazquez & De Justo, 2002). Settlement values are in cm.
R. Tomas et al. / Remote Sensing of Environment 98 (2005) 269–283274

R. Tomas et al. / Remote Sensing of Environment 98 (2005) 269–283 275
atmospheric artefacts in time and space with respect to
non-linear movement.
The retrieval of the deformation maps from SAR imagery
is a complex task involving several steps: image focusing
from the raw data, image co-registration and filtering for the
generation of the interferograms, proper calculation of
satellite orbits and the DInSAR processing itself previously
described. The complexity of the different steps involved in
the whole chain and the different processing conditions
(number of images available, baseline distribution, Doppler
differences, etc.) make it almost impossible to find a close
expression for evaluating the error budget of this technol-
ogy. From the results obtained using this technique with
different datasets (Lanari et al., 2004; Mallorquı et al., 2003;
Mora et al., 2003), comparing them with available ground-
truth, and looking at the oscillations in the deformation
pattern for stable zones, it can be assumed that the error in
estimating accumulated non-linear deformation is around T
Fig. 5. Average intensity map of the study zon
0.5 cm in the worst case. In contrast, the linear estimate is
more robust, as it comes from a model adjustment to all
available data, and can achieve a millimetric precision. In all
cases, the larger the number of images, the more precise the
results are for both linear and non-linear estimates. How-
ever, the error may have a strong dependence on the
conditions of the acquired images, and the most perturbing
elements are the atmospheric artefacts, which can be
coupled with the non-linear deformation.
4.2. Data set and processing details
A set of 28 SLC SAR images acquired by the
European Space Agency remote sensing satellites ERS-1
and ERS-2 between April 1993 and October 2004 has
been used in this study. An area of about 10�10 km was
selected from the images, corresponding to the urban area
of Murcia.
e showing the location of extensometers.

Table 1
Comparison between extensometric (Peral et al., 2004) and DInSAR measurements with indication of piezometric level variation (W: wire extensometer; I:
Incremental extensometer; NCP: Non Coherent Pixel; N/A: not available data)
Area Borehole Type Deformation (mm) Water level
decrease (m)Instrumental DInSAR
(2)
Difference
(1)�(2)Measured Projected along LOS (1)
Carmen V1 W � 17.0 � 15.6 NCP – � 8 to � 10
V2 W � 3.6 � 3.3 NCP –
V3 W � 4.8 � 4.4 � 6.8 2.4
Ei1 I � 1.9 � 1.7 NCP –
Patino V4 W N/A N/A – – � 8 to � 9
V5 W N/A N/A – –
V8 W � 11.5 � 10.6 NCP –
Ei2 I + 2.5 + 2.3 NCP –
Ei3 I � 8.3 � 7.6 � 5.2 � 2.4
Los Dolores V6 W � 19.8 � 18.2 NCP – � 3.5
V7 W N/A N/A – –
V9 W N/A N/A – –
V10 W � 3.1 � 2.9 NCP –
V11 W � 8.6 � 7.9 NCP –
V17 W � 14.0 � 12.9 NCP –
Ei4 I � 0.7 � 0.7 � 1.2 0.5
Ei5 I N/A N/A – –
Puente Tocinos V12 W � 6.0 � 5.5 � 3.4 � 2.1 � 1 to 4.5
V13 W � 18.2 � 16.8 � 4.8 � 12.0
V14 W � 4.5 � 4.1 � 3.2 � 0.9
V15 W � 2.8 � 2.6 NCP –
Ei6 I � 1.5 � 1.4 � 1.3 � 0.1
The locations of the extensometers are shown in Fig. 5.
R. Tomas et al. / Remote Sensing of Environment 98 (2005) 269–283276
All possible interferograms formed by pairs of
images were generated. Due to the multi-look factor
of 25�5 pixels (azimuth� range), the final resolution
has been degraded to 100�100 m. From the whole
Fig. 6. Linear velocity deformation map of the stud
set of interferograms, only those with a normal
baseline smaller than 50 m and a relative Doppler
centroid difference below 0.15 were chosen for the
algorithm.
y zone, superimposed on the intensity map.

R. Tomas et al. / Remote Sensing of Environment 98 (2005) 269–283 277
The external DEM used to cancel the topographic
component of the interferometric phase was the free
distribution DEM from NASA’s SRTM mission. This is an
approximately 90�90 m (3 s arc) global DEM with a
standard deviation in height of 10 m. With this DEM, all the
selected differential interferograms and their associated
coherence maps are computed. Fig. 5 shows the average
intensity map.
The first step of linear component retrieval is the
selection of the pixels with coherence higher than 0.3 in
more than 75% of the previously selected interferograms.
The pixels above this threshold, and with a minimum value
of 0.1, are triangulated by a Delaunay algorithm, but only
relating those pixels whose distance is lower than 1500 m,
assuming that atmospheric influence is the same for pixels
below that distance. All the details concerning this
processing can be consulted in Mora (2004). Fig. 6 shows
the linear velocity map obtained for the whole period
1993–2004.
This method provides all deformation components, so a
complete evolution of the deformation can be estimated for
every coherent pixel.
5. Results and discussion
This section aims to present and analyse the results
obtained with this technique. The values obtained have been
compared with piezometric changes, with available exten-
sometric deformation measures from 2001, with the
distribution of water extraction points and damaged build-
ings, and with an appropriate model, as explained in the
following sections.
5.1. Spatial and temporal evolution of settlement
Fig. 7 shows the evolution of the accumulated settle-
ments measured by DInSAR from April 1993 to October
2004, with a temporal step of one year approximately. From
1993–1995, deformations were almost inexistent, showing
a very slight subsiding area in the southwest of the city of
Murcia. Note that there are no images for 1994 due to the
operating mode of the ERS-1 satellite.
From 1995–97, the southwest area and a new subsiding
area located in the northeast of the city were gradually
affected by average settlements that exceeded 20 mm, with
typical settlement velocities of about 5–10 mm/year. This
was the most dramatic period.
From 1998 to 2004, vertical deformations mainly affected
the central part of the valley, corresponding to the zone
occupied by recent, unconsolidated sediments of the Segura
River. In this period, measured descending deformations are
less than 10 mm, with general velocity patterns of 2 mm/year.
On the contrary, two areas of the study zone remain with
almost no deformation until 2004. They are located towards
the northwest and the southeast of the city of Murcia. Both
areas are broadly located on quaternary alluvial fan (coarse,
low deformable, sediments) or older materials.
Note that total accumulated deformations were lower
than 10 cm in the whole 1993–2004 period.
5.2. Comparison with the piezometric level
In general, annual accumulated precipitations are closely
related with the piezometric level because rain infiltration
and irrigation overflow are the most important sources for
recharging the aquifer (Fig. 3). The historical piezometric
level evolution shows a stable situation over time, with only
small annual oscillations which never exceed 2–4 m (Figs.
3 and 8). During the prolonged periods with low precip-
itations, water extractions in authorized drought-wells and
illegal wells from deep aquifer increase notably, while
infiltrations decrease. The consequence is a fall in the
piezometric whose effects have been observed during the
major droughts of 1980–83 and 1992–95 (Fig. 3). The
drought in the 80’s led to piezometric falls of over 5 m
during 1983 in the Segura Valley. However, there is no
information (complaints) concerning ground subsidence
during this period. The 1992–95 drought caused a
generalized lowering of 8 m (Vazquez & De Justo, 2002),
with maximum values exceeding 15 m.
The temporal evolution of DInSAR measured ground
deformations shows a good correlation with piezometric
level changes of the deep aquifer. Analysis of these results
has allowed the identification of three main patterns of
ground surface behaviour for the study zone during this
period. Fig. 8 shows the relationship between DInSAR
measured surface deformation and the piezometric level for
five representative sites (Fig. 8). Sites A and D are located
in the city of Murcia, on recent, deformable sediments (20 m
layer of recent clays situated over conglomerates). Site B is
located near the Carrascoy mountain, over alluvial fan
sediments (mostly gravels and sand with layers of sandy
silts). Site E is situated on old (Pleistocene) silty clays and
clayey silts lying over tertiary shales and, finally, site C is
located in the very south of the study zone, on clays
interbedded with levels of sand and gravel.
Ground deformation was fast in sites A and D during the
piezometric level lowering occurring between 1993 and
1995, and did not stop until the piezometric level of the
aquifer completely recovered its previous level in 1997.
This can be interpreted as deformation occurring while
ground conditions remain altered. Later, the piezometric
level remains almost constant, presenting only small
seasonal fluctuations of a few metres, and showing a
general downwards trend. The consequent deformations
show only slow velocities for this period. These behaviours
have been observed in the city of Murcia, and are more
representative in the southern zone of the city.
Sites B and E show different behaviour to the previous
ones. They are located on older and less compressive
materials. Although variations in piezometric level are

Fig. 7. Evolution of accumulated deformation in the study area. Results from April 14, 1993.
R. Tomas et al. / Remote Sensing of Environment 98 (2005) 269–283278
similar to that observed in the centre of the valley,
here settlements reach only a few millimetres. They are
greater at point E point than at point B because the thickness
of the compressive materials is higher (Fig. 8). It can be
observed that only five metres of compressive materials are
affected by piezometric level changes at site B, thus
explaining the low deformation for the corresponding pixel
measured with DInSAR. The results of these sites can be
considered as representative of the behaviour of areas
located on non-deformable materials, corresponding to
lithologies of the substratum basin, alluvial fans located
near high relief features, and old basin filling materials.

R. Tomas et al. / Remote Sensing of Environment 98 (2005) 269–283 279
Settlements measured at site C exhibit a new overall
behaviour, which is observed in the southwest area of the
study zone. In this case, ground deformation mimics
piezometric level changes. Once the piezometric level
started to recover, the surface rose too. It might be explained
by the presence of expansive materials in the more super-
ficial layers, which expand when the moisture content
increases. The existence of swelling in this part of the basin
is documented (Cartomur, 2004), and some recommenda-
tions are provided by regional authorities about require-
ments of geotechnical studies made for civil engineering
purposes in this zone (COPOT, 2001).
Other isolated points of the study area show irregular
behaviour not apparently related to piezometric level changes.
Fig. 8. a. Comparison between the evolution of the piezometric level and settlemen
deformation measurements in 2001. See location of piezometers and lithologica
description of piezometric boreholes.
5.3. Comparison with available extensometric measures
Borehole extensometric data provide only a few measure-
ment points situated in the South and East perimetre areas of
the city. These data show deformation varying between
�0.73 and �19.8 mm, with only one uplift value of + 2.5
mm, and an average value of �8 mm (Table 1). Only seven
points with extensometric measurements have been consid-
ered in this paper for comparison purposes, because the
remaining ones did not correspond to coherent pixels.
An acceptable relationship between both sets of data can
be observed by comparing these borehole extensometric
deformation data values, obtained between February 2001
and December 2003 and projected over the Line of Sight
t measured by DInSAR during the period 1993–2004. Note the absence o
l composition of the subsoil in Fig. 8b. Fig. 8b. Location and lithologica
f
l

Fig. 8 (continued).
R. Tomas et al. / Remote Sensing of Environment 98 (2005) 269–283280

R. Tomas et al. / Remote Sensing of Environment 98 (2005) 269–283 281
(LOS), with DInSAR settlements (which are measured
along LOS) between December 2000 and November 2003,
(Table 1). The absolute differences are smaller than 2.4 mm,
except for the V13 wire extensometer which differs from its
DInSAR value by 12 mm.
On the other hand, the differences observed can be
partially explained by different thickness of the deformable
soil columns monitored by each technique. Extensometers
measure only the deformation (subsidence or uplift) occur-
ring along the soil column traversed by the device (between
0 and 10 or 22 m below land surface), not detecting any
compaction or expansion of the sediments occurring at
greater depths. The DInSAR technique, however, measures
surface deformation — this being the whole soil column
deformation.
Another important source of discrepancy between both
methods can be explained by the size of the pixel. The
DInSAR deformation used corresponds to the dominant
elements (with more reflectivity) located inside the
100�100 m pixel. So, when deformation is not uniform
inside the pixel, point extensometric data is different to that
measured with DInSAR techniques for the whole pixel.
Extensometers offer an instrumental on-site technique
that can be used in both urban and rural environments. They
only need a borehole to be installed. However, the CPT
technique provides better results in urban areas where
coherence remains constant over time. As a result, the joint
use of extensometers (or other on-site techniques such as
topography, GPS, etc.) which provide good results with
quality and precision in rural environments, and DInSAR
techniques, whose results are optimum for urban areas,
allows us to monitor the deformations produced in the study
area while complementing each other.
5.4. Comparison with modelled deformations and damage
distribution during the 1992–95 drought period
As previously stated (Fig. 4), Rodrıguez Ortiz and Mulas
(2002) and Martınez et al. (2004) carried out numerical
modelling of ground consolidation for a 10 m lowering of
the water table in this zone (slightly greater than that
observed during the 1992–95 drought period). Their results
show that maximum settlements should be expected towards
the south/southeast and northwest of the city, with max-
imum computed settlements of over 6 cm. We have
compared these results with DInSAR-measured settlements
for the 1993–1997 period (Fig. 7, upper right corner),
which corresponds to an interval during which ground was
being deformed as a consequence of the water table
lowering produced during the 1992–1995 drought period.
This is the effect of the above-mentioned delay between the
periods of variation in water table position and the periods
of ground deformation.
When comparing these two figures, we can see that a
certain correlation exists in the south and east areas of the
city, where DInSAR deformation is about 2–3 cm (depend-
ing on the site), although these value are approximately half
the numerical (theoretical) deformation. These differences
can be explained by the simplifications made during
numerical computing and because the numerical model
was based on a piezometric level lowering higher than that
occurring in reality. On the contrary, towards the NW of the
city, the DInSAR measured deformation is negligible, which
greatly contrasts with the 7 cm predicted by the numerical
models.
Fig. 4 also shows the distribution of damaged buildings
in Murcia (presumably caused by the piezometric level
lowering during the 1993–95 drought period) and the
location of pumping wells and basements. Most of the
damaged buildings are situated on the subsiding areas.
However, there is no direct relationship between higher
subsidence values and the severity (even frequency) of
damage, because it depends on the construction quality of
the buildings, the kind of foundation used, and the unique
features of the terrain beneath the foundations. It means that
many structures sited in areas highly affected by ground
settlement did not show any damage whereas others in areas
with smaller ground settlement suffered severe damage. The
distribution of damage in Murcia City thus seems to be
erratic. According to Rodrıguez Ortiz and Mulas (2002),
only 35% of the complaints (damage) could be clearly
related to ground subsidence. Finally, there is no clear direct
relationship between water extraction points (wells and
basements) and ground subsidence. Fig. 4 shows the high
number of water extraction points located in the city, but no
correspondence with DInSAR measured deformations. This
fact can be explained because ground subsidence only
occurs when the volume of withdrawals is high enough to
depress the piezometric level, which does not always occur,
and the magnitude of settlement reflects the magnitude of
the piezometric level lowering, which varies according to
the volume pumped out.
6. Conclusions
CPT (an advanced DInSAR technique) has been used to
present an analysis of ground subsidence due to over-
exploitation of an aquifer during the 1993–95 years (and
subsequent periods) in the metropolitan area of Murcia (SE
Spain). This technique has shown itself to be very useful for
this purpose, with high quality results for a wide area at low
cost.
The principal advantage of applying this technique to the
Vega Media of the Segura River is that the spatial
distribution and real magnitude of the consolidation process
can be studied for a period with no instrumental data. This is
because subsidence was not detected until the first damaged
appear in some of the city’s buildings in 1996, with some
delay with respect to falls in piezometric level, meaning
there was no instrumental record of subsidence until 2001.
DInSAR, by means of the post-processing of available SAR

R. Tomas et al. / Remote Sensing of Environment 98 (2005) 269–283282
images, has delivered ground surface subsidence values
from 1993 to 2004, providing improved knowledge of the
subsoil consolidation process mechanisms, as well as
settlement distribution and velocities. These results are a
great advantage because they provide better knowledge of
the behaviour of the medium, with implications on the
calibration of models.
Subsidence has been widespread in the study zone during
the period 1993 – 2004, with settlements ranging from 2 to
8 cm. Only the borders of the valley, constituted by old
materials (tertiary and basin basement) did not suffer any
deformation. In this context, the relationship between the
distribution of recent, more deformable, sediments and areas
of greater deformation has been shown. These results are in
close agreement with those from extensometers, and they
have the advantage of covering a continuous wide area
instead of the point-based extensometer data.
The comparison of these results with available data in
this zone for the period in question has allowed us to
establish that the ground surface deforms not only during
piezometric level depression, but also during humid periods
until the piezometric level reaches its previous position. As
a consequence, a delay in the end of settlement is observed.
This fact is of prime importance when dealing with this
geotechnical hazard, because this means that it will continue
in time, even if the trigger mechanism (excessive pumping)
suddenly ceases.
In the future, the joint use of on-site techniques (e.g.
topography, extensometers, GPS, etc.) in rural areas (non-
coherent) and DInSAR in urban areas (highly coherent), will
allow us to monitor possible deformations produced in the
whole Vega Baja of the Segura River by complementing
each other.
Acknowledgements
The SAR images used in this work were provided by
European Space Agency (ESA) in the framework of the EO
Cat.1-2494 project. This study was partially financed by the
Spanish Ministery of Science and Technology and FEDER
as part of projects TIC2002-04451 and BTE2002-12456-E,
and by the Valencia Regional Government as part of
projects GV04B/556 and GRUPOS03/085. The DEM used
in this work is the result of the SRTM (Shuttle Radar
Topography Mission) mission of NASA. Finally, EMUASA
and IGME kindly provided piezometric data.
References
Aragon, R., Garcıa-Arostegui, J. L., Lamban, J., Hornero, J., & Fernandez-
Grillo, A. I. (2004). Impacto de la explotacion intensiva de aguas
subterraneas en la ciudad de Murcia (Espana). Analisis hidrogeologico.
Proc. XXXIII Congress of IAH-ALHSUD, Zacatecas, Mexico. Confer-
ence on groundwater flow understanding from local to regional scales
(pp. 2622–2624).
Berardino, P., Fornaro, G., Lanari, R., & Sansosti, E. (2002). A new
algorithm for surface deformation monitoring based on small baseline
differential SAR interferograms. IEEE Transactions on Geoscience and
Remote Sensing, 40, 2375–2383.
Cartomur. (2004). http://www.cartomur.com
Ceron, J. C., & Pulido, A. (1996). Groundwater problems resulting from
CO2 pollution and overexploitation in Alto Guadalentın aquifer
(Murcia, Spain). Environmental Geology, 28, 223–228.
Colesanti, C., Ferreti, A., Prati, C., & Rocca, F. (2001). Comparing GPS,
optical levelling and permanent scatterers. Proc. IGARSS’01, Sydney,
Australia. IEEE Intl. Geoscience and Remote Sensing Symposium, vol. 6
(pp. 2622–2624).
COPOT. (2001). Guıa de Planificacion de Estudios Geotecnicos en la
Region de Murcia. Boletın Oficial de la Region de Murcia, 255,
14933–15026.
De Justo, J. L., & Vazquez, N. J. (1999). Subsidencia en Murcia. (I)
Soluciones explıcitas para el asiento unidimensional. Ingenierıa Civil,
115, 13–27.
Ferretti, A., Prati, C., & Rocca, F. (2000). Nonlinear subsidence rate
estimation using permanent scatterers in differential SAR interfer-
ometry. IEEE Transactions on Geoscience and Remote Sensing, 38,
2202–2212.
Ferretti, A., Prati, C., & Rocca, F. (2001). Permanent scatterers in SAR
interferometry. IEEE Transactions on Geoscience and Remote Sensing,
39, 8–20.
Galloway, D. L., Hudnut, K. W., Ingebritsen, S. E., Philips, S. P., Peltzer,
G., & Rogez, F., et al. (1998). Detection of aquifer system compaction
and land subsidence using interferometric synthetic aperture radar,
Antelope Valley, Mojave Desert, California. Water Resources Research,
34, 2573–2585.
Gumiel, J. C., Garcıa-Arostegui, J. L., Hornero, J., Aragon, R., Fabregat,
V., & Fernandez-Grillo, A. I., et al. (2001). Evaluacion mediante
teledeteccion de superficies agrıcolas y estimacion de demandas de
agua en la Vega Media del Segura (Murcia). VII Simposio de
Hidrogeologıa. Hidrogeologıa y Recursos Hidraulicos, Madrid, Spain,
vol. XXIII (pp. 71–81).
Hanssen, R. F. (2001). Radar interferometry. Data interpretation and error
analysis. The Netherlands’ Kluwer Academic Publisher. 308 pp.
Hu, R. L., Yue, Z. Q., Wang, L. C., & Wang, S. J. (2004). Review on
current status and challenging issues of land subsidence in China.
Engineering Geology, 76, 65–77.
Lanari, R., Mora, O., Manunta, M., Mallorquı, J. J., Berardino, P., &
Sansosti, E. (2004). A small Baseline DIFSAR approach for investigat-
ing deformations on full resolution SAR interferograms. IEEE Trans-
actions on Geoscience and Remote Sensing, 7, 1377–1386.
Mallorqui et al. (2003). CPT: Development of algorithms for the
exploitation of ERS-ENVISAT using the Coherent Pixels Technique
(ESA), Contract No. 17584/03/I-LG OT: 911584.
Martınez, M., Mulas, J., Herrera, G., & Aragon, R. (2004). Efectos de una
subsidencia moderada por extraccion de agua subterranea en Murcia,
Espana. Proc. XXXIII Congress of IAH-ALHSUD, Zacatecas, Mexico.
Conference on Groundwater Flow Understanding from local to
regional scales (pp. 249–252).
Montenat, C., Ott d’Estevou, P., & Coppier, G. (1990). Les basins
neogenes entre Alicante et Cartagena. Doc. Et Trav. IGAL, vol. 12–13
(pp. 313–368).
Mora, O. (2004). Advanced differential SAR techniques for detection of
terrain and building displacements. Ph.D. Thesis, Polytechnic Univer-
sity of Catalonia, 182 pp.
Mora, O., Mallorquı, J. J., & Broquetas, A. (2003). Linear and nonlinear
terrain deformation maps from a reduced set of interferometric SAR
images. IEEE Transactions on Geoscience and Remote Sensing, 41,
2243–2253.
Mulas, J., Aragon, R., Martınez, M., Lamban, J., Garcıa-Arostegui, J. L.,
& Fernandez-Grillo, A. I., et al. (2003). Geotechnical and hydro-
logical analysis of land subsidence in Murcia (Spain). Proc. 1a
International Conference on Groundwater in Geological Engineering,

R. Tomas et al. / Remote Sensing of Environment 98 (2005) 269–283 283
RMZ-M and G, Materials and Geoenvironment, Bled, Slovenia, vol. 50
(pp. 249–252).
Peral, F., Rodrıguez, A., & Mulas, J. (2004). Control of subsidence with
borehole extensometers and surveying measurements in Murcia (Spain).
Proceedings ISC-2 on Geotechnical and Geophysical Site Character-
ization, Rotterdam, Holland (pp. 1171–1176).
Rodrıguez Jurado, J., Martınez Corbella, M., Mulas, J., & Rodrıguez Ortiz,
J. M. (2000). Establecimiento de un modelo geologico para el estudio
de la subsidencia por rebajamiento del nivel freatico. Geotemas, 1,
155–158.
Rodrıguez Ortiz, J.M. and Mulas, J. (2002). Subsidencia generalizada en la
ciudad de Murcia (Espana). In Ayala Carcedo, J. and Olcina Cantos
Coords., Riesgos Naturales (pp. 459–463). Barcelona: Editorial Ariel.
Vazquez, J. N., & De Justo, J. L. (2002). La subsidencia en Murcia.
Implicaciones y consecuencias en la edificacion. Murcia’ Ed. COPOT.262 pp.