mapping headwater streams in north carolina quality/surface... · 300 c o ntr i bu t i n g d r ai...
TRANSCRIPT

10/1/2007 NC Water Quality
Mapping Headwater Streamsin
North Carolina
North Carolina Division of Water QualityNorth Carolina State UniversityNorth Carolina Department of Transportation

10/1/2007 NC Water Quality
Background
Problem: Existing Maps Inaccurate and InconsistentCritical to NC Division of Water Quality 401 program and other public agencies and private sector
Tributaries shown on one map and not the other
Headwater stream shown on one map and not the other
Solution: Make better mapsTake advantage of state-wide LiDAR (LIght Detection And Ranging) coverageStream Mapping Project began early 2004 (NCDWQ, NCSU, NCDOT)

10/1/2007 NC Water Quality
Approach
•Use LiDAR data acquired from the NC Floodplain Mapping Program to create new topographic maps
•Conduct field identification and mapping of intermittent and perennial streams and their origins in headwater areas
•Conduct spatial analysis using GIS data and field data
•Use field data and other GIS data to create predictive models of streams and origins
10/1/2007 NC Water Quality
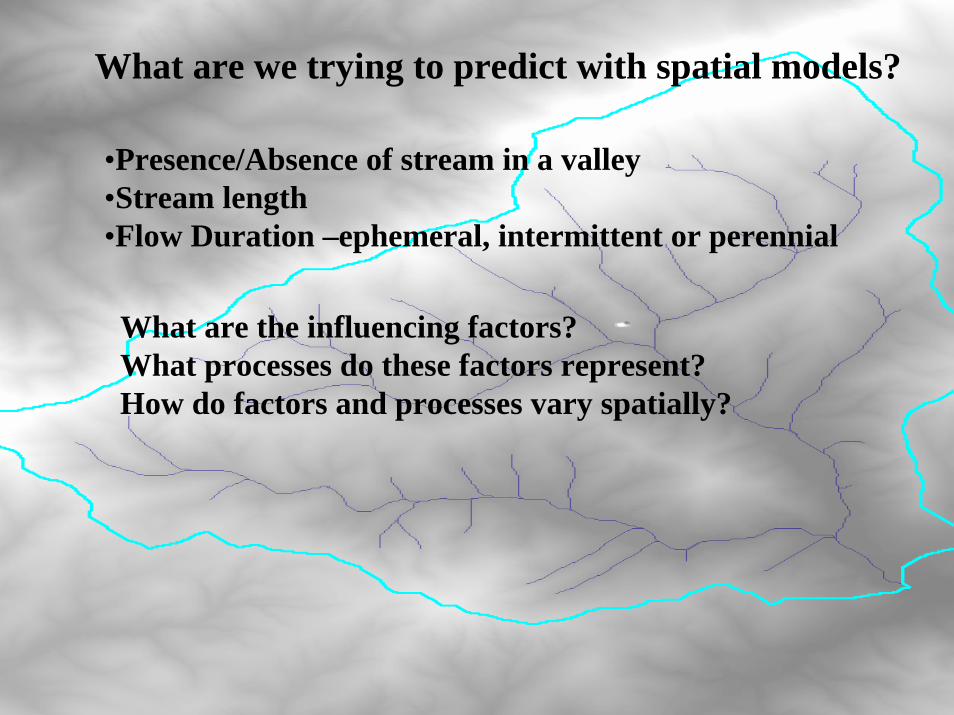
What are we trying to predict with spatial models?
•Presence/Absence of stream in a valley•Stream length•Flow Duration –ephemeral, intermittent or perennial
What are the influencing factors?What processes do these factors represent?How do factors and processes vary spatially?

10/1/2007 NC Water Quality
Methods: Field Data
•Walk streams
•Locate Origins
•Determine flow regime (DWQ Stream ID, 2005 )
•GPS origins (sub-meter accuracy)
http://h2o.enr.state.nc.us/ncwetlands/regcert.html

10/1/2007 NC Water Quality
Methods: GIS Data
Create Digital Elevation Models (DEMS)
•Generate Terrain Derivatives
•Acquire existing GIS Data, ex. Soils, geology…
Spatial patterns and analysis

10/1/2007 NC Water Quality
•23 watersheds•600 + origins

10/1/2007 NC Water Quality
Little Creek, Yadkin BasinStanley County, North Carolina
Streams
IntermittentPerennial
Origins
High : 230
Low : 169
Elevation (ft)

10/1/2007 NC Water Quality
Variables used (or to be used) in Analysis
•Level IV Ecoregion•Local Slope•Average Slope•Contributing Drainage Area•Local Curvature, profile and plan•Average Upslope Curvature, profile and plan•Soils•Geology•Land use•Indices (roughness, stream power…)

10/1/2007 NC Water Quality
General Description
Ephemeral to intermittent 46 %Intermittent to perennial 36 %Ephemeral to perennial (all mtns) 14 %Other, wetlands and modified 8 %
does not include outer coast
First order intermittent stream lengthmountains 33 %piedmont 22 %inner coast plain 32 %outer coast plain 56 %
44 origins/1 site
*Data for 21 sites, 542 origins
10/1/2007 NC Water Quality
0
0 .1
0 .2
0 .3
0 .4
0 .5
Aver
age
Slop
e
Car
olin
a
Slat
e Be
lt-A
Car
olin
a
Slat
e Be
lt-B
East
ern
Blue
Rid
ge F
ooth
ills
Nor
ther
n
Out
er P
iedm
ont
Rol
ling
Coa
st P
lain
Tria
ssic
Basi
n
Intermittent
0
0 .1
0 .2
0 .3
0 .4
0 .5
0 .6Av
erag
e Sl
ope
Car
olin
a
Slat
e Be
lt-A
Car
olin
a
Slat
e Be
lt-B
East
ern
Blue
Rid
ge F
ooth
ills
Nor
ther
n
Out
er P
iedm
ont
Rol
ling
Coa
st P
lain
Tria
ssic
Basi
n
Perennial
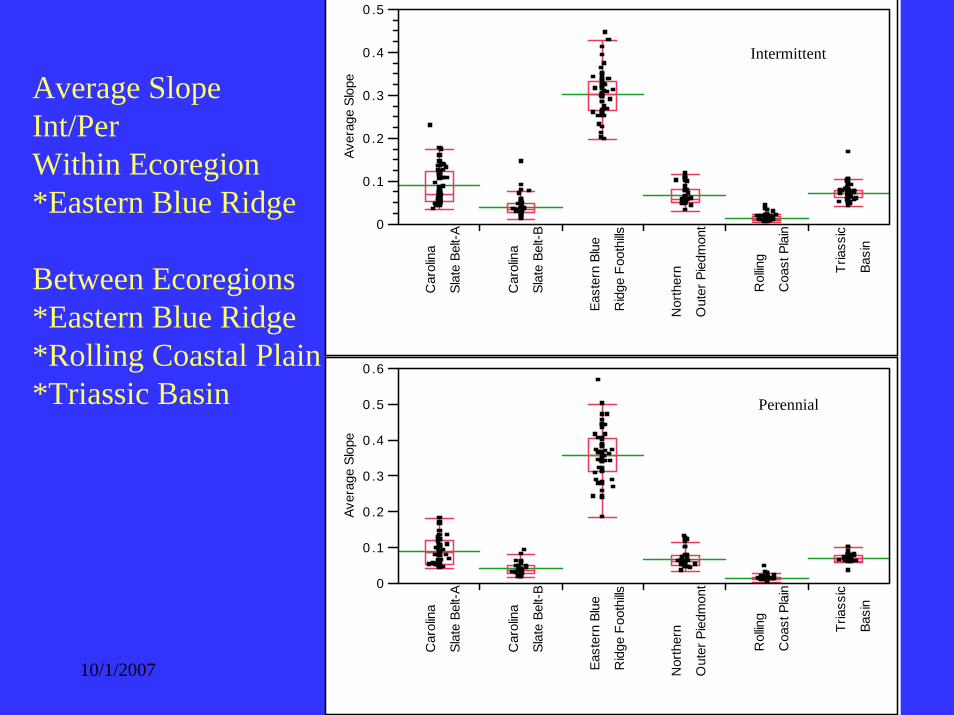
Average Slope Int/Per Within Ecoregion*Eastern Blue Ridge
Between Ecoregions*Eastern Blue Ridge*Rolling Coastal Plain*Triassic Basin

10/1/2007 NC Water Quality
0.01
0.10.04
10.4
104
10040
300
Con
tribu
ting
Dra
inag
e Ar
ea (a
cres
)
Car
olin
a
Slat
e Be
lt-A
Car
olin
a
Slat
e Be
lt-B
East
ern
Blue
Rid
ge F
ooth
ills
Nor
ther
n
Out
er P
iedm
ont
Rol
ling
Coa
st P
lain
Tria
ssic
Basi
n
Intermittent
0.1
10.5
0.2
1053
1005030
200
400
Con
tribu
ting
Dra
inag
e Ar
ea (a
cres
)
Car
olin
a
Slat
e Be
lt-A
Car
olin
a
Slat
e Be
lt-B
East
ern
Blue
Rid
ge F
ooth
ills
Nor
ther
n
Out
er P
iedm
ont
Rol
ling
Coa
st P
lain
Tria
ssic
Basi
n
Perennial
Contributing Drainage Area Int/Per Within EcoregionAll exceptEastern Blue Ridge &Group B-Slate Belt
Between Ecoregions*Rolling Coastal Plain*Triassic & Eastern BR*Slate Belt & N. Outer Piedmont

10/1/2007 NC Water Quality
-0.05
0
0.05
0.1
0.15
0.2
0.25
0.3
0.35
Slop
e R
ange
(ft/f
t)
1007050403020 200 300 400 500 700
relief (ft)
Landscape Process…..
Trend Plots Average Slope and Contributing Drainage Area against Topographic Relief by Site
1
106
4
2
1006040
20
200
300
500
Dra
inag
e Ar
ea R
ange
(acr
es)
1007050403020 1000700500400300200
relief (ft)
Range (max-min)
Avg Slope Relief
Drainage Area Relief

10/1/2007 NC Water Quality
Distribution of Intermittent and Perennial Origin Contributing Drainage Area (acres)
Carolina Slate Belt-A
Carolina Slate Belt-B
Eastern Blue Ridge Foothills
Northern Outer
Piedmont
Rolling Coastal Plain
Triassic Basin
int per int per int per int per int per int per
Min 0.20 0.72 0.05 2.04 0.23 0.24 1.55 2.54 0.16 7.16 0.10 0.13
10% 1.47 7.53 0.77 2.39 2.17 1.02 1.80 4.07 7.52 10.76 1.24 1.89
25% 2.85 11.58 4.89 9.52 3.72 2.91 4.48 10.05 11.15 28.82 1.95 3.27
50% 7.36 15.99 23.80 37.50 4.60 4.98 8.82 16.18 25.67 84.00 3.70 6.85
Mean 11.20 23.74 50.86 60.85 5.16 5.27 12.72 20.52 40.66 95.59 5.11 10.40
75% 14.47 35.40 69.96 68.16 6.34 7.04 15.06 27.11 55.15 122.00 7.16 15.79
90% 27.39 43.33 142.41 187.26 8.16 9.81 22.99 41.31 101.33 217.34 11.87 27.80
Max 74.63 107.00 322.27 328.28 14.60 15.85 115.95 64.81 173.65 343.66 16.51 32.49

10/1/2007 NC Water Quality
Much to be Done!