mapping maritime activities within the baltic sea
TRANSCRIPT

Mapping maritime activitieswithin the Baltic Sea
OCTOBER 2016
AUTHORS OF THIS REPORT
Editor
Florent Nicolas HELCOM
Manuel Frias HELCOM
Hermanni Backer HELCOM
Acknowledgements
It has been a long and sometimes painful journey but thanks to some helpful people we managed till the end. The people at the Finnish Environment Institute (SYKE) provided the first tips on how to handle big data. The interviews we carried out to AIS data managers were very useful to start defining what software and hardware to use. Especially, Professor Emeritus Anders Grimval gave insightful advice. Jukka-Pekka Jalkkanen, form the Finnish Meteorological Institute (FMI), was always ready to answer any question despite his tight agenda. Adri Fluit and Omar Frits Eriksson from the Danish Maritime Authority (DMA) delivered data diligently and never tired of our requests. Finally, thanks to the members of the HELCOM AIS Expert Group.
Disclaimer: The contents and conclusions in this report, including the maps and figures, were developed by the participating project partners and related experts with the best available knowledge at the time. They do not necessarily reflect the respective national governments’ positions and are therefore not binding.
HELCOM data can be used freely for non-commercial purposes. Users are requested to cite HELCOM as the data source when using downloaded datasets in publications.

Introduction 6
Section I: Shipping density 7 AIS data preparation 8
Step 1 Preparing raw data 10
Step 2 Data cleaning 11
Step 3 Sorting the selected AIS data by month 13
Step 4 Updating ship information 13
From AIS data to Density maps 14
Step 5 Defining a grid 16
Step 6 From points to Lines 17
Step 7 Making maps 18
Section II Fisheries activities and renewable energy 23 Fisheries MAPS—VMS and AIS 24
Mapping Offshore windfarms 25
Annex 1: Results of AIS users interviews 26
Annex 2 30
TABLE OF CONTENTS

4 | Mapping maritime activities - within the Baltic Sea

Mapping maritime activities - within the Baltic Sea | 5
INTRODUCTION&
SECTION I: SHIPPING DENSITY

6 | Mapping maritime activities - within the Baltic Sea
INTRODUCTION
The goal of Baltic Scope is to create common cross-border planning solutions in two areas in the south of the Baltic Sea—the southwest and central Baltic cases. In a transboundary MSP activity like SCOPE, planners need to come up with solutions that are coherent across borders and, among other things, need to analyze shipping movements and other maritime activities.
This document describes HELCOM Secretariat actions in mapping maritime activities for the purposes of the SCOPE project. It is divided into Section I - on mapping shipping density - and Section II - on mapping fishery activities and renewable energy.

Mapping maritime activities - within the Baltic Sea | 7
SECTION I: SHIPPING DENSITY
Maps of shipping traffic density - highlighting the intensity of total, and segmented, ship traffic at a given time - are a key GIS product on maritime activities necessary for MSP purposes. Section I covers the key steps undertaken to create shipping density maps from quality controlled Automatic Identification System (AIS) data.
This data is generated by transmissions from AIS transmitters/receivers, which according to the IMO SOLAS convention are now obligatory on board all larger vessels operating around the world. AIS equipment is also increasingly used on a voluntary basis by many other vessels, including leisure and fishing vessels.
So far, shipping density maps have been produced by national authorities using AIS data but usually with only fragmentarily documented methodology, within limited national areas and using data covering only a limited time span.
A key task of the HELCOM Secretariat within the SCOPE project has thus been to create AIS based shipping traffic density maps for the entire planning area by using all available time series – and for this purpose to create and implement a consistent and thoroughly documented methodology.
This work has been enabled by the existence of the historic dataset of AIS data from national authorities, collected, in temporally down sampled form, for the whole Baltic Sea area by the HELCOM AIS network since 2005. Even if the participating coastal countries (Denmark, Estonia, Finland, Germany, Latvia, Lithuania, Poland, Russia and Sweden) have access to more high definition AIS data from their own waters the HELCOM AIS dataset remains the world’s longest time series of AIS covering an entire region.
This Baltic-wide HELCOM AIS dataset has over the years been used for several regional activities, for example for improving navigation safety (e.g. risk analysis of regional shipping accidents carried out by HELCOM BRISK, 2012), emissions from ships (e.g. regional ship emission inventories compiled by the Finnish Meteorological Institute for HELCOM MARITIME) or mapping underwater noise (e.g. noise mapping under the BIAS project).
The HELCOM Secretariat activities within SCOPE have amounted to the first time the full potential of the regional AIS dataset has ever been used in mapping shipping density in the entire southern part of the Baltic Sea.
As part of its activities HELCOM Secretariat developed methodology described in this report, as well as produced and delivered the following AIS based shipping density maps by year:
l 2014: All ship types, Cargo, Passenger, Tanker, Change over month, Fishing, All ship types except fishing
l 2013: Cargo, Tanker. Ship length (IMO, non-IMO A, non IMO B)
l 2012: Cargo, Passenger, Tanker
l 2009: Cargo, Passenger, Tanker
l 2006: Cargo, Passenger, Tanker
Both PDF maps and GIS files in raster format were delivered. These maps, created for SCOPE, can also be viewed via the AIS map explorer tool, developed by the HELCOM Secretariat with funding from other projects.
First of all we will fully explain the data handling practices used to generate a harmonized dataset of AIS data in the Baltic Sea. We will then explain how to generate shipping traffic density maps from the harmonized AIS dataset.
8 | Mapping maritime activities - within the Baltic Sea
AIS DATA PREPARATION
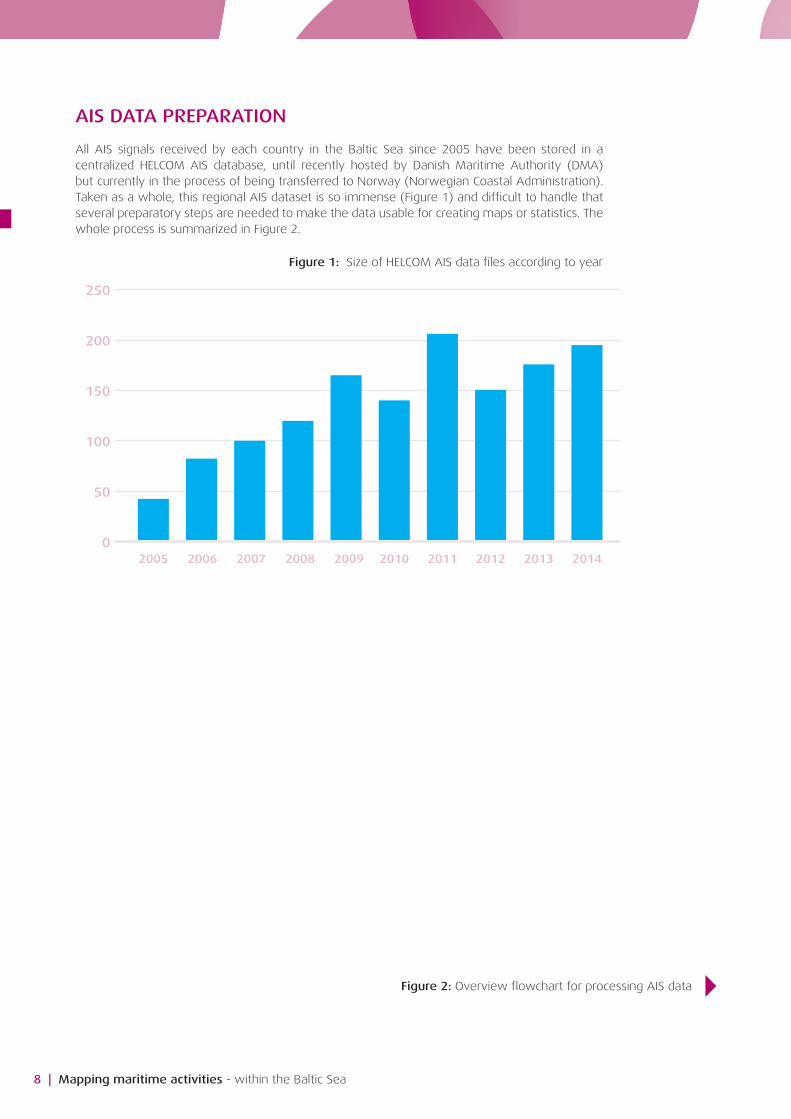
All AIS signals received by each country in the Baltic Sea since 2005 have been stored in a centralized HELCOM AIS database, until recently hosted by Danish Maritime Authority (DMA) but currently in the process of being transferred to Norway (Norwegian Coastal Administration). Taken as a whole, this regional AIS dataset is so immense (Figure 1) and difficult to handle that several preparatory steps are needed to make the data usable for creating maps or statistics. The whole process is summarized in Figure 2.
Figure 2: Overview flowchart for processing AIS data
Figure 1: Size of HELCOM AIS data files according to year
0
50
100
150
200
250
2005 2006 2007 2008 2009 2010 2011 2012 2013 2014

Mapping maritime activities - within the Baltic Sea | 9
Data in yearlydecoded CSV files
2008
Data in dailycoded (raw) text files
Decode/convert to CSV and merge in yearly files
2014Monthly filesin CSV format
Monthly files with updated info
List with uniqueships per year
2014Updated list withunique ships per year
Information fromVessel Finder
AIS data from DMA
Clean
JANFEB
Make density maps Statistics
JANFEB
2014
STEP 1
STEP 2
STEP 3

10 | Mapping maritime activities - within the Baltic Sea
HARDWARE SET UP
Following interviews with AIS data users (Annex I), we decided to work with the data on a dedicated server available through remote access with the following specifications: Intel Xeon E5-2630 0 @ 2,30GHz 10 cores with 48 GB RAM. This server allows several persons to work at the same time.
STEP 1 PREPARING RAW DATA
The AIS data was delivered by the 2005-2016 HELCOM AIS data host DMA as both decoded and raw data (NMEA sentences). Decoded data are human-readable tables, but raw data are not and has to be processed before working with it.
Depending on the year, which the HELCOM Secretariat received from the data host, both decoded and raw data contain AIS messages (position reports from ships, base stations reports, etc.) received from all national AIS base stations that are part of the HELCOM AIS network.
Year Format of AIS data received from DMA
2005 - 2006 Yearly file (.CSV), decoded
2007 - 2008 Daily AIS raw strings (.txt)
2009 - 2014 Yearly file (.CSV), decoded
The decoded AIS data in CSV files are human-readable tables containing several parameters (columns) such as the date and time when the signal was issued, the identification of the AIS message, the identification number of the AIS transmitter, etc.
The data for 2007 and 2008 were received as raw data separated into daily files. These data were in the globally standardized NMEA sentence format, which is a set of data strings preceded by an encapsulated tag. These tags, in our case beginning with the characters “$PGHP”1, contain the information related to the date and time when the signal was issued. The NMEA sentences contain the rest of the information: the identification of the message issued, the identification of the AIS antenna, etc.
In order to be harmonized with the rest of the data, the material in NMEA sentences had to be decoded and converted to human-readable CSV files (see Figure below). These monthly files were then decoded with a decoder called AIS2CSV, a type of free software available online developed in 2015 by DMA. The application decodes each NMEA sentence with its encapsulated tag and then generates CSV files.
In order to make the process faster the daily raw data files were merged into monthly files. The output was monthly-decoded files in CSV format that were then merged into a yearly file.
1 Gatehouse proprietary format
Raw datain daily files
only 2007 and 2008
AIS data from DMASTEP 1Raw datamerged in
monthly files
Decoded datamerged in
a yearly fileDecoder
JANFEB 2008

Mapping maritime activities - within the Baltic Sea | 11
STEP 2 DATA CLEANING
Once we had all years compiled in yearly CSV files, the next step was to clean the data to produce monthly CSV files, to be used for creating maps and statistics. Data cleaning is necessary to remove erroneous signals and duplicates.
The inputs of the pre-processing steps are made up of yearly CSV files of AIS data containing all messages. The outputs are monthly CSV files that contain the positions of the ships in the Baltic Sea (position reports).
Data cleaning was performed using R language with the RStudio interface; the same script was applied to the yearly files one at a time.
The yearly file was divided into smaller files of 1,000,000 rows to avoid running out of memory. For each division, a process of going through every AIS signal to select the relevant data and to remove erroneous signals:
l Removal of signals that are not from the selected year.
l Removal of the duplicated signals.
l Selection of AIS messages relevant for assessing shipping activities (1, 2, 3, 18 and 19).
l Removal of wrong MMSI signals. A list that can be updated (i.e. more or less than 9 digits or equal to 000000000, 111111111, 222222222, 333333333, 444444444, 555555555, 666666666, 777777777, 888888888, 999999999,123456789, 0.12345, 1193046).
l Correction of wrong IMO numbers: each signal with an erroneous IMO number (not seven digits) was replaced with “NA”.
l Adding the Maritime Identification Digits (MID) and the flag of the ships for each signal. The MID constitute the three initial digits of the MMSI. This action also removes MMSI numbers that do not have an MID (erroneous MMSI).
l Removal of special characters in all the divisions.
l Addition of two columns: one for the number of the week and one for the month.
l Selection of signals within the planning area. A polygon was drawn manually around the planning area and only the signals within this polygon were kept.
l Removal of the signals with erroneous SOG (Speed Over Ground): negative values or more than 80 knots.
l Removal of the signals with erroneous COG (Course Over Ground): negative values or more than 360°.
l Selection of parameters to generate data products.
Data cleaningSTEP 2Yearly file
Divide insmaller files
to avoid memory issues
Clean datain eachdivision
Filesmerged in
monthly files
JANFEB2008

12 | Mapping maritime activities - within the Baltic Sea
All key parameters were kept for all of the signals. This introduced a lot of redundancy but, because of the processing time to create the final files, it was decided to avoid the deletion of information.
Parameters Description
timestamp_pretty time in format dd/mm/yyyy hh:mm:ss
timestamp Unix time stamp (seconds since 01/01/1970 00:00:00)
msgid The AIS message the signal issued
targetType AIS type A or B
mmsi MMSI number of the ship
lat Latitude in decimal format
long Longitude in decimal format
posacc Position accuracy
SOG Speed Over Ground in 0.1 knot
COG Course Over Ground in 0.1°
shipType Ship / vessel type
dimBow The dimension between the AIS transmitter and the bow of the ship in meters
draught Draught of the ship in 0.1 meter
dimPort The dimension between the AIS transmitter and the port side (left)
of the boat in meters
dimStarboard The dimension between the AIS transmitter and the starboard side (right)
of the boat in meters
dimStern The dimension between the AIS transmitter and the stern of the ship in meters
month Month the signal was issued (between 1 and 12)
week Number of the week the signal was issued
imo IMO number of the ship
country Flag of the ship
Table 1: Parameters in the pre-processed AIS data
Each division was saved as a CSV file. For each division, we created a file with the amount of signals kept after removing the erroneous signals—duplicated signals, wrong MMSI, etc. We call this file a report.

Mapping maritime activities - within the Baltic Sea | 13
STEP 3 SORTING THE SELECTED AIS DATA BY MONTH
This final step of data handling goes through each division and creates a new CSV file for all the signals from a given month. The column “month” is used to sort the data into the final files. In total file sizes for a complete year ranged from about 15 GB to almost 80 GB.
STEP 4 UPDATING SHIP INFORMATION
In the AIS dataset each specific ship is identified by its Maritime Mobile Service Identity (MMSI), a standardized series of nine digits, which uniquely identify ships or other transmitting stations, for certain larger vessels they also constitute the IMO registration number. The AIS data itself also includes some descriptions of the transmitting ship (e.g. dimensions, ship type, cargo) in the AIS Message 5 but this information is not an obligatory part of an AIS transmission and therefore it is an unreliable source of detailed information on ships.
In order to enable sorting of ships into ship categories and sizes we purchased a ship database from a data provider called Vessel Finder with up-to-date information on each ship. The update of ship information in our AIS material was accomplished as follows:
A ship list based on AIS data static information was generated for each year. The lists include all ships (IMO and non-IMO registered vessels) and contain the following parameters:
l MMSI
l IMO number
l Name of the ship
l Callsign
l Country
l Target type
l Ship type
l DimBow
l Draught
l DimPort
l DimStarboard
l DimStern
The yearly lists of ships were merged to have a unique list of all ships that operated in the Baltic Sea during the studied period. The ship-related information for 18,358 IMO registered ships was purchased from Vessel Finder. The IMO numbers were used to identify the ships and the following parameters were provided:
l IMO number
l Name
l Ship type
l Gross Tonnage
l Net Tonnage
l Length
l Width
l Draught
0
10
20
30
GB 40
50
60
70
80
2005 2006 2007 2008 2009 2010 2011 2012 2013 2014
The size of each file after cleaning is still huge That is why we divided them in months for making statistics and maps
14 | Mapping maritime activities - within the Baltic Sea
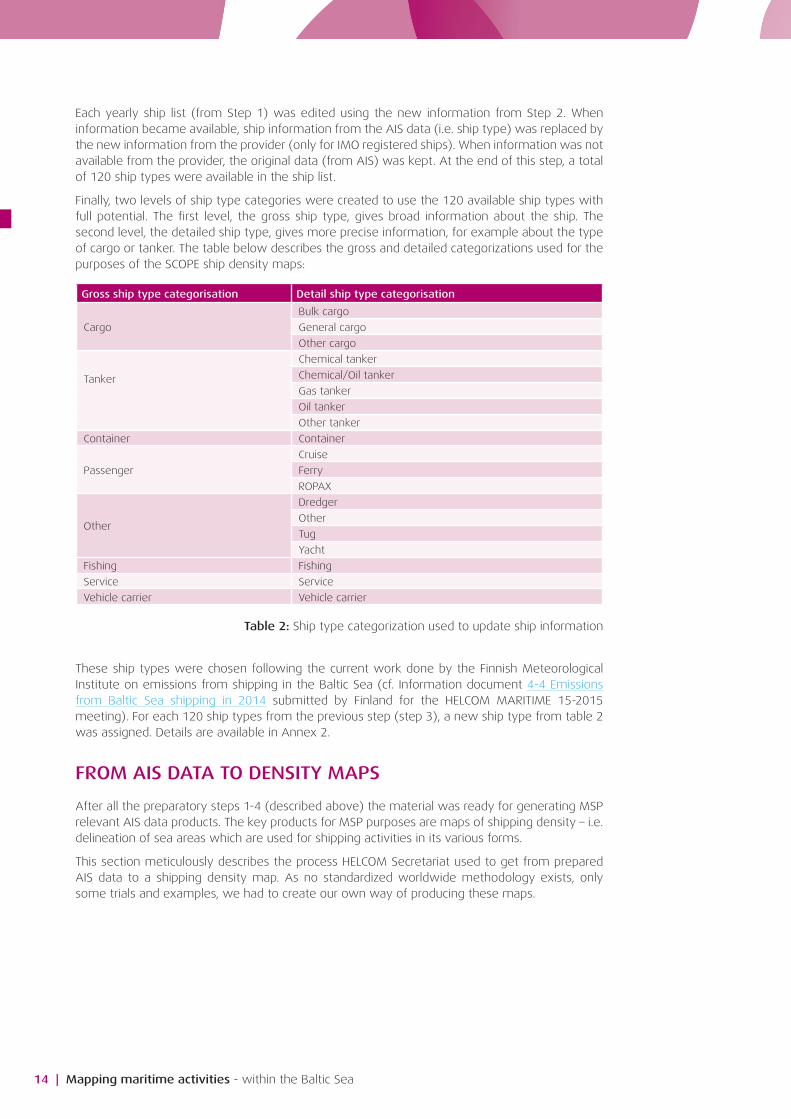
Each yearly ship list (from Step 1) was edited using the new information from Step 2. When information became available, ship information from the AIS data (i.e. ship type) was replaced by the new information from the provider (only for IMO registered ships). When information was not available from the provider, the original data (from AIS) was kept. At the end of this step, a total of 120 ship types were available in the ship list.
Finally, two levels of ship type categories were created to use the 120 available ship types with full potential. The first level, the gross ship type, gives broad information about the ship. The second level, the detailed ship type, gives more precise information, for example about the type of cargo or tanker. The table below describes the gross and detailed categorizations used for the purposes of the SCOPE ship density maps:
Gross ship type categorisation Detail ship type categorisation
Cargo
Bulk cargo
General cargo
Other cargo
Tanker
Chemical tanker
Chemical/Oil tanker
Gas tanker
Oil tanker
Other tanker
Container Container
Passenger
Cruise
Ferry
ROPAX
Other
Dredger
Other
Tug
Yacht
Fishing Fishing
Service Service
Vehicle carrier Vehicle carrier
Table 2: Ship type categorization used to update ship information
These ship types were chosen following the current work done by the Finnish Meteorological Institute on emissions from shipping in the Baltic Sea (cf. Information document 4-4 Emissions from Baltic Sea shipping in 2014 submitted by Finland for the HELCOM MARITIME 15-2015 meeting). For each 120 ship types from the previous step (step 3), a new ship type from table 2 was assigned. Details are available in Annex 2.
FROM AIS DATA TO DENSITY MAPS
After all the preparatory steps 1-4 (described above) the material was ready for generating MSP relevant AIS data products. The key products for MSP purposes are maps of shipping density – i.e. delineation of sea areas which are used for shipping activities in its various forms.
This section meticulously describes the process HELCOM Secretariat used to get from prepared AIS data to a shipping density map. As no standardized worldwide methodology exists, only some trials and examples, we had to create our own way of producing these maps.

Mapping maritime activities - within the Baltic Sea | 15
Point or line density?
After interviews with leading institutions in Europe (Annex 1) we concluded that the best way to make these maps was to overlay a very detailed grid upon the voyage track lines, created by converting individual AIS points to lines. After overlapping lines and the grid, we could count the number of lines crossing each cell and produce a reliable density map giving the number of ship crossings in a given cell.
There are some standard tools available in GIS software such as ESRI ArcGIS, which produce density maps from points (Figure A below). However, for our purposes these are not optimal as the results are based on calculations and algorithms, which do not really answer the question we identified as the most important:
“How many voyages are made across a defined area (e.g. 1x1 km grid cell) over a defined time (e.g. month)?”
As we explain later, the only way we found to do this was to count how many lines were crossing each cells (with the ArcGIS “Spatial Joins” tool) and then summing the results (with the “Dissolve” tool). This method works, but has the drawback of being slow.
A: point density B: line density
In the commonly available tools the number of points are
counted per cell. In this example we can see the problem
with this approach. If a ship goes slowly the density of
points is much greater than when a ship goes fast.
Instead of using point density we found
that the optimal method to create traffic
density maps is to count lines, not points,
crossing each cell
Software considerations
We used ArcGIS 10.2 for Desktop advanced license, with Spatial Analyst, for creating raster layers. We used Background Geoprocessing 64-bit for running the needed scripts.
All layers were stored in File Geodatabases, a native ArcGIS format for storing and managing data in, according to ESRI, a fast and reliable way.
All scripts were written in ArcPython, a Python language package for geoprocessing with ArcGIS. We used PyScripter (an open source Integrated Development Environment (IDE)) for writing the scripts and IDLE (the integrated development environment that comes with Python) for running them. Our experience running scripts directly from PyScripter was not positive because they often crashed and were slower than running them from IDLE. We plan to publish all scripts in GitHUB
We found that writing stand-alone scripts was much more efficient that using Model Builder. The learning curve for writing Python scripts is higher but they are easier to customize and much more flexible.
Fast ship 3 points per cell
Slow ship 1 line
per cell
Slow ship 6 points per cell
Fast ship 1 line per cell
16 | Mapping maritime activities - within the Baltic Sea
STEP 5 DEFINING A GRID
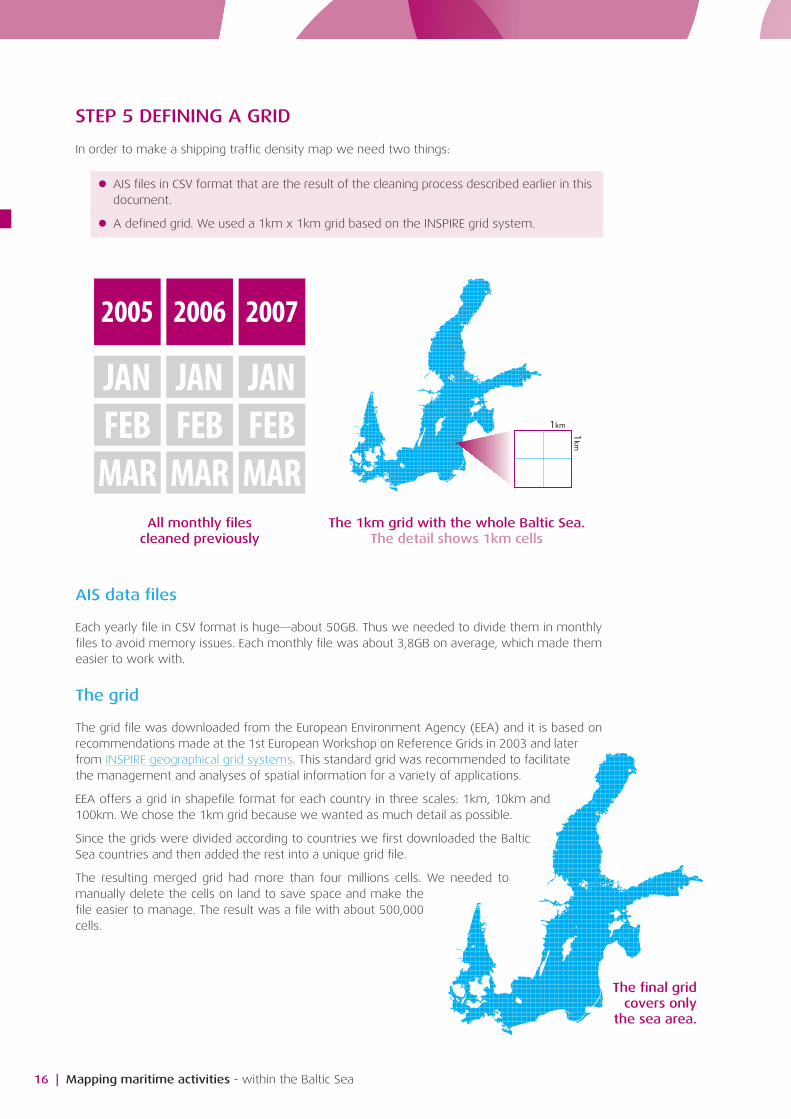
In order to make a shipping traffic density map we need two things:
l AIS files in CSV format that are the result of the cleaning process described earlier in this document.
l A defined grid. We used a 1km x 1km grid based on the INSPIRE grid system.
AIS data files
Each yearly file in CSV format is huge—about 50GB. Thus we needed to divide them in monthly files to avoid memory issues. Each monthly file was about 3,8GB on average, which made them easier to work with.
The grid
The grid file was downloaded from the European Environment Agency (EEA) and it is based on recommendations made at the 1st European Workshop on Reference Grids in 2003 and later from INSPIRE geographical grid systems. This standard grid was recommended to facilitate the management and analyses of spatial information for a variety of applications.
EEA offers a grid in shapefile format for each country in three scales: 1km, 10km and 100km. We chose the 1km grid because we wanted as much detail as possible.
Since the grids were divided according to countries we first downloaded the Baltic Sea countries and then added the rest into a unique grid file.
The resulting merged grid had more than four millions cells. We needed to manually delete the cells on land to save space and make the file easier to manage. The result was a file with about 500,000 cells.
All monthly filescleaned previously
The 1km grid with the whole Baltic Sea.The detail shows 1km cells
200720062005
JANFEBMAR
JANFEBMAR
JANFEBMAR
1km
1km
The final grid covers only
the sea area.
Mapping maritime activities - within the Baltic Sea | 17
STEP 6 FROM POINTS TO LINES
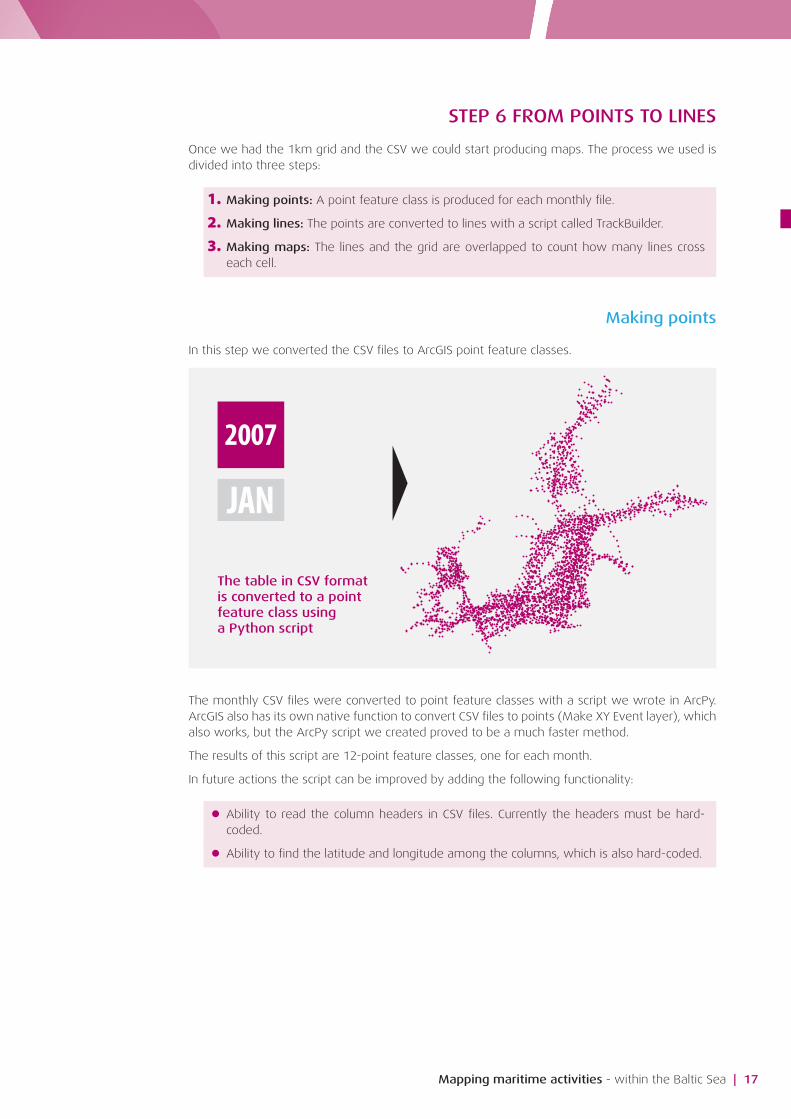
Once we had the 1km grid and the CSV we could start producing maps. The process we used is divided into three steps:
1. Making points: A point feature class is produced for each monthly file.
2. Making lines: The points are converted to lines with a script called TrackBuilder.
3. Making maps: The lines and the grid are overlapped to count how many lines cross each cell.
Making points
In this step we converted the CSV files to ArcGIS point feature classes.
The monthly CSV files were converted to point feature classes with a script we wrote in ArcPy. ArcGIS also has its own native function to convert CSV files to points (Make XY Event layer), which also works, but the ArcPy script we created proved to be a much faster method.
The results of this script are 12-point feature classes, one for each month.
In future actions the script can be improved by adding the following functionality:
l Ability to read the column headers in CSV files. Currently the headers must be hard-coded.
l Ability to find the latitude and longitude among the columns, which is also hard-coded.
The table in CSV formatis converted to a pointfeature class usinga Python script
2007
JAN

18 | Mapping maritime activities - within the Baltic Sea
Making lines
Here we converted the point files into line feature classes.
The points were converted to lines with a Python script called TrackBuilder made by Digital Coast, managed by NOAA’s Office for Coastal Management. In TrackBuilder users can generate track lines according to date, time and identifier. It also allows users to set a distance and time filter to compensate for gaps in the data.
The advantage of using this script instead of the ArcGIS function Point to Line was that there were fewer errors and that each line signifies a trip—the script calculates the time of departure and arrival to generate the line.
STEP 7 MAKING MAPS
In order to make a density map we have to apply the 1km grid on the files with lines representing ship voyages. For this we need the grid, the lines as well as a grid division to troubleshoot memory issues:
The point feature classes are converted to lines with TrackBuilder, a Python script from NOAA. The projection is also changed from WGS84 to LAEA (Lambert Azimuthal Equal-Area), used officially in HELCOM.
Grid division
Big polygons covering the planning
area were used. A spatial join between
the lines and the 1km grid is created
in each polygon. All polygons are later
merged. The reason to do this is to
avoid filling up memory.
1km grid
An INSPIRE compliant grid
downloaded from EEA. All land
areas have been deleted
Lines
There is a line feature
class for each month.

Mapping maritime activities - within the Baltic Sea | 19
When all spatial joins in all grid divisions were ready, then they could all be merged into one.
Dissolving5
Rastering6
Cell ID Count MMSI1 1 234343481 1 97389292
Cell ID Count1 2
Spatial Join
NO
3Once we had both 1km cells and lines selected in the first grid division, we applied a spatial join. The result was a 1km grid. If, for example, there were two lines crossing one cell, then two overlapping cells would be produced.
Merging Spatial Joins4
Selecting Lines2Then we selected the lines inside the first grid division.
Selecting Cells1We selected cells inside the Grid Division: in order to avoid running out of memory, we divided the Baltic Sea area into five large squares, which we called the ”grid division”. First, we had to select the 1km cells inside it.
Monthly lines file
Two lines crossing the cell produce two
overlapping cells
Resulting from the actions of the “Dissolve” tool, a huge shapefile (about 80 MB) follows, which needs to be rastered to make it lighter and more practical to work with.
Then we summed up all the crossings in each cell with the “Dissolve” tool.
Then we checked if the spatial join in all grid divisions was ready.
NO YES READY
Then we check if all monthly files are ready.
Cell ID Count MMSI1 1 234343481 1 97389292
YES
The process to create a map is divided into six main steps, illustrated in the figure.
20 | Mapping maritime activities - within the Baltic Sea
!!
!
!
!
!
!
!
!
!
!
!
!!
!
!
!
!
!
!
!
!
!
!
!
!
!
!
!
!
!
!
!
!
!
!
!
!
!
!
!
!
!
!
!
!
!
!
!
!
!
!
!
!
!
!
!
!
!
!
!
!
!
!
!
!
!
!
!
!
!
!
!
!
!
!
!
!
!
!
!
!
!!
!
!
!
!
!
!
!
!
!
!
!
!
!
!!
!
!
!
!
!
!
!
!
!
!
!
!
!
!!
!
!
!
!
!
!
!
!
!
!
!
!
!
!
!
!
!
!
!
!
!
!
!
!
!
!
!
!
!
!
!
!
!
!
!
!
!
!
!
!
!
!
!
!
!
!
!
!!
!
!
!
!
!
!!
!
!
!
!
!
!
!
!
!
!
!
!
!!!
!
!
!
!
!
!
!
!
!
!
!
!
!
!!
!! !!
!
!
!
!!!!
!
!
!!
!
!!!
!
!
!
!
!
!!
!!
!
!
!!
!
!
!
!
!
!!
!
!
!! !
!!
!
!
!!!
!
!
!
!
!
!
!
!
!
!
!
!
!
!
!
!
!
!
!
!
!
!
!
!
!
!
!
!
!
!
!
!
!
!
!
!
!
!
!
!
!
!
!
!
!
!
!
!
!
!
!
!
!
!
!
!
!
!
!
!
!
!
!
!
!
!
!
!
!
!
!
!
!
!
!
!
!
!
!
!
!
!
!
!
!
!
!
!
!
!
!
!
!
! !
!
!
! !
!
!
! !
!
!
!
!
!
!
!
!
!
!
!
!
Hel
Fur
Asa
RowyLeba Puck
Rewa
Riga
Vang
Soby
Skaw
Koge
Hals
OrthKiel
Burg
Förby
Tczew
WolinLubin
UstkaSopot
Hanko
Veere
Parnu
Muuga
Loksa Kunda
Forby
Vejle
Strib
Stege
Skive
Saeby
Ronne
Odden
Nekso
Lindo
Hobro
Hasle
Barth
OrlowoElblag
PiaskiKadyny
Skulte
Nyhamn
Virtsu
Lehtma
Struer
Sprogo
Skagen
OdenseNyborg
Lemvig
Kyndby
Grenaa
Gedser
Dragor
Ballen
Assens
Anholt
Aarhus
Wismar
Mukran
Lubeck Anklam
Svetlyy
Dziwn¢w
Darlowo
Rzucewo
Liepaja
Tallinn
Dirhami
Thisted
Randers
Praesto
Nakskov MasnedoMarstal
Kolding
Katholm
KastrupHolbaek
Havneby
Glatved
Faaborg
Esbjerg
Aalborg
WolgastRostock Ladebow
Kappeln
Gromitz
Gelting
Baltiysk
Trzebiez
Mrzezyno
Klaipeda
Dalsbruk
Rohukula
Kuivastu
Thyboron
GulfhavnGraasten
Fano Is.
Elsinore
Bandholm
Aarosund
Neustadt
Holtenau
Hochdonn
Finstrom
Ventspils
Pavilosta
Frojdbole
Heltermaa
Understed
Hirtshals
Hanstholm
Haderslev
Aggersund
Schleswig
Rendsburg
Ostermoor
Vene-Balti
Pionerskiy
Salacgriva
Tammisaari
Roomassaar
Ringkobing
Kolby Kaas
Lauterbach
Greifswald
Nowe Warpno
Prangli Is.
Stevns Pier
Burgstaaken
Butinge Term.
Paldiski-South
Ar
Raa
Mem
Ryxo
Ahus
Surte
Ystad
Torko
Straa
Slite
Smogen
Ockero
Kalmar
Dalaro
Bastad
Varberg
Ronnang
Lysekil
Loudden
Kallvik
Hoganas
GamlebyWallhamn
Studsvik
Skarhamn
Ronehamn
Oregrund
NykopingLandsort
Hogmarso
Halmstad
Furusund
Furillen
Elleholm
BorgholmMönsterås
Vestervik
Stromstad
Simpevarp
Oxelosund
Nynashamn
Karlshamn
Hargshamn
Degerhamn
Byxelkrok
Backviken
Solvesborg
Sodertalje
Simrishamn
Oskarshamn
Morbylanga
Kungsbacka
Karlskrona
Hallstavik
Grebbestad
Gothenburg
Fjallbacka
Falkenberg
Soderkoping
Grisslehamn
ValdemarsvikMunkedalhamn
Visby
Klintehamn
Roja
Engure
Mersrags
Sweden
Poland
Norway
Latvia
Lithuania
Estonia
Germany
Russia
Belarus
Denmark
Finland
0 15075
Kilometers
HELCOM Secretariat for Baltic Scope projectAugust 2015
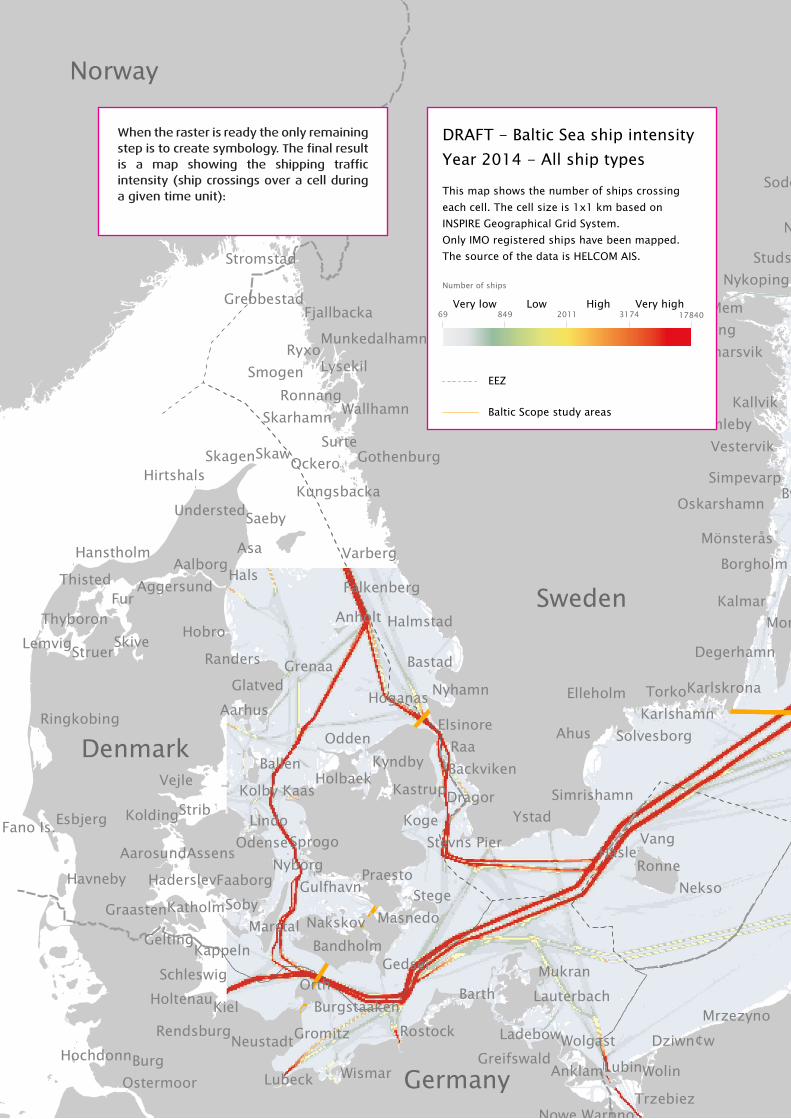
DRAFT - Baltic Sea ship intensityYear 2014 - All ship types
This map shows the number of ships crossingeach cell. The cell size is 1x1 km based onINSPIRE Geographical Grid System.Only IMO registered ships have been mapped.The source of the data is HELCOM AIS.
Number of ships
EEZ
Baltic Scope study areas
Very highVery low HighLow69 849 3174 178402011
When the raster is ready the only remaining step is to create symbology. The final result is a map showing the shipping traffic intensity (ship crossings over a cell during a given time unit):

Mapping maritime activities - within the Baltic Sea | 21
!!
!
!
!
!
!
!
!
!
!
!
!!
!
!
!
!
!
!
!
!
!
!
!
!
!
!
!
!
!
!
!
!
!
!
!
!
!
!
!
!
!
!
!
!
!
!
!
!
!
!
!
!
!
!
!
!
!
!
!
!
!
!
!
!
!
!
!
!
!
!
!
!
!
!
!
!
!
!
!
!
!!
!
!
!
!
!
!
!
!
!
!
!
!
!
!!
!
!
!
!
!
!
!
!
!
!
!
!
!
!!
!
!
!
!
!
!
!
!
!
!
!
!
!
!
!
!
!
!
!
!
!
!
!
!
!
!
!
!
!
!
!
!
!
!
!
!
!
!
!
!
!
!
!
!
!
!
!
!!
!
!
!
!
!
!!
!
!
!
!
!
!
!
!
!
!
!
!
!!!
!
!
!
!
!
!
!
!
!
!
!
!
!
!!
!! !!
!
!
!
!!!!
!
!
!!
!
!!!
!
!
!
!
!
!!
!!
!
!
!!
!
!
!
!
!
!!
!
!
!! !
!!
!
!
!!!
!
!
!
!
!
!
!
!
!
!
!
!
!
!
!
!
!
!
!
!
!
!
!
!
!
!
!
!
!
!
!
!
!
!
!
!
!
!
!
!
!
!
!
!
!
!
!
!
!
!
!
!
!
!
!
!
!
!
!
!
!
!
!
!
!
!
!
!
!
!
!
!
!
!
!
!
!
!
!
!
!
!
!
!
!
!
!
!
!
!
!
!
!
! !
!
!
! !
!
!
! !
!
!
!
!
!
!
!
!
!
!
!
!
Hel
Fur
Asa
RowyLeba Puck
Rewa
Riga
Vang
Soby
Skaw
Koge
Hals
OrthKiel
Burg
Förby
Tczew
WolinLubin
UstkaSopot
Hanko
Veere
Parnu
Muuga
Loksa Kunda
Forby
Vejle
Strib
Stege
Skive
Saeby
Ronne
Odden
Nekso
Lindo
Hobro
Hasle
Barth
OrlowoElblag
PiaskiKadyny
Skulte
Nyhamn
Virtsu
Lehtma
Struer
Sprogo
Skagen
OdenseNyborg
Lemvig
Kyndby
Grenaa
Gedser
Dragor
Ballen
Assens
Anholt
Aarhus
Wismar
Mukran
Lubeck Anklam
Svetlyy
Dziwn¢w
Darlowo
Rzucewo
Liepaja
Tallinn
Dirhami
Thisted
Randers
Praesto
Nakskov MasnedoMarstal
Kolding
Katholm
KastrupHolbaek
Havneby
Glatved
Faaborg
Esbjerg
Aalborg
WolgastRostock Ladebow
Kappeln
Gromitz
Gelting
Baltiysk
Trzebiez
Mrzezyno
Klaipeda
Dalsbruk
Rohukula
Kuivastu
Thyboron
GulfhavnGraasten
Fano Is.
Elsinore
Bandholm
Aarosund
Neustadt
Holtenau
Hochdonn
Finstrom
Ventspils
Pavilosta
Frojdbole
Heltermaa
Understed
Hirtshals
Hanstholm
Haderslev
Aggersund
Schleswig
Rendsburg
Ostermoor
Vene-Balti
Pionerskiy
Salacgriva
Tammisaari
Roomassaar
Ringkobing
Kolby Kaas
Lauterbach
Greifswald
Nowe Warpno
Prangli Is.
Stevns Pier
Burgstaaken
Butinge Term.
Paldiski-South
Ar
Raa
Mem
Ryxo
Ahus
Surte
Ystad
Torko
Straa
Slite
Smogen
Ockero
Kalmar
Dalaro
Bastad
Varberg
Ronnang
Lysekil
Loudden
Kallvik
Hoganas
GamlebyWallhamn
Studsvik
Skarhamn
Ronehamn
Oregrund
NykopingLandsort
Hogmarso
Halmstad
Furusund
Furillen
Elleholm
BorgholmMönsterås
Vestervik
Stromstad
Simpevarp
Oxelosund
Nynashamn
Karlshamn
Hargshamn
Degerhamn
Byxelkrok
Backviken
Solvesborg
Sodertalje
Simrishamn
Oskarshamn
Morbylanga
Kungsbacka
Karlskrona
Hallstavik
Grebbestad
Gothenburg
Fjallbacka
Falkenberg
Soderkoping
Grisslehamn
ValdemarsvikMunkedalhamn
Visby
Klintehamn
Roja
Engure
Mersrags
Sweden
Poland
Norway
Latvia
Lithuania
Estonia
Germany
Russia
Belarus
Denmark
Finland
0 15075
Kilometers

22 | Mapping maritime activities - within the Baltic Sea
Mapping maritime activities - within the Baltic Sea | 23
SECTION II: FISHERIES ACTIVITIES
AND RENEWABLE ENERGY
24 | Mapping maritime activities - within the Baltic Sea
SECTION II: FISHERIES ACTIVITIES AND RENEWABLE ENERGY
Also other maritime activities, particularly of fisheries and renewable energy are important for MSP. Even if HELCOM activities within SCOPE focused on shipping, this section includes some reflections on mapping fisheries and renewable energy, mainly wind power, in the Baltic Sea region.
FISHERIES MAPS—VMS AND AIS
VMS data is the state of the art official data on fishing vessel movements and catches used e.g. to enforce the Common Fishery Policy of the EU. Several organizations like the EU Commission, DG Environment, OSPAR, HELCOM, as well as national authorities have recently engaged actors like ICES to produce detailed maps on fisheries activities based on the official VMS and catch log book data.
For the Baltic and North Seas VMS data has been obtained from the fisheries authorities of coastal countries via data collection initiatives like the joint ICES/HELCOM/OSPAR data call of 2009-13, as well as recent VMS data calls initiated by ICES. The ICES WORKING GROUP has processed the collected data confidentially for Spatial Fisheries (WGSFD) under contracts paid for by HELCOM, OSPAR as well as the EU Commission.
Examples of results are the maps of fisheries activities in the Baltic Sea 2013 that were published in the HELCOM map service in autumn 2015. The maps and shapefiles of fishing intensity and effort were calculated for bottom contact gear and mid-water trawl and longline for each quarter of 2013. The following maps are available in the HELCOM map service (Pressures and Human Activities/Fisheries):
l Intensity of fishing according to every fishing activity for each year.
l Total intensity
l Total intensity and according to every fishing activity for each quarter of 2013
However, besides mapping shipping as described in Section I of this document, the regional HELCOM AIS dataset can also be used to map fisheries activities in the region.
Even if VMS is the official and most detailed source of fishing vessels’ movements, AIS data is much more easily accessible than VMS. It has thus potential to provide a cost, and time, efficient path to map the spatial extent of fisheries activities for some purposes including MSP.
As part of the activities to map shipping activity the HELCOM Secretariat has made some trials on mapping fisheries using AIS as a complement to VMS based fishing activity maps. Examples of these maps, including only the larger fishing vessels registered by IMO, are available among the maps produced by HELCOM.

Mapping maritime activities - within the Baltic Sea | 25
MAPPING OFFSHORE WINDFARMS
Currently, there is no single public source to get a comprehensive map of offshore wind farms in the Baltic Sea. National agencies naturally have overview on the status of wind power projects in their national waters. For a larger area like the entire Baltic Sea region likely the best up to date source is the European Wind Energy Association (EWEA, nowadays Wind Europe) maps, which are available for purchase.
The HELCOM map service does contain a freely available older GIS dataset on offshore wind farms in the Baltic Sea. It was obtained in 2009 by merging data from EWEA and 4C Offshore Limited for the purposes of HELCOM Assessment products.
The HELCOM Secretariat has recently carried out work to update this data on offshore wind farms in the region and after checks with national authorities it will be published in the beginning of 2017 as part of the upcoming HELCOM Maritime Assessment.
The current HELCOM offshore wind farms dataset contains the following attributes:
l Name and country
l Status: Wind farms can have the following status:
� Cancelled
� Early planning
� Application submitted
� Authorized
� Failed proposal
� Generating power
� Under construction
l Number of turbines
l Link to more information
Besides one off updates to datasets there are also aims to create workflows and mechanisms to enable more automatically updated GIS data on renewable energy as part of the recently funded Interreg project Baltic Lines. This would be feasible by linking updated national geodata portals developed in EU countries as part of implementation of the EU INSPIRE Directive. Reciprocal access to such national geodata, and automatic creation of regional synthesis layers, would be possible via technologies such as Web Map Service (WMS) and Web Feature Service (WFS) developed by the Open Geospatial Consortium (OGC). However, these are developments, which require further work and are not yet available.

26 | Mapping maritime activities - within the Baltic Sea
ANNEX 1 - RESULTS OF AIS USERS INTERVIEWS
This is the result of the interviews carried out by the HELCOM Secretariat at the beginning of the Baltic SCOPE project. The purpose of these interviews was to get to know how AIS data experts work with data and learn from their experiences. The focus of the interviews is on finding out what type of storage and analysis equipment they use.
CONTACT GENERAL INFORMATION STORAGE OF AIS DATA ANALYSIS OF AIS DATA
Country / Organization Name and contact International Data exchange networks
Ideas on what HELCOM should provide
Additional info Purpose of the storage Software / Hardware Types of analysis Products from AIS data Software / Hardware
Denmark / Danish Maritime Authority (DMA)
Omar Frits Eriksson, [email protected]
HELCOM, North Sea and IALA-net. Participating in North Atlantic, American AIS (AISAS?). They provide some European member states data to EMSA.
To provide the countries a compiled version of AIS data in the Baltic Sea.
No advanced analysis. Online map service for HELCOM Contracting Parties.
They recommend using just a powerful laptop.
EMSA Yann Le Moan, [email protected]
(This interview took place after the submission date of documents to the AIS EWG 26-2015 meeting)
- - - - - - -
Finland / Finnish Meteorological Institute (FMI)
Jukka-Pekka Jalkanan, [email protected]
To show that AIS data is relevant and its use will be increasing.
Not a provider of AIS data for external users. Their main focus is on writing scientific papers.
The have all HELCOM AIS datasets from the year 2005 to 2013. They run models and statistics when needed.
Basic storage in CSV divided per month on an external conventional hard disk.
STEAM – models using AIS data for emissions from ships. They use the HIS Fairplay database to have ship properties.
Analysis of emissions from ships, costs of regulations to reduce emissions, etc.
STEAM, they built their own software. No database, they use a simple workflow. Basic laptop, 16GB RAM and 64 bits.
Finland / Finnish Transport Agency
Kaisu Heikonen, [email protected]
Bilateral agreement with Sweden, Estonia and Poland. Not a provider of AIS data for external users.
There is a pilot project to store national data.
Cognos for reporting and Hadoop for handling the storage.
Lithuania / Marine Safety Agency (MSA)
Edmundas Trusys, [email protected]
EMSA SSN (SafeSeaNet) and HELCOM
It would be very good to have an additional source of data than the AIS national network. The connection with the AIS national network was lost a few times and thanks to the HELCOM AIS data network, it was still possible to have data coming in.
No bilateral agreement with other countries for now, but probably in the future. Work with AIS is new in Lithuania.
MSA provides AIS data or giving access to the Lithuanian SafeSeaNet (full access or with some limits, depending on the contract) for government authorities, but they must sign a contract.
Residents confirm their identity (only LT residents) to be able to monitor vessel movements with AIS (very “limitless” (public)).
Monitoring, 1 year history review in the national waters
They developed their own software. IBM blade server + virtual servers (Citrix, VMware), 20 Gb RAM + 1 To for storage. This is enough for national data.
Analysis for different purposes: ship course history, statistics, etc.
To develop a graphical interface (made in-house). There is already a map service in place for public and institutional use.
Software are developed in-house. IBM Blade server, virtual servers (Citric, VMware).

Mapping maritime activities - within the Baltic Sea | 27
ANNEX 1 - RESULTS OF AIS USERS INTERVIEWS
This is the result of the interviews carried out by the HELCOM Secretariat at the beginning of the Baltic SCOPE project. The purpose of these interviews was to get to know how AIS data experts work with data and learn from their experiences. The focus of the interviews is on finding out what type of storage and analysis equipment they use.
CONTACT GENERAL INFORMATION STORAGE OF AIS DATA ANALYSIS OF AIS DATA
Country / Organization Name and contact International Data exchange networks
Ideas on what HELCOM should provide
Additional info Purpose of the storage Software / Hardware Types of analysis Products from AIS data Software / Hardware
Denmark / Danish Maritime Authority (DMA)
Omar Frits Eriksson, [email protected]
HELCOM, North Sea and IALA-net. Participating in North Atlantic, American AIS (AISAS?). They provide some European member states data to EMSA.
To provide the countries a compiled version of AIS data in the Baltic Sea.
No advanced analysis. Online map service for HELCOM Contracting Parties.
They recommend using just a powerful laptop.
EMSA Yann Le Moan, [email protected]
(This interview took place after the submission date of documents to the AIS EWG 26-2015 meeting)
- - - - - - -
Finland / Finnish Meteorological Institute (FMI)
Jukka-Pekka Jalkanan, [email protected]
To show that AIS data is relevant and its use will be increasing.
Not a provider of AIS data for external users. Their main focus is on writing scientific papers.
The have all HELCOM AIS datasets from the year 2005 to 2013. They run models and statistics when needed.
Basic storage in CSV divided per month on an external conventional hard disk.
STEAM – models using AIS data for emissions from ships. They use the HIS Fairplay database to have ship properties.
Analysis of emissions from ships, costs of regulations to reduce emissions, etc.
STEAM, they built their own software. No database, they use a simple workflow. Basic laptop, 16GB RAM and 64 bits.
Finland / Finnish Transport Agency
Kaisu Heikonen, [email protected]
Bilateral agreement with Sweden, Estonia and Poland. Not a provider of AIS data for external users.
There is a pilot project to store national data.
Cognos for reporting and Hadoop for handling the storage.
Lithuania / Marine Safety Agency (MSA)
Edmundas Trusys, [email protected]
EMSA SSN (SafeSeaNet) and HELCOM
It would be very good to have an additional source of data than the AIS national network. The connection with the AIS national network was lost a few times and thanks to the HELCOM AIS data network, it was still possible to have data coming in.
No bilateral agreement with other countries for now, but probably in the future. Work with AIS is new in Lithuania.
MSA provides AIS data or giving access to the Lithuanian SafeSeaNet (full access or with some limits, depending on the contract) for government authorities, but they must sign a contract.
Residents confirm their identity (only LT residents) to be able to monitor vessel movements with AIS (very “limitless” (public)).
Monitoring, 1 year history review in the national waters
They developed their own software. IBM blade server + virtual servers (Citrix, VMware), 20 Gb RAM + 1 To for storage. This is enough for national data.
Analysis for different purposes: ship course history, statistics, etc.
To develop a graphical interface (made in-house). There is already a map service in place for public and institutional use.
Software are developed in-house. IBM Blade server, virtual servers (Citric, VMware).

28 | Mapping maritime activities - within the Baltic Sea
CONTACT GENERAL INFORMATION STORAGE OF AIS DATA ANALYSIS OF AIS DATA
Country / Organization Name and contact International Data exchange networks
Ideas on what HELCOM should provide
Additional info Purpose of the storage Software / Hardware Types of analysis Products from AIS data Software / Hardware
Norway / Norwegian Maritime Administration
Harald Åseii, [email protected]
HELCOM and North Sea (UK, DK, etc.) international data exchange networks-
Norway is running the North Atlantic network (Norway, Iceland, DK and satellite data.
These questions are more and more present in this field. It would be good for HELCOM to provide a report to answer basic questions about AIS. It would also be interesting to explain how AIS data could be merged with other data (e.g. environmental studies) to fulfil the needs of research
No bilateral agreement with other countries. AIS data provider: they provide raw data to companies (i.e. oil industry). These companies managed the data (pre-processing, database, etc.).
Storage of Norwegian AIS data network and the North Atlantic network.
For online data viewers (2 years of data from the Norwegian network and satellite data from 2010).
Microsoft software – simple folders in windows explorer. Storage on conventional hard disks.
Map service available: havbase.no
Jon-Arve Røyset, [email protected]
HELCOM and North Sea (UK, DK, etc.) international data exchange networks-
Norway is running the North Atlantic network (Norway, Iceland, DK) and satellites data.
HELCOM could get data flows from Havbase.
No bilateral agreement with other countries. AIS data provider through havbase. With an account, one could go deeper in filtering the ship types.
Storage of Norwegian AIS data network and the North Atlantic network.
For online data viewer (2 years of data from the Norwegian network and satellite data from 2010).
PostGres (open source DB) with PostGIS extension for handling spatial data.
They use a powerful laptop, but nothing special. Could not give specifications. RAM is important for AIS data.
Pre-processing AIS data to create maps for havbase.no. There is an update of the database every night to add more data. The pre-processing is automatic and new layers are generated for havbase.
Use of Fairplay and ShipInfo to cross IMO number and ship characteristics (for calculation of emissions).
Everything goes on havbase. The next step is to cross havbase with weather data to be able to predict risks?
PostGres (open source DB) with PostGIS extension for handling spatial data to filter data / calculate distance, etc. Also work with google earth, ArcGIS and google API to produce graphs. A good laptop, but nothing special. Could not give specifications. RAM is important for AIS data.
Sweden / Linköping University
Anders Grimvall, [email protected]
They get all of the AIS data of the Baltic Sea area from the Swedish Maritime Administration.
Traffic intensity maps and shipping statistics for Helcom Assessment Areas
In addition, I think that Helcom could play an important role by developing:
- Guidelines for data quality assessment (identification and handling of missing values and obviously erroneous records)
- Guidelines for producing traffic intensity maps in spatial scales relevant for different types of assessments and supplying AIS data in a form that is useable for environmental scientists who have a moderate experience of analysing big data.
If possible, it would also be nice if AIS data could be coupled to detailed ship data for further analysis (e.g. emissions, etc.).
No bilateral agreement with other countries. Not an AIS data provider for external users. Data are only available for partners of the Swedish Institute for Marine Environment.
They have HELCOM AIS data for 2013 and 2014. They supply AIS data to the working group on shipping at the Swedish Institute for the Marine Environment, University of Gothenburg, Chalmers University of Technology (GOT) and Linnaeus University (Kalmar).
SAS 9.3 (Data mining module) and QGIS Desktop 2.4.
SAS because it is documented more compared to R and because they are more familiar with this software HP Elite Book 2570p, 64 bits, 16 Go RAM and GB of Hard disk. 1000 GB external hard disk.
Traffic intensity maps, shipping statistics by sea area and type of ship for the entire Baltic Sea and Swedish assessment areas according to the MSFD.
Grid between 100 m x 100 m and 500 m x 500 m.
There is a big pre-processing step before analysis: few % of AIS signals contain mistakes.
Popular report (in Swedish) about the impact of shipping on the marine environment. In the relatively near future there will be a scientific article about the use of AIS for MSP and data quality issues in using AIS data.
SAS 9.3 (Data mining module) and QGIS Desktop 2.4. HP Elite Book 2570p, 64 bits, 16 Go RAM and GB of Hard disk. 1000 GB external hard disk.

Mapping maritime activities - within the Baltic Sea | 29
CONTACT GENERAL INFORMATION STORAGE OF AIS DATA ANALYSIS OF AIS DATA
Country / Organization Name and contact International Data exchange networks
Ideas on what HELCOM should provide
Additional info Purpose of the storage Software / Hardware Types of analysis Products from AIS data Software / Hardware
Norway / Norwegian Maritime Administration
Harald Åseii, [email protected]
HELCOM and North Sea (UK, DK, etc.) international data exchange networks-
Norway is running the North Atlantic network (Norway, Iceland, DK and satellite data.
These questions are more and more present in this field. It would be good for HELCOM to provide a report to answer basic questions about AIS. It would also be interesting to explain how AIS data could be merged with other data (e.g. environmental studies) to fulfil the needs of research
No bilateral agreement with other countries. AIS data provider: they provide raw data to companies (i.e. oil industry). These companies managed the data (pre-processing, database, etc.).
Storage of Norwegian AIS data network and the North Atlantic network.
For online data viewers (2 years of data from the Norwegian network and satellite data from 2010).
Microsoft software – simple folders in windows explorer. Storage on conventional hard disks.
Map service available: havbase.no
Jon-Arve Røyset, [email protected]
HELCOM and North Sea (UK, DK, etc.) international data exchange networks-
Norway is running the North Atlantic network (Norway, Iceland, DK) and satellites data.
HELCOM could get data flows from Havbase.
No bilateral agreement with other countries. AIS data provider through havbase. With an account, one could go deeper in filtering the ship types.
Storage of Norwegian AIS data network and the North Atlantic network.
For online data viewer (2 years of data from the Norwegian network and satellite data from 2010).
PostGres (open source DB) with PostGIS extension for handling spatial data.
They use a powerful laptop, but nothing special. Could not give specifications. RAM is important for AIS data.
Pre-processing AIS data to create maps for havbase.no. There is an update of the database every night to add more data. The pre-processing is automatic and new layers are generated for havbase.
Use of Fairplay and ShipInfo to cross IMO number and ship characteristics (for calculation of emissions).
Everything goes on havbase. The next step is to cross havbase with weather data to be able to predict risks?
PostGres (open source DB) with PostGIS extension for handling spatial data to filter data / calculate distance, etc. Also work with google earth, ArcGIS and google API to produce graphs. A good laptop, but nothing special. Could not give specifications. RAM is important for AIS data.
Sweden / Linköping University
Anders Grimvall, [email protected]
They get all of the AIS data of the Baltic Sea area from the Swedish Maritime Administration.
Traffic intensity maps and shipping statistics for Helcom Assessment Areas
In addition, I think that Helcom could play an important role by developing:
- Guidelines for data quality assessment (identification and handling of missing values and obviously erroneous records)
- Guidelines for producing traffic intensity maps in spatial scales relevant for different types of assessments and supplying AIS data in a form that is useable for environmental scientists who have a moderate experience of analysing big data.
If possible, it would also be nice if AIS data could be coupled to detailed ship data for further analysis (e.g. emissions, etc.).
No bilateral agreement with other countries. Not an AIS data provider for external users. Data are only available for partners of the Swedish Institute for Marine Environment.
They have HELCOM AIS data for 2013 and 2014. They supply AIS data to the working group on shipping at the Swedish Institute for the Marine Environment, University of Gothenburg, Chalmers University of Technology (GOT) and Linnaeus University (Kalmar).
SAS 9.3 (Data mining module) and QGIS Desktop 2.4.
SAS because it is documented more compared to R and because they are more familiar with this software HP Elite Book 2570p, 64 bits, 16 Go RAM and GB of Hard disk. 1000 GB external hard disk.
Traffic intensity maps, shipping statistics by sea area and type of ship for the entire Baltic Sea and Swedish assessment areas according to the MSFD.
Grid between 100 m x 100 m and 500 m x 500 m.
There is a big pre-processing step before analysis: few % of AIS signals contain mistakes.
Popular report (in Swedish) about the impact of shipping on the marine environment. In the relatively near future there will be a scientific article about the use of AIS for MSP and data quality issues in using AIS data.
SAS 9.3 (Data mining module) and QGIS Desktop 2.4. HP Elite Book 2570p, 64 bits, 16 Go RAM and GB of Hard disk. 1000 GB external hard disk.

30 | Mapping maritime activities - within the Baltic Sea
ANNEX 2
List of the ship type information from Step 3 and the creation of gross and detail ship categories.
Final ship types after Step 3 HELCOM categorisation
Gross ship types Detail ship types
Aggregates carrier Cargo Bulk cargo
Anchor handling tug supply Other Tug
Anti pollution Service Service
Asphalt/bitumen tanker Tanker Other tanker
Barge carrier Other Other
Bucket ladder dredger Other Dredger
Bulk carrier Cargo Bulk cargo
Bulk/oil carrier Cargo General cargo
Bunkering tanker Tanker Oil tanker
Buoy tender Service Service
Buoy/lighthouse vessel Service Service
Cable layer Service Service
Cement carrier Cargo Other cargo
Chemical tanker Tanker Chemical tanker
Chemical/oil products tanker Tanker Chemical/Oil tanker
CO2 tanker Tanker Gas tanker
Container ship Container Container
Container Ship (Fully Cellular with Ro-Ro Facility) Container Container
Crane ship Service Service
Crew boat Service Service
Crude oil tanker Tanker Oil tanker
Deck cargo ship Cargo Other cargo
Diving Other Other
Dredger Other Dredger
Dredging Other Dredger
Drilling ship Service Service
Edible oil tanker Tanker Other tanker
Exhibition vessel Service Service
Fire fighting vessel Service Service
Fish carrier Cargo Other cargo
Fish factory ship Fishing Fishing
Fishery research vessel Fishing Fishing
Fishing support vessel Fishing Fishing
Fishing vessel Fishing Fishing
FPSO (floating, production, storage, offloading) Service Service
FSO (floating, storage, offloading) Service Service
General cargo ship Cargo General cargo
Grab dredger Other Dredger
Heavy load carrier Other Other
Hopper dredger Other Dredger
Hospital vessel Service Service

Mapping maritime activities - within the Baltic Sea | 31
Final ship types after Step 3 HELCOM categorisation
Gross ship types Detail ship types
Hsc Passenger Ferry
Icebreaker Other Other
Inland waterways passenger Passenger Ferry
Inland waterways tanker Tanker Other tanker
Landing craft Other Other
Law_enforcement Other Other
Limestone carrier Cargo Bulk cargo
Liquefied gas Tanker Gas tanker
Live fish carrier Cargo Other cargo
Livestock carrier Cargo Other cargo
LNG tanker Tanker Gas tanker
LPG tanker Tanker Gas tanker
Medical Service Service
Military Other Other
Minehunter Service Service
Minesweeper Service Service
Molasses tanker Tanker Other tanker
Motor hopper Service Service
Naval/naval auxiliary Service Service
Non propelled barge Other Other
Nuclear fuel carrier Cargo Other cargo
Offshore support vessel Service Service
Offshore tug/supply ship Service Service
Oil products tanker Tanker Oil tanker
Ore/oil carrier Cargo Other cargo
Palletised cargo ship Cargo General cargo
Passenger Passenger Undefined passenger
Passenger (cruise) ship Passenger Cruise
Passenger ship Passenger Ferry
Passenger/general cargo ship Passenger ROPAX
Passenger/landing craft Passenger Ferry
Passenger/ro-ro cargo ship Passenger ROPAX
Patrol vessel Other Other
Pilot vessel Other Other
Pipe burying vessel Service Service
Pipe layer Service Service
Platform Service Service
Pleasure Other Yatch
Pollution control vessel Service Service
Pontoon Service Service
Port_tender Other Other
Power station vessel Service Service
Pusher tug Other Tug
Refined sugar carrier Cargo Bulk cargo
Refrigerated cargo ship Cargo Other cargo
Research vessel Service Service
Ro-ro cargo ship Container Container

32 | Mapping maritime activities - within the Baltic Sea
Final ship types after Step 3 HELCOM categorisation
Gross ship types Detail ship types
Sail training ship Other Other
Sailing vessel Other Other
Salvage ship Other Other
Sar Other Other
Seal catcher Other Other
Search & rescue vessel Other Other
Self discharging bulk carrier Cargo Bulk cargo
Ships_according_to_rr Other Other
Standby safety vessel Service Service
Stern trawler Fishing Fishing
Supply tender Service Service
Tanker Tanker Other Tanker
Towing Other Other
Towing_long_wide Other Other
Training ship Service Service
Trawler Fishing Fishing
Tug Other Tug
Undefined Unknown Unknown
Unknown Unknown Unknown
Utility vessel Service Service
Waste disposal vessel Service Service
Water tanker Tanker Other tanker
Vegetable oil tanker Tanker Other tanker
Vehicles carrier Vehicle carrier Vehicle carrier
Well stimulation vessel Service Service
Vessel (function unknown) Other Other
WIG Other Other
Wine tanker Tanker Other tanker
Wood chips carrier Cargo Bulk cargo
Work/repair vessel Service Service
Yacht Other Yatch

Mapping maritime activities - within the Baltic Sea | 33

34 | Mapping maritime activities - within the Baltic Sea
NOTES

LIST OF THE PRODUCTS PREPARED DURING THE BALTIC SCOPE COLLABORATION:
Recommendations on Maritime Spatial Planning Across BordersRecommendations
Sweden
Finland
Denmark
Estonia
Russia
Lithuania
Germany Poland
Latvia
Norway
Belarus
Russia
Riga
Oslo
Stockholm
Helsinki
Tallinn
VilniusMinsk
Copenhagen
GdanskHamburg
on Maritime Spatial Planning Across Borders
Coherent Cross-border Maritime Spatial Planning for the Southwest Baltic Sea -
Results from Baltic SCOPE
Coherent Cross-border Maritime Spatial Planning for the Southwest Baltic Sea
Sweden
Finland
Denmark
Estonia
Russia
Lithuania
Germany Poland
Latvia
Norway
Belarus
Russia
Riga
Oslo
Stockholm
Helsinki
Tallinn
VilniusMinsk
Copenhagen
GdanskHamburg
Results from Baltic SCOPE
Towards Coherent Cross-Border Maritime Spatial Planning in the Central Baltic Sea - Case Study Report From the Baltic SCOPE Project
Towards Coherent Cross-Border Maritime Spatial Planning in the Central Baltic Sea
Sweden
Finland
Denmark
Estonia
Russia
Lithuania
Germany Poland
Latvia
Norway
Belarus
Russia
Riga
Oslo
Stockholm
Helsinki
Tallinn
VilniusMinsk
Copenhagen
GdanskHamburg
Case Study Report From the Baltic SCOPE Project
Lessons Learned: Obstacles and Enablers When Tackling the Challenges of Cross-Border Maritime Spatial Planning - Experiences from Baltic SCOPE
Lessons Learned: Obstacles and Enablers When Tackling the Challenges of Cross-Border Maritime Spatial Planning
Sweden
Finland
Denmark
Estonia
Russia
Lithuania
Germany Poland
Latvia
Norway
Belarus
Russia
Riga
Oslo
Stockholm
Helsinki
Tallinn
VilniusMinsk
Copenhagen
GdanskHamburg
Experiences from Baltic SCOPE
The Ecosystem Approach in Maritime Spatial Planning - A Checklist Toolbox
The Ecosystem Approach in Maritime Spatial Planning
Sweden
Finland
Denmark
Estonia
Russia
Lithuania
Germany Poland
Latvia
Norway
Belarus
Russia
Riga
Oslo
Stockholm
Helsinki
Tallinn
VilniusMinsk
Copenhagen
GdanskHamburg
A Checklist Toolbox
Mapping Maritime Activities within the Baltic Sea
Mapping Maritime Activitieswithin the Baltic Sea
7 October 2016BALTIC SCOPE ProjectProject Partner HELCOM
Evaluation and Monitoring of Transboundary Aspects of Maritime Spatial Planning - a Methodological Guidance
Evaluation and Monitoring of Transboundary Aspects of Maritime Spatial Planning
Sweden
Finland
Denmark
Estonia
Russia
Lithuania
Germany Poland
Latvia
Norway
Belarus
Russia
Riga
Oslo
Stockholm
Helsinki
Tallinn
VilniusMinsk
Copenhagen
GdanskHamburg
a Methodological Guidance
Development of a Maritime Spatial Plan: The Latvian Recipe
Development of a Maritime Spatial Plan:
Sweden
Finland
Denmark
Estonia
Russia
Lithuania
Germany Poland
Latvia
Norway
Belarus
Russia
Riga
Oslo
Stockholm
Helsinki
Tallinn
VilniusMinsk
Copenhagen
GdanskHamburg
The Latvian Recipe
Get them at www.balticscope.eu

Joint results achieved by cooperation between the authorities responsible for Maritime Spatial Planning in the Baltic Sea Region with support of
regional and research organizations.
WWW.BALTICSCOPE.EU