mapping mountain pine beetle mortality through growth ... · mapping mountain pine beetle mortality...
TRANSCRIPT
Remote Sens. 2014, 6, 5696-5716; doi:10.3390/rs6065696
remote sensing ISSN 2072-4292
www.mdpi.com/journal/remotesensing
Article
Mapping Mountain Pine Beetle Mortality through Growth
Trend Analysis of Time-Series Landsat Data
Lu Liang 1, Yanlei Chen
1, Todd J. Hawbaker
2, Zhiliang Zhu
3 and Peng Gong
1,4,5,*
1 Department of Environmental Science, Policy and Management, University of California, Berkeley,
CA 94720, USA; E-Mails:[email protected] (L.L.); [email protected] (Y.C.) 2 U.S. Geological Survey, P.O. Box 25046, DFC, MS 980, Denver, CO 80225, USA;
E-Mail:[email protected] 3 U.S. Geological Survey, 12201 Sunrise Valley Drive, Reston, VA 20192, USA;
E-Mail: [email protected] 4 Ministry of Education Key Laboratory for Earth System Modeling, Center for Earth System
Science, Tsinghua University, Beijing 100084, China 5 Joint Center for Global Change Studies, Beijing 100875, China
* Author to whom correspondence should be addressed; E-Mail: [email protected].
Received: 14 March 2014; in revised form: 9 June 2014 / Accepted: 9 June 2014 /
Published: 18 June 2014
Abstract: Disturbances are key processes in the carbon cycle of forests and other
ecosystems. In recent decades, mountain pine beetle (MPB; Dendroctonus ponderosae)
outbreaks have become more frequent and extensive in western North America. Remote
sensing has the ability to fill the data gaps of long-term infestation monitoring, but the
elimination of observational noise and attributing changes quantitatively are two main
challenges in its effective application. Here, we present a forest growth trend analysis
method that integrates Landsat temporal trajectories and decision tree techniques to derive
annual forest disturbance maps over an 11-year period. The temporal trajectory component
successfully captures the disturbance events as represented by spectral segments, whereas
decision tree modeling efficiently recognizes and attributes events based upon the
characteristics of the segments. Validated against a point set sampled across a gradient of
MPB mortality, 86.74% to 94.00% overall accuracy was achieved with small variability in
accuracy among years. In contrast, the overall accuracies of single-date classifications
ranged from 37.20% to 75.20% and only become comparable with our approach when the
training sample size was increased at least four-fold. This demonstrates that the advantages
of this time series work flow exist in its small training sample size requirement. The easily
OPEN ACCESS

Remote Sens. 2014, 6 5697
understandable, interpretable and modifiable characteristics of our approach suggest that it
could be applicable to other ecoregions.
Keywords: Landsat; mountain pine beetle; time-series classification; temporal
segmentation; decision tree; sample size
1. Introduction
Understanding patterns of forest disturbances is important for assessing past and future ecosystem
structure, function, productivity and diversity [1,2]. In recent years, mountain pine beetle (MPB)
outbreaks have occurred over extensive areas, from British Columba in Canada to New Mexico in the
United States. MPB is endemic to North America; however, the recent outbreaks have reached
epidemic levels that have affected millions of hectares of forests [3]. The effects of MPB infestation
range from altered surface fuel and wildfire hazards [4–7], changed vegetative composition [8],
converted live carbon sinks to dead and slowly decaying carbon sources [9–11], impacted nutrient
cycling and water quality [12,13], shifted evapotranspiration and albedo, modified local surface energy
balance [14] and changed regional climate [15]. Those effects are predicted to increase as a
consequence of the direct and indirect effects of climatic changes [16–18]. However, unlike wildfires
that have received intensive mapping efforts at different scales, characterizations of the extent and
severity of MPB using multi-temporal data have only begun to emerge [19–23].
Remote sensing, both with aerial photography and satellite imagery, has been widely acknowledged
as a useful way to map tree mortality over large areas [24]. Landsat time series stacks (LTSS) are well
suited to this type of analysis, because they are freely available, cover a long time period, have a broad
spatial extent, are multispectral and have temporal continuity [20,25]. Two frequently used disturbance
mapping approaches are (1) trajectory-reconstruction and (2) decision trees (DTs). Trajectory-based
change detection examples include the Landsat-based detection of trends in disturbance and recovery
algorithm (LandTrendr) [26] and the Vegetation Change Tracker [27–29]. Both methods recognize
disturbance events by the rate of changes in time series of spectral properties. This makes the first and
last years of the trajectory more difficult to judge, because the attribution for a particular year is
entirely determined with regard to its spectral deviation from the two adjacent years [26].
In addition, the event labeling procedure depends on pre-implemented modules in the software and,
thus, is not flexible in adjusting to user-defined functions. DT approaches include work by
Goodwin et al. [30] who utilized the annual changes in normalized difference moisture index and a set
of thresholds to classify the presence of MPB infestation over 14 years, resulting in overall accuracies
ranging from 71% to 86%. DT-based approaches have the capacity to integrate expert knowledge and
flexible classification schemes. However, poor image quality from sensor drift, geometric
misregistration and topographic and cloud shadows will introduce distortions to images and affect the
accuracy of change detection.
In this study, we describe a forest growth trend analysis method that integrates the robust change
detection strengths of the trajectory reconstruction approach and the flexible user-defined advantages
of DT approaches to characterize MPB mortality with an 11-year LTSS. We were interested in

Remote Sens. 2014, 6 5698
determining whether or not this proposed method could reach an accuracy target of 85% or greater.
Additionally, we compared its accuracy with single-date image classifications, which are still
important and commonly used in disturbance mapping, especially in two-date post-classification
change detection. We are aware that the accuracy of single-date image classification is not only
determined by the input variables and classifiers, but is also heavily dependent on the quality and
quantity of training samples [31], which may have larger impacts than the implemented techniques [32].
Thus, we also assessed the effect of different sample sizes on the accuracy of single-date image
classifications, and we tested how much our proposed method can improve sampling efficiency as
compared with the single-date classifiers.
2. Study Area and Data
2.1. Study Area
Our study area was located in Grand County, in north-central Colorado (Figure 1), with a total land
area of 4783 km2. This landscape is dominated by evergreen forests mainly composed of lodgepole
pine (Pinus contorta), along with other tree species, as well as shrub and grass cover types. Summer in
Grand County is typically hot and dry, which is suitable for MPB development. The average
precipitation per year is approximately 400 mm, whereas the U.S. average is 930 mm. This county has
one of the highest concentrations of lodgepole pines and has been heavily affected by the MPB
outbreak that started around 2002 and reached the peak of tree mortality between 2005 and 2008 [33].
Figure 1. The study area used for our analyses. The Southern Rocky Mountain ecoregion
is shown in blue, and Grand County, Colorado, USA, is shown in red. The imagery is a
false-color composite of one Landsat image acquired on 21 August 2009.

Remote Sens. 2014, 6 5699
2.2. Landsat Time Series Stack
Grand County lies entirely within Landsat path 34 row 32. We restricted the image acquisition
season from June to September, because this snow-free period is the recommended time window to
detect MPB mortality [20]. For each year, one cloud-free or mildly contaminated image was selected
to build the LTSS, and if no such image existed, several partly cloudy images with a similar phenology
were used as replacements (Table 1). All data were processed to Level 1T (terrain corrected).
Radiometric calibration and atmospheric correction for cloud and aerosol effects were performed using
the Landsat Ecosystem Disturbance Adaptive Processing System [34]. Clouds and their shadows were
automatically screened using the Function of mask (FMASK) algorithm [35]. Cloud removal effects
were judged satisfactory via visual checking, though the extent of cloud cover was slightly
overestimated. We accepted this false positive error, because commission errors were more desirable
than omission errors in cloud filling. The number of clear observations in the LTSS over the period of
2000 to 2011 is shown in Figure 2, and 98% of the study region contained more than 10 cloud-free
observations.
Table 1. Characteristics of the Landsat images used in this analysis.
Year Month and Day Julian Day Cloud Cover (%) Cloud Cover over MPB Host Area (%) *
1 2000 July 13 193 42.35 1.09
2 2000 July 21 201 4.74
3 2001 June 28 179 18.87 4.24
4 2001 July 22 203 17.05
5 2002 July 1 182 1.92 0.15
6 2003 July 4 185 5.48 0.49
7 2004 July 8 188 10.49 7.94
8 2005 September 11 254 2.08 0.25
9 2006 July 28 209 2.30 1.26
10 2007 July 31 212 20.39 4.22
11 2007 August 16 228 13.19
12 2008 August 20 231 28.91 9.79
13 2008 September 5 247 36.83
14 2009 August 21 233 2.04 0.00
15 2010 September 25 268 3.37 0.89
16 2011 August 11 223 22.13 2.67
17 2011 August 27 239 16.45
Notes: MPB, mountain pine beetle; * the final cloud cover in a particular year in MPB host forest areas is
after using clean pixels in one image to fill cloudy areas in another image that is in the same
phenological state.
Since MPBs attack a limited number of tree species, we confined our analysis to the extent of their
host species in the LANDFIRE Refresh 2001 Existing Vegetation Type data layer (EVT), which was
developed using circa 2001 (1999–2003) Landsat imagery [36]. The spatial resolution of the
LANDFIRE data matches the LTSS, and the time period of the imagery from which the EVT data
were derived depicts the pre-disturbance distribution of vegetation in Grand County. Currently, MPB

Remote Sens. 2014, 6 5700
mortality is concentrated in lodgepole and ponderosa pine (Pinus ponderosa) forests, but other pine
species, like limber pine (Pinus flexilis) and bristlecone pine (Pinus aristata), have also been found to
be suitable hosts [37]. We included all EVT pixels that contain any of those species (Table S1),
and smoothed the image with a 3 × 3 majority filter, which was designed to reduce observed
salt-and-pepper effects and to minimize omission errors that are much higher than commission errors
for the selected classes [38].
Figure 2. Forest type map for Grand County, from (a) the LANDFIRE existing vegetation
type data and (b) the number of clear Landsat observations over the period of 2000 to 2011.
2.3. Reference Sample Selection
We randomly placed training samples over forested areas and reconstructed their disturbance
history with the aid of normalized burn ratio (NBR) time series from the LTSS and the 1-m resolution
U.S. Department of Agriculture (USDA) National Agricultural Imagery Program (NAIP) imagery
(obtained from the USDA Geospatial Data Gateway), which were available for years 2005, 2009 and
2011 in Grand County. The NBR time series were calculated using bands 4 and 7 from the Landsat
imagery [39] and then multiplied by 100, so they could be represented as integer values instead of
floating point values. For each training location, we identified the disturbance event type, duration and
onset time (Table 2). Disturbance event types included: healthy, MPB mortality or clearcuts. Fire was
not included, because large fires did not occur in our study area during the time period of this study
(2000 to 2011), as indicated by the U.S. Geological Survey Monitoring Trends in Burn Severity
database [40]. In total, we collected 106 training samples, among which, 53 were sites with MPB

Remote Sens. 2014, 6 5701
mortality, 37 were clearcuts and 16 were healthy. We selected the relatively small number of training
samples, because many studies suggested that trajectory-based methods perform well when trained
with a relatively small sample size [23,26,41]. Statistical classifiers require more training data to fully
represent each class in the feature space [42]. Thus, we expanded the original training sample size by
10 times to a total of 1060 training samples. For those newly added samples, we only identified their
disturbance types in the three years for which NAIP imagery were available instead of the whole NBR
trajectory from the LTSS.
For validation purposes, we randomly sampled points in strata that were formed in the complete
temporal-spectral space as a representation of the gradient of MPB mortality. In this manner, our test
samples were able to cover a complete spectrum of disturbance events and a range of mortality.
Considering the large data volume of the 11-year LTSS, for which the dimension was
2964 (rows) × 2901 (columns) × 102 (bands), we employed an efficient unsupervised classification
tool, Clustering Based on Eigenspace Transformation, to improve the speed of clustering over
conventional K-means without losing accuracy [43]. Fifty strata were developed, and we
proportionately allocated a total of 100 points to each stratum. In the absence of sufficient ground and
ancillary information, we visually interpreted the status for each point at each individual year. By
checking the proportion of points in the three classes, we found that they are almost equally distributed
without severe over- or under-representation; the mean number of validation samples in each disturbance
type each year was 39 (healthy), 38 (MPB mortality) and 23 (clearcuts; Table S2).
Table 2. Examples of normalized burn ratio (NBR) trajectories, National Agricultural
Imagery Program (NAIP) data and in situ photos for healthy forest, MPB mortality and
clearcut classes.
Class Landsat NAIP Photo
Healthy
conifer forest
MPB mortality
Clearcut

Remote Sens. 2014, 6 5702
3. Method
3.1. Temporal Segmentation
We developed time series of disturbance maps by combining the temporal trajectory analysis
approach of LandTrendr [26] with a decision tree labeling procedure. Temporal trajectory analysis was
used to decompose often noisy time series into a sequence of straight-line segments with distinct
features designed to capture the event that happened for the duration of each segment. NBR [39] was
chosen to represent the vegetation condition, because of its sensitivity to disturbance [26] and its
capacity to minimize radiometric differences among images. The general procedure was to use a set of
parameters to enhance the signal-to-noise ratio of the NBR time series in order to capture the salient
events happening in each period or segment. Details can be found in Kennedy et al. [26], and the final
effect of temporal segmentation, whether it was under-segmentation (split up into too few parts) or
over-segmentation (subdivided into too many parts), was determined by the parameters listed in
Table 3. Optimal LandTrendr parameter settings have been tested in the forests of the Northwest
Pacific Region at both Landsat and MODIS scales [26,41]. However, because we are not aware of
reported parameter results in the literature specific to the Southern Rocky Mountain ecoregion, we
tested a range of candidate parameter values (Table 3).
Table 3. LandTrendr parameters, descriptions, suggested values from Kennedy et al. (2010) [26]
and the values tested for this study and ultimately selected for this study to reduce the raw
normalized burn ratio (NBR) time series values to a number of linear segments.
Parameter Description and Units
Kennedy
et al.
(2010) [26]
Values
Tested
Value
Selected
Despike
An outlier will be removed if the proportional
difference in NBR values between two adjacent
points is less than this parameter.
0.90 0.75; 0.9; 1 0.90
Max_seg The maximum number of segments allowed in
fitting. 4 3; 4; 5 4
VertexOvershoot The first round regression detected vertices can
overshoot (max_seg + 1) vertices by this value. 3 0; 3 0
pval
A pixel will be considered as no change if its
p-value of the F-statistic for the entire trajectory
is above this threshold.
0.05 0.05; 0.1 0.1
Recovery_threshold
If the slope of a segment positively spans the
whole spectral range within
1/recovery_threshold years, it will be rejected.
0.25 0.25; 1 0.25
BestModelProportion
A simpler model will be chosen if its
F-statistic exceeds this proportion of the best
fitting model.
0.75 0.75; 1 0.75
We ran LandTrendr on all combinations of the candidate parameter values, which resulted in
144 unique combinations in total, and then visually compared their temporal segmentation results with the

Remote Sens. 2014, 6 5703
original NBR time series for the 106 training samples. Thus, the calibration involved 15,264 comparisons.
Each individual comparison for a sample was coded in a binary state using two criteria: the overall
match in the shape and the timing of vertices. A good match occurred if the disturbance event that
happened at that pixel was successfully captured, and the slope and magnitude for each segment
deviated little from the central trend. The vertex timing was judged by how well the algorithm captured
the onset and ending time of each disturbance event. If both criteria were satisfied, that comparison
would be scored as 1, and otherwise, it would be 0. The optimal parameter set was decided based upon
the pooled rankings across all training samples. The processing time took about 200 minutes (on
5,376,538 unmasked pixels) for this step, which was run on a workstation with an Intel i7-2600
3.4 GHz quad core CPU and 8 gigabytes of physical memory.
3.2. Decision Tree-Based Spectral Segment Labeling
The outputs of the temporal segmentation included the fitted segments, and a set of vertices
connecting individual segments. We employed a DT to attribute disturbance events associated with
those vertices and segments, with leaf nodes representing class labels and branches representing
decision scenarios. The DT was built with predictors characterizing each segment: the disturbance
occurrence onset time, duration and the magnitude of NBR change. We defined the onset time as the
starting year of a segment. Magnitude was the absolute change in NBR between the ending year and
the onset year, whereas duration was the time elapsed over the length of one segment. Different types
of disturbance events were characterized by distinct features. For instance, clearcuts could be
recognized by segments with a short duration and large, negative change in NBR, whereas MPB
mortality segments tended to have a gradual, but long-duration decline in NBR values.
Decision rules were used to identify forest conditions in a top-down sequence (Figure 3), and the
definition of key parameters are explained in Table 4. These parameters were manually calibrated with
the same training samples described in Section 3.1. Specifically:
(1) Segments were separated into regrowth, stable or disturbed status according to their magnitude
(mag) at the first level of the DT. If the absolute magnitude of one segment was less than the
pre-set threshold (<thre_mag1), it was treated as disturbed. If the magnitude was within a
threshold range (±thre_mag1), then it was considered to be stable. Otherwise, it was considered
to be in a regrowth stage (>thre_mag1).
(2) To label a segment as regrowth or stable, healthy vertices were identified based on an NBR
threshold (thre_vertex1). Thus, a vertex in either a regrowth or stable period with its NBR value
greater than the thre_vertex1 parameter was labeled as healthy.
(3) Segments classified as disturbed in Step 2, were labeled as clearcuts if their rate of change in
NBR was greater than a second threshold (thre_mag2); otherwise, segments were labeled as
MPB mortality. The rate of change was defined as the average NBR change per year, which is a
reflection of both magnitude and duration. The thre_mag2 parameter was designed based on
the assumption that clearcuts always have more abrupt and rapid decreases in NBR than
MPB mortality.
(4) In the third level of the DT hierarchy, the label from the previous year (pre_label) was critical in
determining the label for the current vertex. This was based on the assumption that events are
Remote Sens. 2014, 6 5704
temporally dependent and forests can only logically transition from certain states to another.
For instance, clearcuts often result in abrupt declines in NBR followed by persistent, but slow
increases in NBR. Although the magnitude of change in the post-clearcut period is not as sharp
as that of the pre-clearcut period, the vertices in the subsequent years will still be assigned as
clearcut to ensure that the disturbance class labels have temporal consistency.
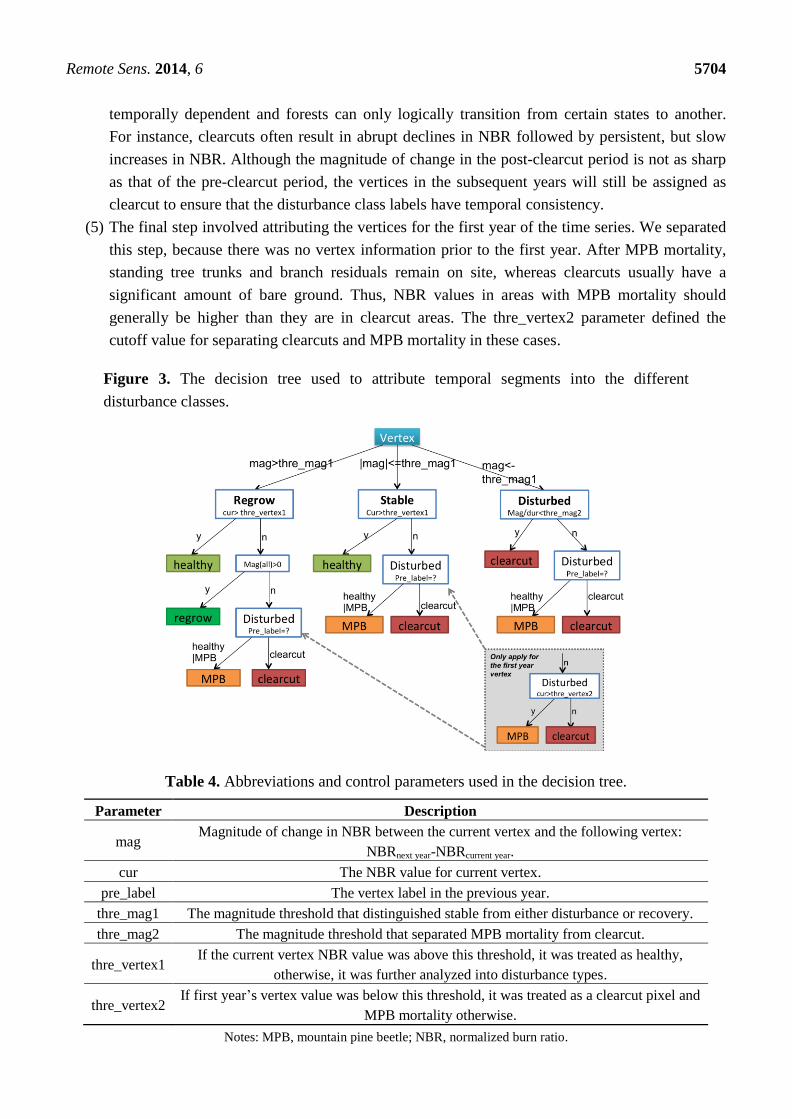
(5) The final step involved attributing the vertices for the first year of the time series. We separated
this step, because there was no vertex information prior to the first year. After MPB mortality,
standing tree trunks and branch residuals remain on site, whereas clearcuts usually have a
significant amount of bare ground. Thus, NBR values in areas with MPB mortality should
generally be higher than they are in clearcut areas. The thre_vertex2 parameter defined the
cutoff value for separating clearcuts and MPB mortality in these cases.
Figure 3. The decision tree used to attribute temporal segments into the different
disturbance classes.
Table 4. Abbreviations and control parameters used in the decision tree.
Parameter Description
mag Magnitude of change in NBR between the current vertex and the following vertex:
NBRnext year-NBRcurrent year.
cur The NBR value for current vertex.
pre_label The vertex label in the previous year.
thre_mag1 The magnitude threshold that distinguished stable from either disturbance or recovery.
thre_mag2 The magnitude threshold that separated MPB mortality from clearcut.
thre_vertex1 If the current vertex NBR value was above this threshold, it was treated as healthy,
otherwise, it was further analyzed into disturbance types.
thre_vertex2 If first year’s vertex value was below this threshold, it was treated as a clearcut pixel and
MPB mortality otherwise.
Notes: MPB, mountain pine beetle; NBR, normalized burn ratio.
Remote Sens. 2014, 6 5705
3.3. Post-Labeling Process
Both the temporal segmentation and DT were run at the pixel level. Thus, it was possible that two
adjacent pixels could simultaneously experience the same event, but were labeled differently due to
errors. Since most disturbance events were patchy, the behavior of spatially adjacent pixels could be
used to enhance the robustness of the classification. Based on this logic, we filled small holes in a large
patch that were undetected or mislabeled. To do this, we first applied a 3 × 3 majority filter to reduce
the salt-and-pepper effect and merged pixels into more complete patches, and then, we used a 3-year
temporal filter to remove illogical transitions over time. For example, this step would change a pixel
classified as MPB mortality in Year 1, healthy in Year 2 and MPB mortality in Year 3, to MPB
mortality for all 3 years.
3.4. Single-Date Classification
Single-date mapping strategies were assessed using a traditional maximum likelihood classifier
(MLC) and a random forest (RF) algorithm. MLC is a parametric method widely used in forest remote
sensing [44]. In contrast, RF is a machine-learning technique that combines the results of many
(thousands) of weak classifiers, such as classification and regression trees [45]. RF is often praised for
its good overall performance, as well as robustness to noise [46]. We implemented the classifiers on
both the raw spectral bands and a combination of raw spectral bands and spectral indices that were
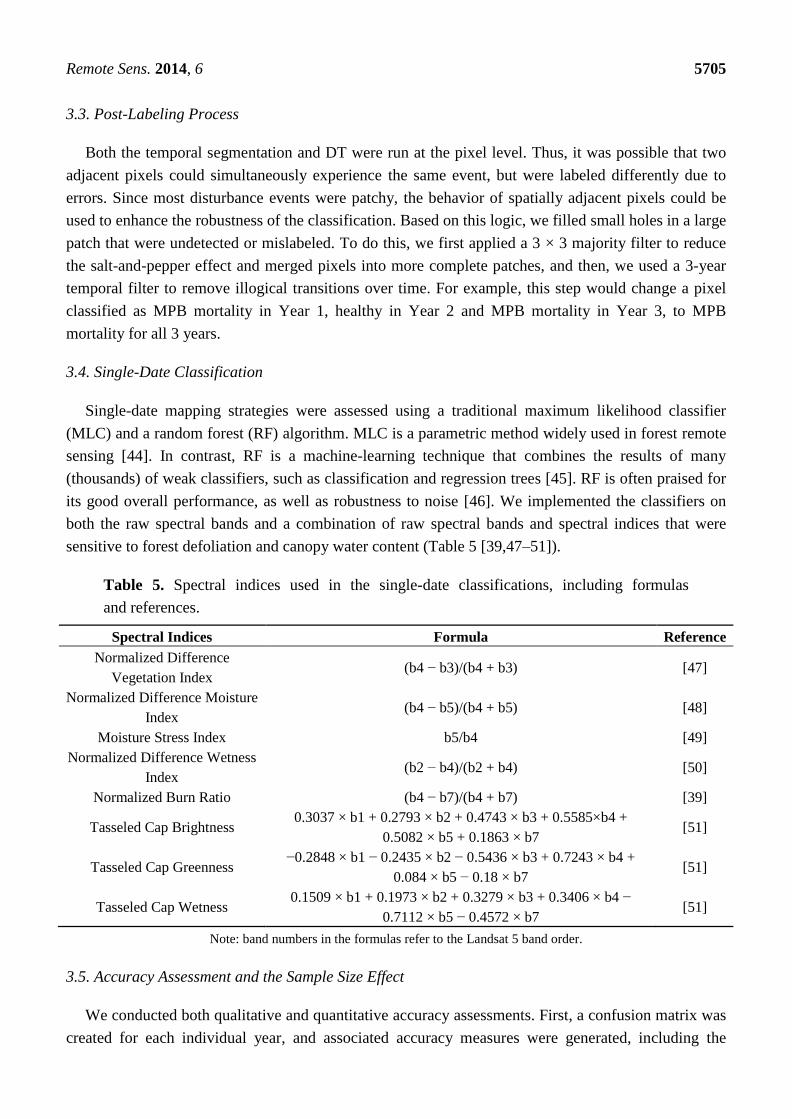
sensitive to forest defoliation and canopy water content (Table 5 [39,47–51]).
Table 5. Spectral indices used in the single-date classifications, including formulas
and references.
Spectral Indices Formula Reference
Normalized Difference
Vegetation Index (b4 − b3)/(b4 + b3) [47]
Normalized Difference Moisture
Index (b4 − b5)/(b4 + b5) [48]
Moisture Stress Index b5/b4 [49]
Normalized Difference Wetness
Index (b2 − b4)/(b2 + b4) [50]
Normalized Burn Ratio (b4 − b7)/(b4 + b7) [39]
Tasseled Cap Brightness 0.3037 × b1 + 0.2793 × b2 + 0.4743 × b3 + 0.5585×b4 +
0.5082 × b5 + 0.1863 × b7 [51]
Tasseled Cap Greenness −0.2848 × b1 − 0.2435 × b2 − 0.5436 × b3 + 0.7243 × b4 +
0.084 × b5 − 0.18 × b7 [51]
Tasseled Cap Wetness 0.1509 × b1 + 0.1973 × b2 + 0.3279 × b3 + 0.3406 × b4 −
0.7112 × b5 − 0.4572 × b7 [51]
Note: band numbers in the formulas refer to the Landsat 5 band order.
3.5. Accuracy Assessment and the Sample Size Effect
We conducted both qualitative and quantitative accuracy assessments. First, a confusion matrix was
created for each individual year, and associated accuracy measures were generated, including the

Remote Sens. 2014, 6 5706
overall accuracy, kappa, producer’s accuracy and user’s accuracy. Second, we also visually evaluated
the results by comparing the mapped spatio-temporal pattern of mortality with those observed by the
Forest Health Monitoring Aerial Detection Survey (ADS) data [52]. The ADS data are generated by
aerial sketchmapping, a technique for observing and mapping forest damage from an aircraft. Although
ADS had been criticized for its imprecision at fine scales due to reasons, such as misregistration and
the subjectiveness of the operators [23], it is reliable when used at coarse scales [52]. A pilot study
initiated in the Rocky Mountain Region demonstrated that all three types of accuracies for the MPB
detection in lodgepole pines exceeded 80% when the spatial tolerance was increased to 500 m [52].
We thus had confidence that the epicenters and patterns of spread derived from ADS polygons could
be used as a reference dataset to compare against our results. We also altered the size of the training
sample dataset from 106 to 1060 in increments of 10% and tested the effects of sample size on
accuracy. This produced 10 corresponding sets of results to test the effect of sample size on accuracy
metrics for both the MLC and RF classifications.
4. Results
4.1. Parameter Calibration for Temporal Segmentation and Decision Tree Labeling
Parameter calibration in the forest growth trend analysis involved two parts. At the temporal
segmentation stage, the set of parameters producing the highest score from all 144 combinations was
chosen (Table 3). By using the same set of training samples, we also determined the four threshold
values in the DT. We set the allowed variability in NBR for stable segments (thre_mag1) to be 20
(the unit for all thresholds was NBR × 100) as reflected from Figure 4. The cut-off NBR value of
vertices (thre_vertex1) to distinguish healthy forest from disturbances was 350. Threshold Thre_mag2,
used to separate clearcuts from MPB mortality, was set at −150. A higher degree of overlap was
observed between the post-clearcut and MPB mortality NBR values, and thus, we set thre_vertex2 to
the third quantile of NBR values in clearcuts, which was 50.
4.2. The Performance of Forest Growth Trend Analysis
The forest growth trend analysis achieved an overall annual accuracy ranging from 86.74% to
94.00%, and the average was 90.31% (Table 6). Except for the user’s accuracy for MPB mortality
(84.81%) and the producer’s accuracy for clearcuts (77.30%), the mean value for all types of
accuracies was above 85%. Larger standard deviations of accuracies among different years were found
in the producer’s accuracy for healthy forest and the producer’s accuracy for clearcuts. As indicated
from the confusion matrix (Table S2) and Figure 5, healthy pixels were well distinguished from the
two disturbance types in the first few years and became less separable from MPB mortality after 2005.
Pixels with MPB mortality were confused with either healthy or clearcut classes, but the proportion
was not high. Confusion between clearcuts and healthy classes occurred in the first few years of our
study and then between clearcuts and MPB mortality in later years. Visual examination showed that
the shifting of MPB outbreak epicenters and the expansion of the outbreak boundaries was congruent
between the two independent datasets (ADS and validation points). Maps of the onset year of MPB

Remote Sens. 2014, 6 5707
mortality revealed that the MPB outbreak in Grand County was initiated at multiple locations and spread
outward from those locations over time to affect nearly all habitats with suitable hosts (Figure 6).
Figure 4. Tukey boxplot for (a) the averaged annual normalized burn ratio (NBR,
multiplied by 100) changes of stable, regrowth, MPB mortality and clearcut plots;
(b) current vertex values of post-MPB mortality, post-clearcut events and healthy plots.
The bottom and top of the box are the first and third quartiles, and the band inside the box
is the median. The whiskers represent the 1.5 interquartile range of the lower and
upper quartile.
(a) (b)
Table 6. Accuracy assessment results for individual years of the time series classification.
Year Healthy MPB Mortality Clearcut
OA Kappa PA UA PA UA PA UA
2000 89.00 82.21 100.00 83.02 88.89 94.12 65.00 100.00
2001 90.00 84.23 100.00 95.74 100.00 79.49 58.33 100.00
2002 89.00 82.88 100.00 95.56 93.75 78.95 64.00 94.12
2003 93.00 88.92 100.00 93.18 94.87 92.50 75.00 93.75
2004 92.00 87.41 100.00 100.00 89.74 89.74 78.95 78.95
2005 91.00 85.51 91.49 97.73 97.14 80.95 77.78 100.00
2006 86.74 78.99 72.97 96.43 95.24 78.43 94.74 94.74
2007 94.00 90.49 92.11 100.00 97.67 89.36 89.47 94.44
2008 91.00 86.20 82.35 96.55 97.50 84.78 92.31 96.00
2009 91.00 85.81 87.10 96.43 100.00 84.62 80.00 100.00
2010 90.00 84.56 97.14 97.14 95.00 84.44 72.00 90.00
2011 87.00 79.64 81.25 92.86 95.35 80.39 80.00 95.24
mean 90.31 84.74 92.03 95.39 95.43 84.81 77.30 94.77
SD 2.18 3.45 9.25 4.46 3.47 5.47 11.35 5.92
Notes: OA, overall accuracy; PA, producer’s accuracy; UA, user’s accuracy; SD, standard deviation.

Remote Sens. 2014, 6 5708
Figure 5. The proportion of validation samples that were erroneously labeled in other classes.
Notes: H, healthy; M, MPB mortality; C, clearcut; H2M is explained as ―healthy samples classified to
MPB mortality‖.
Figure 6. (a) Classification results of the forest growth trend analysis in the years 2000,
2005 and 2011; (b) maps of the onset year, duration and magnitude of mountain pine beetle
(MPB) mortality.
(a)
(b)

Remote Sens. 2014, 6 5709
4.3. Comparison with Single-Date Classification and Sample Size Effects
The accuracy achieved by the single-date classification ranged between 37.20% and 75.20% and
was lower than the time series classification, running on either the raw or combined spectral bands
trained by the same set of samples (Table 7). We also observed that the time-series classification
accuracies were relatively stable over time. In contrast, the single-date image classifications had high
year-to-year variability in accuracy, which was shown by a distinct, increasing trend of the producer’s
accuracy for MPB mortality from 2005 to 2011. The producer’s accuracy for healthy forest decreased
substantially over the same time period. Table 7 also listed the accuracies generated from RF and MLC
with only the raw spectral bands and the combined use of raw spectral bands and spectral indices. The
accuracy of the RF classification improved when the spectral indices were included as predictors, and
this effect was not evident with the MLC. Between the two single-date classification methods, RF had
better overall performance than MLC.
Table 7. Accuracy comparison among the time series classification, random forests (RF)
and maximum likelihood classifier (MLC) with the same set of 2005, 2009 and 2011
validation samples. Only the mountain pine beetle (MPB) mortality class is included here.
Year Time-Series
Trend Analysis RF MLC
raw combined raw combined
2005
UA 80.95 68.00 67.30 71.96 88.00
PA 97.14 18.78 62.40 85.08 65.90
OA 91.00 63.82 74.40 75.20 73.50
2009
UA 84.62 46.15 100.00 39.63 0.00
PA 100.00 35.43 48.70 100.00 100.00
OA 91.00 53.47 72.90 40.94 38.70
2011
UA 80.39 78.47 77.80 37.92 22.20
PA 95.35 83.06 10.80 100.00 100.00
OA 87.00 66.62 40.40 38.15 37.20
Notes: ―raw‖ denotes classification with solely spectral data, and ―combined‖ denotes classification with the
combined use of spectral and index data; PA, producer’s accuracy; UA, user’s accuracy; OA, overall accuracy.
By varying the number of training samples used to train the MLC and RF classifiers in 10%
increments to a maximum of 1060 training samples, we obtained 10 sets of results for the single-date
classifications. Figure 7 shows the relationships between accuracy and sample size, for overall
accuracy generated from the MLC and RF classifiers, as well as the producer’s accuracy and the user’s
accuracy for the MPB mortality class. Despite some small fluctuations, all accuracies increased with
the training sample size, and the changes were especially pronounced for the initial increases in sample
size. The highest overall accuracies were achieved when 100%, 100% and 90% of the training samples
were used by RF (89.43%, 90.48%, 88.66%) and 100% of the training samples were used by MLC
(88.41%, 82.93%, 85.90%). This improvement was substantial compared to the results based on the
original set of 106 training samples. The overall accuracy for RF increased by 30% on average from
the smallest to the highest training sample size, 8% for the producer’s accuracy and 33% for the user’s
accuracy. For MLC, the average increase was 40% in overall accuracy, 31% in the producer’s

Remote Sens. 2014, 6 5710
accuracy and 43% in the user’s accuracy between the smallest and largest training sample sizes. We
also noticed that after a certain training sample size, the accuracy stopped increasing or even slightly
decreased, and the saturation position was around the 40% sample size (or 424 points) for all accuracy
metrics and both classifiers. Accuracies after the saturation point were comparable to the time series
classification results.
Figure 7. Relationships between accuracy and sample size for the maximum likelihood
classifier (MLC) and random forests (RF) using multiple training sets. Graphs arranged
from left to right display the trends of overall accuracy, the producer’s accuracy and the
user’s accuracy for the mountain pine beetle (MPB) mortality class as the training sample
proportion increases from 0.1 to one. Blue and solid lines represent RF results, whereas
green and dashed lines represent MLC results. Red arrows indicate the mean accuracies
produced by the forest growth trend analysis in the years 2005, 2009 and 2011.
5. Discussions
For the single-date classification, we found the following: (1) The RF achieved better overall
accuracy than MLC in detecting forest disturbances. MLC relies on assumptions about the data
distribution (e.g., normally distributed), whereas the ensemble learning techniques used by RF do
not [53]. Meanwhile, by grouping many individual classifiers, RF combined the strengths and
minimized the weaknesses of each [54]. (2) MLC is less affected by the selection of input layers than
RF. RF relies on all outputs produced by each individual tree that is built upon the random selection of
input layers, and thus, a larger amount of features could create a higher probability of ―irrelevant‖
features being selected; but, when this occurs, it is usually negated by using the ensemble of results
from individual trees. (3) The accuracies of single-date image classifications showed prominent
year-to-year variability. The omission error for MPB mortality declined consistently from 2005 to
2011, whereas the omission error for healthy forest increased significantly. During this period, Grand
County was in a steady transition from a landscape dominated by healthy forests to a landscape
dominated by ―grey-stage‖ forests. Not coincidently, the declining trend in the proportion of healthy
forest matches the declining tendency of its omission errors over the years.
Remote Sens. 2014, 6 5711
From the experiment on the sample size effect, on the one hand, we could determine the optimal
sample size in the single-date MPB mortality mapping, which, to our knowledge, has not been
discussed before. Both MLC and RF were sensitive to sample size, and several studies are in
accordance with our conclusion [55–57]. Parametric algorithms are well known for their
requirement of representative samples, and this requirement is usually satisfied by having a sufficiently
large sample size [58]. Studies on sample-size effects for non-parametric classifiers are relatively rare.
Rodriguez-Galiano et al. [59] observed a significant reduction in overall accuracy and the kappa values
when the sample size reduced more than 50% of a non-parametric RF applied to Landsat images.
In our case, if we take both accuracy and labor/economic/time costs into consideration, the most
optimum sample size for single-date classification is four to five times the original training sample
size, which included 106 samples. On the other hand, we could compare the efficiency of single- and
multi-date classifications. By using the same 106 training samples, our time series approach
substantially outperformed the single-date classification, and their accuracies were similar only after
expanding the training sample size to a large number (e.g., 10 times), which matches the finding from
another study concluding that either single- or multi-date methods in Landsat-based forest disturbance
mapping could result in high classification accuracy [60], but our results confirm their findings only
for large training sample sizes.
Although the forest growth trend analysis method is promising in many ways, several shortcomings
exist: (1) Regardless of the high overall accuracy, the commission error for clearcuts and the omission
error for beetle mortality were relatively high. The commission errors in clearcuts could be caused by
the spectral similarity between post-clearcut pixels dominated by successional vegetation and healthy
forest pixels. Errors of commission for MPB mortality usually happened in areas hosting a mixture of
grey stage trees and bare land, which could lead to a misclassification to clearcuts. (2) Parameter
calibration was the most time-consuming part in the whole procedure and requires the expertise of
image analysts. In some sense, the identification of various disturbance types using temporal
trajectories is more challenging than the visual interpretation of false-color or true color image
composites. Several potential solutions include the use of a tool called TimeSync, which was
developed to aid with the temporal segmentation calibration and to verify the output from
Landtrendr [60]. In addition, the Forest Inventory and Analysis (FIA) Program of the U.S. Forest
Service consistently collects information on status and trends in forest species, health status, in total
tree growth, mortality and removals by harvest. If FIA plots, or similar types of data, and their exact
locations are available to users, they could aid the identification of the plots’ disturbance history. In
terms of the labeling, although the manmade decision tree, as shown in Figure 3, can be easily
interpreted, a machine learning-based decision tree could be employed to make this step fully automatic.
6. Conclusions
Reconstructed forest disturbance histories are needed for a range of applications, and our paper
tested an effective and efficient approach to generating disturbance histories using the Landsat time
series stack. Our algorithm was designed to take advantage of differences in the magnitude and
direction of changes in spectral indices, which are proxies for the physiological processes following
different types of forest disturbances. The site-specific accuracy assessment in the three validation

Remote Sens. 2014, 6 5712
years indicated that the overall accuracy ranged from 86.74% to 94.00%, and the mean value of all
types of accuracies was above 85%. Especially, our method outperformed standard classification
approaches (maximum likelihood classification and random forest) by 15.8% to 52.3% when small
training sample sizes (106 samples per study area) were used, which is a cost-saving advantage.
Another strength of our strategy is that most parameters, especially at the attributing stage, are easily
interpreted and modified, which will especially benefit users tackling similar problems of labeling
change detection results.
In conclusion, our results demonstrate the potential for a forest growth trend analysis to characterize
forest disturbance events with an optimal sampling scheme, both in economic and time terms, at a
satisfying mapping accuracy level. Some short-term goals for our further studies will include
improving the labeling step by replacing it with an automated machine learning technique, linking the
magnitude of change with more ecologically meaningful properties, such as vegetation cover,
extending the algorithm to the ecoregion scale, building spatio-temporal dynamic outbreak models on
the time series maps with projections into the future. In addition to those applications, the spatially
explicit information produced by our approach could also serve as raw material to facilitate other
research to uncover new patterns of disturbances occurring on the landscape and to investigate the
drivers generating the patterns of disturbances.
Acknowledgments
We are grateful to the U.S. Geological Survey, Climate and Land Use Mission Area Land Remote
Sensing Program, which provided funding to support this research (Grant Number G12AC20085).
Three anonymous reviewers and Bruce Wylie, Diane Stephens and Janet Slate provided insightful
comments on a previous draft of this manuscript, and their comments helped greatly to improve the
completeness and clarity of the manuscript. Any use of trade, firm or product names is for descriptive
purposes only and does not imply endorsement by the U.S. Government.
Author Contributions
All authors have made significant contributions to the manuscript. Zhiliang Zhu and Peng Gong had
the original idea, supervised the study, and contributed in manuscript revision. Lu Liang is the main
author who wrote the manuscript. Lu Liang and Todd J. Hawbaker developed the algorithm. Lu Liang and
Yanlei Chen conducted pre-processing of the images and the accuracy assessment. Todd J. Hawbaker
contributed in the language editing.
Conflicts of Interest
The authors declare no conflict of interest.
References
1. Turner, M.G. Disturbance and landscape dynamics in a changing world. Ecology 2010, 91,
2833–2849.

Remote Sens. 2014, 6 5713
2. Wang, W.; Peng, C.; Kneeshaw, D.D.; Larocque, G.R.; Luo, Z. Drought-induced tree mortality:
Ecological consequences, causes, and modeling. Environ. Rev. 2012, 20, 109–121.
3. Hicke, J.A.; Meddens, A.J.; Allen, C.D.; Kolden, C.A. Carbon stocks of trees killed by bark
beetles and wildfire in the western United States. Environ. Res. Lett. 2013, 8, 035032.
4. Parker, T.J.; Clancy, K.M.; Mathiasen, R.L. Interactions among fire, insects and pathogens in
coniferous forests of the interior western United States and Canada. Agric. For. Entomol. 2006, 8,
167–189.
5. Jenkins, M.J.; Hebertson, E.; Page, W.; Jorgensen, C.A. Bark beetles, fuels, fires and implications
for forest management in the Intermountain West. For. Ecol. Manag. 2008, 254, 16–34.
6. Hicke, J.A.; Johnson, M.C.; Hayes, J.L.; Preisler, H.K. Effects of bark beetle-caused tree
mortality on wildfire. For. Ecol. Manag. 2012, 271, 81–90.
7. Schoennagel, T.; Veblen, T.T.; Negron, J.F.; Smith, J.M. Effects of mountain pine beetle on fuels
and expected fire behavior in lodgepole pine forests, Colorado, USA. PLoS One 2012, 7, e30002.
8. Collins, B.J.; Rhoades, C.C.; Hubbard, R.M.; Battaglia, M.A. Tree regeneration and future stand
development after bark beetle infestation and harvesting in Colorado lodgepole pine stands.
For. Ecol. Manag. 2011, 261, 2168–2175.
9. Kurz, W.A.; Dymond, C.; Stinson, G.; Rampley, G.; Neilson, E.; Carroll, A.; Ebata, T.; Safranyik, L.
Mountain pine beetle and forest carbon feedback to climate change. Nature 2008, 452, 987–990.
10. Running, S.W. Ecosystem disturbance, carbon, and climate. Science 2008, 321, 652–653.
11. Caldwell, M.; Hawbaker, T.; Briggs, J.; Cigan, P.; Stitt, S. Simulated impacts of mountain pine
beetle and wildfire disturbances on forest vegetation composition and carbon stocks in the
Southern Rocky Mountains. Biogeosciences 2013, 10, 12919–12965.
12. Edburg, S.L.; Hicke, J.A.; Brooks, P.D.; Pendall, E.G.; Ewers, B.E.; Norton, U.; Gochis, D.;
Gutmann, E.D.; Meddens, A.J. Cascading impacts of bark beetle-caused tree mortality on coupled
biogeophysical and biogeochemical processes. Front. Ecol. Environ. 2012, 10, 416–424.
13. Mikkelson, K.M.; Bearup, L.A.; Maxwell, R.M.; Stednick, J.D.; McCray, J.E.; Sharp, J.O.
Bark beetle infestation impacts on nutrient cycling, water quality and interdependent hydrological
effects. Biogeochemistry 2013, 115, 1–21.
14. Boon, S. Snow ablation energy balance in a dead forest stand. Hydrol. Process. 2009, 23, 2600–2610.
15. Maness, H.; Kushner, P.; Fung, I. Summertime climate response to mountain pine beetle
disturbance in British Columbia. Nat. Geosci. 2013, 6, 65–70.
16. Raffa, K.F.; Aukema, B.H.; Bentz, B.J.; Carroll, A.L.; Hicke, J.A.; Turner, M.G.; Romme, W.H.
Cross-scale drivers of natural disturbances prone to anthropogenic amplification: The dynamics of
bark beetle eruptions. Bioscience 2008, 58, 501–517.
17. Bentz, B.J.; Régnière, J.; Fettig, C.J.; Hansen, E.M.; Hayes, J.L.; Hicke, J.A.; Kelsey, R.G.;
Negrón, J.F.; Seybold, S.J. Climate change and bark beetles of the western United States and
Canada: Direct and indirect effects. BioScience 2010, 60, 602–613.
18. Williams, A.P.; Allen, C.D.; Millar, C.I.; Swetnam, T.W.; Michaelsen, J.; Still, C.J.; Leavitt, S.W.
Forest responses to increasing aridity and warmth in the southwestern United States. Proc. Natl.
Acad. Sci. 2010, 107, 21289–21294.
19. Coops, N.C.; Wulder, M.A.; White, J.C. Integrating remotely sensed and ancillary data sources to
characterize a mountain pine beetle infestation. Remote Sens. Environ. 2006, 105, 83–97.

Remote Sens. 2014, 6 5714
20. Wulder, M.A.; Dymond, C.C.; White, J.C.; Leckie, D.G.; Carroll, A.L. Surveying mountain pine
beetle damage of forests: A review of remote sensing opportunities. For. Ecol. Manag. 2006, 221,
27–41.
21. Goodwin, N.R.; Magnussen, S.; Coops, N.C.; Wulder, M.A. Curve fitting of time-series Landsat
imagery for characterizing a mountain pine beetle infestation. Int. J. Remote Sens. 2010, 31,
3263–3271.
22. Meddens, A.J.; Hicke, J.A.; Vierling, L.A. Evaluating the potential of multispectral imagery to
map multiple stages of tree mortality. Remote Sens. Environ. 2011, 115, 1632–1642.
23. Meigs, G.W.; Kennedy, R.E.; Cohen, W.B. A Landsat time series approach to characterize bark
beetle and defoliator impacts on tree mortality and surface fuels in conifer forests. Remote Sens.
Environ. 2011, 115, 3707–3718.
24. Hansen, M.C.; Loveland, T.R. A review of large area monitoring of land cover change using
Landsat data. Remote Sens. Environ. 2012, 122, 66–74.
25. Franklin, S.; Wulder, M.; Skakun, R.; Carroll, A. Mountain pine beetle red-attack forest damage
classification using stratified Landsat TM data in British Columbia, Canada. Photogramm. Eng.
Remote Sens. 2003, 69, 283–288.
26. Kennedy, R.E.; Yang, Z.; Cohen, W.B. Detecting trends in forest disturbance and recovery using
yearly Landsat time series: 1. Landtrendr—Temporal segmentation algorithms. Remote Sens.
Environ. 2010, 114, 2897–2910.
27. Huang, C.; Goward, S.N.; Masek, J.G.; Thomas, N.; Zhu, Z.; Vogelmann, J.E. An automated
approach for reconstructing recent forest disturbance history using dense Landsat time series
stacks. Remote Sens. Environ. 2010, 114, 183–198.
28. Vogelmann, J.E.; Kost, J.R.; Tolk, B.; Howard, S.; Short, K.; Chen, X.; Huang, C.; Pabst, K.;
Rollins, M.G. Monitoring landscape change for landfire using multi-temporal satellite imagery
and ancillary data. IEEE J. Sel. Top. Appl. Earth Obs. Remote Sens. 2011, 4, 252–264.
29. Masek, J.G.; Goward, S.N.; Kennedy, R.E.; Cohen, W.B.; Moisen, G.G.; Schleweiss, K.; Huang, C.
United States forest disturbance trends observed with Landsat time series. Ecosystems 2013, 16,
1087–1104.
30. Goodwin, N.R.; Coops, N.C.; Wulder, M.A.; Gillanders, S.; Schroeder, T.A.; Nelson, T.
Estimation of insect infestation dynamics using a temporal sequence of Landsat data.
Remote Sens. Environ. 2008, 112, 3680–3689.
31. Gong, P.; Wang, J.; Yu, L.; Zhao, Y.; Zhao, Y.; Liang, L.; Niu, Z.; Huang, X.; Fu, H.; Liu, S.; et al.
Finer resolution observation and monitoring of global land cover: First mapping results with
Landsat TM and ETM+ data. Int. J. Remote Sens. 2013, 34, 2607–2654.
32. Campbell, J.B. Introduction to Remote Sensing; CRC Press: Boca Raton, FL, USA, 2002.
33. Klutsch, J.G.; Negron, J.F.; Costello, S.L.; Rhoades, C.C.; West, D.R.; Popp, J.; Caissie, R. Stand
characteristics and downed woody debris accumulations associated with a mountain pine beetle
(dendroctonus ponderosae hopkins) outbreak in Colorado. For. Ecol. Manag. 2009, 258, 641–649.
34. Masek, J.G.; Vermote, E.F.; Saleous, N.E.; Wolfe, R.; Hall, F.G.; Huemmrich, K.F.; Gao, F.;
Kutler, J.; Lim, T.-K. A Landsat surface reflectance dataset for North America, 1990–2000.
IEEE Geosci. Remote Sens. Lett. 2006, 3, 68–72.

Remote Sens. 2014, 6 5715
35. Zhu, Z.; Woodcock, C.E. Object-based cloud and cloud shadow detection in Landsat imagery.
Remote Sens. Environ. 2012, 118, 83–94.
36. Nelson, K.J.; Connot, J.; Peterson, B.; Martin, C. The landfire refresh strategy: Updating the
national dataset. Fire Ecol. 2013, 9, 80–101.
37. Gibson, K.E.; Skov, K.; Kegley, S.; Jorgensen, C.; Smith, S.; Witcosky, J. Mountain Pine Beetle
Impacts in High-Elevation Five-Needle Pines: Current Trends and Challenges; U.S. Department
of Agriculture, Forest Service, Forest Health Protection: Washington, DC, USA, 2008.
38. National c2001 Assessment. Available online: http://www.landfire.gov/dp_quality_assessment.php
(accessed on 12 June 2014).
39. Key, C.H.; Benson, N.C. Landscape Assessment: Remote Sensing of Severity, the Normalized Burn
Ratio and Ground Measure of Severity, the Composite Burn Index; General Technical Report
RMRS-GTR-164-CD: LA1-LA51; U.S. Department of Agriculture, Rocky Mountain Research
Station: Ogden, UT, USA, 2005.
40. Eidenshink, J.; Schwind, B.; Brewer, K.; Zhu, Z.L.; Quayle, B.; Howard, S. A project for
monitoring trends in burn severity. Fire Ecol. 2007, 3, 3–20.
41. Sulla-Menashe, D.; Kennedy, R.E.; Yang, Z.; Braaten, J.; Krankina, O.N.; Friedl, M.A. Detecting
forest disturbance in the Pacific Northwest from MODIS time series using temporal segmentation.
Remote Sens. Environ. 2013, doi:10.1016/j.rse.2013.07.042.
42. Mathur, A.; Foody, G.M. Crop classification by support vector machine with intelligently selected
training data for an operational application. Int. J. Remote Sens. 2008, 29, 2227–2240.
43. Chen, Y.; Gong, P. Clustering based on eigenspace transformation—CBEST for efficient
classification. ISPRS J. Photogramm. Remote Sens. 2013, 83, 64–80.
44. Jensen, J.R. Introductory Digital Image Processing: A Remote Sensing Perspective; Prentice-Hall
Inc.: Upper Saddle River, NJ, USA, 1996.
45. Breiman, L. Random forests. Mach. Learn. 2001, 45, 5–32.
46. Dietterich, T.G. An experimental comparison of three methods for constructing ensembles of
decision trees: Bagging, boosting, and randomization. Mach. Learn. 2000, 40, 139–157.
47. Tucker, C.J. Red and photographic infrared linear combinations for monitoring vegetation.
Remote Sens. Environ. 1979, 8, 127–150.
48. Wilson, E.H.; Sader, S.A. Detection of forest harvest type using multiple dates of Landsat TM
imagery. Remote Sens. Environ. 2002, 80, 385–396.
49. Rock, B.; Vogelmann, J.; Williams, D.; Vogelmann, A.; Hoshizaki, T. Remote detection of forest
damage. BioSci.-Am. Inst. Biol. Sci. 1986, 36, 439–445.
50. Gao, B.C. NDWI—A normalized difference water index for remote sensing of vegetation liquid
water from space. Remote Sens. Environ. 1996, 58, 257–266.
51. Crist, E.P.; Cicone, R.C. A physically-based transformation of Thematic Mapper data—The TM
tasseled cap. IEEE Trans. Geosci. Remote Sens. 1984, doi:10.1109/TGRS.1984.350619.
52. Johnson E.W.; Ross J. USDA Forest Service Rocky Mountain Region Forest Health Aerial Survey
Accuracy Assessment 2005 Report; Technical Report R2-06-08; USDA Forest Service:
Lakewood, CO, USA, 2005.
53. Friedl, M.A.; Brodley, C.E. Decision tree classification of land cover from remotely sensed data.
Remote Sens. Environ. 1997, 61, 399–409.

Remote Sens. 2014, 6 5716
54. Ghimire, B.; Rogan, J.; Miller, J. Contextual land-cover classification: Incorporating spatial
dependence in land-cover classification models using random forests and the getis statistic.
Remote Sens. Lett. 2010, 1, 45–54.
55. Pal, M.; Mather, P.M. An assessment of the effectiveness of decision tree methods for land cover
classification. Remote Sens. Environ. 2003, 86, 554–565.
56. Pal, M. Random forest classifier for remote sensing classification. Int. J. Remote Sens. 2005, 26,
217–222.
57. Foody, G.M. Sample size determination for image classification accuracy assessment and
comparison. Int. J. Remote Sens. 2009, 30, 5273–5291.
58. Li, C.C.; Wang, J.; Wang, L.; Hu, L.Y.; Gong, P. Comparison of classification algorithms and
training sample sizes in urban land classification with Landsat Thematic Mapper imagery.
Remote Sens. 2013, doi:10.3390/rs6020964.
59. Rodriguez-Galiano, V.; Ghimire, B.; Rogan, J.; Chica-Olmo, M.; Rigol-Sanchez, J. An
assessment of the effectiveness of a random forest classifier for land-cover classification. ISPRS J.
Photogramm. Remote Sens. 2012, 67, 93–104.
60. Meddens, A.J.; Hicke, J.A.; Vierling, L.A.; Hudak, A.T. Evaluating methods to detect bark
beetle-caused tree mortality using single-date and multi-date Landsat imagery. Remote Sens.
Environ. 2013, 132, 49–58.
61. Cohen, W.B.; Yang, Z.; Kennedy, R. Detecting trends in forest disturbance and recovery using
yearly Landsat time series: 2. Timesync—Tools for calibration and validation. Remote Sens.
Environ. 2010, 114, 2911–2924.
©2014 by the authors; licensee MDPI, Basel, Switzerland. This article is an open access article
distributed under the terms and conditions of the Creative Commons Attribution license
(http://creativecommons.org/licenses/by/3.0/).