mapping of ancient teeth using … · 2.2 sample preparation sixteen teeth were collected from ......
TRANSCRIPT

Journal of Optoelectronics and Biomedical Materials Vol. 8, No. 4, October-December 2016 p. 155-167
MAPPING OF ANCIENT TEETH USING ABSORPTION OF ATR-FTIR
SPECTROSCOPY AND LASER SCATTERING OF RAMAN SPECTROSCOPY
W. AL SEKHANEH*
Faculty of archaeology and Anthropology
Department of Conservation and Management of Cultural Resources
Yarmouk University, 21163 Irbid, Jordan
This study was conducted on well-preserved archaeological teeth as an ancient biomaterial
from the Roman period dated between the first and second centuries A.D in Jordan.
Archaeological bone is an important witness as it records significant information about
past societies and the situation of the teeth to use for conservation of archaeological bone.
The morphological and structural changes in addition to the chemical composition of
archaeological teeth material exhibit vital information about bone at different stages of the
human development in biomaterials of paleo-diet, paleo-environment and paleopathology.
In this study, vibrational spectroscopy, a combination of Attenuated total reflectance
Fourier transform infrared(ATR-FTIR) spectroscopy and Fourier Transform Infrared
Imaging (ATR-FTIRI)in addition to Raman as a laser spectroscopy and Raman imaging
analyses were appliedto16 deciduous and permanent human teeth samples taken from a
Roman archaeological site in Northern Jordan. The samples were examined for their
mineral-to-matrix and carbonate to phosphate contents (at 1412 cm-1
and at 1030 cm-
1respectively)[1].The study determines that the higher crystallinity and lower Carbonate to
Phosphate C/P ratio in enamel than dentin are common features of dental tissues that have
been confirmed.
(Received July 29, 2016; Accepted October 7, 2016)
Keywords: Ancient biomaterial, bone; collagen; Fourier transform infrared spectroscopy;
Raman spectroscopy; imaging
1. Introduction
The bioarchaeology as new interdisciplinary field of research involves the common
interests for chemists, archaeologists and anthropologists, the pathology and morphology of
human biomaterials as bones, teeth and collagen that which recovered from archaeological sites
preserve a good information for their evolutionary history[2], where the lock inside valuable
record about the earlier life in Jordan region [3-5]. They retain information about the paleodiet[5-
7], paleoenvironment[8], paleoclimate[9], and paleopathology[10], which can be extracted using a
wide array of analytical methods [11] including spectroscopy [12-14].
Bone is a dense, semi rigid, porous, and calcified connective tissue composed chiefly of
the inorganic matter calcium phosphate and calcium carbonate[15-17], as well as non-collagenous
proteins and lipids as bio- materials [18-21]. The mineral phase in bone component consists of a
poorly crystalline hydroxyapatite, where the replacement of phosphate in the matrix by carbonate
increases the disordering of the lattice [22-24]. After death, the bones are influenced by the burial
environment including soil composition, which alters the chemical composition of bones [25, 26].
Bones with high organic and low inorganic content are more susceptible to chemical
decomposition or mechanical degradation than others[27, 28].Bones and teeth have the properties
of being hard and consistent containing a high mineral composition. Bones originate exclusively
from mesodermal embryonic tissue, while teeth originate from both mesodermal and ectodermal
*Coresponding author: [email protected]
156
tissue [29]. Teeth are essentially composed from several different layers: cementum, dentin and
enamel [30, 31].
Enamel is the hardest and mineralized part of teeth, consisting of approximately 97%wt of
crystalized hydroxyapatite (HA), the other 3% are bio-organic materials and water [32]. The dentin
which makes up the tooth is less mineralized and less brittle than the enamel with 75% of
hydroxyapatite (HA), 20% collagen and 5% water, but in the natural bone tissue, the (HA)
consists of 69% calcium phosphate, 10% water, 20% collagen, and other organic material in small
quantity [33-37]. All enamel, dentin, and the natural bone consist of (HA), which is a naturally
occurring mineral form of calcium apatite with the formula Ca5 (PO4)3(OH). It crystalizes in the
hexagonal crystal system [38, 39]. (HA) has many ionic substitutions in the lattice sites occupied
by the anions and cations as carbonate, chloride, and magnesium interact with hydroxyapatite
(HA) crystals in teeth, this interaction leads to de- and remineralization of enamel in vitro through
the process of aging [40]. The hydroxyl (OH−) and phosphate (PO4
-3) in (HA) are substituted by
carbonate (CO3) creating A-type and B-type carbonate respectively [23, 41-46].Many researchers
have studied the structures and properties of human dental carbonate [47-49] and have
characterized structure-property in deciduous and permanent teeth [50, 51]. The mineral
crystallinity, and crosslinking properties of dentin have been the subject of several studies
reviewed elsewhere [52, 53].
The new development in photo-detection technique at the end of the 20th century has
allowed the improvement of new solid state detectors for infrared spectra acquisition to be used
simultaneously as a source of information in both spatial and spectral dimensions. This technique
is referred to as "chemical imaging" [54-58]. Spectra are spatially located and it is possible to
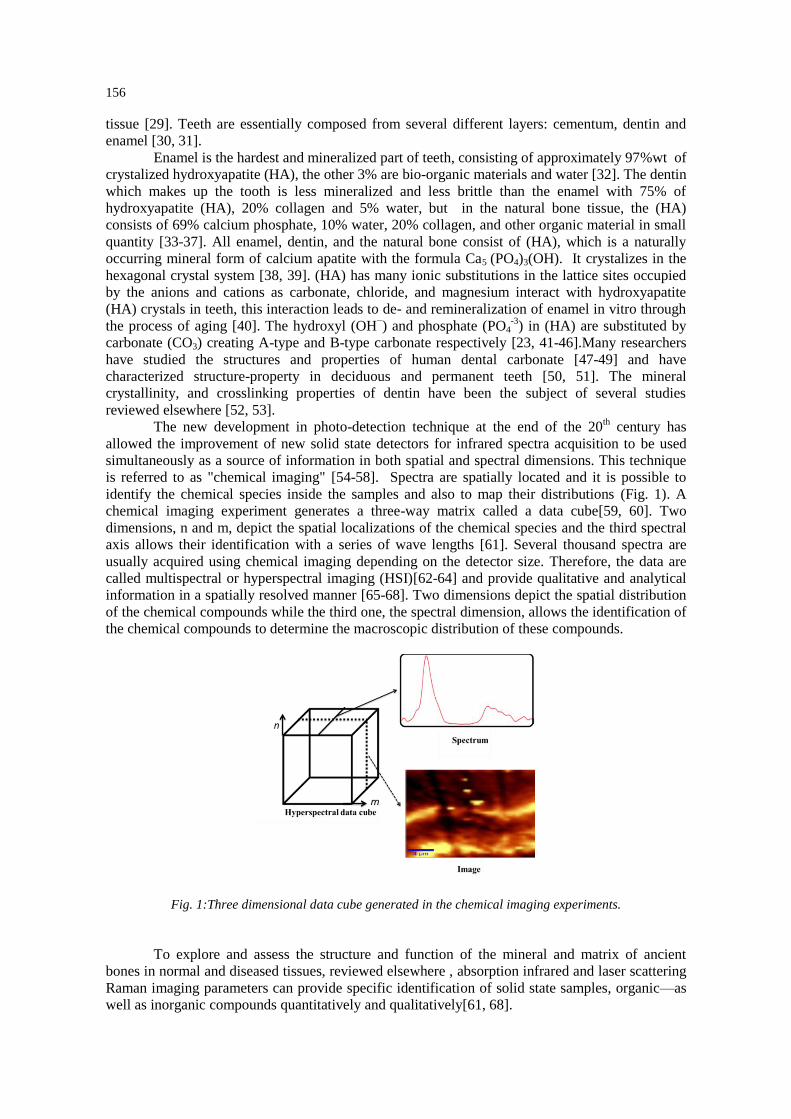
identify the chemical species inside the samples and also to map their distributions (Fig. 1). A
chemical imaging experiment generates a three-way matrix called a data cube[59, 60]. Two
dimensions, n and m, depict the spatial localizations of the chemical species and the third spectral
axis allows their identification with a series of wave lengths [61]. Several thousand spectra are
usually acquired using chemical imaging depending on the detector size. Therefore, the data are
called multispectral or hyperspectral imaging (HSI)[62-64] and provide qualitative and analytical
information in a spatially resolved manner [65-68]. Two dimensions depict the spatial distribution
of the chemical compounds while the third one, the spectral dimension, allows the identification of
the chemical compounds to determine the macroscopic distribution of these compounds.
Fig. 1:Three dimensional data cube generated in the chemical imaging experiments.
To explore and assess the structure and function of the mineral and matrix of ancient
bones in normal and diseased tissues, reviewed elsewhere , absorption infrared and laser scattering
Raman imaging parameters can provide specific identification of solid state samples, organic—as
well as inorganic compounds quantitatively and qualitatively[61, 68].
157
The Fourier Transform Infrared (ATR-FTIR)[69-71] micro-spectroscopy and Fourier
Transform Infrared Imaging (ATR-FTIRI)[72, 73]constitute two sensitive techniques for
obtaining molecular information to have a choice for degree detection of bone crystallinity as
inorganic substance [74]. Both methods are non-destructive of the analyzed material contrary to
more conventional methods, such as Mass Spectrometry (MS). (ATR-FTIR) micro-spectroscopy
and (ATR-FTIRI) provide fast and reliable results about the molecular structure of bones and other
hard tissues, such as, teeth.
Besides, the former can deliver spatially resolved data in micro-meters on the modification
of bone structure and composition; the latter can identify a wide variety of materials and chemical
bonds and produce distinctive molecular fingerprints. Accordingly, these methods are more
frequently used than the conventional ones in investigating samples of a biological origin [75-
80].Most of the studies conducted on archaeological bone material using ATR-FTIR micro-
spectroscopy focused on the preservation state of the bone mineral part [16, 17, 81, 82]. Only few
studies have been concerned with a particularly interesting and non-trivial technique, which is the
Raman spectroscopy in the analysis of biochemical changes in vivo cells and both soft and hard
tissues upon progression of various changes[75, 83-87].
There are some studies on new teeth by nano-FTIR imaging of phosphate-based
biominerals are demonstrated with a human tooth in which the bone-like phosphate nanocrystals
are too small to be resolved, and the anisotropy or amorphous disorder in crystal of modern human
teeth dentin will broad the band between 950-1150 cm-1
[87-89].An increasing in crystallinity of
the archaeological bone and dentine in comparison to modern references by the crystallinity
indexes and the splitting factors both are represented by broadening of ATR-FTIR and Raman
bands of the apatite or carbonate in the samples [90, 91].
This study was conducted on well-preserved archaeological bone material from the Roman
period dated between the first and second centuries A.D. at the archaeological site of Yasieleh in
Northern Jordan. Bones from this site provide material for the current study which aims to
examine A & B-type carbonate as a function of age in human teeth [92, 93] by ATR-FTIR
imaging and X-ray spectroscopy[94, 95].
2. Materials and Methods
2.1 Archaeological Site
Jordan is strategically located in the heart of the Middle East, the cradle of many
civilizations-- and is known for its rich history and numerous archaeological sites especially in
Northern Jordan. The archaeological site of Yasieleh is located 9 km east of the city of Irbid and
was occupied from the late Roman to the beginning of the Islamic Period. Excavation at the site
started in 1988 and yielded information about the Roman and Byzantine periods in Northern
Jordan to use for interpretation in the heritage of Jordan [96-98].
2.2 Sample Preparation
Sixteen teeth were collected from Yasieleh archaeological site. Samples were collected f
not affected by carious or sediment, they are well cleaned, and all were manually polished before
testing with Alumina. The sample size for ancient dental elements used in this study is shown in
Table 1. Table1. The types of archaeological teeth
Molar First Molar Canine Incisor Tooth types
x 1 1 1 Primary
9 x 2 2 Permanent
(Fig. 2) illustrates a photograph of a tooth cross section of one sample showing the
component of the tooth, enamel, dentin and pulp. The position of the mapping is marked with
0.6 mm × 0.6 mm data squares in the left side of the image.

158
Fig. 2.A photograph of ancient tooth is illustrating enamel, dentin, pulp, cementum and periodontal
ligament (PDL). Black squires indicate positions where the spectral map is scanned.
2.3 (ATR-FTIR) spectroscopy
Attenuated total reflectance Fourier transform infrared (ATR-FTIR) spectroscopy is a tool
that has been used to probe chemical reactions/structure at the solid/liquid interfaces. Spectra were
recorded using the imaging system combining a spectrometer (Varian 670-IR, USA) coupled with
a variant microscope 64×64 focal plane array nitrogen (FPA) cooled detector was used to acquire
the spectra in the interval of 900-4000cm-1
at a spectral resolution of 4 cm-1
. Analysis were
conducted in a reflection mode and equipped with attenuated total reflection (ATR) with a
Germanium crystal (refractive index 4) and 64 scans were collected for each point; the array
detector collects interferograms from its 4096 elements.
2.4 Raman spectroscopy
Two dimensional hyperspectral Raman images and spectra were collected by using a
Raman micro-spectrometer (Kaiser Optical System, AnnArbor,MI, USA) emitted by a 785nm
single mode external cavity diode laser of (Germany). All spectra were obtained using excitation
power of 100mW with 100x/NA 0.9 objective (Nikon, Japan). Spectra were obtained over the
spectral region of 300 to 1530 cm-1
at a spectral resolution of 4cm-1
with a step size of 1 µm with
an accumulative time of 12 hours. Raman images were obtained using Confocal Raman
microscopic system (alpha300 R;WITec Instruments, Germany) excited by a frequency doubled
Nd:YAG laser at a wave length 532 nm focused onto the samples through a X20 Nikon objective
with single spectrum acquisition time of 0.5 second, the data were processed using image plus
software.
2.5 (ATR-FTIR) and Raman spectra analysis
As the regions of interest covered the pure dentin or enamel, ATR-FTIR and Raman
spectra are analyzed by Origin Pro 8.5 (www.originlab.com) for Curve fitting processes for
deconvolution of overlapping bands as 1030 cm-1
in ATR-FTIR. The band numbers were resolute
by calculating the second derivatives. The Gaussian band and manual linear baselines were
applied.
2.6 Scanning Electron Microscope (SEM) and Backscattered Scanning
Electron (BSE) microscopy
The investigations were carried out using an analytical scanning electron microscope
(SEM) JSM-6300F (JEOL Ltd., Tokyo, Japan). The system is equipped with a cold field emission
electron gun, which delivers high brightness and thus high resolution images. It operates at 30 kV
with secondary electron image (SEI) resolution in the range of 1.5 nm. Correspondingly it operates
at 5 kV approximately to achieve 5 resolutions. Besides the Everhart-Thornley detector type for
secondary electrons is equipped with a semiconductor and a YAG scintillator type detector for
back-scattered electrons (BSE).For analytical purposes an energy dispersive X-ray spectrometer
with (Si(Li) detector type are cooled with liquid nitrogen; Oxford INCA) is present and enables
element analysis on a nanoscale.
159
3. Results
3.1 Raman and ATR-FTIR spectroscopy
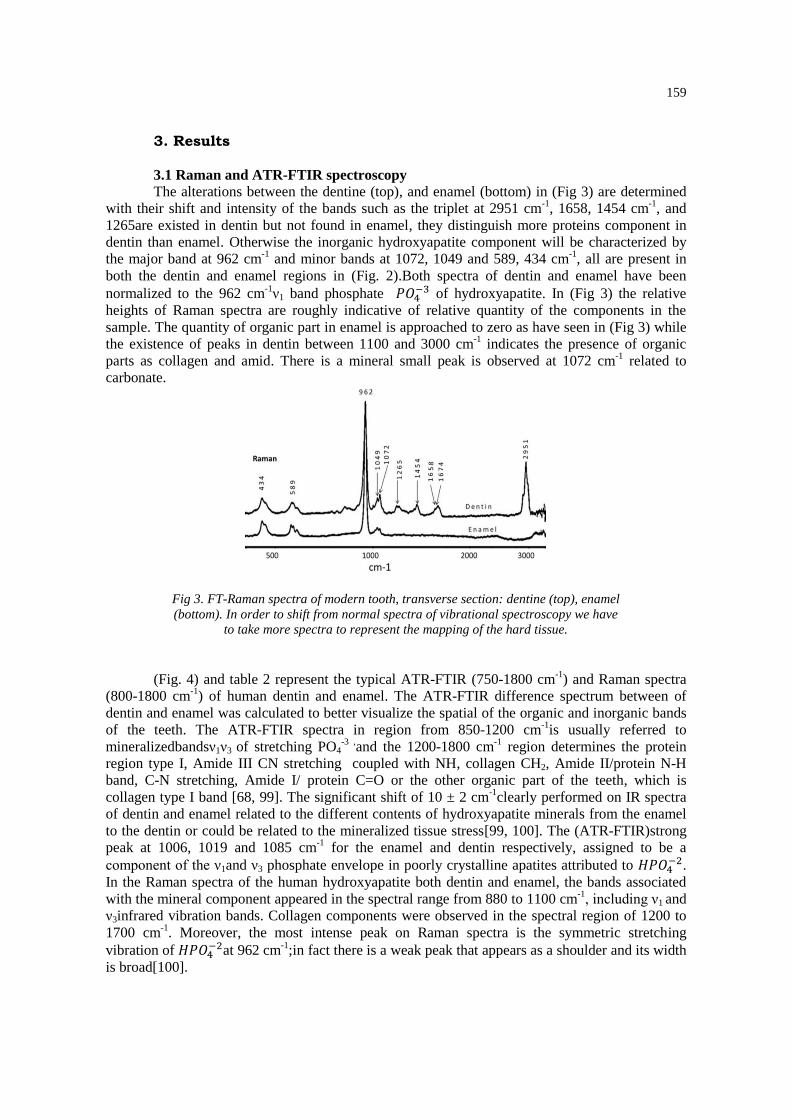
The alterations between the dentine (top), and enamel (bottom) in (Fig 3) are determined
with their shift and intensity of the bands such as the triplet at 2951 cm-1
, 1658, 1454 cm-1
, and
1265are existed in dentin but not found in enamel, they distinguish more proteins component in
dentin than enamel. Otherwise the inorganic hydroxyapatite component will be characterized by
the major band at 962 cm-1
and minor bands at 1072, 1049 and 589, 434 cm-1
, all are present in
both the dentin and enamel regions in (Fig. 2).Both spectra of dentin and enamel have been
normalized to the 962 cm-1
ν1 band phosphate 𝑃𝑂4−3 of hydroxyapatite. In (Fig 3) the relative
heights of Raman spectra are roughly indicative of relative quantity of the components in the
sample. The quantity of organic part in enamel is approached to zero as have seen in (Fig 3) while
the existence of peaks in dentin between 1100 and 3000 cm-1
indicates the presence of organic
parts as collagen and amid. There is a mineral small peak is observed at 1072 cm-1
related to
carbonate.
Fig 3. FT-Raman spectra of modern tooth, transverse section: dentine (top), enamel
(bottom). In order to shift from normal spectra of vibrational spectroscopy we have
to take more spectra to represent the mapping of the hard tissue.
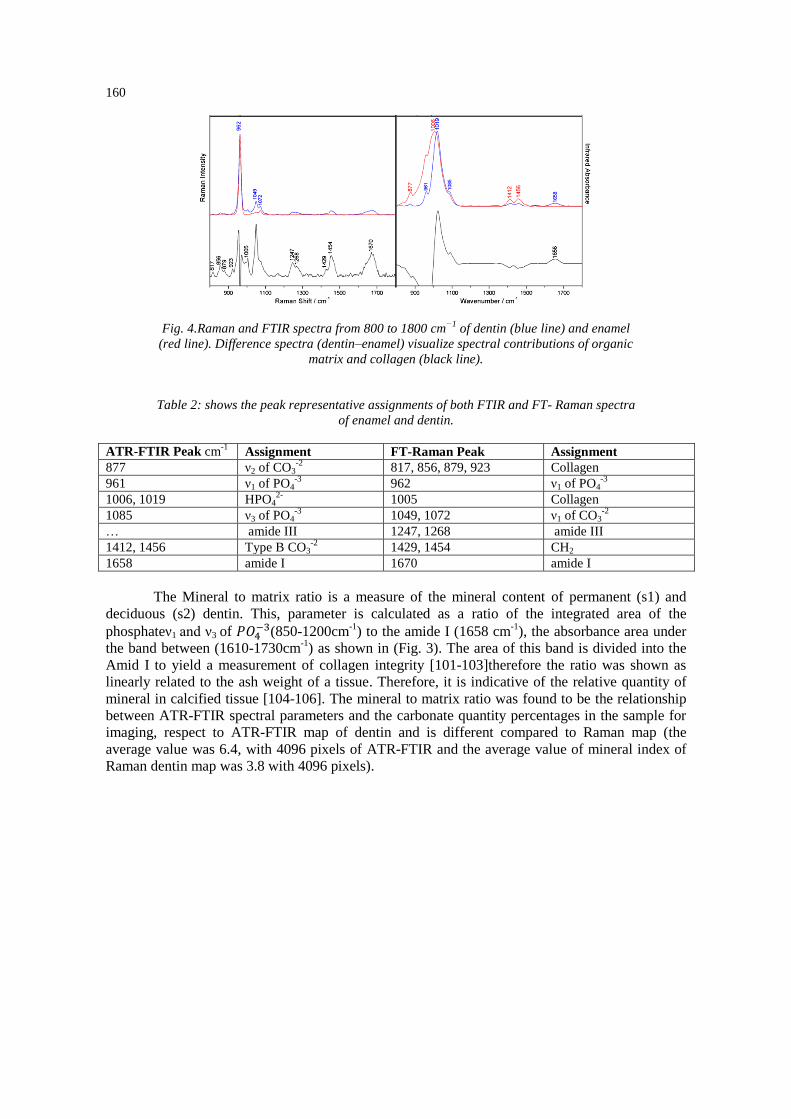
(Fig. 4) and table 2 represent the typical ATR-FTIR (750-1800 cm-1
) and Raman spectra
(800-1800 cm-1
) of human dentin and enamel. The ATR-FTIR difference spectrum between of
dentin and enamel was calculated to better visualize the spatial of the organic and inorganic bands
of the teeth. The ATR-FTIR spectra in region from 850-1200 cm-1
is usually referred to
mineralizedbandsν1ν3 of stretching PO4-3 ,
and the 1200-1800 cm-1
region determines the protein
region type I, Amide III CN stretching coupled with NH, collagen CH2, Amide II/protein N-H
band, C-N stretching, Amide I/ protein C=O or the other organic part of the teeth, which is
collagen type I band [68, 99]. The significant shift of 10 ± 2 cm-1
clearly performed on IR spectra
of dentin and enamel related to the different contents of hydroxyapatite minerals from the enamel
to the dentin or could be related to the mineralized tissue stress[99, 100]. The (ATR-FTIR)strong
peak at 1006, 1019 and 1085 cm-1
for the enamel and dentin respectively, assigned to be a
component of the ν1and ν3 phosphate envelope in poorly crystalline apatites attributed to 𝐻𝑃𝑂4−2.
In the Raman spectra of the human hydroxyapatite both dentin and enamel, the bands associated
with the mineral component appeared in the spectral range from 880 to 1100 cm-1
, including ν1 and
ν3infrared vibration bands. Collagen components were observed in the spectral region of 1200 to
1700 cm-1
. Moreover, the most intense peak on Raman spectra is the symmetric stretching
vibration of 𝐻𝑃𝑂4−2at 962 cm
-1;in fact there is a weak peak that appears as a shoulder and its width
is broad[100].
160
Fig. 4.Raman and FTIR spectra from 800 to 1800 cm−1
of dentin (blue line) and enamel
(red line). Difference spectra (dentin–enamel) visualize spectral contributions of organic
matrix and collagen (black line).
Table 2: shows the peak representative assignments of both FTIR and FT- Raman spectra
of enamel and dentin.
ATR-FTIR Peak cm-1
Assignment FT-Raman Peak Assignment
877 ν2 of CO3-2
817, 856, 879, 923 Collagen
961 ν1 of PO4-3
962 ν1 of PO4-3
1006, 1019 HPO42-
1005 Collagen
1085 ν3 of PO4-3
1049, 1072 ν1 of CO3-2
… amide III 1247, 1268 amide III
1412, 1456 Type B CO3-2
1429, 1454 CH2
1658 amide I 1670 amide I
The Mineral to matrix ratio is a measure of the mineral content of permanent (s1) and
deciduous (s2) dentin. This, parameter is calculated as a ratio of the integrated area of the
phosphateν1 and ν3 of 𝑃𝑂4−3(850-1200cm
-1) to the amide I (1658 cm
-1), the absorbance area under
the band between (1610-1730cm-1
) as shown in (Fig. 3). The area of this band is divided into the
Amid I to yield a measurement of collagen integrity [101-103]therefore the ratio was shown as
linearly related to the ash weight of a tissue. Therefore, it is indicative of the relative quantity of
mineral in calcified tissue [104-106]. The mineral to matrix ratio was found to be the relationship
between ATR-FTIR spectral parameters and the carbonate quantity percentages in the sample for
imaging, respect to ATR-FTIR map of dentin and is different compared to Raman map (the
average value was 6.4, with 4096 pixels of ATR-FTIR and the average value of mineral index of
Raman dentin map was 3.8 with 4096 pixels).
161
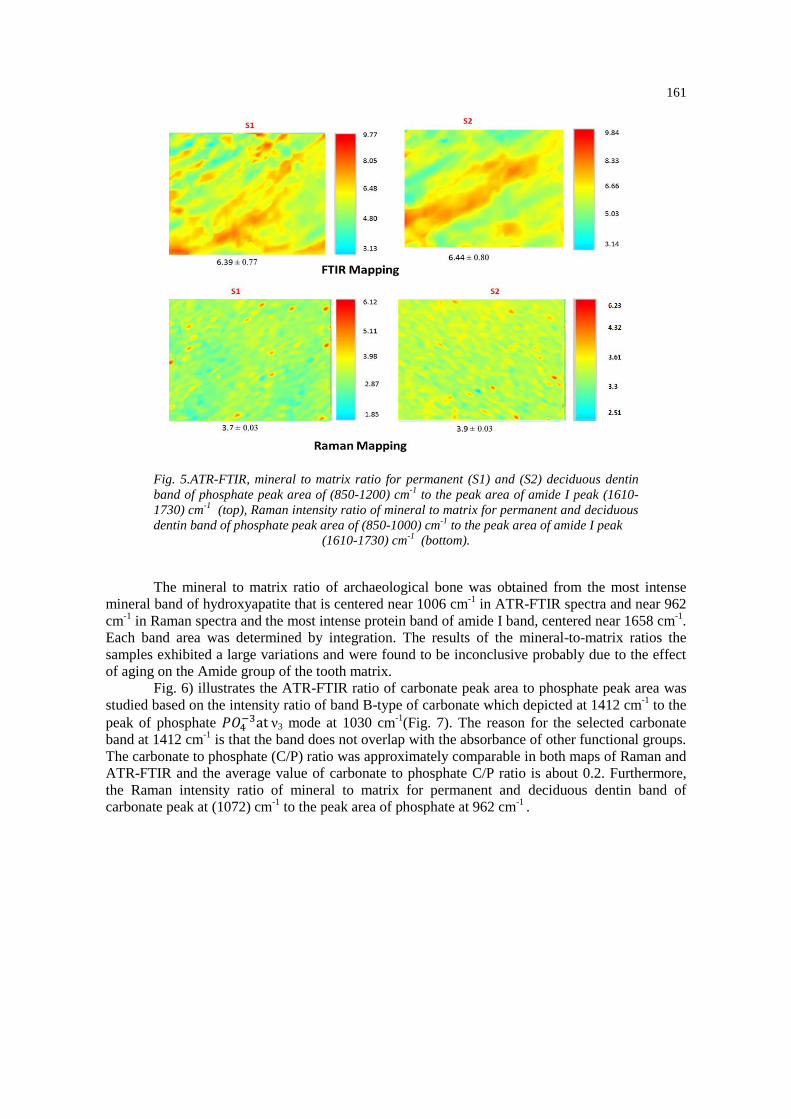
Fig. 5.ATR-FTIR, mineral to matrix ratio for permanent (S1) and (S2) deciduous dentin
band of phosphate peak area of (850-1200) cm-1
to the peak area of amide I peak (1610-
1730) cm-1
(top), Raman intensity ratio of mineral to matrix for permanent and deciduous
dentin band of phosphate peak area of (850-1000) cm-1
to the peak area of amide I peak
(1610-1730) cm-1
(bottom).
The mineral to matrix ratio of archaeological bone was obtained from the most intense
mineral band of hydroxyapatite that is centered near 1006 cm-1
in ATR-FTIR spectra and near 962
cm-1
in Raman spectra and the most intense protein band of amide I band, centered near 1658 cm-1
.
Each band area was determined by integration. The results of the mineral-to-matrix ratios the
samples exhibited a large variations and were found to be inconclusive probably due to the effect
of aging on the Amide group of the tooth matrix.
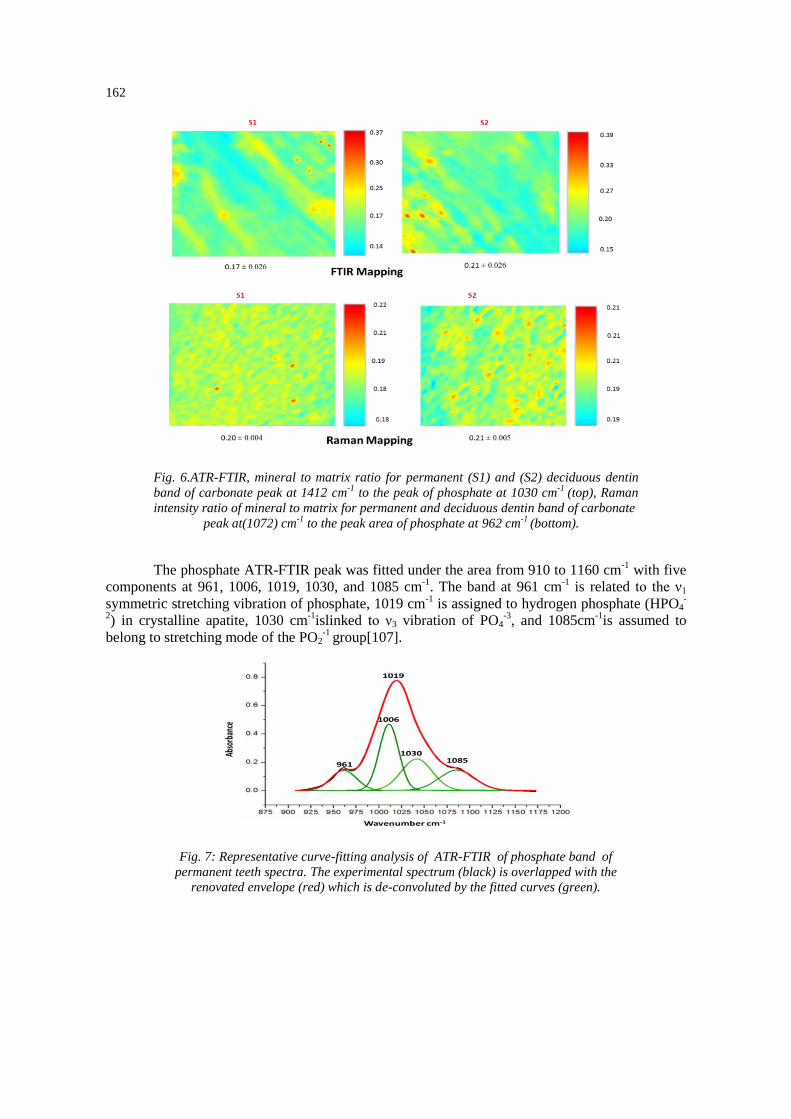
Fig. 6) illustrates the ATR-FTIR ratio of carbonate peak area to phosphate peak area was
studied based on the intensity ratio of band B-type of carbonate which depicted at 1412 cm-1
to the
peak of phosphate 𝑃𝑂4−3at ν3 mode at 1030 cm
-1(Fig. 7). The reason for the selected carbonate
band at 1412 cm-1
is that the band does not overlap with the absorbance of other functional groups.
The carbonate to phosphate (C/P) ratio was approximately comparable in both maps of Raman and
ATR-FTIR and the average value of carbonate to phosphate C/P ratio is about 0.2. Furthermore,
the Raman intensity ratio of mineral to matrix for permanent and deciduous dentin band of
carbonate peak at (1072) cm-1
to the peak area of phosphate at 962 cm-1
.
162
Fig. 6.ATR-FTIR, mineral to matrix ratio for permanent (S1) and (S2) deciduous dentin
band of carbonate peak at 1412 cm-1
to the peak of phosphate at 1030 cm-1
(top), Raman
intensity ratio of mineral to matrix for permanent and deciduous dentin band of carbonate
peak at(1072) cm-1
to the peak area of phosphate at 962 cm-1
(bottom).
The phosphate ATR-FTIR peak was fitted under the area from 910 to 1160 cm-1
with five
components at 961, 1006, 1019, 1030, and 1085 cm-1
. The band at 961 cm-1
is related to the ν1
symmetric stretching vibration of phosphate, 1019 cm-1
is assigned to hydrogen phosphate (HPO4-
2) in crystalline apatite, 1030 cm
-1islinked to ν3 vibration of PO4
-3, and 1085cm
-1is assumed to
belong to stretching mode of the PO2-1
group[107].
Fig. 7: Representative curve-fitting analysis of ATR-FTIR of phosphate band of
permanent teeth spectra. The experimental spectrum (black) is overlapped with the
renovated envelope (red) which is de-convoluted by the fitted curves (green).
163
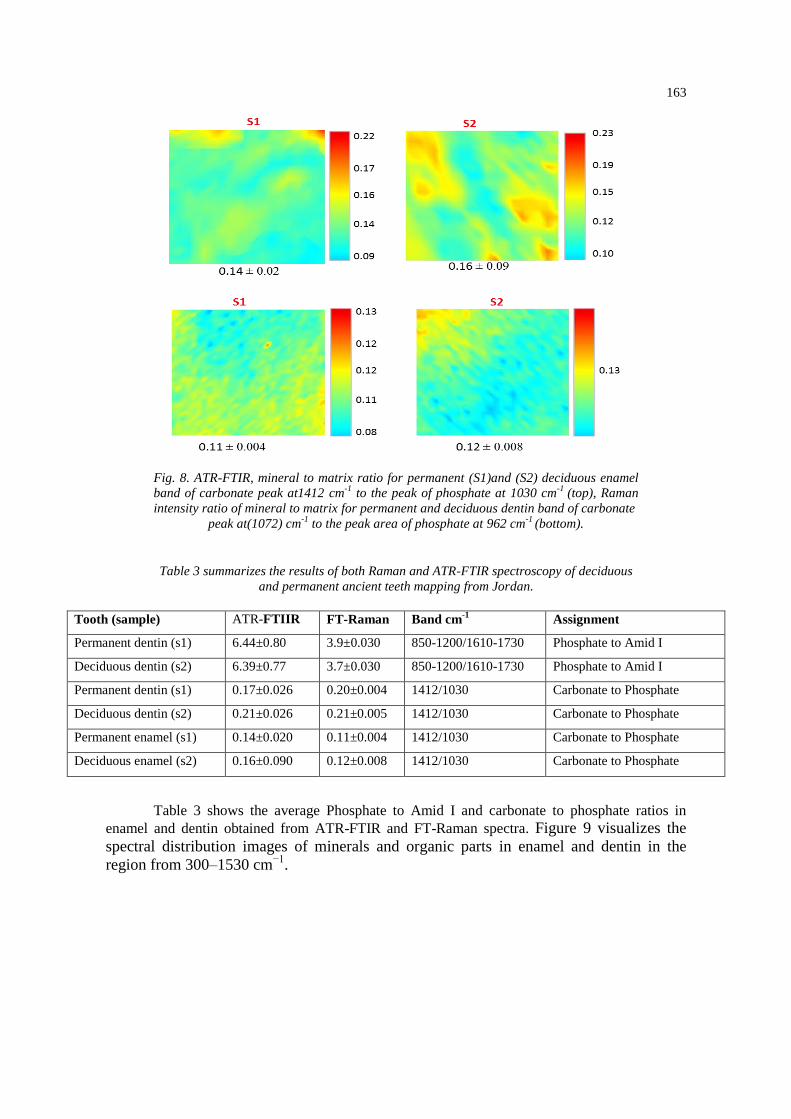
Fig. 8. ATR-FTIR, mineral to matrix ratio for permanent (S1)and (S2) deciduous enamel
band of carbonate peak at1412 cm-1
to the peak of phosphate at 1030 cm-1
(top), Raman
intensity ratio of mineral to matrix for permanent and deciduous dentin band of carbonate
peak at(1072) cm-1
to the peak area of phosphate at 962 cm-1
(bottom).
Table 3 summarizes the results of both Raman and ATR-FTIR spectroscopy of deciduous
and permanent ancient teeth mapping from Jordan.
Tooth (sample) ATR-FTIIR FT-Raman Band cm
-1 Assignment
Permanent dentin (s1) 6.44±0.80 3.9±0.030 850-1200/1610-1730 Phosphate to Amid I
Deciduous dentin (s2) 6.39±0.77 3.7±0.030 850-1200/1610-1730 Phosphate to Amid I
Permanent dentin (s1) 0.17±0.026 0.20±0.004 1412/1030 Carbonate to Phosphate
Deciduous dentin (s2) 0.21±0.026 0.21±0.005 1412/1030 Carbonate to Phosphate
Permanent enamel (s1) 0.14±0.020 0.11±0.004 1412/1030 Carbonate to Phosphate
Deciduous enamel (s2) 0.16±0.090 0.12±0.008 1412/1030 Carbonate to Phosphate
Table 3 shows the average Phosphate to Amid I and carbonate to phosphate ratios in
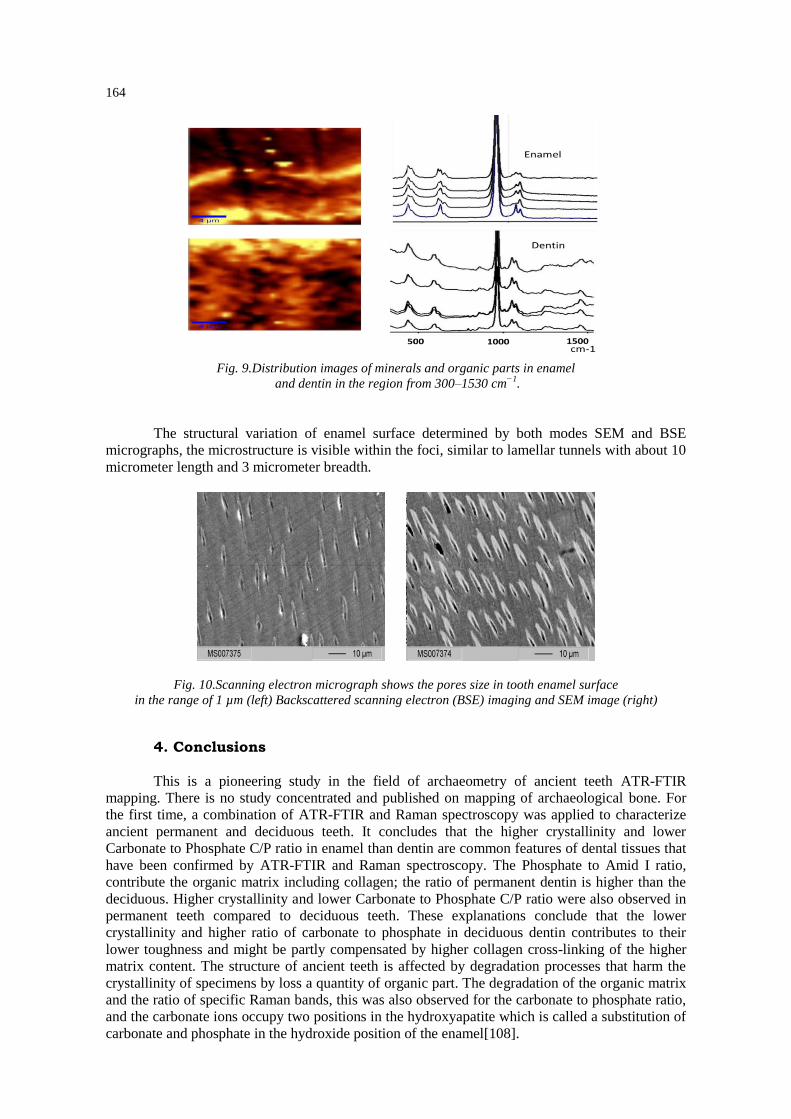
enamel and dentin obtained from ATR-FTIR and FT-Raman spectra. Figure 9 visualizes the
spectral distribution images of minerals and organic parts in enamel and dentin in the
region from 300–1530 cm−1
.
164
Fig. 9.Distribution images of minerals and organic parts in enamel
and dentin in the region from 300–1530 cm−1
.
The structural variation of enamel surface determined by both modes SEM and BSE
micrographs, the microstructure is visible within the foci, similar to lamellar tunnels with about 10
micrometer length and 3 micrometer breadth.
Fig. 10.Scanning electron micrograph shows the pores size in tooth enamel surface
in the range of 1 µm (left) Backscattered scanning electron (BSE) imaging and SEM image (right)
4. Conclusions This is a pioneering study in the field of archaeometry of ancient teeth ATR-FTIR
mapping. There is no study concentrated and published on mapping of archaeological bone. For
the first time, a combination of ATR-FTIR and Raman spectroscopy was applied to characterize
ancient permanent and deciduous teeth. It concludes that the higher crystallinity and lower
Carbonate to Phosphate C/P ratio in enamel than dentin are common features of dental tissues that
have been confirmed by ATR-FTIR and Raman spectroscopy. The Phosphate to Amid I ratio,
contribute the organic matrix including collagen; the ratio of permanent dentin is higher than the
deciduous. Higher crystallinity and lower Carbonate to Phosphate C/P ratio were also observed in
permanent teeth compared to deciduous teeth. These explanations conclude that the lower
crystallinity and higher ratio of carbonate to phosphate in deciduous dentin contributes to their
lower toughness and might be partly compensated by higher collagen cross-linking of the higher
matrix content. The structure of ancient teeth is affected by degradation processes that harm the
crystallinity of specimens by loss a quantity of organic part. The degradation of the organic matrix
and the ratio of specific Raman bands, this was also observed for the carbonate to phosphate ratio,
and the carbonate ions occupy two positions in the hydroxyapatite which is called a substitution of
carbonate and phosphate in the hydroxide position of the enamel[108].
165
Acknowledgments
The author is greatly indebted to all the team working in the Physical Chemistry at Jena
University in Germany and DFG for financial supporting. Author is particularly grateful to Prof.
Zeidoun Al-Muheisen, Dr. Susanne Ramadan for English editing and Prof. A. Al-Shorman, all for
discussing this work and offering helpful suggestions.
References
[1] S. Gourion‐Arsiquaud, et al., Journal of Bone and Mineral Research, 28(1), 150 (2013).
[2] S.H.Ambrose, J. Krigbaum, Journal of Anthropological Archaeology,. 22(3), 193 (2003).
[3] S.Weiner, O. Bar-Yosef, Journal of Archaeological Science, 17(2), 187 (1990).
[4] D.O.Henry, et al., Bulletin of the American Schools of Oriental Research, 1985, 45.
[5] K. Al-Bashaireh, et al., Radiocarbon,. 52(2), 645 (2010).
[6] A.,Al-Shorman, Journal of archaeological science,. 31(12), 1693 (2004)
[7] A.Al-Shorman, L. El-Khouri, Archaeological and Anthropological Sciences, 3(3), 263 (2011).
[8] Y.Dauphin, C. Kowalski, and C. Denys, Quaternary Research, 42(3): p. 340 (1994).
[9] J.D. Bryant, B. Luz, P.N. Froelich, Palaeogeography, Palaeoclimatology, Palaeoecology,
107(3-4), 303 (1994)
[10] A.H.Goodman, , et al., Indications of Stress from Bone and Teeth. In: Paleopathology at the
Origins of Agriculture. 1984.
[11] H.J.,Park, et al., Journal of Biomedical Materials Research Part A, 2016.
[12] M. C.,Stiner, et al., Journal of Archaeological Science, 22(2), 223 (1995).
[13] H. Edwards, et al., Journal of Raman Spectroscopy, 32(1), 17 (2001).
[14] T. Thompson, M. Gauthier, M. Islam, Journal of Archaeological Science 36(3), 910 (2009)
[15] V.C Mow, R. Huiskes, Basic Orthopaedic Biomechanics & Mechano-biology. 2005:
Lippincott Williams & Wilkins.
[16] R.,Shahack-Gross, et al., Journal of Archaeological Science 31(9), 1259 (2004).
[17] M. Lebon, et al., Journal of Analytical Atomic Spectrometry 26(5), 922 (2011).
[18] C.,Milner, Functional Anatomy for Sport and Exercise: Quick Reference. 2008:
Taylor & Francis.
[19] F.C.M.Driessens, R.K. Verbeeck, Biominerals. 1990: Taylor & Francis.
[20] M.,Mucalo, Hydroxyapatite (HAp) for Biomedical Applications. 2015: Elsevier Science.
[21] A., Al-Shorman, Chemistry of Archaeological Bones. First ed. 2013: Deanship of Scientific
Research and Graduate Studies, Yarmouk University. 164.
[22] R. Handschin, W. Stern, Calcified tissue international,. 51(2), 111 (1992).
[23] C.,Rey, et al., Calcified tissue international,. 45(3), 157 (1989)
[24] J. Harries, D. Hukins, S. Hasnain, Calcified tissue international,. 43(4), 250 (1988)
[25] M. R. Buzon, et al., Handbook of archaeological methods, 2, 871 (2005)
[26] A. Boddington, A.N. Garland, Death, decay, and reconstruction: approaches to archaeology
and forensic science. 1987: Manchester University Press.
[27] R.A. Nicholson, Journal of Archaeological Science 23(4), 513 (1996)
[28] G. Turner-Walker, The chemical and microbial degradation of bones and teeth. Advances in
human palaeopathology, 2008: p. 3-29.
[29] A.Boskey, R. Mendelsohn, Journal of biomedical optics,. 10(3), 031102 (2005)
[30] R. Gardner, Development,. 68(1), 175 (1982).
[31] J. Pispa, I. Thesleff, Developmental biology, 262(2), 195 (2003).
[32] D. Shi, Introduction to Biomaterials. 2006: Tsinghua University Press.
[33] H. Xu, et al., Journal of Dental Research,. 77(3), 472 (1998).
[34] E. Beniash, et al., Journal of structural biology 166(2): p. 133 (2009).
[35] S. Park, et al., Journal of Materials Science: Materials in Medicine 19(6), 2317 (2008).
[36] C.W.,Gibson, et al., Journal of Biological Chemistry, 2001. 276(34): p. 31871-31875.
[37] J. D.Currey, Bones: structure and mechanics. 2002: Princeton university press.
[38] J. C.Elliott, Structure and chemistry of the apatites and other calcium orthophosphates. 2013:

166
Elsevier.
[39] L. Calderin, M. Stott, A. Rubio, Physical Review B 67(13), 134106 (2003).
[40] W. Van der Reijden, et al., Caries research,. 31(3), 216 (1997).
[41] J.M. Burnell, E.J. Teubner, A.G. Miller, Calcified tissue international, 31(1), 13 (1980).
[42] E. Boanini, M. Gazzano, A. Bigi, Acta biomaterialia,. 6(6), 1882 (2010)
[43] I.R.Gibson, W. Bonfield, Journal of biomedical materials research, 59(4), 697 (2002)
[44] J.,Barralet, et al., Journal of Materials Science: Materials in Medicine, 13(6), 529 (2002).
[45] E. Landi, et al., Journal of the European Ceramic Society, 26(13), 2593 (2006).
[46] A. Antonakos, E. Liarokapis, T. Leventouri, Biomaterials,. 28(19), 3043 (2007).
[47] R. Young, P. Mackie, Materials Research Bulletin,. 15(1), 17 (1980).
[48] R.Wilson, J. Elliott, S. Dowker, American mineralogist,. 84(9), 1406 (1999)
[49] A. Carden, M.D. Morris, Journal of biomedical optics,. 5(3), 259 (2000).
[50] M. Al-Jawad, et al., Biomaterials 28(18), 2908 (2007)
[51] I.,Low, N. Duraman, I.J. Davies. Microstructure–Property Relationships in Human Adult and
Baby Canine Teeth. in Key Engineering Materials. 2006. Trans Tech Publ.
[52] T. Leventouri, et al., Crystal structure studies of human dental apatite as a function of age.
International journal of biomaterials, 2009. 2009.
[53] D. Magne, et al., Journal of Bone and Mineral Research, 16(4), 750 (2001).
[54] P. Mitchell, , et al., Journal of inorganic biochemistry,. 62(3), 183 (1996).
[55] P. Spencer, et al., Journal of biomedical optics,. 10(3), 031104 (2005)
[56] Y. Wang, X. Yao, R. Parthasarathy, Journal of Biomedical Materials Research Part A,
91(1), 251 (2009).
[57] Y.,Ling, et al., Journal of Bone and Mineral Research,. 20(12), 2169 (2005)
[58] P., Spencer, et al., Dental Materials,. 8(1), 10 (1992)
[59] J. Beltran, J. Guiteras, and R. Ferrer, Analytical chemistry, 70(9), 1949 (1998)
[60] K. C.Gordon, C.M. McGoverin, International journal of pharmaceutics, 417(1), 151 (2011)
[61] C. Gendrin, Y. Roggo, C. Collet, Journal of pharmaceutical and biomedical analysis,
48(3), 533 (2008).
[62] A. Gowen, et al., Trends in Food Science & Technology,. 18(12), 590 (2007).
[63] G. Shaw, D. Manolakis, IEEE Signal processing magazine,. 19(1), 12 (2002)
[64] P.G. Lucey, K.A. Horton, T. Williams, Applied optics,. 47(28), F107 ( 2008)
[65] S. Sasic, Y. Ozaki, Raman, Infrared, and Near-Infrared Chemical Imaging. 2011: Wiley.
[66] V.G.Gregoriou, M.S. Braiman, Vibrational Spectroscopy of Biological and Polymeric
Materials. 2005: CRC Press.
[67] M.D., Morris, Microscopic and spectroscopic imaging of the chemical state. 1993:
CRC Press.
[68] F.Severcan, P.I. Haris, and I. Press, Vibrational Spectroscopy in Diagnosis and Screening.
2012: IOS Press.
[69] Y. Arai, D. Sparks, Journal of Colloid and Interface Science,. 241(2), 317 (2001)
[70] M.,Lebon, A. Zazzo, I. Reiche, Palaeogeography, Palaeoclimatology, Palaeoecology,
416, 110 (2014).
[71] G.H.,Yassen, et al., Journal of endodontics,. 39(2), 269 (2013).
[72] Y.,Xia, N. Ramakrishnan, A. Bidthanapally, Osteoarthritis and cartilage 15(7), 780 (2007).
[73] R.M. Coleman, et al., Bone, 2012. 51(5): p. 920-928.
[74] N. Pleshko, A. Boskey, and R. Mendelsohn, Biophysical journal,. 60(4) 786 (1991).
[75] K. Czamara, et al., Analyst,. 140(7), 2164 (2015).
[76] M. Pilarczyk, et al., Vibrational Spectroscopy,. 75, 39 (2014).
[77] P.P.Kundu, C. Narayana, Journal of Medical & Allied Sciences,. 2(2), 41 (2012)
[78] K. Majzner, et al., Analyst,. 138(2), 603 (2013).
[79] B. Singh, et al., Application of vibrational microspectroscopy to biology and medicine.
Current Science (Bangalore),. 102(2), 232 (2012).
[80] H.W.,Siesler, Infrared and Raman Spectroscopic Imaging. 2014: Wiley.
[81] S. Weiner, P. Goldberg, O. Bar-Yosef, Journal of Archaeological Science, 20(6), 613 (1993).
[82] G. Boivin, et al., Bone, 2000. 27(5): p. 687-694.
[83] M. Pilarczyk, et al., PloS one,. 9(8), e106065 (2014)

167
[84] K. Kochan, et al., Analyst,. 138(14), 3885 (2013).
[85] H.,Nawaz, et al., Analyst,. 135(12), 3070 (2010).
[86] J.,Kneipp, et al., Vibrational spectroscopy,. 32(1), 67 (2003)
[87] S.,Amarie, et al., Beilstein journal of nanotechnology,. 3(1), 312 (2012)
[88] S.Weiner, H.D. Wagner, Annual Review of Materials Science, 28(1), 271 (1998).
[89] N. Avery, et al., Collagen: structure and mechanics, 2008, Springer Science+ Business Media,
LLC.
[90] A.Olcott Marshall, C.P. Marshall, Vibrational spectroscopy of fossils. Palaeontology
58(2), 201 (2015)
[91] I. Reiche, C. Vignaud, M. Menu, Archaeometry,. 44(3), 447 (2002).
[92] I. Davies, a comparative study of the microstruci'ure-property relationship in human adult and
baby teeth. in Advances in Bioceramics and Biocomposites: A Collection of Papers Presented
at the 29th International Conference on Advanced Ceramics and Composites, Jan 23-28,
2005, Cocoa Beach, FL, Ceramic Engineering and Science Proceedings, Vol 26. 2009. John
Wiley & Sons.
[93] A. S.Clasen, I. Ruyter, Advances in Dental Research,. 11(4). 523 (1997).
[94] Q. A. Acton, Issues in Industrial, Applied, and Environmental Chemistry: 2011 Edition. 2012:
ScholarlyEditions.
[95] E. DiMasi, L.B. Gower, Biomineralization Sourcebook: Characterization of Biominerals and
Biomimetic Materials. 2014: CRC Press.
[96] Northern Jordan, A.B.S.I., Tomb Reuse At Yasieleh: A Byzantine Site In Northern Jordan.
2006.
[97] A. Al-Shorman, Mediterranean Archaeology and Archaeometry. 6(1) 43 (2006)
[98] A. Al-Shorman, Antiquity,. 78(300), 306 (2004)
[99] L. Wang, et al., Mineralogical Magazine,. 71(5), 509 (2007)
[100] M.,Anwar Alebrahim, et al., Biomedical Spectroscopy and Imaging,. 3(1), 15 (2014)
[101] X., Bi, et al., Analytical and bioanalytical chemistry,. 387(5), 1601 (2007).
[102] X.,Wang, et al., Calcified tissue international, 71(2), 186 (2002)
[103] P.A.,West, et al., Journal of biomedical optics,. 10(1), 014015 (2005).
[104] D.,Faibish, et al., Bone,. 36(1), 6 (2005).
[105] D. Faibish, S.M. Ott, A.L. Boskey, Clinical orthopaedics and related research 443, 28 (2006)
[106] A.L.,Boskey, Elements, 3(6), 385 (2007)
[107] S.Y.Lee, , et al., Journal of veterinary science,. 10(4), 299 (2009)
[108] A.S. Clasen, I. Ruyter, Adv Dent Res,. 11(4), 523 (1997)