mapping of water scarce zones of osmanabad …ijiet.com/wp-content/uploads/2015/04/37.pdfmapping of...
TRANSCRIPT

Mapping of Water Scarce Zones of Osmanabad District by Analysis of Groundwater Levels and
Rainfall
Mustaq Ahmad Jabir Shaikh Groundwater Surveys and Development Agency, Government of Maharashtra, Pune, Maharashtra, India
Farjana Sikandar Birajdar Centre of Studies in Resources Engineering
Indian Institute of Technology, Bombay, Mumbai, India
Abstract- Groundwater is a major component of public water supply and water use in the Osmanabad district. The groundwater systems underlying present study area is phreatic and dynamic, thus responds to the balance between supply (precipitation) and demand (draft). Anthropogenic activities, such as excessive groundwater extraction for irrigation, domestic purposes are created a condition of lowering of water levels in an aquifer. These effects might manifest themselves locally, but can extend over larger areas limited to the area occupied by aquifer due to intensive extraction of groundwater. Moreover, changes to the landscape occurring from alteration of the land cover can also have a significant influence on aquifer water levels by changing the ability of precipitation to recharge the subsurface. Apart from anthropogenic activity, there is large-scale climatic effect that affects adversely on the groundwater regime of Osmanabad district. The highly erratic nature of rainfall from the last few years creates havoc in Osmanabad. Therefore, in the present study an attempt has been made to study the trend of water level of pre monsoon season (2000-2013) from 114 observation wells (GSDA report) in relation to precipitation for the last 10 years (2004-2013). The GIS technique was used to map the depletion of water level information. The present study used to set basin management and to understand changes in the groundwater resource over time resulting from rate of extraction of groundwater, variation of rainfall in terms of frequency, intensity and duration. And to provide information for improvements in the planning, policy and management of groundwater resources.
Keywords – water level, observation wells, rainfall, GIS technique, Osmanabad
I. INTRODUCTION
Water is the most fundamental thing which is required to sustain human life. Demand of water is increasing from last few decades because of increase in population, urbanization, industrialization and irrigation [1]. Over extraction of groundwater than the natural recharge of water, for fulfilling the increased demands of the increased population and pollutions from different sources causing fresh water resources decreasing day by day. Therefore it creates enormous gap in the demand side and supply side of water. To fill this gap, groundwater extraction takes the form of aquifer overpumping and results into falling water tables, which is nearly invisible [2]. Falling water levels are often not discovered until wells go dry. The groundwater systems underlying present study area is phreatic and dynamic, thus responds to the balance between supply (precipitation) and demand (draft). Most of the wells are having water in rainy season and as the summer season starts, the water levels starts declining and few wells got dried up. Therefore, during summer months the less availability of water creates water scarcity [3]. The constant extraction of groundwater for irrigation, industrial, domestic purposes creates lowering of water table of the regime. Overpumping creates a false sense of irrigation security, industrial growth and by this way, it enables us to satisfy growing crops needs today, but it almost guarantees a decline in crop production and industrial growth in future, when the aquifer is depleted [4]. In places where water tables already are falling and wells are going dry, is not a recipe for economic progress and political stability. Continuing population growth in countries already overpumping their aquifers and draining their wells dry could lead to acute hydrological poverty, a situation in which people simply do not have enough water to meet their basic needs [5]. The gap between the continuously growing use of water and the sustainable supply is widening each year, making it more and more difficult to support rapid growth in development of the regime. Apart from anthropogenic activity, there is large-scale climatic effect that affects adversely on the groundwater regime of Osmanabad district [6]. The highly erratic nature of rainfall from the last few years creates havoc in Osmanabad. To

fulfill the requirement of water during the water scarcity period, Groundwater Surveys and Development Agency propose the water supply through tankers and temporary water supply schemes. To provide water through tankers and temporary supply schemes, huge amount of funds required. Therefore, in the present study an attempt has been made to study the trend of water level of pre monsoon season (2000-2013) from 114 observation wells [7] in relation to precipitation for the years (2004-2013). The objective of this research paper is to find out the water scarce zone of the Osmanabad district. This study can be used to create the awareness about the less availability of water to the stakeholders which are suffering from water scarcity. The GIS technique was used to map the depletion of water level information and prediction of water scarce zone of Osmanabad.copies.
The rest of the paper is organized as follows. The detailed information about the study area, Geology and Hydrogeology of the area are given in section II. Experimental results are presented in section III. Concluding remarks are given in section IV.
II. STUDY AREA
Osmanabad district comprises of eight taluka viz. Osmanabad, Omerga, Kalamb, Tuljapur, Paranda, Bhoom, Lohara and Washi. Osmanabad district is situated mainly in Sina, Bhima basin, and Manjra basin. The geographical area of the district is 7569 Sq.Km. The altitude range of the district is between 440 meters to 750 meters above mean sea level. Osmanabad district is located towards south of Balaghat ranges. Major slope direction is towards Southeast. The major rivers are Manjra, Benethora and Sina with its tributaries namely Terna, Except the southern and western parts of the district, which are drained by the tributaries of the Bhima system and Sina system, the rest of the district is drained by the Manjra and its tributaries belonging to the Godavari basin. The Manjra itself along with its tributaries, the Terna, the Tawarja drains the Balaghat Plateau portion, while its three other tributaries, the Manar, the Tiru and the Lendi drain the area to the north of the plateau. The Sina river basin drains the top north-west part of the district particularly Paranda Taluka of the district. The other prominent rivers are Bori, Banganga, Bhogawati, Harni and Chandani rivers. Depending on the geomorphology and drainage the district has been divided in to 41 watersheds.
A. Geology –
To get the information of Geology of the area, 80 dugwell sections have been examined through well inventory study. Geologically the district area is mainly covered by Deccan trap basalt. The rock formations are made up of less fractured massive cap rock followed by vesicular zeolitic basalt. The upper less fractured massive basalt varies in depth from 12 meters to 4 meter and is moderately weathered up to 2 to 4 meters. The Black Cotton Soil (BC) is about 0 to 3 m thickness; underlying 3 to 6 m highly weathered and fractured basalt. This is followed by 6 to 12 m fractured and brecciated flow which is followed by jointed and massive basalt.

Fig. 1. Location map of the study area
B. Hydrogeology –
The areas of watersheds are occupied mainly by succession of basaltic lava flows belonging to Deccan trap with small alluvial patches of recent age. Flows are thick and extensive. Each lava flow is separated by the occurrence of red bole which shows time gap between two flows. The rock formations are made up of less fractured massive cap rock followed by vesicular zeolitic basalt. The upper less fractured massive basalt varies in depth from 4 meters to 12 meter and is moderately weathered up to 2 to 4 meters. The Black Cotton Soil (BC) is about 0 to 3 m thickness; underlying 3 to 6 m highly weathered and fractured basalt. This is followed by 6 to 12 m fractured and
brecciated flow which is followed by jointed and massive basalt. The Balaghat plateau with slope towards southwest and south has varied topography consisting of hills, plains and undulating topography near river banks. The main water bearing formations (Aquifer) of the area are predominantly weathered, fractured and jointed massive basalt and Vesicular zeolitic portion. Due to presence of alternate
flows with units of vesicular and massive basalt, the Deccan trap acts as multi-aquifer system. The massive fractured jointed basalt is predominantly acting as major aquifer system at shallow depth.
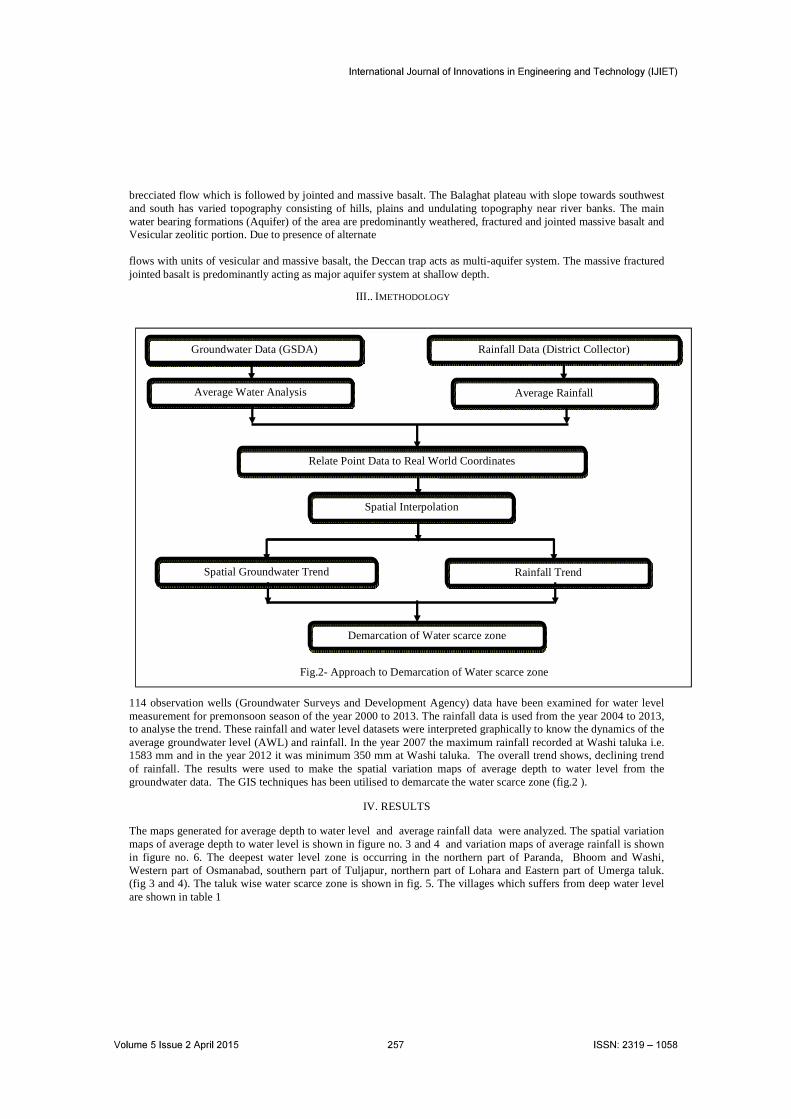
III.. IMETHODOLOGY
.
Figure 1. DWT Decomposition model
On the basis of such considerations, the algorithm uses a different color image multiplied by the weighting
114 observation wells (Groundwater Surveys and Development Agency) data have been examined for water level measurement for premonsoon season of the year 2000 to 2013. The rainfall data is used from the year 2004 to 2013, to analyse the trend. These rainfall and water level datasets were interpreted graphically to know the dynamics of the average groundwater level (AWL) and rainfall. In the year 2007 the maximum rainfall recorded at Washi taluka i.e. 1583 mm and in the year 2012 it was minimum 350 mm at Washi taluka. The overall trend shows, declining trend of rainfall. The results were used to make the spatial variation maps of average depth to water level from the groundwater data. The GIS techniques has been utilised to demarcate the water scarce zone (fig.2 ).
IV. RESULTS
The maps generated for average depth to water level and average rainfall data were analyzed. The spatial variationmaps of average depth to water level is shown in figure no. 3 and 4 and variation maps of average rainfall is shown in figure no. 6. The deepest water level zone is occurring in the northern part of Paranda, Bhoom and Washi, Western part of Osmanabad, southern part of Tuljapur, northern part of Lohara and Eastern part of Umerga taluk. (fig 3 and 4). The taluk wise water scarce zone is shown in fig. 5. The villages which suffers from deep water level are shown in table 1
Spatial Interpolation
Spatial Groundwater Trend Rainfall Trend
Demarcation of Water scarce zone
Groundwater Data (GSDA) Rainfall Data (District Collector)
Average Water Analysis Average Rainfall
Relate Point Data to Real World Coordinates
Fig.2- Approach to Demarcation of Water scarce zone

Figure 3. Water Levels of Osmanabad District from year 2000 to 2007

Figure 4. Water Levels of Osmanabad District from year 2008 to 2013

Table 1- Villages which suffer in water scarcity
No. Village Taluk
1 Chinchpur Bk Paranda
2 Pandharewadi Paranda
3 Maniknagar Paranda
4 Chinchpur Khurd Paranda
5 Watefal Paranda
6 Ingonda Paranda
7 Karla Paranda
8 Anala Paranda
9 Ratnapur Paranda
10 Malkapur Paranda
11 Hangewadi Paranda
12 Khandeshwarwadi Paranda
13 Takmodwadi Paranda
14 Jektewadi Paranda
15 Tintraj Bhum
16 Antarwali Bhum
17 Sawargaon Bhum
18 Anandwadi ambi Bhum
19 Bedarwadi Bhum
20 Jaiwant nagar Bhum
21 Aliyabadwadi Bhum
22 Gosavuwadu ambi Bhum
23 Samangaon Bhum
24 Walha Bhum
25 Walwad Bhum
26 Dahiphal Kalamb
27 Shelgaon Kalamb
28 Izora Kalamb
29 Saramkundi Kalamb
30 Pimpalgaon Kamleshwari Kalamb
31 Rui Kalamb
32 Sarola Mandwa Kalamb
33 Gour Kalamb
34 Khamkarwadi Washi
35 Satvaiwadi Washi
36 Ratnapur Washi
37 Terkheda Washi
38 Umra Washi
39 Osmanabad Osmanabad
40 Sanja Osmanabad
41 Kaudgaon Osmanabad
42 Raghuchiwadi Osmanabad
43 Gaosud Osmanabad
44 Shekapur Osmanabad
45 Deolali Osmanabad
46 Medsingha Osmanabad
47 Saknewadi Osmanabad
48 Padoli Osmanabad
49 Kanegaon Lohara
50 Kamalpur Lohara
51 Dahiwadi Tuljapur
52 Masala Khurd Tuljapur
53 Sangavi Mardi Tuljapur
54 Sarola Tuljapur
55 Sindhgaon Tuljapur
56 Nandgaon Tuljapur
57 Kunsawali Tuljapur
58 Chakur Umerga
59 Chirewadi Umerga
60 Wagdari Umerga
61 GugalgaonM Umerga
62 Mulaj Umerga
63 Karali Umerga
64 Kunhali Umerga
65 Kadampur Umerga
66 Dudhnal Umerga
67 Talmod Umerga
68 Jagadalwadi Umerga
69 Dhatiwadi Umerga
70 Turori Umerga
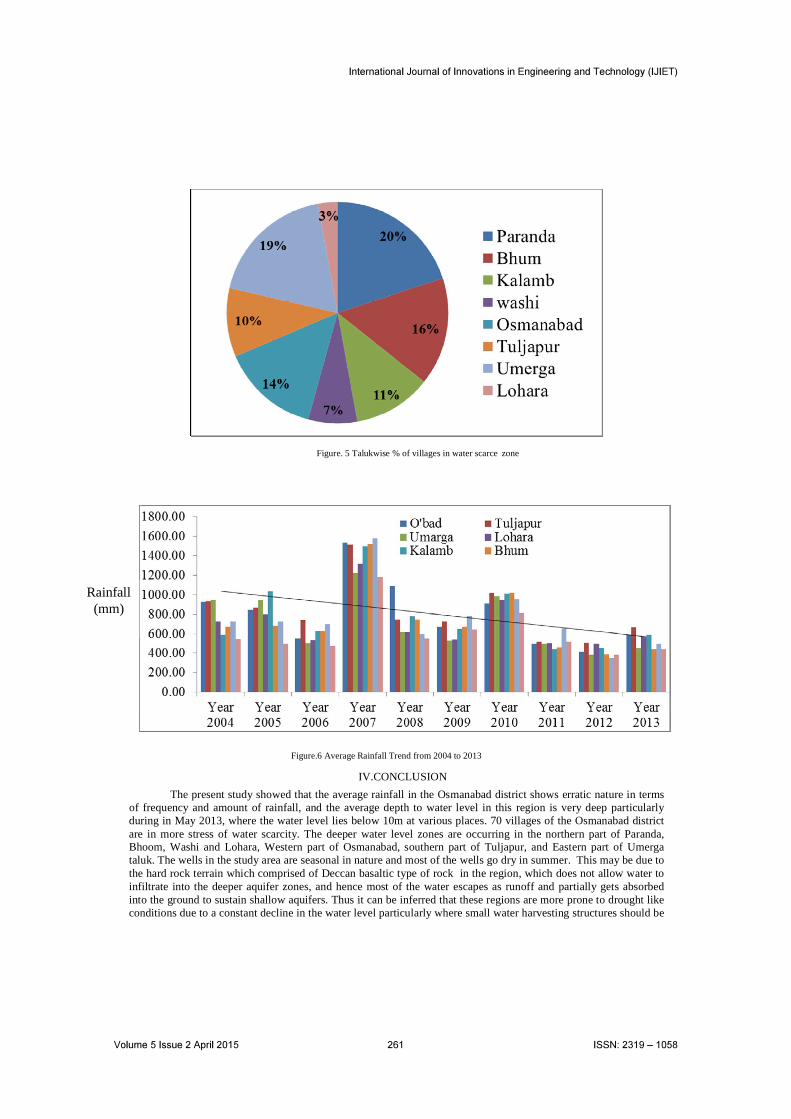
Figure. 5 Talukwise % of villages in water scarce zone
Figure.6 Average Rainfall Trend from 2004 to 2013
IV.CONCLUSION
The present study showed that the average rainfall in the Osmanabad district shows erratic nature in terms of frequency and amount of rainfall, and the average depth to water level in this region is very deep particularly during in May 2013, where the water level lies below 10m at various places. 70 villages of the Osmanabad district are in more stress of water scarcity. The deeper water level zones are occurring in the northern part of Paranda, Bhoom, Washi and Lohara, Western part of Osmanabad, southern part of Tuljapur, and Eastern part of Umerga taluk. The wells in the study area are seasonal in nature and most of the wells go dry in summer. This may be due to the hard rock terrain which comprised of Deccan basaltic type of rock in the region, which does not allow water to infiltrate into the deeper aquifer zones, and hence most of the water escapes as runoff and partially gets absorbed into the ground to sustain shallow aquifers. Thus it can be inferred that these regions are more prone to drought like conditions due to a constant decline in the water level particularly where small water harvesting structures should be
Rainfall (mm)

made to augment the ground water. The study shows the potential of employing GIS based interpolation techniques for geospatial analysis of ground water trend for deciphering areas for groundwater development in accordance with the temporal rainfall pattern over the region. The present study used to set basin management and to understand changes in the groundwater resource over time resulting from rate of extraction of groundwater, variation of rainfall in terms of frequency, intensity and duration. These datasets can be used to provide information for improvements in the planning, policy and management of groundwater resources in the area.
REFERENCES
[1] Mall.R.K et.al., “Water resources and climate change: An Indian perspective,” in Current Science. Vol. 90, No.12, 25th June 2014, pp. 1610–1626.
[2] Kumar.R. et.al., “Water resources of India”, in in Current Science. Vol. 80, No.5, 10th Sept. 2015, pp. 794–811.
[3] Bates, B.C.,et.al.,”Climate Change and Water. Technical Paper of the Intergovernmental Panel on Climate Change”, IPCC Secretariat, Geneva, 2008210 pp.
[4] Central Ground Water Board, Ministry of Water Resources, Government of India., Report on “Groundwater Scenario in Major cities of India”.2011, pp 143-149.
[5] Lester R. Brown, “Outgrowing the Earth: The Food Security Challenge in an Age of Falling Water Tables and Rising Temperatures”, 2005, (NY: W.W. Norton & Co., 2005), pp 1-10.
[6] Groundwater Surveys and Devleopment Agency, Water Supply and Sanitation Department, Government of Maharashtra.,“Water Scarcity Report of Osmanabad District”., Sept 2012, pp 3-7.
[7] Groundwater Surveys and Devleopment Agency, Water Supply and Sanitation Department, Government of Maharashtra.,“Hydrogeological Report of Osmanabad District”., Sept 2010, pp 3-8.