mapping paleocurrents: using the past to understand the present laurie grigg and david westerman...
TRANSCRIPT

Mapping Paleocurrents: Using the Past to Understand the Present
Laurie Grigg and David WestermanDepartment of Geology and Environmental Science
Norwich UniversityNorthfield, VT 05663
Image from http://www2.nau.edu/rcb7/rect_globe.html

Activity Goals/Outcomes:
• To understand the processes that create surface currents and oceanic gyres;
• To be able to evaluate how changes in the position of the continents alters surface currents;
• To be able to create plausible patterns of surface currents based on what is known from the present;
• To be able to evaluate how surface currents impact oceanic heat transport and climate.

In-class Activity or Lab
• Currently used as part of a 2-hour lab – 5 paleomaps;
• Could be shortened to an in-class, group activity by dividing maps among groups or just doing 1-2 maps.

Skills and Concepts Needed for this Activity
• Understand large-scale patterns of global atmospheric circulation (Trade Winds, Westerlies, and the Polar Easterlies);


Skills and Concepts Needed for this Activity
• Understand large-scale patterns of global atmospheric circulation (Trade Winds, Westerlies, and the Polar Easterlies);
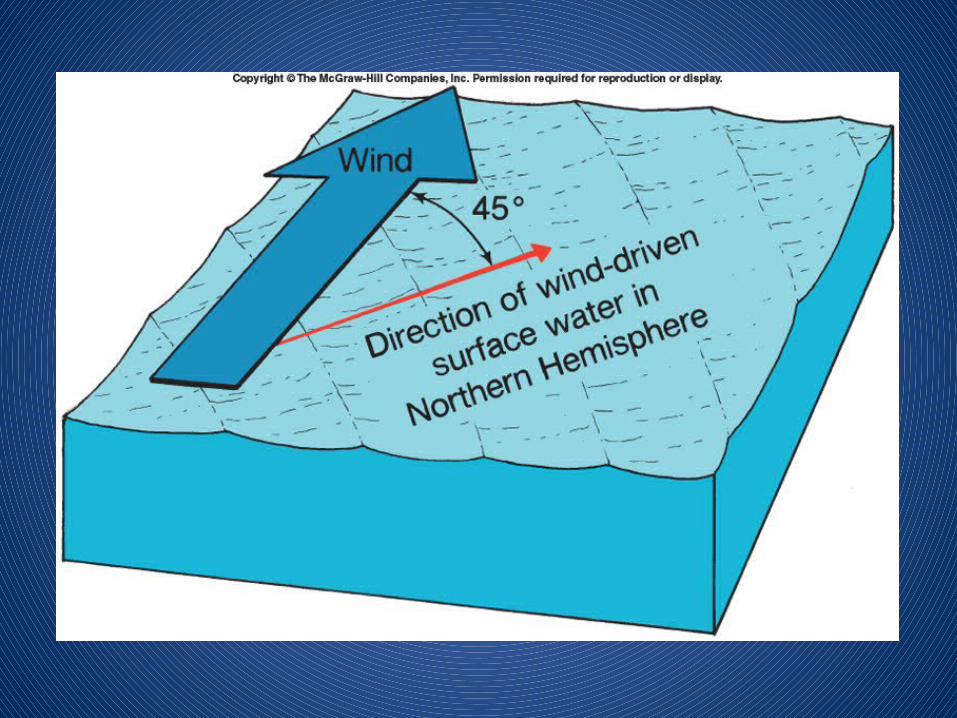
• Understand the impacts of wind stress, the Coriolis Effect, and surface friction on surface currents;

Fridtjof Nansen 1890s
• Fram frozen for 6 yrs in Arctic Sea
• Drift to North Pole• First noted offset
between wind and ocean currents

Skills and Concepts Needed for this Activity
• Understand large-scale patterns of global atmospheric circulation (Trade Winds, Westerlies, and the Polar Easterlies);
• Understand the impacts of wind stress, the Coriolis Effect, and surface friction on the creation of oceanic gyres;
• Understand the difference between wind-driven surface currents and boundary currents;
• Understand the concept of oceanic heat transport;

http://www.ospo.noaa.gov/data/sst/contour/global.cf.gif
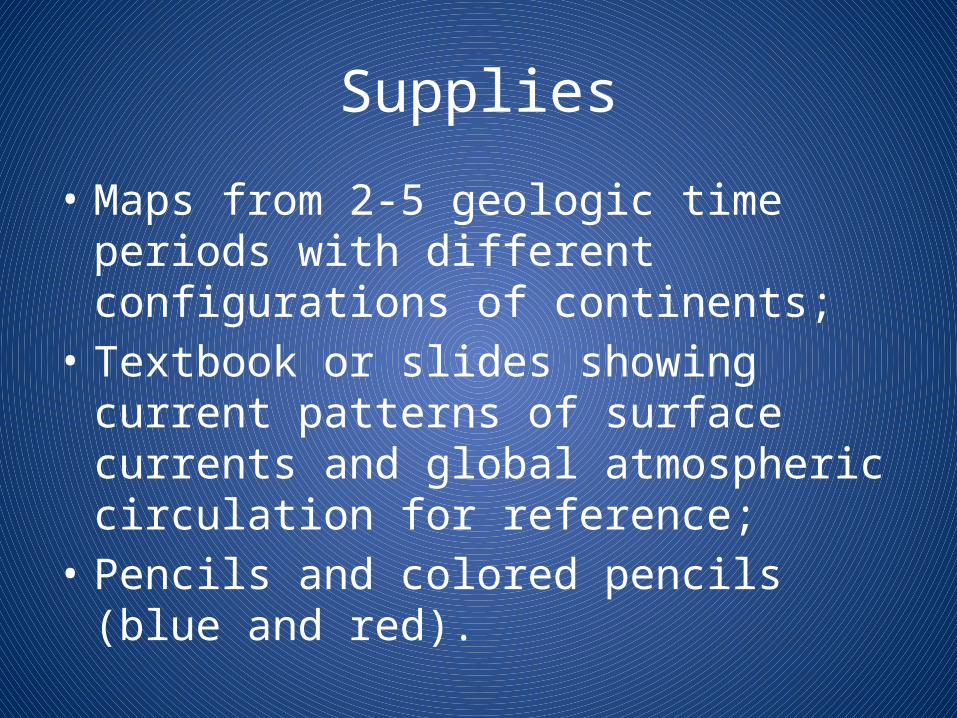
Supplies
• Maps from 2-5 geologic time periods with different configurations of continents;
• Textbook or slides showing current patterns of surface currents and global atmospheric circulation for reference;
• Pencils and colored pencils (blue and red).

Map Sources
• Black and white with latitude and longitude grid lines;
• What I use:
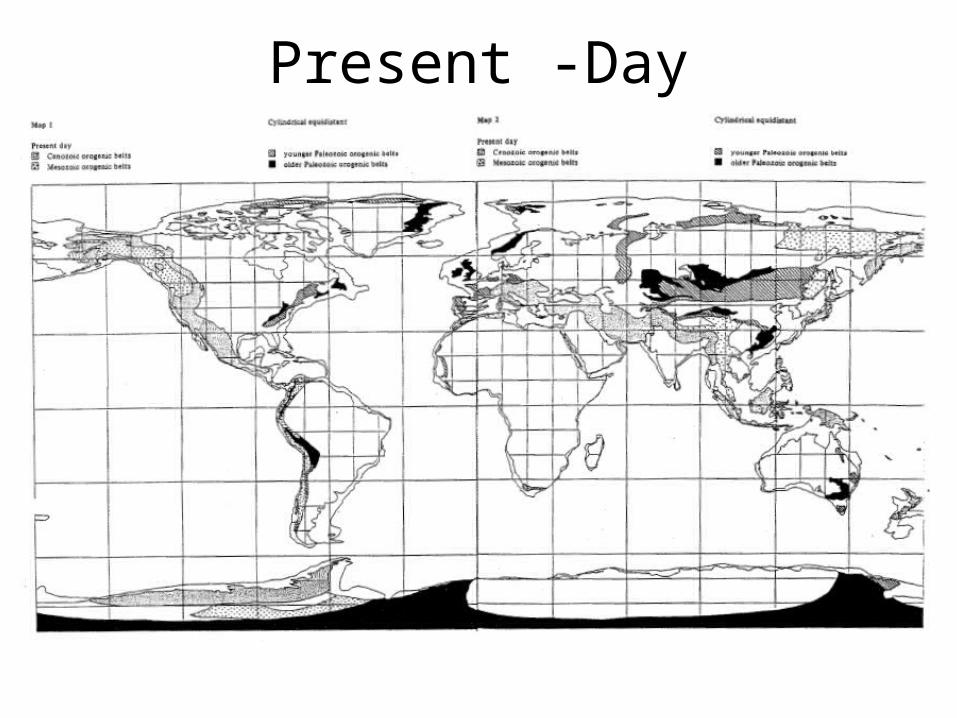
Present -Day
• Scanned maps that I use

80 Million Years Ago

180 million Years Ago

360 Million Years Ago

480 Million Years Ago

Map Sources
• Black and white with latitude and longitude grid lines;• What I use:• Online sources:
– Library of Paelogeography by Ron Blakey; color images with grid lines for all time periods. http://www.cpgeosystems.com/mollglobe.html
– The Paleogeographic Atlas Project from the University of Chicago; nice maps with latitude and longitude grid lines but only for early Permian to Lake Cretaceous. http://www.geo.arizona.edu/~rees/PGAPhome.html
– Paleomap Project by Christopher R. Scotese; very nice color maps for all time periods but without grid lines, also has nice paleoclimate maps. http://www.scotese.com/earth.htm


Some Important Assumptions
1) Assume that the Earth is tilted 23.5⁰ and has similar orbital parameters (eccentricity and obliquity) as today.
2) Therefore, distribution of insolation and global heating are similar to present.
3) Therefore, global atmospheric wind patterns are the same to present.
4) Note opportunity to mention this was NOT actually the case.

Basic Instructions
• Draw in location of Trade Winds, Westerlies and Polar Easterlies in pencil (lightly and not too many arrows).
• Draw in surface currents based on winds, location of continents, and accounting for the Coriolis Effect using red and blue arrows.
• Shade in regions that are unusually cold or warm because they are cut off from heat transport of a gyre.
• Repeat process for multiple time periods – good to start with the present.

Student Examples: Present-day
• Scanned examples

Student Examples: 80 Million Years

Student Examples: 360 Million Years

Assessment
• In-class group presentation of proposed currents and/or hand-in group maps.
• As a lab activity each students hands in a packet of 5 completed maps.
• Are currents plausible and do they take into account winds, Coriolis Effect, surface friction, and interaction with the continents?
• Is map neat and legible?