mapping parent’s perception of safety related to the … · mapping parent’s perception of...
TRANSCRIPT
Mapping Parent’s Perception of Safety Related to the Built Urban Environment Team 1
Amrit Parmar, Nedene De Guzman, Mansoureh Rameshk and Naina Mehta GEOG 455 | Simon Fraser University | Spring 2016

2
Abstract Outdoor play affords benefits to children that are not readily available indoors, including
physical movement, exposure to natural environments and materials, and promoting social engagement. Yet half of Canadian children play actively outdoors for less than three hours a week. Parental perception of neighbourhood safety is a key factor limiting independent mobility and access to outdoor play, especially prior to adolescence. This report addresses the literature for elements of the BUE (built urban environment, refers to man-made features in which people live, work and recreate daily; these artificial features can be altered) associated with crime as well as other features that reduce safety so these factors can be mapped.
Since parents are likely to have a prominent impact on their children's behaviour and
choices related to playability; it is therefore, vital to use qualitative literature research and Geographic Information Science (GIS) methodologies to comprehend which elements influence parent’s perception in restraining their child’s access to outdoor play. The findings from this research do not offer a solution to the research question; rather compliment the study being done by Dr. Mariana Brussoni, in creating a universal Playability scale, similar to the Walkability Index for Canada.

3
Table of Contents I. Introduction .................................................... 5 II. Study Area ...................................................... 6 III. Objectives ..................................................... 7 IV. Literature Review ......................................... 7
4.1 Child Perception on Safety .............................................................. 7 4.2 Parents’ Perception on Safety .......................................................... 7 4.3 Elements of the Built Urban Environment ...................................... 8 4.4. Elements of the Social Neighbourhood .......................................... 9
V. Methods ...................................................... 10 5.1 Data Collection .............................................................................. 10 5.2 Study Population ............................................................................ 11 5.3 Recreational Environment ............................................................. 12 5.4 Transport Environment .................................................................. 12 5.5 Crime .............................................................................................. 13 5.6 Weighted Scoring Method ............................................................. 14
VI. Results ........................................................ 15 VII. Discussion ................................................. 18 VII. Limitations ................................................ 19 IX. Conclusion .................................................. 19 X. References .................................................... 20 XI. Appendix .................................................... 22

4
List of Figures Figure 1 ............................................................................... 6 The map of Surrey divided into the 6 dissemination areas we will be using for this study
Figure 2 ............................................................................... 8 The list of factors and variables that greatly influence the BUE. All variables were chosen based off literature review. Some of the names were changed to best fit the available data we had.
Figure 3 ............................................................................. 11 Child Population Density in Surrey. The smaller dot represents a buffer area of approximately 0-100 children, while the larger dot represents approximately 200-300 children in the area. Figure 4 ............................................................................. 14 The formula used to determine the weight for each factor affecting the elements of the BUE. Figure 5 ............................................................................. 15 The level of suitability per dissemination area, in terms of the Recreational Environment. Figure 6 ............................................................................. 15 The level of suitability, in terms of the Transport Environment. Figure 7 ............................................................................. 16 The level of suitability, in terms of Crime in Surrey. Figure 8 ............................................................................. 16 The overall results when transport environment, recreational environment, and crime were combined. The level of suitability in terms of Playability in Surrey with regards to safety. Figure 9 ............................................................................. 17 The level of Suitability in terms of Playability in Surrey with regards to safety. The child population layer was added to show the spread and density.

5
I. Introduction The aim of this research is to understand the context of the built urban environment in
terms of its role in influencing parent’s perception of their child’s safety; for the purposes of this research the built urban environment is defined as, “the human-made space in which people live, work, and recreate on a day-to-day basis; it includes the buildings and spaces we create or modify” (Roof & Oleru, 2008, 24). Outdoor play is associated with development, health, well-being, and physical activity in children. It also delivers benefits that are not readily available in doors, such as: acquaintance to natural environments, road and traffic safety skills, and social engagement. Yet half of Canadian children play actively outdoors for less than three hours a week (Tremblay et al. 2015). Since parents are likely to be a prominent impact on their children's behavior and choices it is important to use qualitative literature research and Geographic Information Science (GIS) methodologies to understand what elements influence parent’s perception in restraining access to outdoor play for children (Santo Paula et al., 2013).
In understanding areas of reduced child playability, from this research’s outputs, we expect
to see areas within the City of Surrey that have low playability in terms of parents’ perception of child safety. According to Weir et al. (2006), their findings suggest that safety concerns play a key role in limiting children's outdoor activities and underscore the basic need for security in order to create an environment that supports outdoor recreation.
The findings from this research do not offer a solution to the research question; rather
compliment the study being done by Dr. Mariana Brussoni, in creating a universal Playability scale, similar to the Walkability Index for Canada. This study is a small percentage of the research that looks further into the perceived parental safety aspect that reduces child’s play in their neighbourhood. Created by University of British Columbia’s Faculty of Medicine, Health and Community Design Lab, a Walkability index is a resource used to measure and visualize walkability and the characteristics of the physical environment that contribute to walkable neighbourhood design. This research and map outputs will aid Dr. Brussoni in creating a model to represent the major safety concerns in relation to the Playability scale.
The target audience for this report are: Dr. Mariana Brussoni, Dr. Nadine Schuurrman,
Marco Jorge, City Planners, parents throughout Metro Vancouver, and lastly, various other communities within and outside of British Columbia who are interested in comprehending parent’s perception of safety.

6
II. Study Area
For Dr. Mariana Brussoni’s research on creating a universal Playability scale, her target is to understand playability in the Metro Vancouver region. To narrow down on her research, we chose to focus in on the City of Surrey due to its expanding growth, and readily available data. According to Statistics Canada, the population of Surrey as of 2011 is 468, 251, an increase of 18.6% since 2006. It is a member of the Metro Vancouver regional district. Additionally, Surrey is the third largest City in the province by area, and the second largest city by population. The non-minority group population in Surrey makes up approximately 52.6% of the city’s population (Statistics Canada, 2011). Surrey is the most populous city in Canada to be policed by the RCMP, primarily due to the fact crime rates continue to rise in comparison to the previous year (Surrey RCMP Statistics, 2015). Figure 1, is the map of Surrey and its dissemination areas, or towns, which will be analyzed in this study.
Figure 1. The map of Surrey divided into the 6 dissemination areas we will be using for this study
7
III. Objectives
The goal of this research is to map playability in the City of Surrey in terms of parent’s perception of their child’s safety in the built urban environment as well as identify elements in the built urban environment contributing to parent’s perception as portrayed in the literature.
IV. Literature Review
4.1 Child’s Perception on Safety Understanding a child’s perception to safety is an essential factor effecting parental perception.
For which, research by Carver et al. proposes that children observe public spaces to be not as much of safe as their respective home’s (Carver et al., 2008). In addition, Carver et al.’s work also notes, the perception of risk in children is related to the distance from home and the level of protection given by their parents (Carver et al., 2008). Children younger than 13 years of age do not make a connection between stranger and sexual risk of any kind; the children instead are more alarmed about the risks of abduction, some sort of physical violence and murder (Carver et al., 2008).
4.2 Parental Perception on Safety Research by Vincenten et al., 2005 highlights the importance of understanding parent’s
perception of child safety since, parents are primary caregivers of children, it is necessary to learn more about their perceptions, attitudes, behaviors and anxieties towards their child’s safety. Subjective rating of crime and the fear of crime is a stronger predictor of parental behavior, related to their child’s playability than the actual crime rates. So if parents think that there is a high risk of crime in their area, then they will be more reluctant to outdoors and also send their children outdoors (Carver et al., 2008). For example, parent’s perception may be influenced by the physical degradation of the neighborhood, rather than crime statistics. Therefore, sometimes these are the parental perceptions that a child takes to the playground. Physical and social disorder in the neighborhood as noted by Carver et al., show that inner-city parents were more apprehensive about neighborhood safety than, suburban parents (Carver et al., 2008); and this as a result negatively associated with children’s levels of physical activity. Moreover, since parents feel the need that they have to protect their children at all times, they find it difficult to do so because they are unable to keep an eye on their children at all times (Vincenten et al., 2005).
In order to fully understand the context of the factors related to parents’ perception of the Built
Urban Environment in the following sections, Figure 2, displays a chart listing the factors associated with the Built Urban Environment and the Social Neighbourhood Environment aspect of the Built Urban Environment.

8
Figure 2. The list of factors and variables that greatly influence the BUE. All variables were chosen based off literature review. Some of the names were changed to best fit the available data we had.
4.3 Elements of the Built Urban Environment
4.3.1 Neighborhood Design & Recreation Environment
Neighborhood design such as the recreational environment of the BUE increases the
opportunity for children to participate in active outdoor play (Hager et al., 2013). Therefore, a higher concentration of various forms of recreation environments allow children to participate in outdoor play as well as create a community bond so that parents feel that their children are in a safe space (Handy et al., 2008). Parks are an important recreation environment since they provide a green space for children to openly play. Parks contain play grounds, tracks, open space and recreational elements for various sports (Hager et al., 2013). Recreational facilities are important because this space either private or public where children can participate in play (Handy et al., 2008). There is a sense of familiarity with staff that works there and children get a chance to associate with all ages in a safe environment (Hager et al., 2013). Playgrounds again are an important element since they provide a common space where children are able to play and associate with one another. It promotes physical and social development in the child (Hager et al., 2013). Children are able to create a sense of community with the other children and parents in the area. Lastly, the presence of schools ties the sense of community together. This is a space where children are able to openly play and are surrounded by individuals who can be trusted (such as
9
teachers and staff) (Hager et al., 2013). Moreover, the higher concentration of all these elements promotes outdoor play in a neighborhood as well as decrease parent’s anxiety towards their child’s safety (Handy et al., 2008). In conclusion neighborhood design, is an important variable associated with the recreation environment and centers, as these aesthetic features exemplify parental belief to send their kids got out to play because, if there is high distribution of children in the neighbourhood parents are more likely to send their kids outside (Hager et al., 2013).
4.3.2 Transport Environment Transport Environment is another common factor that contributes to parent’s anxiety, where
parents are mostly concerned about their child being hit by oncoming traffic. This anxiety is dealt with an increase in sidewalks, streetlights, traffic signals and traffic speed in the nearby areas (Vincenten et al., 2005). Therefore, areas with greater availability of traffic control allow for a more mobile space for children to move in.
Built neighborhood characteristics such as the lack of road networks, cause parental restriction
of their children’s independent mobility; which was prejudiced by parental perceptions of local road safety, as well as the occurrence of accidents within the neighbourhood (Carver et al., 2008). Furthermore, a study in Maryland, USA Gielen et al. found that 70% of parents of junior schoolchildren limited their children’s outdoor play because of their anxiety about ‘unsafe cars and trucks’ (Gielen et al., 2004). This anxiety comes from the parent’s own personal experiences while walking in their neighbourhoods and noticing the characteristics of the BUE (such as narrow sidewalks, which are frequently obstructed by motor automobiles), also from their perception that most individuals simply drive their vehicles too fast (Mitra et al., 2014).
4.4 Elements of the Social Neighborhood Environment
4.4.1 Crime Density
Crime density is a comprehensive element; therefore, to map crime in the BUE, impacting parental perception of safety; factors such as: violent crimes and property crimes were considered in this report. Violent crimes are derived from parent’s anxieties towards the conception of Stranger Danger. This refers to the notion of ‘risk-victimization paradox’ which outlines that parents are overly anxious towards their children’s safety and therefore can exaggerate the notion of crimes such as abduction, sexual assault, gang activity and murder (Carver et al., 2008). Literature suggests that parents are more afraid of what will happen if their children are to be approached by a stranger (Carver et al., 2008; Gomez, 2004). Perpetrators that may come under the category of stranger danger are adults, teenagers, older children (Carver, 2008). Although these incidents are rare, this is one of the biggest fear that manifests parent’s anxiety towards their child’s safety. Additionally, property crime is derived from parent’s anxieties toward neighborhood aesthetics such as graffiti, broken windows and abandoned buildings (Hager et al., 2013). Graffiti and broken windows degrade the aesthetic appeal of the BUE and relating it to the presence of criminal activity. Also, abandoned buildings encourage unsolicited habitation of unstable and homeless individuals, increasing parent’s anxieties towards safety surrounding such sites (Hager et al., 2013). All of these factors contribute to the overall neighbourhood safety concern of parents; to some degree depending on where they live, their socio- economic level and their ethnicity (Gomez, 2004). An increase or evidence of any form of crime will cause difficulties in lowering parent’s concern of their child’s safety. Weir, 2008 found that inner city children engage in less outdoor activity than children who reside in the suburbs. This could be the case

10
because there may be a disparity in access to safe environments fit for playability and outdoor activity for children (Weir, 2008).
V. Methods The approach throughout this study was related to measuring perceptions of safety from a
parent’s stand point, which varies and is never fixed; hence our report and the approach used to map factors related to the BUE is prejudiced. Therefore, factors taken out from the literature, for the purposes of mapping assumes parental perception of safety is fixed.
The methods used in this report allow for a critical analysis on the dissemination areas of
Surrey. Each dissemination area, examined multiple variables related to parents’ perception of safety in the BUE. These included the recreational environment of each town, its transport environment in relation to child mobility, and crime rate. The software used to provide a final map output was ESRI ArcMap. The goal of the methodology is to provide a final map showing the suitability of each of the 6 dissemination areas, with respect to its transport environment, recreation environment, and crime statistics. With each suitability map, can we then create a final output map of Parent’s perception of safety related to the BUE, allowing for further analysis on the overall topic of Playability in the Metro Vancouver region.
The following sections provide more detail about each variable chosen and the preprocessing
techniques done, as well as its weighing methods, in order to achieve the final output. 5.1 Data Collection For this study, the collection of data in relation to the BUE, is necessary to create an accurate
map for analysis. The City of Surrey contains enough data to cover all factors identified in this study. Table 1 lists all the data used and its sources.
Table 1. List of data and its sources, which were required to do a GIS Analysis on the City of Surrey in relation to Parent’s perception of safety to the BUE.

11
5.2 Study Population The study population for this report are children ages 10-14, late elementary to early high
school students. The data retrieved for population was from the 2011 Census. The original file contained all ages of the population. Irrelevant age populations were removed to focus the study on the 10-14 age group. The measure of child population density for each dissemination area was measured through dot density where a smaller dot represented an area of 0-100 children, and the largest dot measured at 200-300 students within that area (Figure 3). The population data set was overlayed on top of the City of Surrey boundary.
Figure 3. Child Population Density in Surrey. The smaller dot represents a buffer area of approximately 0-100 children, while the larger dot represents approximately 200-300 children in the area.

12
5.3 Recreation Environment The recreation Environment measures the overall playability within a neighbourhood. As
mentioned earlier, the recreation environment is a source for active play in children. Parents perceive a distance of approximately 1.6 km, safe for their 10-12-year-old child to walk, where ½ km takes approximately 10 min to walk (Timperio et al., 2004). All files were retrieved from the City of Surrey website and were converted to shapefiles. In order to measure the recreation environment per dissemination area, the amount of parks, playgrounds, recreation centers, and schools was collected and ranked in relation to other dissemination areas based off quantity. The ranking was then added to create a weight system for the overall recreation environment, using the weighted scoring method, which would be discussed in further detail later (Table 2). The recreational environment is assessed as a means of a safe play area for children, without parents having to worry (Weir et al., 2006). A neighborhood with easy access to these elements, as well as many of these areas, is perceived as safer for children to be playing outdoors. Seen in Figure 5, is suitability of each dissemination
Table 2. Weighted Scoring Method for the Recreational Environment. Each dissemination area was ranked between 1 and 2 depending on the availability of these spaces within each dissemination area. The rankings were added to create a final weight
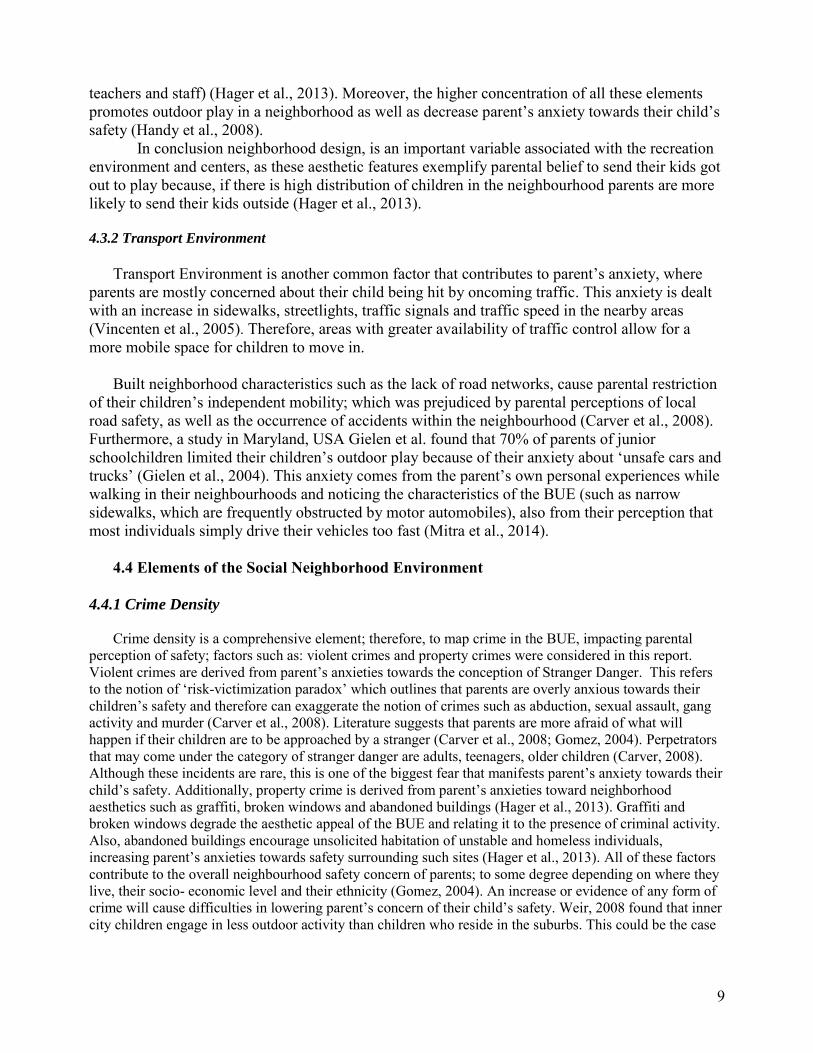
5.4 Transport Environment Creating a mobile space in a neighborhood allows for safe access and movement of children
across space. The elements associated with the Transport Environment, in relation to the BUE, are sidewalks, streetlights, traffic lights, and traffic speed controls. All variables were chosen because each of these factors aid in reducing the speed of drivers and allowing for safer roads for driving. Ultimately, with greater controls on traffic safety, an environment is perceived as more safe (Carver et al., 2008). For the traffic speed, the data under speed bumps and four way stops, were chosen to display in the shapefile attribute table, as these are generally associated with reducing speed. For streetlights, sidewalks, and traffic signals, the more there was in a given area, it is presumed safer. In order to create a transport environment output, these factors were also weighed, via weighted scoring method, to determine its importance to the overall transport environment (Table 3).
Recreation Environment
Dissemination Area Parks Recreation Facilities Playgrounds Schools Row Total Weight
Guildford 1 1 1 1 4 1
Whalley 1 2 1 1 5 1.25
Cloverdale 2 2 2 1 7 1.75
Newton 2 2 2 2 8 2
Fleetwood 1 1 1 1 4 1
South Surrey 2 2 2 1 7 1.75
13
Table 3. Weighted Scoring Method for the Transport Environment. Each dissemination area was ranked between 1 and 2 depending on the availability of these features within each dissemination area. The rankings were added by row to create a final weight.
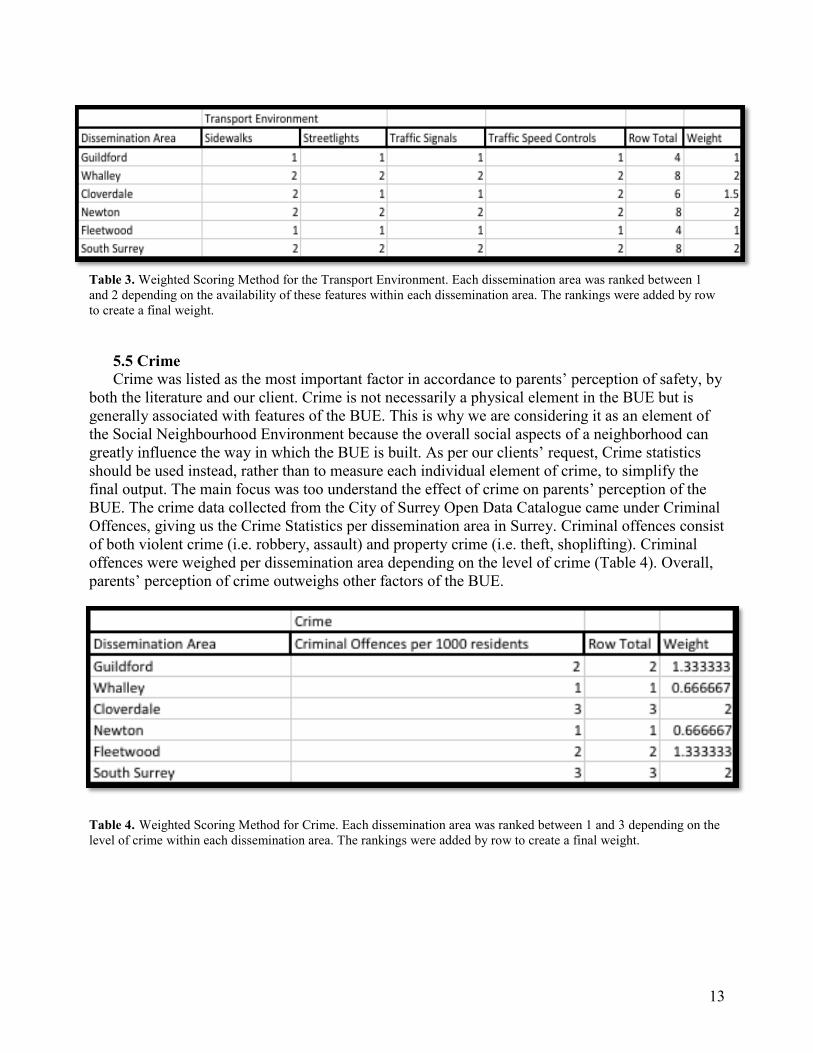
5.5 Crime Crime was listed as the most important factor in accordance to parents’ perception of safety, by
both the literature and our client. Crime is not necessarily a physical element in the BUE but is generally associated with features of the BUE. This is why we are considering it as an element of the Social Neighbourhood Environment because the overall social aspects of a neighborhood can greatly influence the way in which the BUE is built. As per our clients’ request, Crime statistics should be used instead, rather than to measure each individual element of crime, to simplify the final output. The main focus was too understand the effect of crime on parents’ perception of the BUE. The crime data collected from the City of Surrey Open Data Catalogue came under Criminal Offences, giving us the Crime Statistics per dissemination area in Surrey. Criminal offences consist of both violent crime (i.e. robbery, assault) and property crime (i.e. theft, shoplifting). Criminal offences were weighed per dissemination area depending on the level of crime (Table 4). Overall, parents’ perception of crime outweighs other factors of the BUE.
Table 4. Weighted Scoring Method for Crime. Each dissemination area was ranked between 1 and 3 depending on the level of crime within each dissemination area. The rankings were added by row to create a final weight.

14
5.6 Weighted Scoring Method To achieve the final map output, the weighted scoring method was used to rate the factors
related to parents’ perception of safety to the BUE, on a given scale. Based off a google definition, the Weighted Scoring Method is a method of scoring options or solutions against a prioritize requirements list to determine which option best fits the selection criteria, it is a technique for putting a semblance of objectivity into a subjective process. It was decided that crime outweighed the recreational, and transport environment, while the recreational and transport environment were equally weighted as neither deemed more important than the other, as per literature and our client. The 3 main elements of the BUE (blue variable Figure 2), were given a ranking between 1 to 3, 1 being the least important and 3 being the most important. Crime was ranked as a 3 whereas transport and recreational environment were both ranked equally as 2. For each element, the variable within (orange variable Figure 2), were ranked on the scale given for the overall influence in the BUE, listed earlier (Table 5).
Table 5. Listed are the results for each element influencing the BUE, that underwent the Weighted scoring Method. The row total of these weights achieves the level of suitability of each dissemination area, in terms of Playability and safety.
For the Crime element, areas of higher crime rate, were given a low ranking because the area
becomes less suitable in terms of playability and safety. The final weights for each of the 3 main elements per dissemination area, were then added to determine the suitability of different regions in Surrey in accordance with safety and playability, using the formula in Figure 4. Because this process was done using excel, each factor was separated into its own excel file and then joined with a shape file on ESRI Arcmap to perform classification.
Row total x 2= Weight Maximum Row total
Figure 4. The formula used to determine the weight for each factor affecting the elements of the BUE.

15
VI. Results Undergoing weighting and classification, the results for the suitability of each town within Surrey, is as follows:
Figure 5. The level of suitability per dissemination area, in terms of the Recreational Environment.
Figure 6. The level of suitability, in terms of the Transport Environment.

16
Figure 7. The level of suitability, in terms of Crime in Surrey.
Figure 8. The overall results when transport environment, recreational environment, and crime were combined. The level of suitability in terms of Playability in Surrey with regards to safety.

17
Figure 9. The level of Suitability in terms of Playability in Surrey with regards to safety. The child population layer was added to show the spread and density.

18
VII. Discussion Parents’ overall perception of safety comes from many factors. As seen in our results, the
transport environment, recreational environment, and crime in a neighbourhood can greatly affect the results of playability in terms of safety, in a given neighbourhood. In understanding, these results, can we begin to allocate future resources intended to keep the area both playable and safe.
Under the recreational environment map (Figure 5), the town of Newton received the
highest level of suitability, in terms of having greater access to parks, playgrounds, recreation centers, and schools, while Guildford and Fleetwood have the least accessible recreational environment for children. Looking at the spread of the population, it makes sense as to why Newton would have a higher amount of open play space available. Newton, of all dissemination areas, contains the highest amount of the children population with 18,325 people of the population are between the ages of 10-14 (Statistics Canada, 2011).
The transport environment contains mixed results. It is understandable that Whalley has a
lower transport environment because it is primarily a city center district, it is the downtown core of Surrey, and is a fast paced environment. The high presence of elements that aid in traffic safety in Newton, is again understandable because of the high population of children within that neighbourhood. Traffic safety is a great concern to parents’ perception on the BUE, therefore by allocating the necessary resources to control traffic, it will increase safety, possibly altering the parents’ perception of their neighbourhood environment.
Crime is a large issue in the City of Surrey. According to the Surrey RCMP statistics report
(2015), crime is on the rise in particular in the Whalley and Newton neighbourhoods. Our results for suitability in terms of crime, very much coincide with the statistics report of the Surrey RCMP. Parents’ perceive crime as the largest barrier that prevents children from playing outside freely. Although these neighbourhoods may have a good recreational or transport environment, crime outweighs these factors in any neighbourhood.
Our final results display that Guildford, Fleetwood and Whalley are least suitable in terms
of playability and safety. Although, crime was supposed to outweigh transport and recreational environment, both were still major factors in contributing a safe and mobile play space for children.
To conclude, Weir et al., (2006) stated that disadvantaged minority families have lower levels
of physical activity and higher rates of obesity. This is a result of restricted access to safe play areas and environmental conditions such as traffic safety (Weir et al., 2006). Focusing in on the final map (Figure 8), the areas of low to moderate playability in terms of parents’ perception n safety, are primarily in minority neighbourhoods (Statistics Canada, 2011). Cloverdale and South Surrey’s population mainly consists of non-minority groups (Statistics Canada, 2011). Therefore, Weir et al., (2006), found in their study, high levels of concern about neighbourhood safety, were associated with inner city communities with high minority populations, while there were low levels of concern in suburban, non-minority neighbourhoods.

19
VIII. Limitations In this study, there are many limitations we’ve encountered. Firstly, time constraints were a
concern. If given enough time, it would have been great to perform interviews on parents within these neighbourhoods, with children of the studied age range. This would have provided greater insight into the factors and elements we’ve listed and more background aside from the Literature review. Additionally, after conducting these interview, if given the time, performing audits on the neighbourhood play spaces and traffic safety can allow for us to determine the quality of different play spaces per neighbourhood, and provide a clearer analysis.
Secondly, there were inconsistencies in the acquisition of data as well as the literature.
Most literature that we have encountered thus far has been based on other countries such as the United States and United Kingdom. Although neighbourhoods can look the same worldwide, the function of a neighbourhood in relation to its population can alter. Furthermore, the data collected were taken at different times. For example, the closest census data we could retrieve was from 2011, which is currently 5 years outdated. Even though, most of the datasets retrieved were from 2015, inconsistencies in the datasets can create inaccuracies in the analysis.
Moreover, the methodology chosen was very subjective. If given more time, the Multi
Criteria Evaluation method would’ve been the preferred choice to showcase the suitability of different regions across Surrey, rather than the Suitability of each dissemination area. The chosen method was the backup choice since due to time constraints and data availability, this was the best way to go. Because this method is very subjective, results may vary depending on the person choosing the weighting. In addition, because the method was very quantitative, there may have been errors in the calculation and counting process of the Weighted Scoring Method. Overall, there may have also been a biased towards the size of the dissemination area. Clearly, smaller towns would have less resources available, therefore receiving a lower ranking in the overall weights.
A note to keep in mind throughout this study is measuring perceptions of safety from a
parental stand point varies and is never fixed. Each person views safety differently especially different parents. The study will assume parental perceptions of safety is fixed. In addition, as time goes on, perceptions change as elements of the BUE will continue to change.
IX. Conclusion Research by Vincenten et al., 2005 highlight the importance of understanding parent’s
perception of child safety since, parents are primary caregivers of children, it is necessary to learn more about their perceptions, attitudes and behaviours towards child safety. As children sense their parents’ concerns, and this promotes their own feelings of anxiety; not surprisingly, this negatively affects children’s willingness to get out and play. The research of this report does not offer a solution; it rather looks into the factors of the BUE which are affecting parental perception on safety. Even though, kids are incapable and insufficient, they need a chance to explore life naturally; they need some unsupervised time to figure out things for themselves. As a result, parents must get past this anxiety and focus on the children’s need.

20
X. References
Carver, A., Timperio, A., & Crawford, D. (2008). Playing it safe: The influence of
neighbourhood safety on children’s physical activity: A review. Health & Place, 14(2).
217-227. http://dx.doi.org/10.1016/j.healthplace.2007.06.004.
Crime Statistics (2015). Royal Canadian Mounted Police. Retrieved from:
http://surrey.rcmp-grc.gc.ca/ViewPage.action?siteNodeId=103
Gomez, J.E., Johnson, B.A., Selva, M. & Sallis, J.F. (2004). Violent crime and outdoor
physical activity among inner-city youth. Preventive Medicine, 39(5), 876-881.
http://dx.doi.org/10.1016/j.ypmed.2004.03.019
Gielen, A. C., DeFrancesco, S., Bishai, D., Mahoney, P., Ho, S., & Guyer, B. (2004). Child
pedestrians: the role of parental beliefs and practices in promoting safe walking in urban
neighborhoods. Journal of Urban Health, 81(4), 545-555.
Hager, E. R., Witherspoon, D. O., Gormley, C., Latta, L. W., Pepper, M. R., & Black, M. M.
(2013). The perceived and built environment surrounding urban schools and physical
activity among adolescent girls. Annals of Behavioral Medicine, 45(1), 68-75.
Handy, S., Cao, O., Mokhtarian, P. (2008). Neighborhood Design and Children’s Outdoor Play:
Evidence from Northern California. Children, Youth and Environments, 18(2), 160-179.
Retrieved from: http://www.jstor.org/stable/10.7721/chilyoutenvi.18.2.0160
Mitra, R., Faulkner, G. EJ., Buliung, R.N. & Stone, M.R. (2014). Do parental perceptions of
the neighbourhood environment influence children’s independent mobility? Evidence from
Toronto, Canada. Urban Studies, 51(16), 3401-3419.
doi: 10.1177/0042098013519140.
Santo Paula, M., Pizarro, A. N., Mota, J. & Marques, E.A. (2013). Parental physical
activity, safety perceptions and children’s independent mobility. BMC Public Health,
13(584), DOI: 10.1186/1471-2458-13-584
Roof, K., & Oleru, N. (2008). Public Health: Seattle and King County's Push for the Built
Environment. Journal of Environmental Health, 71(1), 24-27.
Statistics Canada. (2011) "Population and Dwelling Counts, for Canada, Provinces and Territories,
and Census Divisions, 2001 and 1996 Censuses – 100% Data (British Columbia)".
21
Surrey RCMP. (2015). 2015 Quarterly Crime Stat Reports. Retrieved from the RCMP Canada
website: http://surrey.rcmp-
grc.gc.ca/ViewPage.action?siteNodeId=2105&languageId=1&contentId=-1
Timperio, A., Crawford, D., Telford, A., & Salmon, J. (2004). Perceptions about the local
neighborhood and walking and cycling among children.Preventive medicine, 38(1), 39-47.
Tremblay, M. S., Gray, C., Babcock, S., Barnes, J., Bradstreet, C. C., Carr, D., ... & Herrington, S.
(2015). Position statement on active outdoor play. International journal of environmental
research and public health, 12(6), 6475-6505.Brussoni, M. (2015). Position Statement on
Active Outdoor Play. International Journal of Environmental Research and Public Health,
12(6), 6475–6505. http://doi.org/10.3390/ijerph120606475
Vincenten, J. A., Sector, M. J., Rogmans, W., & Bouter, L. (2006). Parents' perceptions,
attitudes and behaviours towards child safety: a study in 14 European countries.
International Journal of Injury Control and Safety Promotion, 12(3), 183-189.
DOI:10.1080/17457300500136557
Walkability Index (2013). Health & Community Design Lab: UBC, School of Population
and Public Health; Faculty of Medicine.
Retrieved from: http://health-design.spph.ubc.ca/tools/walkability-index/
Weir, L. A., Etelson, D., & Brand, D. A. (2006). Parents' perceptions of neighborhood
safety and children's physical activity. Preventive medicine, 43(3), 212-217.

22
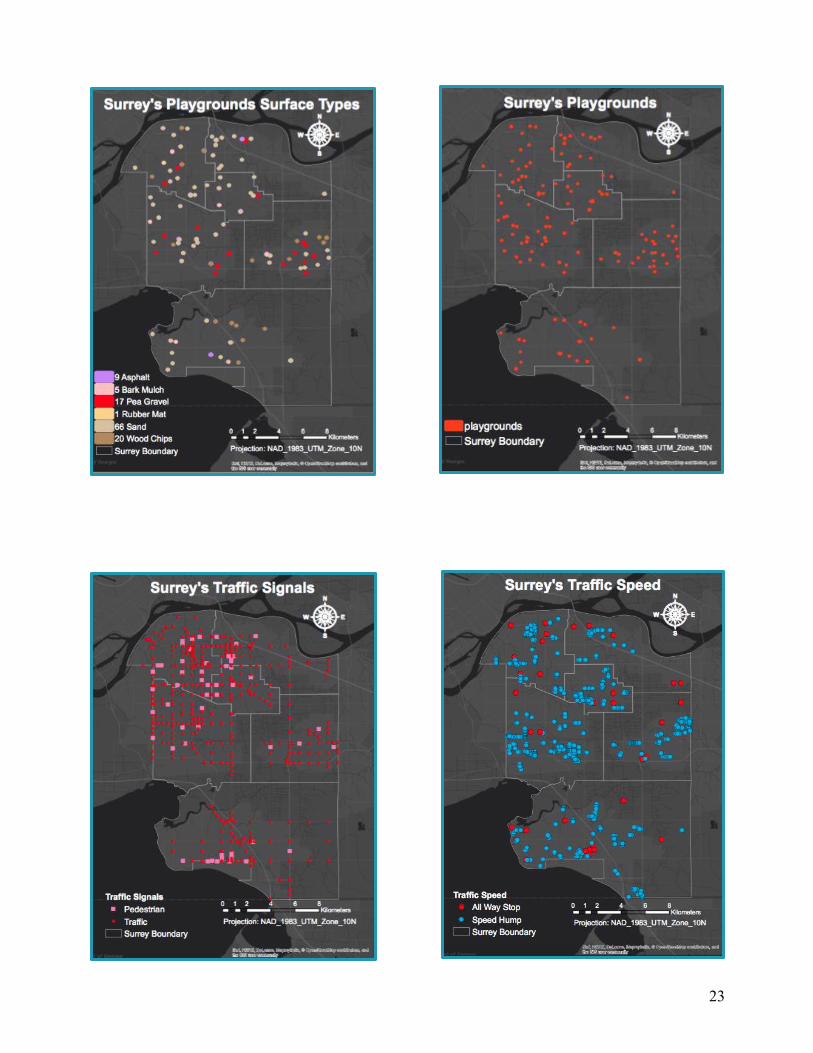
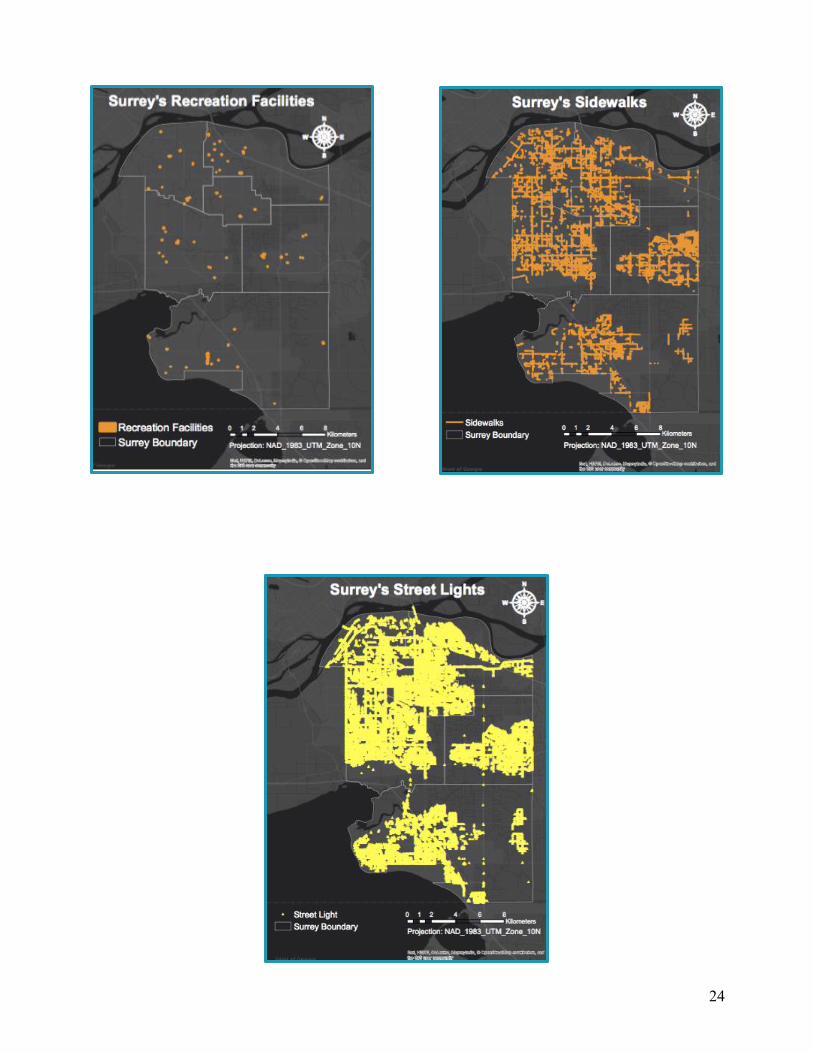
XI. Appendix
This section includes maps that were created but not used for this study.
23
24