mapwindow vs. arcgis: towards featuring · pdf fileinteroperability between geographic...
TRANSCRIPT

Dyna, year 79, Nro. 173, pp. 25-33. Medellin, june, 2012. ISSN 0012-7353
MAPWINDOW VS. ARCGIS: TOWARDS FEATURING THE INTEROPERABILITY BETWEEN GEOGRAPHIC INFORMATION
SYSTEMS
MAPWINDOW VS. ARCGIS: HACIA LA CARACTERIZACIÓN DE LA INTEROPERABILIDAD ENTRE SISTEMAS DE INFORMACIÓN
GEOGRÁFICA
CARLOS MARIO ZAPATAPh.D, Facultad de Minas, Universidad Nacional de Colombia, Sede Medellín, [email protected]
FRANCISCO MAURICIO TOROPh.D, Facultad de Minas, Universidad Nacional de Colombia, Sede Medellín, [email protected]
MARÍA ISABEL MARÍNIng, Escuela de Sistemas, Facultad de Minas, Universidad Nacional de Colombia, Sede Medellín, [email protected]
Recibido para revisar April 13th, 2011, aceptado February 06th, 2012, versión final March 26th, 2012
ABSTRACT: Heterogeneous information systems can make data and process operations by means of a functionality called interoperability. Geographic information system (GIS) interoperability is based on two factors: the increasing use of such systems in companies and the need to supplement their information—when generated in isolation from heterogeneous GISs, leading to coupling troubles. Major initiatives in GIS interoperability solve arising problems by defining sets of standards and by specifying development interfaces. Such initiatives allow interoperability between pairs of homogeneous GISs, which hold the same standards or development interfaces, avoiding GIS heterogeneity. The above reasons lead us to deal, in this paper, with MapWindow-ArcGIS interoperability. We use an example in order to determine the remarking features of such interoperability process.
KEYWORDS: interoperability, geographic information systems, MapWindow, ArcGIS.
RESUMEN: La funcionalidad que permite la realización de operaciones con datos y procesos entre sistemas heterogéneos se denomina interoperabilidad. La interoperabilidad entre sistemas de información geográfica (SIG) se origina en dos factores: el creciente uso de estos sistemas en las empresas y la necesidad de complementar su información, cuando ésta se origina en SIGs heterogéneos, cuyo desarrollo aislado representa un problema de acoplamiento. Las principales iniciativas que abordan el tema presentan soluciones por medio de la definición de estándares y la especificación de interfaces de desarrollo. Estos esfuerzos posibilitan la interoperabilidad entre SIGs que implementan los mismos estándares o interfaces de desarrollo, dejando de lado aquellos que no lo hacen. Por lo anterior, en el presente artículo se abordan los SIG MapWindow y ArcGIS mediante un ejemplo que conduce a la determinación de las características relevantes de interoperabilidad entre ellos.
PALABRAS CLAVE: interoperabilidad, sistemas de información geográfica, MapWindow, ArcGIS.
1. INTRODUCTION
Giannecchini et al. [1] define interoperability as the ability to communicate, execute programs, or transfer data among various functional units. When the interoperability takes place in a suitable way, the user requires little or no knowledge of the unique features of these units. Interoperability is gaining importance in the software development lifecycle, particularly when one has a large amount of data to share.
Geographic information systems (GISs) are becoming critical decision-making platforms in many companies, agencies, and organizations, especially those focused on earth, air, or ocean science [2]. Geographic information system usage requires the integration of information from several data sources—which in many cases can be found on several platforms, locations, and companies. In order to integrate such information, we need to improve GIS interoperability. Such integration faces one main problem: Every system is independently

Zapata et al 26
developed, leading to interoperability challenges at different levels. Thus, information management and analysis becomes difficult, since no coupling occurs between the input and output of the processes [3].
The usual initiatives for improving GIS interoperability are specification standards and development interface definition. The Open Geospatial Consortium (OGC) [4]—an international consortium of companies, government agencies, and universities—developed one of the most common open standards for public interfaces, searching for GIS interoperability improvement in the World Wide Web. On the other hand, the open-source project for a network data access protocol (OPeNDAP) also defines the OPeNDAP protocol for addressing GIS interoperability [5].
However, one problem arises from such initiatives: Interoperability is improved only when the GISs share the same standard, but nothing happens when the GISs have another or no standard [3]. The aforementioned reasons lead us to present in this paper the MapWindow-to-ArcGIS interoperability by using a step-by-step example for determining the relevant MapWindow-to-ArcGIS interoperability features. We also define an overlay operation between vector and raster models. Finally, we derive the necessary steps for enhancing the interoperability, regardless the types of data required and used in this specific operation.
This paper is organized as follows: In Section 2 we present the theoretical framework for giving the reader the concept of GIS interoperability; in Section 3 we present the current state of the art; in Section 4 we propose the MapWindow-to-ArcGIS interoperability example and its relevant features; finally, in Section 5 we summarize conclusions and present suggestions for future work.
2. THEORETICAL FRAMEWORK
Budiarto et al. [6] define interoperability as the ability of systems to share information and processes. Several research groups and consortia, like the Object Management Group (OMG) and the World Wide Web Consortium (W3C) are working on interoperability. The OMG is one of the organizations that support and promote the interoperability pledge initiative [7], trying to foster the standards-based development of Web and desktop
software applications. The W3C proposes standards, especially for Web development, such as Web-Services Description Language (WSDL) 2.0, the semantic annotations, and the XML schema for WSDL (SAWSDL), designed to describe semantic Web services [8].
Now, moving forward to a more specific concept, interoperability between heterogeneous and distributed GIS is defined as a technology that makes different GIS functions work together in harmony [9]. In this context, GIS is a software application designed to store, process, analyze, and display geographically-referenced information. A GIS is aimed to solve complex planning and management problems by means of the analysis of spatial information. Geographic information system technology has many uses in scientific research, resource management, archeology, environmental impact assessment, urban planning, and map building, among others.
Geographic information systems maps are composed of thematic, independently-stored layers of information (see Fig. 1) [10]. The layers are used for building complete thematic maps (see, for example, Yepes et al. [11]).
Figure 1. Data layers in a GIS [12]
Two basic data models are common to any GIS [13]: raster and vector. In the raster data model, geographical features are represented by using discrete cells, usually square-shaped and arranged in a rectangular grid. Each cell in the matrix is linked to a value. Additionally, the file itself should contain attributes associated with the data format, such as the number of columns and rows, the values that indicate the place where there is no data (called missing values), etc. On the other hand, in the vector data model information (e.g., discrete events, where there is a definite limit) is represented by means of geometric figures (e.g., points, lines, and polygons).

Dyna 173, 2012 27
The information linked to any concept is stored by rows in a table, usually called an attribute table [12].
3. STATE-OF-THE-ART REVIEW
Efforts to allow GIS interoperability are generally focused on the need to establish a definite and agreed structure for sharing information. OGC, ISO, and OPeNDAP are examples of standards aiming towards this goal. In the following paragraphs, we review the state of the art in GIS interoperability.
The OGC [4] is a leading international organization in charge of developing standards for geospatial data-based services. Geospatial data are produced mainly in the earth sciences: geophysics, geology, geography, meteorology, and paleontology. Percivall [14] presents the OGC interoperability progress by specifying the WMSs (web map services), WFS (web feature service), and WCS (web coverage service), designed to develop complete maps, vector, and raster objects, respectively.
Giannecchini et al. [1] do a review of the OGC and ISO standards and present a reference model with different elements from those defined by Percivall [14]. Some such elements are metadata management, the support for style definition, and the model for image rendering processing (see Fig. 2).
Figure 2. OGC reference model [1]
Additionally, they introduce a layered architecture for describing the information that merges from heterogeneous data sources and a catalogue service
that facilitates the discovery of new information on the Web (see Fig. 3).
Figure 3. Layers of geospatial services [1]
On the other hand, the organization OPeNDAP has developed, implemented, and promoted the OPeNDAP protocol, which defines the architecture for geospatial data transport. Government agencies such as NASA and NOAA use OPeNDAP to supply climate data. This standard is mainly used in ocean and atmospheric sciences [15].
The solution to interoperability challenges by using standards, as proposed by Giannecchini et al. [1], Percivall [14], and Min et al. [15], is only suitable for system developed by following public guidelines [5]. For the purpose of enabling interoperability between different standards implemented for GIS, McDonald et al. [5] and Hu et al. [16] propose a mechanism for integrating the OGC and the OPeNDAP protocols. Such a mechanism comprises a gateway address for each service request; i.e., a gateway to allow interoperability between OPeNDAP clients and OGC servers, and vice-versa. This approach provides a solution to the problem of interoperability between systems implemented under different protocols, but it is still a limited solution, because other standards and systems are left out.
4. MAPWINDOW VS. ARCGIS
A state-of-the-art review reveals the need to define an interoperability mechanism, regardless of the guidelines and features imposed by any standard. With this idea in mind, in this paper we present an example of the interoperability between MapWindow GIS 4.6

Zapata et al 28
and ArcGIS 9.2, and we show the relevant features of this process. The step-by-step example is performing the task: “clip a raster layer model based on a given polygon in a vector layer.” The raster layer is stored in the MapWindow GIS and the vector layer in ArcGIS. The steps to carry out the interoperability process are the following:
I. Determine the current interoperability status. The purpose of this step is to identify the general features of each system and provide an initial idea of the effort needed to connect the two systems. Table 1 exhibits the current interoperability status for the step-by-step example.
II. Identify the data sources that supports each GIS involved in the interoperability process. With this
purpose in mind, we previously define the different options that may occur (see Table 2). The PostGIS and map server show a well-defined structure and access to data [17] because they meet the standards set by the OGC. The disk file formats depend on each GIS, among which some are known as the ESRI family [18] accepted by several GISs. The dedicated databases are those that are created in each GIS for specific projects and whose structure is not public, adding an additional level of complexity in the study of each GIS. Elements analyzed in this step are summarized in Table 2.
III. Identify acceptable disk file formats (if supported). In this Section, in addition to different supported formats, the user can identify those that match both GISs (see Table 3)
Table 1. Current interoperability status between MapWindows and ArcGIS
GIS Application type
Development framework Standards implemented API Operating
systemMapWindow desktop Framework .NET OGC partially yes WindowsArcGIS desktop C++ ESRI-OGC partially yes Windows/Unix
Table 2. Supported data sourcesGIS PostGIS Map Server Dedicated database Files on sisk
MapWindow yes no yes yesArcGIS yes yes yes yes
Table 3. File supported on diskArcGIS MapWindow
Raster Vector Raster Vectorasc, img, ovr, lgg, bag, bil, bip, bsq, trl, gis, grd,
hdf, png, tif, bmp, dat, gif, jpg, grid shp, dbf, shx bgd, bil, asc, arc, tiff, ddf shp, dbf
IV. Determine the information structure for each data source. In this step, we aim to understand the structure of each data source (including files on disk) and the way to obtain the necessary elements for the rest of the process. Table 4 exhibits the SQLite data source in MapWindow. The information of PostGIS vector layers in ArcGIS—knowing that the raster layers are not supported—is the following:
Layer name: in the table geometry_columns, each item in the column f_table_name corresponds to a layer stored in the database. Each layer is stored as a table. The table geometry_columns allows the user to identify tables and table-layers.
Coordinate System: The field srid—belonging to the table geometry_columns—contains the id of the
coordinate system. The table spatial_ref_sys contains the coordinate systems and its id.
Metadata: Not supported
Attribute table fields: Given a layer name obtained from the field f_table_name—belonging to the table geometry_columns—, the attribute table fields are all the information stored in the table corresponding to the layer, except the fields gid and the_geom.
Shape identifier field: gid
Geometry field: the_geom
Storage format of geometry: OGC WKT (well-known text)
Dyna 173, 2012 29
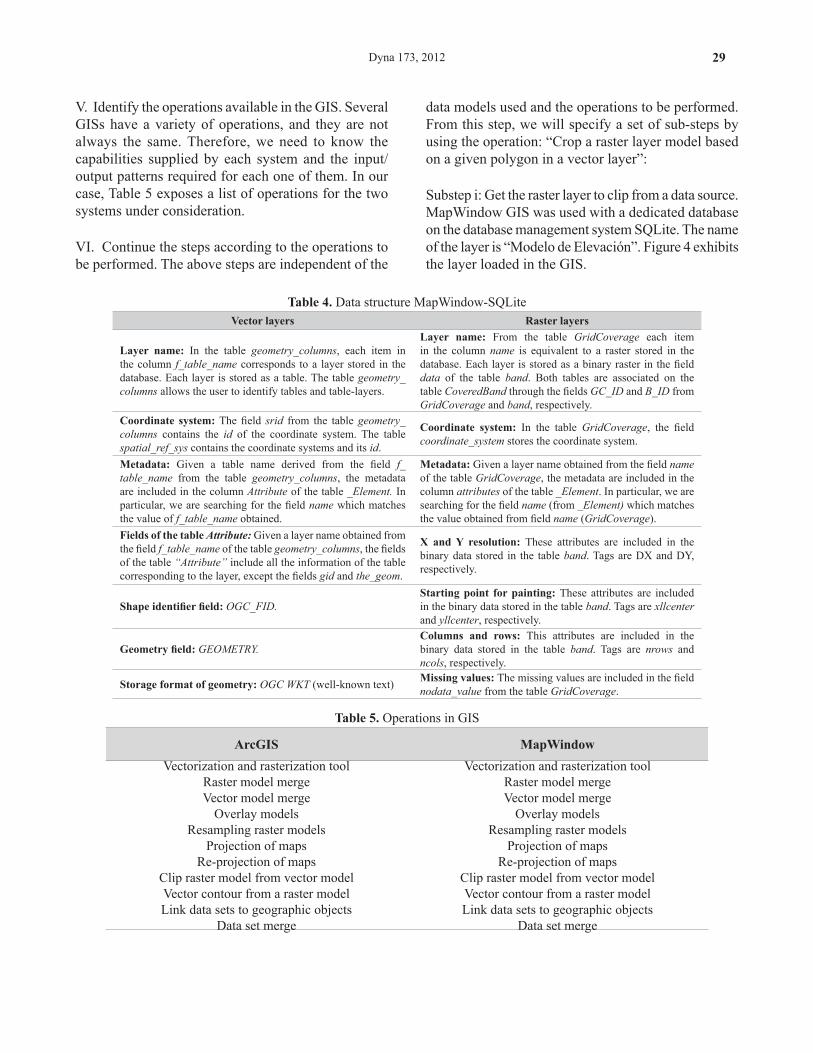
V. Identify the operations available in the GIS. Several GISs have a variety of operations, and they are not always the same. Therefore, we need to know the capabilities supplied by each system and the input/output patterns required for each one of them. In our case, Table 5 exposes a list of operations for the two systems under consideration.
VI. Continue the steps according to the operations to be performed. The above steps are independent of the
data models used and the operations to be performed. From this step, we will specify a set of sub-steps by using the operation: “Crop a raster layer model based on a given polygon in a vector layer”:
Substep i: Get the raster layer to clip from a data source. MapWindow GIS was used with a dedicated database on the database management system SQLite. The name of the layer is “Modelo de Elevación”. Figure 4 exhibits the layer loaded in the GIS.
Table 4. Data structure MapWindow-SQLiteVector layers Raster layers
Layer name: In the table geometry_columns, each item in the column f_table_name corresponds to a layer stored in the database. Each layer is stored as a table. The table geometry_columns allows the user to identify tables and table-layers.
Layer name: From the table GridCoverage each item in the column name is equivalent to a raster stored in the database. Each layer is stored as a binary raster in the field data of the table band. Both tables are associated on the table CoveredBand through the fields GC_ID and B_ID from GridCoverage and band, respectively.
Coordinate system: The field srid from the table geometry_columns contains the id of the coordinate system. The table spatial_ref_sys contains the coordinate systems and its id.
Coordinate system: In the table GridCoverage, the field coordinate_system stores the coordinate system.
Metadata: Given a table name derived from the field f_table_name from the table geometry_columns, the metadata are included in the column Attribute of the table _Element. In particular, we are searching for the field name which matches the value of f_table_name obtained.
Metadata: Given a layer name obtained from the field name of the table GridCoverage, the metadata are included in the column attributes of the table _Element. In particular, we are searching for the field name (from _Element) which matches the value obtained from field name (GridCoverage).
Fields of the table Attribute: Given a layer name obtained from the field f_table_name of the table geometry_columns, the fields of the table “Attribute” include all the information of the table corresponding to the layer, except the fields gid and the_geom.
X and Y resolution: These attributes are included in the binary data stored in the table band. Tags are DX and DY, respectively.
Shape identifier field: OGC_FID.Starting point for painting: These attributes are included in the binary data stored in the table band. Tags are xllcenter and yllcenter, respectively.
Geometry field: GEOMETRY.Columns and rows: This attributes are included in the binary data stored in the table band. Tags are nrows and ncols, respectively.
Storage format of geometry: OGC WKT (well-known text) Missing values: The missing values are included in the field nodata_value from the table GridCoverage.
Table 5. Operations in GIS
ArcGIS MapWindowVectorization and rasterization tool
Raster model merge Vector model merge
Overlay models Resampling raster models
Projection of maps Re-projection of maps
Clip raster model from vector model Vector contour from a raster model Link data sets to geographic objects
Data set merge
Vectorization and rasterization tool Raster model merge Vector model merge
Overlay models Resampling raster models
Projection of maps Re-projection of maps
Clip raster model from vector model Vector contour from a raster model Link data sets to geographic objects
Data set merge

Zapata et al 30
Figure 4. Digital elevation model (DEM 90) in MapWindows
Substep ii: Get the vector layer which contains the reference polygon clipping from a data source. As an illustration, we obtained the vector layer “Corregimientos Rio Claro” from the PostGIS data source on ArcGIS. The GIS data can be visualized in Fig. 5.
Figure 5. “Corregimientos Rio Claro” in ArcGIS
Substep iii: Identify the coordinate system for each layer. We use the tools provided by each SIG to display the coordinate system of each layer. We identified WGS84 and Undefined to Digital elevation model (DEM 90) and “Corregimientos Rio Claro”, respectively (see Figs. 6 and 7).
Substep iv: If any layer has coordinate system undefined, assign it. The layer “Corregimientos Rio Claro” have coordinate system undefined, and we need additional information about it in order to georeference the map. Beforehand, it is known that it was under plane
coordinates “Colombia Bogota Zone”. The coordinates are assigned by one of the tools provided by ArcGIS, as shown in Fig. 8.
Figure 6. Coordinate System display in MapWindow
Figure 7. Coordinate system display in ArcGIS
Substep v: Verify whether both layers are in the same projection. Both layers have different projections: WGS84 and Colombia Bogota Zone.
Substep vi: If the two layers are not in the same projection, re-project one of them into the other system. In this particular case, any projection can be used as a reference. We decided to re-project the digital elevation model from WGS884 to the Colombia Bogota Zone by using the available tools in MapWindow GIS. Figure 9 shows the reprojected layer.

Dyna 173, 2012 31
Figure 8. Corregimientos Rio Claro layer Georeferencing
Figure 9. Digital Elevation Model (DEM 90) reprojection in MapWindow
Substep vii: Select the polygon reference to make the clip on the raster. On ArcGIS, we select polygon 5, as shown in Fig. 10.
Substep viii: Get the raster map region that matches the reference polygon. In this case, this step is performed with the tool MapWindow GIS Clip Grid With Polygon, as shown in Fig. 11.
Substep ix: Give the user the ability to store the resulting layer in the desired data source. The resulting raster layer can be visualized in Fig. 12 and it is saved in the SQLite database from MapWindow GIS (see Fig. 13).
Figure 10. Selecting a polygon in ArcGIS
Figure 11. Selecting the raster map region
By implementing the proposed steps, we can share information between the GIS’s MapWindow and ArcGIS, regardless of the development platform, the operating system they run on, the standards and implementing interfaces of supported data sources, and the rest of the features imposed by the manufacturer. This procedure allows for applications to interoperate between the two-level data and provides a basis for GIS interoperability.
Figure 12. Resulting raster layer

Zapata et al 32
Figure 13. Result stored in MapWindows
5. CONCLUSIONS and future work
From the work we presented in this paper, we could discover the relevant features of the interoperability between the GIS’s MapWindow and ArcGIS. We proposed general steps independent from the data models and operations to be performed, and specific steps to be carried out for the operation of the superposition of models: “Crop a raster layer model based on a given polygon in a vector layer.” In addition, we identified the elements that must be obtained from each data source in order to work with models of vector and raster data. These features can be generalized to any pair of GISs, as the steps taken are independent from MapWindow and ArcGIS. Also, they are inherent to the domain of the GIS. This methodology is a step towards progress for characterizing the interoperability process between GISs.
We propose as future work the following:
• Include data series in the interoperability process between GISs, especially time series, given the need for an integrated analysis of spatial and temporal information.
• Extend the aforementioned steps and features to enhance the interoperability between GISs at the semantic level of information and processes.
• Conduct a study of the different phases of software development, trying to incorporate the steps and features of the identified interoperability between GISs.
• Propose a method to develop a middleware GIS based on the different steps and features of the identified interoperability between GISs.
6. ACKNOWLEDGMENTS
The work we presented in this paper was conducted with the support of the project “Study of environmental issues of three EPM reservoirs” of the Escuela de Geociencias y Medio Ambiente, Universidad Nacional de Colombia, Medellín, and supported by Empresas Públicas de Medellín.
REFERENCES
[1] Giannecchini, S., Francesco, S., Nordgren, B., and Desruisseaux, M. Supporting Interoperable Geospatial Data Fusion by adopting OGC and ISO TC 211 standards, Proc. of the 9th Intl. Conf. on Information Fusion, Florence, Italy, pp.1–8, 2006.
[2] Domenico, B., Caron, J., Davis, E., Nativi, S., and Bigagli, L. GALEON: Standards-based Web Services for Interoperability among Earth Sciences Data Systems, proc. IEEE International Conf. on Geoscience and Remote Sensing Symposium, IGARSS 2006, Denver, USA, pp.313–316, 2006.
[3] Lewis, G., Morris, E., Simanta, S., and Wrage, L. Why standards are not enough to guarantee End-to-End Interoperability, proc. 7th Intl. Conf. on Composition-Based Software Systems, ICCBSS 2008, Madrid, Spain, pp.164–173, 2008.
[4] Yumei, S., Xianfang, X., Bin C., Zhou, H., and Yu F. Distributed geospatial data integration based on OGC standards-compliant geospatial data grid services, proc. 18th Intl. Conf. on Geoinformatics, pp.1–4, 2010.
[5] McDonald, K., Enloe, Y., Di, L., and Holloway, D. A Gateway to Support Interoperability of OPeNDAP and OGC Protocols, proc. IEEE Intl. Conf. on Geoscience and Remote Sensing Symposium, IGARSS 2006, Denver, USA, pp. 301–304, 2006.
[6] Budiarto, R., Isawasan, P. and Aziz, M.A. Transformation of Spatial Data Format for Interoperability between GIS Applications, Proc. 6th Intl. Conf. on Computer Graphics, Imaging and Visualization, 2009, CGIV 2009, Tianjin, China, pp.536–539, 2009.

Dyna 173, 2012 33
[7] Narayan, D., Riesco, D., Montejano, G., Grumelli, A., Maccio, A., and Martellotto, P. Definition of a new kind of UML stereotype based on OMG metamodel, proc. IEEE Intl. Conf. on Computer Systems and Applications, Tunisia, Tunisia, 2003.
[8] Kopecky, J., Vitvar, T., Bournez, C., and Farrell, J. SAWSDL: Semantic Annotations for WSDL and XML Schema. IEEE Internet Computing, 11(6), pp.60–67, 2007.
[9] Sun, Y. and Guoqing, L. Interoperability Research of Heterogeneous GIS Based on Spatial Information Grid, proc. Intl. Conf. on Computer Science and Software Engineering, Wuhan, China, pp.41–44, 2008.
[10] Bolstad, P. GIS Fundamentals: A first text on Geographic Information Systems, Eider Press, White Bear Lake, 2005.
[11] Yepes, D., Gómez, M., Sánchez, L. and Jaramillo, A. Metodología de elaboración de mapas acústicos como herramientas de gestión del ruido urbano—caso Medellín, Dyna, 76(158), pp.29-40, 2009.
[12] De Smith, M. J., Goodchild, M.F., and Longley, P. A. Geospatial analysis: A comprehensive guide to principles, techniques and software tools, Troubador, Leicester, 2007.
[13] Burrough, P.A. and McDonnell, R.A. Principles of geographical information systems, Oxford University Press, Oxford, 1998.
[14] Percivall, G. S. Overview of geographic information standards development, proc. IEEE Intl. Conf. on Geoscience and Remote Sensing Symposium, IGARSS 2000, Honolulu, USA, vol. 5, pp.2096–2098, 2000.
[15] Min, M., McDonald, K., Yang, W., Di, L., Enloe, Y., and Holloway, D. Extending OGC data services for CEOP science community, proc. IEEE Intl. Conf. on Geoscience and Remote Sensing Symposium, IGARSS 2007, Barcelona, Spain, pp.5005–5008, 2007.
[16] Hu, C., Di, L., Yang, W., Wei, Y. and Bai, Y. Interoperability middleware between geoscience and geospatial catalog Protocols, Proc. IEEE Intl. Conf. on Geoscience and Remote Sensing Symposium, 2008, IGARSS 2008, Boston, USA, pp.89–92, 2008.
[17] Aburizaiza, A. O. and Ames, D. P. GIS-Enabled Desktop Software Development Paradigms, Proc. Intl. Conf. on Advanced Geographic Information Systems & Web Services, Cancún, Mexico, pp.75–79, 2009.
[18] Sun, Y., Zhou, P., Yang, Y., Chen, Q., Yu, G., and Xu, X. Establishment of special city GIS based on ArcObjects, proc. IEEE Intl. Conf. on Geoscience and Remote Sensing Symposium, IGARSS 2003, Tolouse, France, pp.3733–3735, 2003.