maqs: a personalized mobile sensing system for indoor air
TRANSCRIPT
MAQS: A Personalized Mobile Sensing System forIndoor Air Quality Monitoring
Yifei Jiang†, Kun Li‡, Lei Tian†, Ricardo Piedrahita∗, Xiang Yun§, Omkar Mansata§,Qin Lv†, Robert P. Dick§, Michael Hannigan∗, Li Shang‡
† Dept. of CS, ‡Dept. of ECEE, ∗Dept. of ME, University of Colorado at Boulder, CO 80309, U.S.A.§ EECS Department, University of Michigan, Ann Arbor, MI 48109, U.S.A.
† ∗ ‡ {yifei.jiang, kun.li, lei.tian, ricardo.piedrahita, qin.lv, hannigan, li.shang}@colorado.edu,§{xiangyun,omkar}@umich.edu, §[email protected]
ABSTRACTMost people spend more than 90% of their time in-doors; indoor air quality (IAQ) influences human health,safety, productivity, and comfort. This paper describesMAQS, a personalized mobile sensing system for IAQmonitoring. In contrast with existing stationary or out-door air quality sensing systems, MAQS users carryportable, indoor location tracking sensors that providepersonalized IAQ information. To improve accuracyand energy efficiency, MAQS incorporates three noveltechniques: (1) an accurate temporal n-gram augmentedBayesian room localization method that requires fewWi-Fi fingerprints; (2) an air exchange rate based IAQsensing method, which measures general IAQ usingonly CO2 sensors; and (3) a zone-based proximity de-tection method for collaborative sensing, which savesenergy and enables data sharing among users. MAQShas been deployed and evaluated via user study. De-tailed evaluation results demonstrate that MAQS sup-ports accurate personalized IAQ monitoring and quan-titative analysis with high energy efficiency.
Author KeywordsAir quality sensing, location based service, smartphone
ACM Classification KeywordsC.3.3 Special-Purpose and Application-Based Systems:Real-Time and Embedded Systems
General TermsAlgorithms, Design, Experimentation, Performance
INTRODUCTIONIn recent years, indoor air quality (IAQ) has drawnconsiderable attention in both the public and scientificdomains, due to the fact that most buildings appear tofall far short of reasonable air quality goals [15]. Statis-tics [28] from the U.S. Environmental Protection Agency
Permission to make digital or hard copies of all or part of this work forpersonal or classroom use is granted without fee provided that copies arenot made or distributed for profit or commercial advantage and that copiesbear this notice and the full citation on the first page. To copy otherwise, orrepublish, to post on servers or to redistribute to lists, requires prior specificpermission and/or a fee.UbiComp’11, September 17–21, 2011, Beijing, China.Copyright 2011 ACM 978-1-4503-0630-0/11/09...$10.00.
(EPA) indicate that, on average, the indoor levels ofpollutants are two to five times higher than outdoorlevels and people in the U.S. spend about 90% of theirtime indoors. Bad indoor air quality influences hu-man health, safety, productivity, and comfort [31, 9].IAQ is important and different people have differentexposure to pollutants. Providing personalized IAQinformation has the potential to increase public aware-ness of the relationship between their behavior and airquality; help people to improve their living environ-ments; and also provide valuable information to build-ing managers, policy makers, health professionals, andscientific researchers.
IAQ monitoring is challenging because indoor air pol-lutants concentration and human motion patterns eachvary spatially and temporally within and across rooms.Existing solutions that require stationary sensors or tar-get mobile outdoor sensing scenarios are inappropri-ate for personalized IAQ monitoring. Stationary sens-ing [13] has several limitations: (a) it can only mea-sure the IAQ experienced by those who happen to benear the sensors, and there can be substantial variationin IAQ even within one room and (b) when locationsor rooms outnumber people, achieving full coveragewith stationary sensors is more expensive than doingso with personalized mobile sensors. Outdoor mobilesensing solutions use GPS localization, which fails in-doors and is therefore inappropriate for IAQ applica-tions. Furthermore, existing air quality sensing solu-tions require multiple types of sensors, each of whichcovers a subset of pollutants. This can be prohibitivelyexpensive for personalized mobile IAQ sensing.
A mobile sensing system designed for personalized IAQmonitoring must address the following three challenges.First, some existing approaches use proprietary radiofrequency and ultrasound technologies for room local-ization, which require investment in infrastructure andspecial hardware worn by all users. Others use Wi-Fibased fingerprinting, which requires time consumingpre-characterization and is hampered by device or en-vironment heterogeneity. Second, the mobile sensingdevices must be inexpensive, portable, and energy effi-cient. This limits the number and types of sensors that
CO2 sensor Fan BluetoothM-pod
SmartphoneBluetooth
Wi-Fi
Data server
Web server
Temporal n-gram augmented room
localizationZone-based
Collaborative sensing
Personalized IAQ
Rooms CO2
AER based IAQ sensing
Data sharing, analysis and visualization
Other sensors(optional)
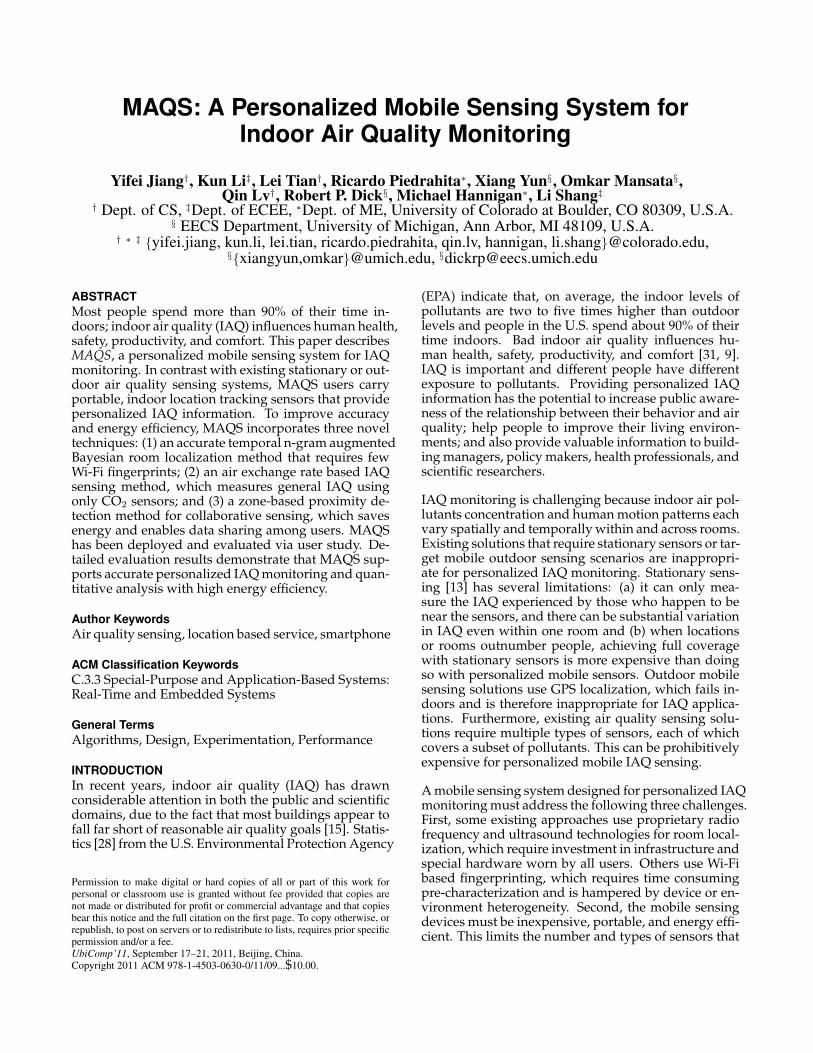
Figure 1. MAQS: A mobile sensing system for personalized indoor air quality (IAQ) monitoring.
can be integrated within each mobile device. Achiev-ing high-quality IAQ monitoring with few sensors ischallenging. Third, IAQ sensing depends largely onthe motion patterns of individual user. This leads toredundant IAQ information when users are near eachother, and may lead to gaps in coverage for users whoare not presently carrying sensing devices.
This paper describes MAQS1, a personalized mobilesensing system for IAQ monitoring. MAQS estimateshuman-dependent air quality factors (e.g., CO2 and con-tagious viruses) using CO2 concentration, and estimatesother air quality factors (e.g., volatile organic compounds(VOCs)) using air exchange rates. MAQS integratessmartphones and portable sensing devices to deliverpersonalized, energy-efficient, IAQ information. MAQSis the first mobile air quality sensing system that achieveshigh coverage of people in indoor environments. Ourwork makes the following main technical contributions.
1. A temporal n-gram augmented Bayesian room lo-calization method that is accurate and requires few Wi-Fi fingerprints;2. An air exchange rate based IAQ sensing method,which measures general IAQ without requiring sen-sors for various types of air pollutants; and3. A zone-based proximity detection method for col-laborative sensing, which saves energy and enables datasharing among multiple users.
MAQS was evaluated via real-world system deploy-ment and a user study. Our results demonstrate highaccuracy (over 96% for room localization and 89% forzone detection) and 2×–8× better energy efficiency. Ourquantitative IAQ analysis also reveals that most usersare subject to poor IAQ (i.e., high CO2 concentrationand low air exchange rate) in a number of rooms.
SYSTEM OVERVIEWThis section gives a high-level overview of the MAQSsystem architecture and describes the key components.
As illustrated in Figure 1, MAQS consists of four typesof components: (1) M-pods, the portable IAQ sensing1MAQS stands for Mobile Air Quality Sensing.
devices; (2) smartphones; (3) a data server; and (4) a webserver. MAQS users carry smartphones and optionallyM-pods. The data server communicates with clientsand maintains room air quality, CO2, and personalizedIAQ data. The web sever allows users to view, analyze,and share IAQ data. There are three main functionalunits in MAQS: (a) temporal n-gram augmented roomlocalization, (b) air exchange rate based IAQ sensing,and (c) zone-based collaborative sensing.
A MAQS client runs on each smartphone. It monitorsthe phone’s accelerometer readings to detect room en-trance and departure events. For the purpose of IAQmonitoring, rooms are defined as enclosed building unitswith walls, doors, and windows where people spendsubstantial time (e.g., office, classroom, bedroom) andwe ignore transitional spaces indoor (e.g., hallway). Oncethe client detects that the user has entered a room, theroom localization function collects Wi-Fi signals fromnearby access points and uses the subsequences of Wi-Fi signals (spatial information) and the user’s mobilitypattern (temporal information) to determine the cur-rent room. The collaborative sensing unit then useszone-based proximity detection to select specific sens-ing devices for (collaborative) IAQ monitoring of theroom. This is useful since not all smartphone userscarry IAQ sensing devices, and sensing devices closeto each other (i.e., in the same zone) are largely redun-dant. As concentration readings of CO2, VOCs, andother air pollutants are collected and transmitted tothe server, they are stored in databases and combinedwith room information (e.g., room ID, volume) for airexchange rate calculation and personalized IAQ anal-ysis. MAQS stops IAQ sensing after detecting a roomdeparture and restarts when another room is entered.
M-POD: THE PORTABLE IAQ SENSING DEVICEIn this section, we describe the design of our portableIAQ sensing device, the M-pod. The M-pod is a wire-less embedded sensing, computation, and communi-cation device based on the Arduino BT [2]. It is ca-pable of sensing the concentrations of a number of airpollutants and either storing these data or transmit-ting them to nearby smartphones via its Bluetooth in-terface. The main requirements for the M-pod wereto accurately sense pollutant concentrations relevant
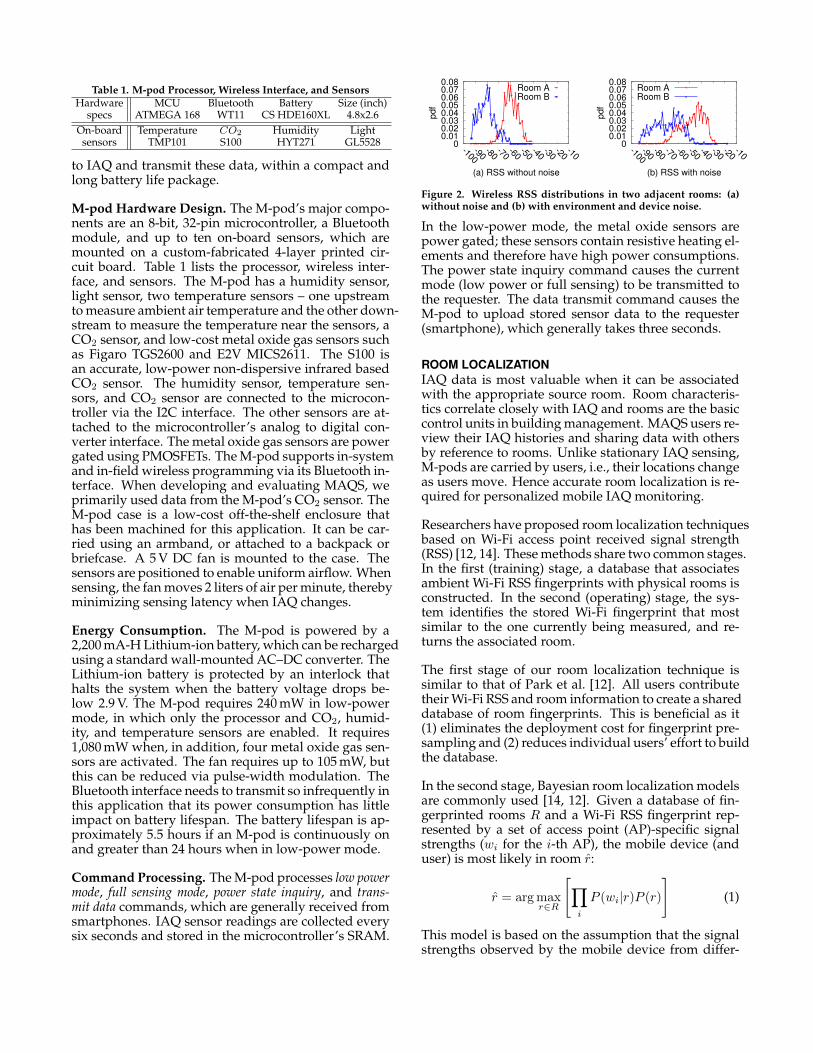
Table 1. M-pod Processor, Wireless Interface, and SensorsHardware MCU Bluetooth Battery Size (inch)
specs ATMEGA 168 WT11 CS HDE160XL 4.8x2.6On-board Temperature CO2 Humidity Light
sensors TMP101 S100 HYT271 GL5528
to IAQ and transmit these data, within a compact andlong battery life package.
M-pod Hardware Design. The M-pod’s major compo-nents are an 8-bit, 32-pin microcontroller, a Bluetoothmodule, and up to ten on-board sensors, which aremounted on a custom-fabricated 4-layer printed cir-cuit board. Table 1 lists the processor, wireless inter-face, and sensors. The M-pod has a humidity sensor,light sensor, two temperature sensors – one upstreamto measure ambient air temperature and the other down-stream to measure the temperature near the sensors, aCO2 sensor, and low-cost metal oxide gas sensors suchas Figaro TGS2600 and E2V MICS2611. The S100 isan accurate, low-power non-dispersive infrared basedCO2 sensor. The humidity sensor, temperature sen-sors, and CO2 sensor are connected to the microcon-troller via the I2C interface. The other sensors are at-tached to the microcontroller’s analog to digital con-verter interface. The metal oxide gas sensors are powergated using PMOSFETs. The M-pod supports in-systemand in-field wireless programming via its Bluetooth in-terface. When developing and evaluating MAQS, weprimarily used data from the M-pod’s CO2 sensor. TheM-pod case is a low-cost off-the-shelf enclosure thathas been machined for this application. It can be car-ried using an armband, or attached to a backpack orbriefcase. A 5 V DC fan is mounted to the case. Thesensors are positioned to enable uniform airflow. Whensensing, the fan moves 2 liters of air per minute, therebyminimizing sensing latency when IAQ changes.
Energy Consumption. The M-pod is powered by a2,200 mA-H Lithium-ion battery, which can be rechargedusing a standard wall-mounted AC–DC converter. TheLithium-ion battery is protected by an interlock thathalts the system when the battery voltage drops be-low 2.9 V. The M-pod requires 240 mW in low-powermode, in which only the processor and CO2, humid-ity, and temperature sensors are enabled. It requires1,080 mW when, in addition, four metal oxide gas sen-sors are activated. The fan requires up to 105 mW, butthis can be reduced via pulse-width modulation. TheBluetooth interface needs to transmit so infrequently inthis application that its power consumption has littleimpact on battery lifespan. The battery lifespan is ap-proximately 5.5 hours if an M-pod is continuously onand greater than 24 hours when in low-power mode.
Command Processing. The M-pod processes low powermode, full sensing mode, power state inquiry, and trans-mit data commands, which are generally received fromsmartphones. IAQ sensor readings are collected everysix seconds and stored in the microcontroller’s SRAM.
0 0.01 0.02 0.03 0.04 0.05 0.06 0.07 0.08
-100-90
-80-70
-60-50
-40-30
-20-10
(a) RSS without noise
Room ARoom B
0 0.01 0.02 0.03 0.04 0.05 0.06 0.07 0.08
-100-90
-80-70
-60-50
-40-30
-20-10
(b) RSS with noise
Room ARoom B
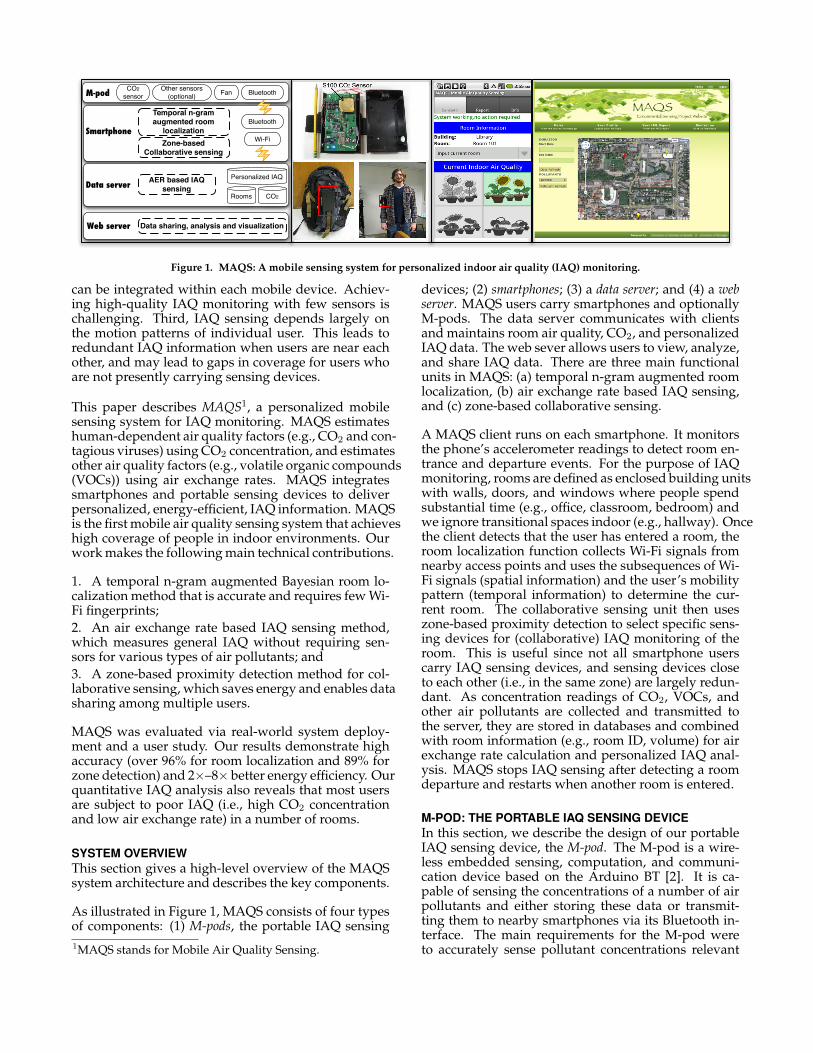
Figure 2. Wireless RSS distributions in two adjacent rooms: (a)without noise and (b) with environment and device noise.
In the low-power mode, the metal oxide sensors arepower gated; these sensors contain resistive heating el-ements and therefore have high power consumptions.The power state inquiry command causes the currentmode (low power or full sensing) to be transmitted tothe requester. The data transmit command causes theM-pod to upload stored sensor data to the requester(smartphone), which generally takes three seconds.
ROOM LOCALIZATIONIAQ data is most valuable when it can be associatedwith the appropriate source room. Room characteris-tics correlate closely with IAQ and rooms are the basiccontrol units in building management. MAQS users re-view their IAQ histories and sharing data with othersby reference to rooms. Unlike stationary IAQ sensing,M-pods are carried by users, i.e., their locations changeas users move. Hence accurate room localization is re-quired for personalized mobile IAQ monitoring.
Researchers have proposed room localization techniquesbased on Wi-Fi access point received signal strength(RSS) [12, 14]. These methods share two common stages.In the first (training) stage, a database that associatesambient Wi-Fi RSS fingerprints with physical rooms isconstructed. In the second (operating) stage, the sys-tem identifies the stored Wi-Fi fingerprint that mostsimilar to the one currently being measured, and re-turns the associated room.
The first stage of our room localization technique issimilar to that of Park et al. [12]. All users contributetheir Wi-Fi RSS and room information to create a shareddatabase of room fingerprints. This is beneficial as it(1) eliminates the deployment cost for fingerprint pre-sampling and (2) reduces individual users’ effort to buildthe database.
In the second stage, Bayesian room localization modelsare commonly used [14, 12]. Given a database of fin-gerprinted rooms R and a Wi-Fi RSS fingerprint rep-resented by a set of access point (AP)-specific signalstrengths (wi for the i-th AP), the mobile device (anduser) is most likely in room r:
r = argmaxr∈R
[∏i
P (wi|r)P (r)
](1)
This model is based on the assumption that the signalstrengths observed by the mobile device from differ-

ent APs are conditionally independent. However, themodel fails to address the following two challenges: (1)device heterogeneity – different devices may be used forgathering RSS fingerprints and devices might be helddifferently (e.g., in hand, pocket, or bag) and (2) envi-ronment heterogeneity – the wireless environment of aroom may change over time, due to motion of peopleand other room contents, influencing the RSS finger-prints gathered by mobile devices. As demonstratedin Figure 2, noise induced by device and environmentheterogeneity significantly increase the RSS overlap be-tween adjacent rooms, leading to much lower roomlocalization accuracy. To address these problems, wepropose a novel temporal n-gram augmented Bayesianroom localization method, which is robust to both en-vironment and device noises.
N-gram Augmented Bayesian Room LocalizationOur key observation is that, although the exact RSSvalues of each AP may change substantially for differ-ent devices and environments, the ordered sequence ofAPs based on their RSS values tends to be similar for thesame room and inconsistent among adjacent rooms. For ex-ample, the ordering may be [ap1, ap2, ap3, ap4, ap5, ap6]at one time, and [ap2, ap1, ap3, ap4, ap5, ap6] at anothertime, for the same room. The ordered AP sequencesof adjacent rooms are less similar, especially when dif-ferent APs are observed in these rooms. Intuitively, theordered AP sequence is useful for room localization be-cause: (1) it captures the inherent correlations amongAPs, which are stable for the same room yet differentfor adjacent rooms and (2) it uses the order of RSS in-stead of their exact values, allowing many sources ofdevice variation and wireless environment variation tobe tolerated.
Based on the observations above, we propose an n-gram augmented Bayesian room localization model,which works as follows. Let s be a sequence of N APsordered in descending RSS values:
s = (ap1, ..., apN ) wi ≥ wj(1 ≤ i < j ≤ N), (2)
wherewi is the RSS value of api observed by the mobiledevice. An n-gram is then defined as a subsequence oflength n extracted from the sequence s at position i:
ngrami(s) = (api, · · · , api+n−1). (3)
The most likely room r is determined as follows:
r = argmaxr∈R
[∏i
P (ngrami(s)|r)P (r)
]. (4)
In other words, r is the room with the highest probabil-ity of having the same ordering of APs in subsequencengrami(s).
Temporal User Mobility for Room LocalizationAs shown in the experimental results, our n-gram aug-mented Bayesian room localization model achieves highaccuracy when the room has enough fingerprints (more
Figure 3. Bayesian network for room localization.
than 50 or 100). However, when the number of finger-prints is low, the model accuracy is poorer and userstend to be misclassified into nearby rooms. To removesuch spatial errors, we propose to incorporate tempo-ral user mobility information. This is motivated by thefollowing observations.
• A user’s current room is closely related to time andweekday, e.g., the user has weekly meetings in the con-ference room on Tuesday mornings.• Users can only move among adjacent rooms, andtheir paths tend to contain patterns. For example, auser usually goes to the conference room from her of-fice instead of from a classroom.
Based on these observations, a user’s current room canbe predicted based on current time and previous room.As shown in Figure 3, the Bayesian network has threelayers: current time and user’s previous room (firstlayer) indicate the user’s current room (second layer),and user’s current room determines the observed Wi-Fi RSS fingerprint. We also define a set of values to rep-resent some semantic concepts of time, including “dayof week”, “morning”, “afternoon”, and “evening”. Givena Wi-Fi scan observation s, the user’s previous room r′,and current time t , the user is most likely in room
r = argmaxr∈R
[P (s, r, t, r′)
](5)
= argmaxr∈R
[P (s|r)P (r|t, r′)P (t)P (r′)
]. (6)
P (s|r) can be computed using our n-gram augmentedBayesian room localization model. P (r′) and P (r|t, r′)are calculated from the user’s mobility history. P (t)can be ignored since it is the same for any room r.
Room Entrance and Departure DetectionOur room localization method requires Wi-Fi scanning,which can be power intensive. For example, Wi-Fi scan-ning at 1/6 Hz requires 80 mW on average. Using alower Wi-Fi scanning frequency improves energy effi-ciency but increases room localization latency.
To address this problem, our MAQS system leveragesthe smartphone accelerometer to monitor room entranceand departure, and triggers room localization only whena room entrance event is detected. Previous works haveused accelerometer to detect arriving at or departingfrom a place (e.g., a building or outdoor place) [16] ,while our work requires the finer-granularity of indoorroom-level entrance/departure detection. Specifically,room entrance/departure detection helps to (1) reduceenergy use for room localization; (2) locate rooms in a
timely fashion; and (3) start/stop IAQ sensing quickly.We sample acceleration at a low frequency mode, 3–10 samples per second, to reduce the energy consump-tion of the accelerometer. The magnitude of accelera-tion is calculated over all three axes and the varianceof the magnitude within a 5-second time window isused to detect motion. Variance larger than a thresh-old θ is taken to indicate motion. The threshold θ wasempirically determined based on measured data. If anode is stationary for 60 seconds, a room entrance isdetected. if a node is moving for 10 seconds, a roomdeparture is detected. Our experimental results showthat this approach achieves high detection accuracy.The false negative rate is 0.01%, which happens whena user moves between two adjacent rooms quickly. Thefalse positive rate is 7% on average, and false positivescan be corrected by our room localization algorithm.
AIR EXCHANGE RATE BASED IAQ SENSINGIndoor air quality (IAQ) is influenced by multiple airpollutants and sources, including (1) air pollutants gen-erated indoor, such as volatile organic compounds(VOCs), from combustion and off-gassing of paint andbuilding materials; (2) air pollutants introduced fromoutside via ventilation, e.g., ozone; and (3) air pollu-tants generated by people, e.g., CO2. It is impracticalto install sensors on our portable IAQ sensing devicesto monitor all pollutants of interest, as the sensing de-vice would become unreasonably large and require toomuch power. Additionally, not all pollutant sensorsare portable yet, and portable sensors are typically lessaccurate than stationary sensors.
As shown in previous studies [25, 24, 9, 11], CO2 con-centration and ventilation rate are strongly correlatedwith general IAQ. Therefore, the M-pod monitors CO2
concentration, which is then used to calculate the airexchange rate, i.e., how quickly air is cycled througha room. This rate is used to estimate general IAQ in aroom. Specifically, personalized air exchange rates aremodeled using changes in CO2 concentration and CO2
generation rate. The rate of change in CO2 concentra-tion depends on the concentration of in-flowing air, theconcentration of the out-flowing air, and the internalgeneration of CO2 in a room. The time derivative ofthe monitored concentration is given by [24]:
V dCt
dt = G+QCex −QCt, (7)
where Ct is the internal concentration of CO2 at timet, measured in units of ppm (parts per million, i.e., thevolume of CO2 over total volume of air). Cex is the ex-ternal concentration of CO2 (ppm). G is the generationrate of CO2 in the room (cm3/s). V is the room volume(m3). Q is the air change rate (m3/s).
Solving the equation above gives us the formula to cal-culate air exchange rate Q:
Q =V dCt
dt −GCex − Ct
, (8)
where Ct are the continuous CO2 readings from theM-pod. External concentration of CO2, Cex, is set to390 ppm, the globally averaged CO2 concentration atthe surface [4], unless local outdoor CO2 concentrationis available. To calculate the CO2 generation rate G,we assume each person’s generation rate is equal to0.0052 L/s[24], which corresponds to an average-sizedadult engaged in office work. At this time, we do notincorporate other possible sources of CO2 such as cook-ing or smoking. Room volume V can be provided bythe user through our system, or it can be calculatedfrom CO2 data based on the Steady-State Concentra-tion Balance Equation, dCt
dt = 0:
Q =G
Cex − Ct. (9)
After determining Q, we apply it to the user’s data, inwhich dCt
dt 6= 0 and Q do not change. Then we cancalculate the value of V .
The air exchange rate required for good IAQ dependson the size and occupancy of each room. In our system,three metrics are considered for IAQ:
• Indoor CO2 concentration is a surrogate for indoorpollutants emitted by humans and correlates with hu-man metabolic activity. The ASHRAE Standard is atmost 700 ppm above outdoor CO2 concentration [3].• Air changes per hour is a measure of how many timesthe air within a defined space (normally a room or house)is replaced per hour. Its value equals the air exchangerate of room divided by room volume. The ASHRAEStandard is at least 0.35 1/h [26].• Air flow per person is the room air exchange rate di-vided by the number of people in the room. The ASHRAEStandard is at least 7.5 l/s/person [26].
ZONE-BASED COLLABORATIVE SENSINGIn real-world usage scenarios, multiple users are likelyto stay in the same room, e.g., in meeting rooms or thelibrary. Such user groups tend to be concentrated insmall areas, leading to similar CO2 concentration andIAQ within each group. Through collaborative sens-ing, we aim to reduce the number of sensing devicesthat have to run concurrently (thus saving energy), andalso enable IAQ data sharing with people who do notcarry sensing devices (thus increasing system coverageand utility).
Specifically, we propose a zone-based proximity de-tection and information sharing mechanism. Concen-tration gradients are driven by transport via molecu-lar diffusion and convection. Both transport processeshave random and non-random components. Whateverthe process, the spatial gradients dictate that two pointsclose in proximity will likely have more similar con-centrations than two points that are more distant. Thesmaller the distance, the more similar the CO2 concen-tration readings. In MAQS, we define an area with
0
20
40
60
0.5 1 1.5 2 2.5 3 3.5 4 4.5
CO
2 s
en
sin
g e
rro
r (%
)
distance (meter)
Figure 4. Sensing error of CO2 concentrationat different distances.
-80-75-70-65-60-55-50-45-40
0.5 1 1.5 2 2.5 3 3.5 4 4.5
RS
SI
(db
m)
distance (meter)
Figure 5. RSSI measurements (avg andstdev) at different distances.
0 5
10 15 20 25 30 35 40
1 2 3 4 5 6 7 8
Zo
ne
err
or
rate
(%
)
distance between two nodes (meter)
1 avg2 avg3 avg4 avg5 avg6 avg
7 avg8 avg9 avg
10 avg11 avg12 avg
Figure 6. Zone detection error rate decreasesby averaging multiple RSSI readings.
high density of people as a zone. All people within thesame zone can share one M-pod for IAQ monitoring.When a new user without an M-pod joins this zone,the user’s smartphone initiates a scan to determine ifthere is already an M-pod in the zone. If so, a com-munication link between the phone and the M-pod isestablished and the IAQ values reported by the M-podis used to estimate the IAQ of this user.
Zone-based sharing would incur some error, which isdefined as the difference between the CO2 concentra-tion reported by the shared M-pod nearby and the trueCO2 concentration at the user’s location. Again, ac-cording to the diffusion equation, this error is highlycorrelated with the distance. Therefore, this error de-termines the effective range of each zone.
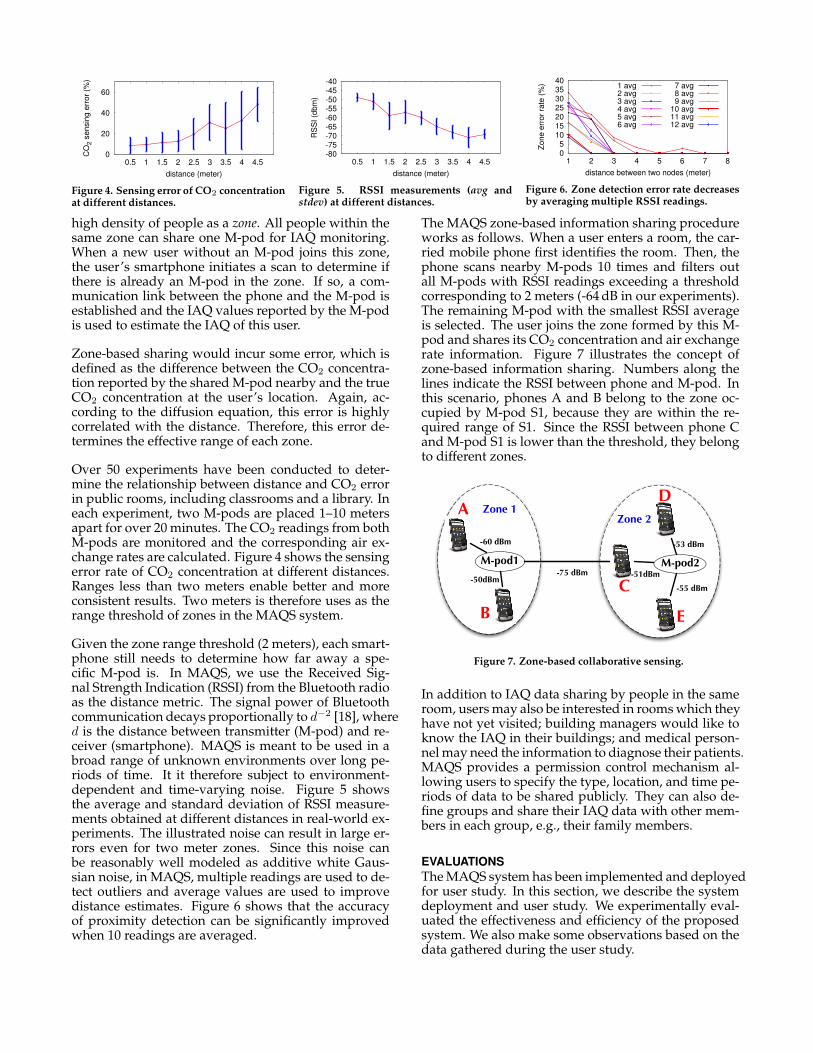
Over 50 experiments have been conducted to deter-mine the relationship between distance and CO2 errorin public rooms, including classrooms and a library. Ineach experiment, two M-pods are placed 1–10 metersapart for over 20 minutes. The CO2 readings from bothM-pods are monitored and the corresponding air ex-change rates are calculated. Figure 4 shows the sensingerror rate of CO2 concentration at different distances.Ranges less than two meters enable better and moreconsistent results. Two meters is therefore uses as therange threshold of zones in the MAQS system.
Given the zone range threshold (2 meters), each smart-phone still needs to determine how far away a spe-cific M-pod is. In MAQS, we use the Received Sig-nal Strength Indication (RSSI) from the Bluetooth radioas the distance metric. The signal power of Bluetoothcommunication decays proportionally to d−2 [18], whered is the distance between transmitter (M-pod) and re-ceiver (smartphone). MAQS is meant to be used in abroad range of unknown environments over long pe-riods of time. It it therefore subject to environment-dependent and time-varying noise. Figure 5 showsthe average and standard deviation of RSSI measure-ments obtained at different distances in real-world ex-periments. The illustrated noise can result in large er-rors even for two meter zones. Since this noise canbe reasonably well modeled as additive white Gaus-sian noise, in MAQS, multiple readings are used to de-tect outliers and average values are used to improvedistance estimates. Figure 6 shows that the accuracyof proximity detection can be significantly improvedwhen 10 readings are averaged.
The MAQS zone-based information sharing procedureworks as follows. When a user enters a room, the car-ried mobile phone first identifies the room. Then, thephone scans nearby M-pods 10 times and filters outall M-pods with RSSI readings exceeding a thresholdcorresponding to 2 meters (-64 dB in our experiments).The remaining M-pod with the smallest RSSI averageis selected. The user joins the zone formed by this M-pod and shares its CO2 concentration and air exchangerate information. Figure 7 illustrates the concept ofzone-based information sharing. Numbers along thelines indicate the RSSI between phone and M-pod. Inthis scenario, phones A and B belong to the zone oc-cupied by M-pod S1, because they are within the re-quired range of S1. Since the RSSI between phone Cand M-pod S1 is lower than the threshold, they belongto different zones.
A
B
C
E
D
-60 dBm
-50dBm-75 dBm -51dBm
-53 dBm
-55 dBm
M-pod1 M-pod2
Zone 1Zone 2
Figure 7. Zone-based collaborative sensing.
In addition to IAQ data sharing by people in the sameroom, users may also be interested in rooms which theyhave not yet visited; building managers would like toknow the IAQ in their buildings; and medical person-nel may need the information to diagnose their patients.MAQS provides a permission control mechanism al-lowing users to specify the type, location, and time pe-riods of data to be shared publicly. They can also de-fine groups and share their IAQ data with other mem-bers in each group, e.g., their family members.
EVALUATIONSThe MAQS system has been implemented and deployedfor user study. In this section, we describe the systemdeployment and user study. We experimentally eval-uated the effectiveness and efficiency of the proposedsystem. We also make some observations based on thedata gathered during the user study.

System Deployment and User StudiesThe deployed MAQS system includes M-pod sensingdevices, Android-based smartphones, as well as thedata and web servers. We have conducted two phasesof user study with 17 participants, including facultyand graduate students, who share some workplacesand classrooms. The first phase was designed to evalu-ate our room localization method. In this phase, userswere asked to carry their Android phones for 12 weeks.Our MAQS phone application continuously collectedWi-Fi signals, and requested manual labeling when usersentered rooms. Weekly meetings with the users wereheld to verify the accuracy of the motion traces. Inaddition, users were asked to collect Wi-Fi signals inrooms that are adjacent to those they have visited, whichfurther increased the noise and complexity of our roomlocation task but better represents real-world scenar-ios.
In the second phase, users carried both their smart-phones and the M-pod sensing devices for 3 weeks.The MAQS system collects both room information andIAQ data for all users. This phase of user study allowsus to evaluate the entire MAQS system. We collectedlocalization data for 171 rooms, and IAQ data for 56rooms.
Evaluation of Room Localization TechniqueTo evaluate our temporal n-gram augmented Bayesianroom localization method, we determined the roomlocalization accuracy as a function of the number ofWi-Fi fingerprints. A good room localization methodshould achieve high accuracy with few fingerprints.Specifically, we conduct experiments to answer the fol-lowing questions: (1) How does the n-gram length af-fect overall room localization performance? (2) Howdoes the n-gram augmented Bayesian model performcompared with existing approaches? (3) To what ex-tent does temporal user mobility information improveroom localization accuracy?
The subsequence length n of n-gram has an importantimpact on room localization performance. If n is toosmall, adjacent rooms may have many similar subse-quences and be difficult to distinguish. For example,when n = 1, our n-gram augmented model is simi-lar to the original Bayesian model, and the only dif-ference is the binary discretization of signal strength:AP equals 1 (or 0) if its signal can (or cannot) be ob-served by the device. If n is too big, then the roomsignature may change for each scan, since longer sub-sequences have a low probability of being repeated ineach scan. For example, when n is set to the total num-ber of APs that can be scanned in a room, it is veryunlikely to receive the same sequence for each scan.Therefore, a good n value should make the n-gram sig-nature for each room stable for different scans, andmake the n-gram signatures of adjacent rooms distin-guishable. Figure 8 shows the accuracy of our n-gramBayesian model with different n values and different
Table 2. Energy Consumption for Room LocalizationMethod Wi-Fi Acc Energy
(#scans/day) (#samples/sec) (mw)Wi-Fi only 1,440 off 8
Wi-Fi + Acc 5–30 3–10 1–3
number of fingerprints per room. As shown in the fig-ure, when n = 2, our model achieves much better ac-curacy with fewer fingerprints.
We now compare our n-gram augmented Bayesian roomlocalization model with four state-of-the-art algorithms:(1) Bayesian room localization [14, 12], (2) Delta signalBayesian room localization, which is similar to Bayesianroom localization but uses the difference of signal strength(instead of RSS values directly) between each pair ofAPs to calculate probability, (3) vector-based room lo-calization [5], which uses AP RSS vector as the roomsignature and Euclidean distance to locate the near-est room, and (4) Delta signal vector-based room lo-calization, which is similar to vector-based room lo-calization but uses the difference in signal strength be-tween each pair of APs to build the vectors. As shownin Figure 9(a), our n-gram augmented Bayesian modelachieves the best accuracy, especially when the num-ber of fingerprints per room is above 50.
By incorporating the temporal user mobility informa-tion, our temporal n-gram augmented Bayesian modelcan achieve better accuracy even when the number offingerprints per room is limited. As shown in Figure 9(b), our temporal n-gram model further improves theroom localization accuracy over our n-gram model, es-pecially when the number of fingerprints per room isless than 50. The Delta Bayesian room localization model,which performed second best in Figure 9(a), can alsobenefit from the use of temporal user mobility infor-mation, but it is still not comparable to our temporaln-gram model.
Finally, we evaluate the energy consumption of ourroom localization method. By using an accelerometerto detect room entrance/departure and performing aWi-Fi scan only when entering a new room, we can sig-nificantly reduce the energy consumption. As shownin Table 2, our Wi-Fi + accelerometer (Acc) approachconsumes only 1–3 mW on the mobile phone, while theWi-Fi only approach consumes 8 mW.
Evaluation of Air Exchange Rate Based IAQ SensingTo estimate the general IAQ without using sensors foreach specific air pollutant, we propose to calculate theair exchange rate from temporal CO2 concentration read-ings, and use this air exchange rate to estimate IAQ.Here, we evaluate the accuracy of the air exchange ratemodel. We used the Alnor EBT721 EBT 721 Air Balanc-ing Balometer Flow Capture Hood [1] to measure the airflow rate directly from vents as the ground truth. Dur-ing each experiment, we change the forced ventilationrate and the number of people in the room to evaluate

0
0.2
0.4
0.6
0.8
1
0 50 100 150 200 250 300 350 400
accu
racy
# of fingerprints per room
n = 2 n = 3 n = 4
Figure 8. Comparison of different n for n-gram augmented Bayesian model.
-0.2
0
0.2
0.4
0.6
0.8
1
0 50 100 150 200 250 300 350 400
accu
racy
(a) # of fingerprints per room
n-grambeyasian
∆ beyasian
vector∆ vector
0
0.2
0.4
0.6
0.8
1
0 50 100 150 200 250 300 350 400
accu
racy
(b) # of fingerprints per room
n-gramtemporal n-gram
∆ bayesiantemporal ∆ bayesian
Figure 9. Performance comparison of room localization methods: (a) n-gram model and (b)temporal n-gram model.
Table 3. Zone Detection AccuracySeat Map 1 2 3 4 5Accuracy (%) 97 100 100 78 100Seat Map 6 7 8 9 10Accuracy (%) 100 88 100 42 85
the accuracy and responsiveness of our CO2 based airexchange rate model.
0.14 0.16 0.18
0.2 0.22 0.24 0.26 0.28
0.3 0.32
11:00
11:15
11:30
11:45
12:00
12:15
12:30
12:45
13:00
air e
xch
an
ge
ra
te (
m3/s
)
time
modelmeasurement
Figure 10. Air exchange rate model evaluation.
Figure 10 shows the results of one experiment. Westarted at 11:15 with a relatively high forced ventilationrate and lowered the ventilation rate at 11:30. We cansee that the air exchange rate calculated by our modelfollowed the actual rate drop quickly and stayed withinthe same range. Starting from 12:15, we kept the ven-tilation rate low and changed the number of people inthe room every 5 minutes. Again, we can see that theAER calculated by the model well approximates themeasured value. It is slightly higher than the measuredvalue, since the door was opened and closed when wechanged the number of people in the room, leadingto additional air exchange, which is not captured bythe vent hood, as it measures only the air exchange atthe vent. We conducted multiple experiments in roomswith different sizes and vents, and obtained similar re-sults.
Evaluation of Zone-Based Collaborative SensingZone-based collaborative sensing helps to reduce thenumber of M-pods needed, saves energy, and allowusers to share IAQ data. Since the energy consump-tion of scanning Bluetooth RSSI for a short period oftime (less than 30 seconds) is negligible compared withthat of continuous IAQ sensing, a zone with k devicescan generally achieve k× better energy efficiency sinceonly one device needs to be running. Here, we eval-uate the accuracy of our zone-based proximity detec-tion, i.e., whether we can identify the correct zone basedon the Bluetooth RSSI readings. Given three M-pods
and a mobile phone, we selected 10 seat maps that rep-resent real-world user-sitting scenarios. For each seatmap, we conducted 10 experiments at different timesto capture potential temporal variations. For each ex-periment, the mobile phone used 10 RSSI readings fromeach M-pod to determine which zone (i.e., M-pod) itbelonged to. The average zone detection accuracy foreach seat map is shown in Table 3. We can see thatour RSSI-based zone detection method achieved highaccuracy for most seat maps with an average of 89%.
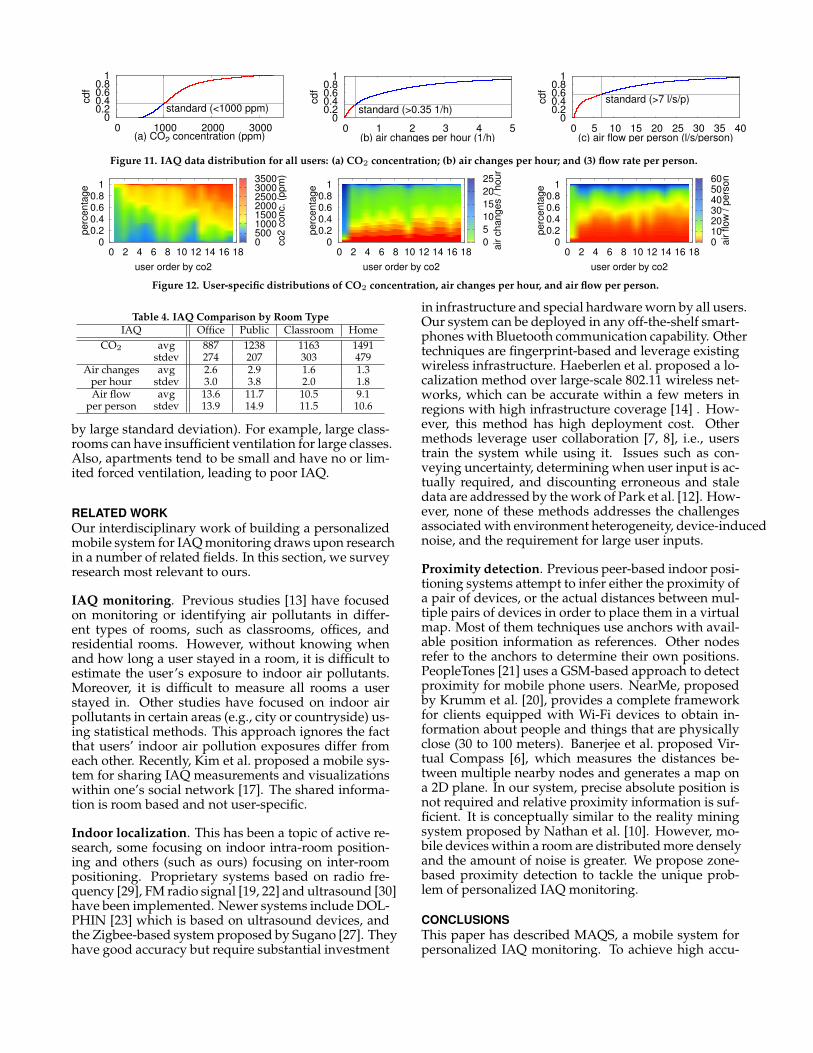
IAQ Data AnalysisWe analyzed the IAQ distributions for the data gath-ered during our user study. Specifically, we would liketo answer quantitatively what IAQ distributions thestudy participants experienced. Figure 11 shows theIAQ distributions for all users. The dashed lines indi-cate the standard limits, blue solid lines represent goodIAQ, and red solid lines represent bad IAQ. Accordingto the figure, (1) 67% of the time, indoor CO2 concen-tration is higher than the reasonable limit of 1,000 ppm;(2) 30% of the time, air changes per hour do not meetthe minimum requirement of 0.35 1/h; and (3) 58% ofthe time, flow rate per person does not meet the mini-mum standard of 7 l/s/person. We conclude that ourstudy participants frequently spent time in environ-ments with poor air quality.
Figure 12 shows the distributions of CO2 concentra-tion, air changes per hour, and air flow per person fordifferent users. The users are ordered by their averageCO2 concentration. We can observe that users are sub-ject to different IAQ at different times, and almost allusers are subject to a fairly high percentage of times atwhich they experienced poor IAQ (high CO2, low airchanges per hour, or low air flow per person).
Figure 13 shows the distributions of CO2 concentra-tion, air changes per hour, and air flow per person indifferent rooms. The rooms are ordered by their aver-age CO2 concentrations. We can see that rooms havedynamic and diverse IAQ profiles. Although the ex-act fraction is different, many rooms have poor IAQsome of the time. Table 4 compares the IAQ in differenttypes of rooms: office, public place (e.g., library, lobby),classroom, and home (apartment or house). The of-fice has good IAQ in general, since most office roomsare small, sparsely occupied, and have good ventila-tion systems. IAQ in the other three types of roomsis not good and can be very bad at times (indicated
0 0.2 0.4 0.6 0.8
1
0 1000 2000 3000
cdf
(a) CO2 concentration (ppm)
standard (<1000 ppm) 0
0.2 0.4 0.6 0.8
1
0 1 2 3 4 5
cdf
(b) air changes per hour (1/h)
standard (>0.35 1/h) 0
0.2 0.4 0.6 0.8
1
0 5 10 15 20 25 30 35 40
cdf
(c) air flow per person (l/s/person)
standard (>7 l/s/p)
Figure 11. IAQ data distribution for all users: (a) CO2 concentration; (b) air changes per hour; and (3) flow rate per person.
0 0.2 0.4 0.6 0.8
1
0 2 4 6 8 10 12 14 16 18
pe
rce
nta
ge
user order by co2
0 500 1000 1500 2000 2500 3000 3500
co
2 c
on
c.
(pp
m)
0 0.2 0.4 0.6 0.8
1
0 2 4 6 8 10 12 14 16 18
pe
rce
nta
ge
user order by co2
0
5
10
15
20
25
air c
ha
ng
es /
ho
ur
0 0.2 0.4 0.6 0.8
1
0 2 4 6 8 10 12 14 16 18
pe
rce
nta
ge
user order by co2
0 10 20 30 40 50 60
air f
low
/ p
ers
on
Figure 12. User-specific distributions of CO2 concentration, air changes per hour, and air flow per person.
Table 4. IAQ Comparison by Room TypeIAQ Office Public Classroom Home
CO2 avg 887 1238 1163 1491stdev 274 207 303 479
Air changes avg 2.6 2.9 1.6 1.3per hour stdev 3.0 3.8 2.0 1.8Air flow avg 13.6 11.7 10.5 9.1
per person stdev 13.9 14.9 11.5 10.6
by large standard deviation). For example, large class-rooms can have insufficient ventilation for large classes.Also, apartments tend to be small and have no or lim-ited forced ventilation, leading to poor IAQ.
RELATED WORKOur interdisciplinary work of building a personalizedmobile system for IAQ monitoring draws upon researchin a number of related fields. In this section, we surveyresearch most relevant to ours.
IAQ monitoring. Previous studies [13] have focusedon monitoring or identifying air pollutants in differ-ent types of rooms, such as classrooms, offices, andresidential rooms. However, without knowing whenand how long a user stayed in a room, it is difficult toestimate the user’s exposure to indoor air pollutants.Moreover, it is difficult to measure all rooms a userstayed in. Other studies have focused on indoor airpollutants in certain areas (e.g., city or countryside) us-ing statistical methods. This approach ignores the factthat users’ indoor air pollution exposures differ fromeach other. Recently, Kim et al. proposed a mobile sys-tem for sharing IAQ measurements and visualizationswithin one’s social network [17]. The shared informa-tion is room based and not user-specific.
Indoor localization. This has been a topic of active re-search, some focusing on indoor intra-room position-ing and others (such as ours) focusing on inter-roompositioning. Proprietary systems based on radio fre-quency [29], FM radio signal [19, 22] and ultrasound [30]have been implemented. Newer systems include DOL-PHIN [23] which is based on ultrasound devices, andthe Zigbee-based system proposed by Sugano [27]. Theyhave good accuracy but require substantial investment
in infrastructure and special hardware worn by all users.Our system can be deployed in any off-the-shelf smart-phones with Bluetooth communication capability. Othertechniques are fingerprint-based and leverage existingwireless infrastructure. Haeberlen et al. proposed a lo-calization method over large-scale 802.11 wireless net-works, which can be accurate within a few meters inregions with high infrastructure coverage [14] . How-ever, this method has high deployment cost. Othermethods leverage user collaboration [7, 8], i.e., userstrain the system while using it. Issues such as con-veying uncertainty, determining when user input is ac-tually required, and discounting erroneous and staledata are addressed by the work of Park et al. [12]. How-ever, none of these methods addresses the challengesassociated with environment heterogeneity, device-inducednoise, and the requirement for large user inputs.
Proximity detection. Previous peer-based indoor posi-tioning systems attempt to infer either the proximity ofa pair of devices, or the actual distances between mul-tiple pairs of devices in order to place them in a virtualmap. Most of them techniques use anchors with avail-able position information as references. Other nodesrefer to the anchors to determine their own positions.PeopleTones [21] uses a GSM-based approach to detectproximity for mobile phone users. NearMe, proposedby Krumm et al. [20], provides a complete frameworkfor clients equipped with Wi-Fi devices to obtain in-formation about people and things that are physicallyclose (30 to 100 meters). Banerjee et al. proposed Vir-tual Compass [6], which measures the distances be-tween multiple nearby nodes and generates a map ona 2D plane. In our system, precise absolute position isnot required and relative proximity information is suf-ficient. It is conceptually similar to the reality miningsystem proposed by Nathan et al. [10]. However, mo-bile devices within a room are distributed more denselyand the amount of noise is greater. We propose zone-based proximity detection to tackle the unique prob-lem of personalized IAQ monitoring.
CONCLUSIONSThis paper has described MAQS, a mobile system forpersonalized IAQ monitoring. To achieve high accu-

0 0.2 0.4 0.6 0.8
1
0 10 20 30 40 50
pe
rce
nta
ge
room order by co2
0 500 1000 1500 2000 2500 3000 3500
CO
2 c
on
c.
(pp
m)
0 0.2 0.4 0.6 0.8
1
0 10 20 30 40 50
pe
rce
nta
ge
room order by co2
0
5
10
15
20
25
air c
ha
ng
es /
ho
ur
0 0.2 0.4 0.6 0.8
1
0 10 20 30 40 50
pe
rce
nta
ge
room order by co2
0 10 20 30 40 50 60
air f
low
/ p
ers
on
Figure 13. Room-specific distributions of CO2 concentration, air changes per hour, and air flow per person.
racy and energy efficiency under diverse sensing sce-narios, we developed a number of novel techniques:(1) a temporal n-gram augmented Bayesian room lo-calization method that achieves high accuracy with asmall number of Wi-Fi fingerprints; (2) an air exchangerate based IAQ sensing method that measures generalIAQ using only CO2 sensors; and (3) a zone-based prox-imity detection method for collaborative sensing, whichsaves energy and enables data sharing among multi-ple users. MAQS has been deployed and evaluated viauser study. Detailed evaluation results demonstratethe feasibility, effectiveness, and efficiency of MAQSfor personalized IAQ monitoring. We also found thatstudy participants frequently experienced poor IAQ.
ACKNOWLEDGEMENTSThis material is based upon work supported by the Na-tional Science Foundation under awards CNS-0910995,CNS-0910816, and CNS-0347941. We thank Simon Olivieriand Lan Bai for help with the experiments. We alsothank the anonymous reviewers for constructive com-ments.
REFERENCES1. Alnor ebt721 ebt 721 air balancing balometer flow capture
hood. http://www.aikencolon.com/Alnor-EBT721-EBT-721-Air-Balancing-Balometer-Flow-Capture-Hood p2549.html.
2. Arduino BT.http://www.arduino.cc/en/Main/ArduinoBoardBluetooth.
3. Indoor environmental quality. http://www.cdc.gov/niosh/topics/indoorenv/BuildingVentilation.html.
4. Trends in atmospheric carbon dioxide.http://www.esrl.noaa.gov/gmd/ccgg/trends/global.html.
5. P. Bahl and V. N. Padmanabhan. RADAR: An in-buildingrf-based user location and tracking system. In INFOCOM,pages 775–784, 2000.
6. N. Banerjee, S. Agarwal, P. Bahl, R. Chandra, A. Wolman, andM. Corner. Virtual Compass: Relative positioning to sensemobile social interactions. In Pervasive Computing, 2010.
7. E. S. Bhasker, S. W. Brown, and W. G. Griswold. Employinguser feedback for fast, accurate, low-maintenancegeolocationing. In PERCOM, page 111, 2004.
8. P. Bolliger. Redpin - adaptive, zero-configuration indoorlocalization through user collaboration. In MELT, 2008.
9. J. M. Daisey, W. J. Angell, and M. G. Apte. Indoor air quality,ventilation and health symptoms in schools: an analysis ofexisting information. Indoor Air, 13, 2003.
10. N. Eagle and A. (Sandy) Pentland. Reality mining: sensingcomplex social systems. Personal Ubiquitous Comput., 10, 2006.
11. W. J. Fisk, A. G. Mirer, and M. J. Mendell. Quantitativerelationship of sick building syndrome symptoms withventilation rates. Indoor Air, 19, 2009.
12. J. geun Park, B. Charrow, D. Curtis, J. Battat, E. Minkov,J. Hicks, S. Teller, and J. Ledlie. Growing an organic indoorlocation system. In MobiSys, pages 271–284, 2010.
13. C. Godwin and S. Batterman. Indoor air quality in michiganschools. Indoor Air, 17(4), 2007.
14. A. Haeberlen, E. Flannery, A. M. Ladd, A. Rudys, D. S. Wallach,and L. E. Kavraki. Practical robust localization over large-scale802.11 wireless networks. In MobiCom, pages 70–84, 2004.
15. C. Huizenga, S. Abbaszadeh, L. Zagreus, and E. Arens. Airquality and thermal comfort in office buildings: Results of alarge indoor environmental quality survey. In Healthy Buildings2006, 2006.
16. D. H. Kim, Y. Kim, D. Estrin, and M. B. Srivastava. SensLoc:Sensing everyday places and paths using less energy. In SenSys,pages 315–330, 2010.
17. S. Kim and E. Paulos. InAir: sharing indoor air qualitymeasurements and visualizations. In CHI, pages 1861–1870,2010.
18. J. D. Kraus. Antennas. McGraw-Hill, 1988.
19. J. Krumm, G. Cermak, and E. Horvitz. Rightspot: A novel senseof location for a smart personal object. In UBICOMP, 2003.
20. J. Krumm and K. Hinckley. The NearMe wireless proximityserver. In Ubicomp, pages 283–300. Springer, 2004.
21. K. A. Li, T. Y. Sohn, S. Huang, and W. G. Griswold. Peopletones:a system for the detection and notification of buddy proximityon mobile phones. In MobiSys, pages 160–173, 2008.
22. A. Matic, A. Papliatseyeu, V. Osmani, and O. Mayora-Ibarra.Tuning to your position: Fm radio based indoor localizationwith spontaneous recalibration. In IEEE PerCom, 2010.
23. M. Minami, Y. Fukuju, K. Hirasawa, S. Yokoyama,M. Mizumachi, H. Morikawa, and T. Aoyama. DOLPHIN: Apractical approach for implementing a fully distributed indoorultrasonic positioning system. In UbiComp, volume 3205, pages347–365, 2004.
24. A. Persily. Evaluating building IAQ and ventilation withindoor carbon dioxide. ASHRAE Transactions, 1997.
25. O. A. Seppanen, W. J. Fisk, and M. J. Mendell. Association ofventilation rates and co2 concentrations with health and otherresponses in commercial and institutional buildings. Indoor Air,9, 1999.
26. M. H. Sherman. ASHRAEs first residential ventilationstandard. LBNL-54331, 2004.
27. M. Sugano. Indoor localization system using rssi measurementof wireless sensor network based on zigbee standard. InWireless and Optical Communications, pages 1–6, 2006.
28. U.S. Environmental Protection Agency Green BuildingWorkgroup. Buildings and their impact on the environment: Astatistical summary, 2009.
29. R. Want, A. Hopper, V. Falcao, and J. Gibbons. The active badgelocation system. ACM Trans. Inf. Syst., 10:91–102, January 1992.
30. A. Ward, A. Jones, and A. Hopper. A new location technique forthe active office. IEEE Personal Communications, 4:42–47, 1997.
31. D. P. Wyon. The effects of indoor air quality on performanceand productivity. Indoor Air, 2004.