marcellus shale gas drilling: what does it mean for ... · pdf filesusan christopherson...
TRANSCRIPT
Susan Christopherson
Cornell University
Marcellus Shale Gas Drilling: What Does it Mean for
Economic Development? Preliminary Findings on the Economic Consequences
of Natural Gas Extraction in the Marcellus Shale
December 13, 2010 Update
Key Questions
1. How will the pace and scale of drilling in the Marcellus Shale affect costs to communities and the environment?
2. What can we expect regarding economic development long-term? What kinds of jobs will be created?
Pace and Scale are Pivotal to the Challenges Posed by Shale Gas Drilling
Pace refers to the time frame within which gas extraction takes place.
Scale refers to the number of wells drilled in a gas play annually.
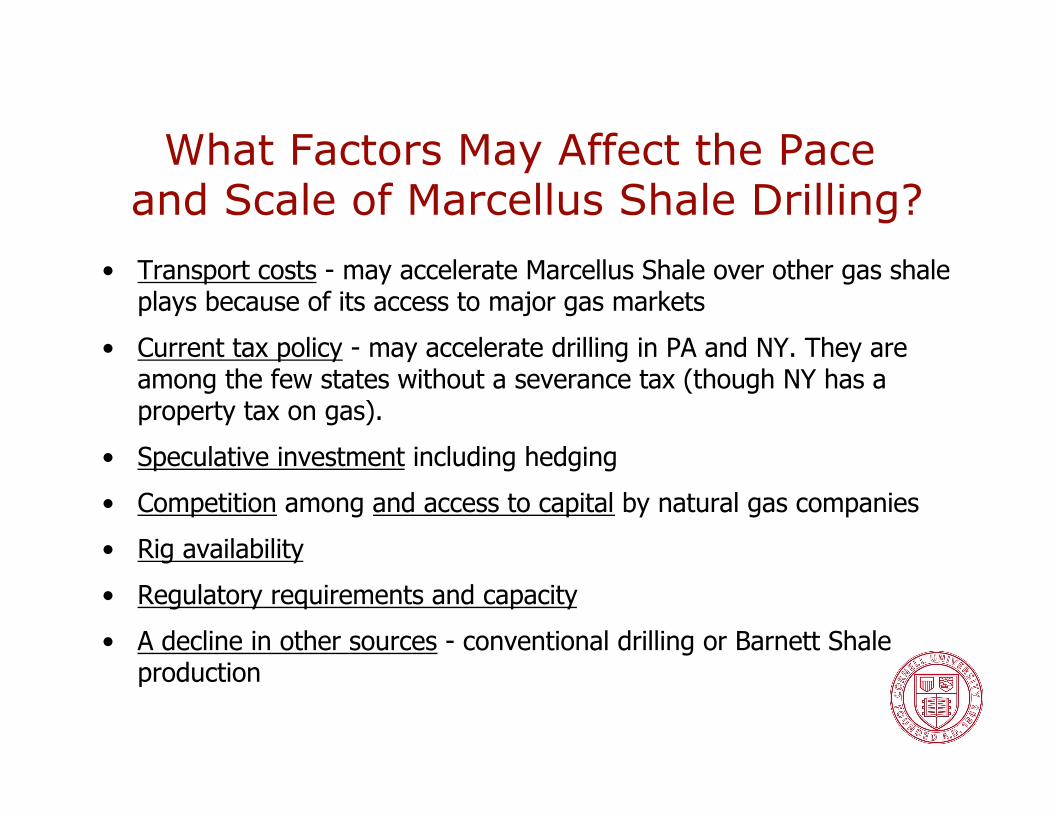
What Factors May Affect the Pace and Scale of Marcellus Shale Drilling?
• Transport costs - may accelerate Marcellus Shale over other gas shale plays because of its access to major gas markets
• Current tax policy - may accelerate drilling in PA and NY. They are among the few states without a severance tax (though NY has a property tax on gas).
• Speculative investment including hedging
• Competition among and access to capital by natural gas companies
• Rig availability
• Regulatory requirements and capacity
• A decline in other sources - conventional drilling or Barnett Shale production
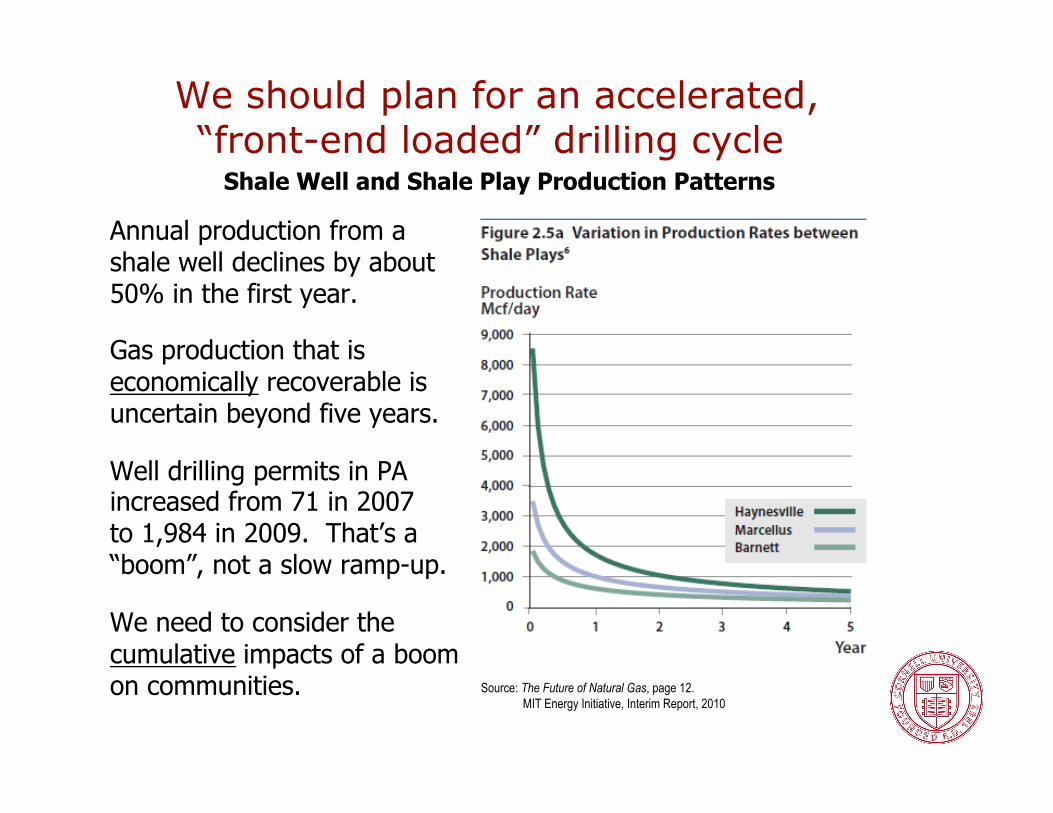
We should plan for an accelerated, “front-end loaded” drilling cycle
Annual production from a shale well declines by about 50% in the first year.
Gas production that is economically recoverable is uncertain beyond five years.
Well drilling permits in PA increased from 71 in 2007 to 1,984 in 2009. That’s a “boom”, not a slow ramp-up.
We need to consider the cumulative impacts of a boom on communities.
Shale Well and Shale Play Production Patterns
Source: The Future of Natural Gas, page 12. MIT Energy Initiative, Interim Report, 2010
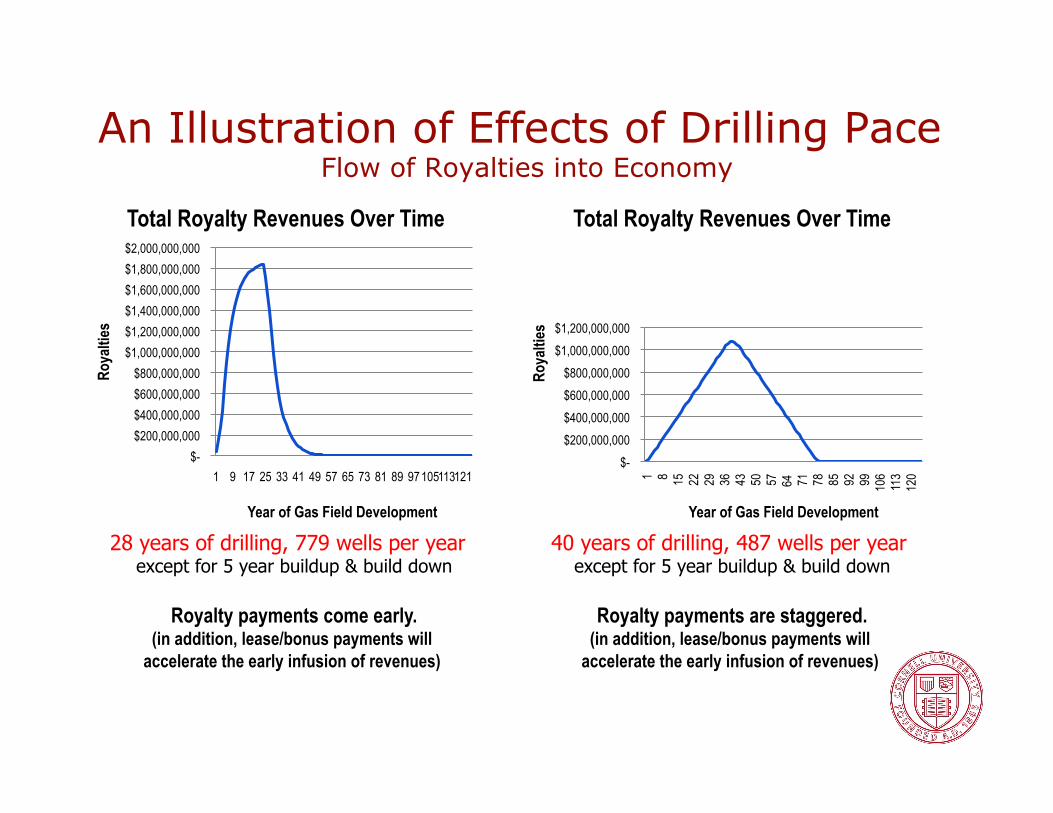
An Illustration of Effects of Drilling Pace Flow of Royalties into Economy
$- $200,000,000 $400,000,000 $600,000,000 $800,000,000
$1,000,000,000 $1,200,000,000 $1,400,000,000 $1,600,000,000 $1,800,000,000 $2,000,000,000
1 9 17 25 33 41 49 57 65 73 81 89 97 105 113 121
Roya
lties
Year of Gas Field Development
Total Royalty Revenues Over Time
$- $200,000,000 $400,000,000 $600,000,000 $800,000,000
$1,000,000,000 $1,200,000,000
1 8 15
22
29
36
43
50
57
64
71
78
85
92
99
106
113
120
Roya
lties
Year of Gas Field Development
Total Royalty Revenues Over Time
28 years of drilling, 779 wells per year except for 5 year buildup & build down
Royalty payments come early. (in addition, lease/bonus payments will
accelerate the early infusion of revenues)
40 years of drilling, 487 wells per year except for 5 year buildup & build down
Royalty payments are staggered. (in addition, lease/bonus payments will
accelerate the early infusion of revenues)
Question #1: What Do We Know About the Costs
to Communities and the Environment?
Case Studies Tell Us the Local Costs of Shale Gas Drilling include:
• Accelerated road maintenance
• Traffic congestion from trucks (An estimated 890 to 1,340 truck trips per well site)
• Higher public safety costs
• Increased demand for health and education services
• Increased demand on public administrative services (e.g. planning and zoning, permitting, assessments, housing assistance)
• New service requirements, such as emergency response capacity and environmental monitoring and remediation.
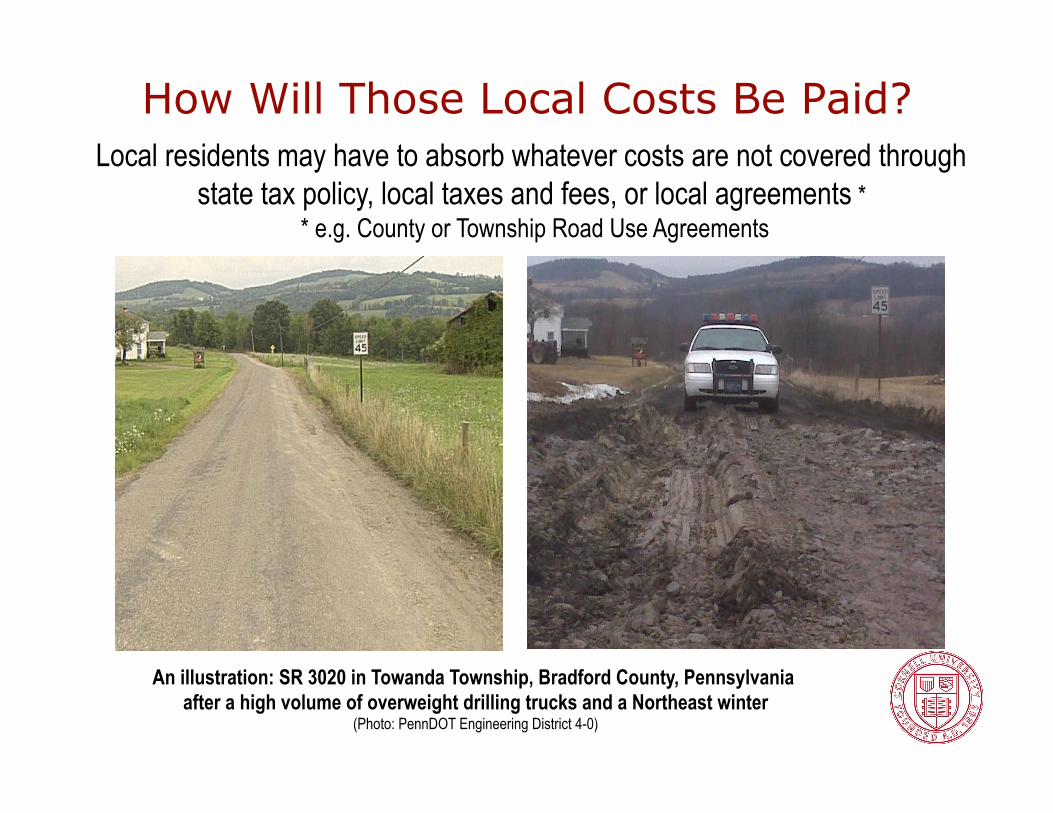
How Will Those Local Costs Be Paid?
An illustration: SR 3020 in Towanda Township, Bradford County, Pennsylvania after a high volume of overweight drilling trucks and a Northeast winter
(Photo: PennDOT Engineering District 4-0)
Local residents may have to absorb whatever costs are not covered through state tax policy, local taxes and fees, or local agreements *
* e.g. County or Township Road Use Agreements
Question #2: What Do We Know About the
Long-Term Economic Development Effects of Gas Drilling?
Economic Development is measured by: • population growth • income growth • economic diversity
Why Do Rural Regions Dependent On Natural Resource Extraction Frequently
Have Poor Development Outcomes?
• Volatile revenue leads to poor government planning and lack of accountability. Yet, demands on government rise.
• “Crowding out” -- the expectation of wealth from the resource works against economic diversification, and increases the cost of doing business for other industries.
• Housing and labor costs rise.
• After the initial “ramp-up” construction phase, there are few jobs and income inequality increases.
Will Natural Gas Drilling Contribute to Economic Development in Marcellus
Shale Counties?
• Long-term effects may differ between cities and rural communities.
• Diverse economies are critical to long-term positive outcomes.
• Policy measures to mitigate costs and capture expenditures by drillers and landowners can make a difference.
• A slow ramp-up may be beneficial.
Cautionary Trends from New York and Pennsylvania Gas Drilling Counties
In New York, when compared to adjacent counties or all of non-metropolitan New York, counties with significant natural gas drilling (1994-2009) are characterized by:
1. Population loss 2. Smaller increases in real personal income
In Pennsylvania, counties with conventional gas production (1991-2005) show similar trends.
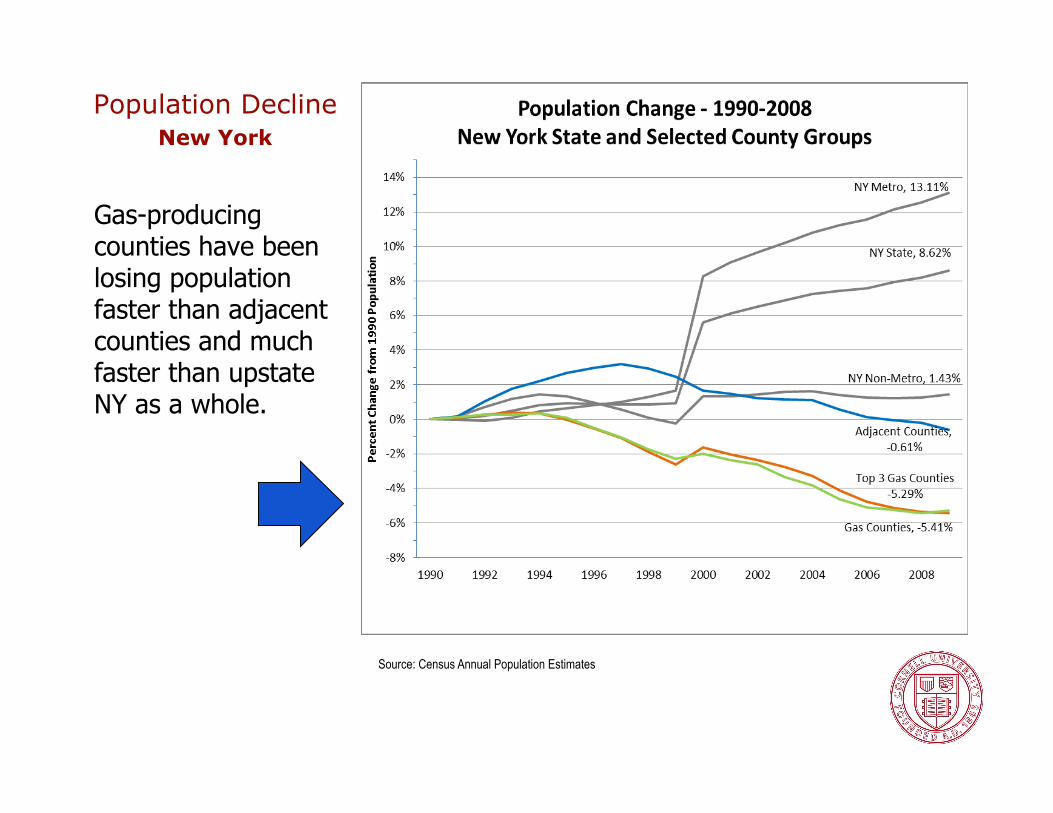
Population Decline New York
Gas-producing counties have been losing population faster than adjacent counties and much faster than upstate NY as a whole.
Source: Census Annual Population Estimates
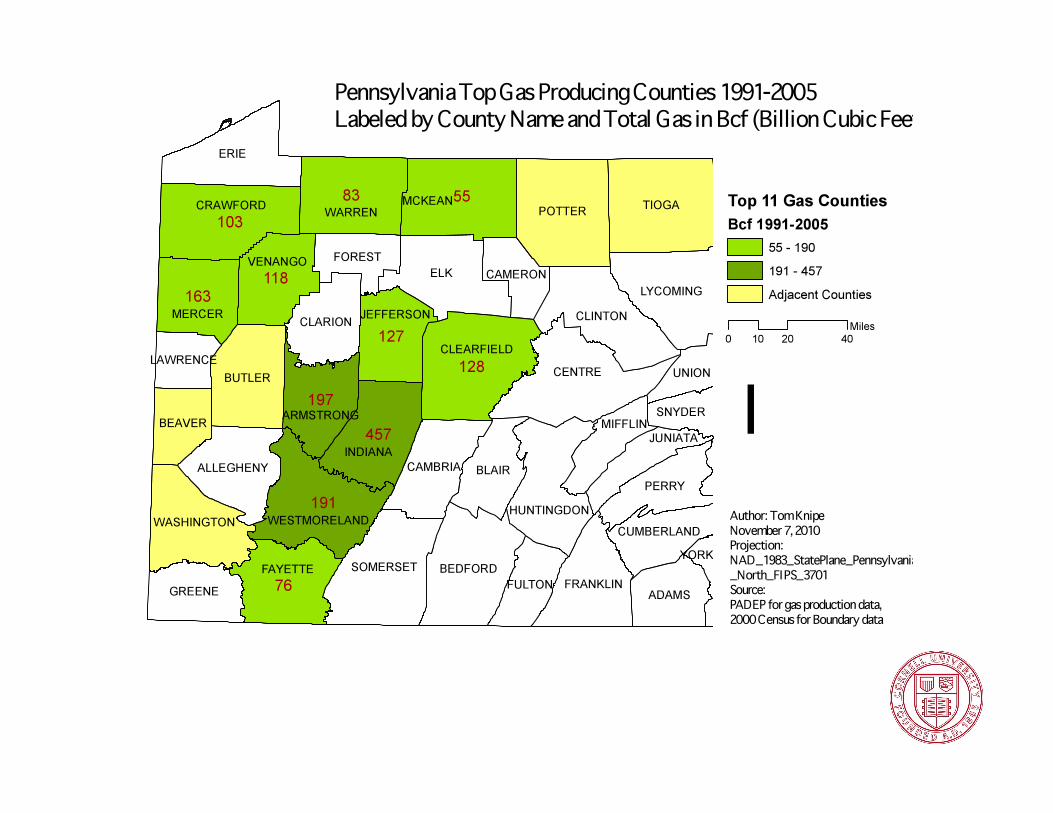
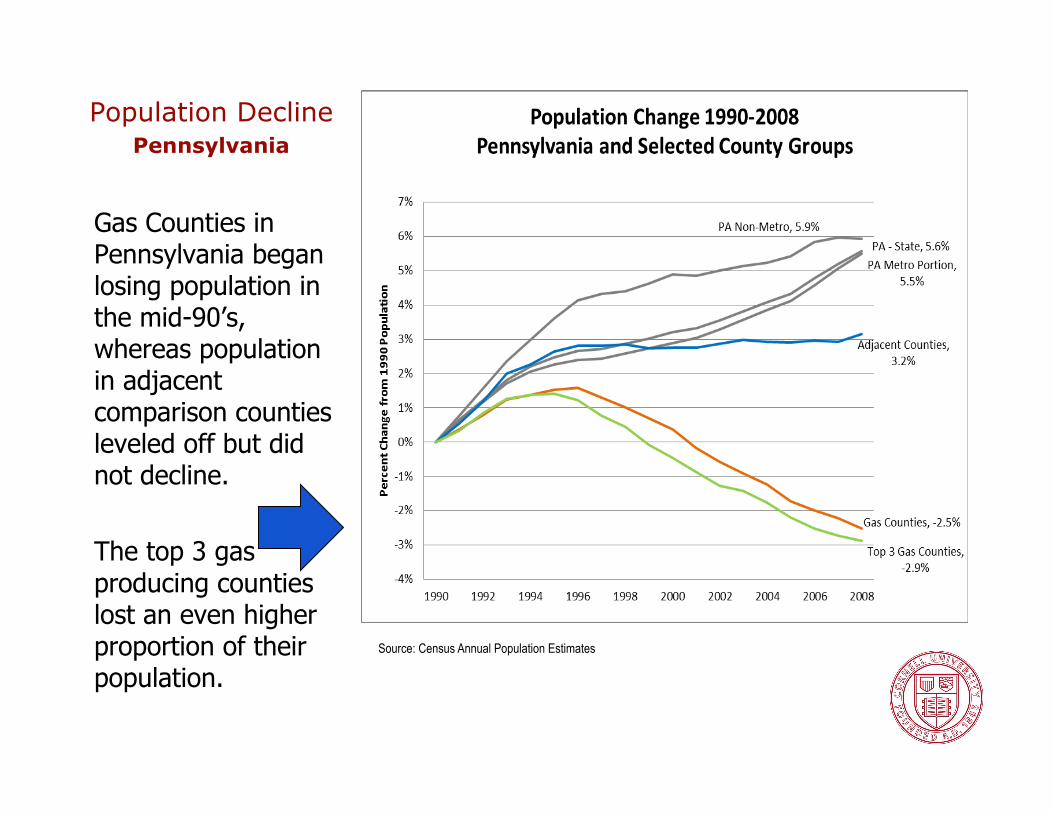
Population Decline Pennsylvania
Gas Counties in Pennsylvania began losing population in the mid-90’s, whereas population in adjacent comparison counties leveled off but did not decline.
The top 3 gas producing counties lost an even higher proportion of their population.
Source: Census Annual Population Estimates
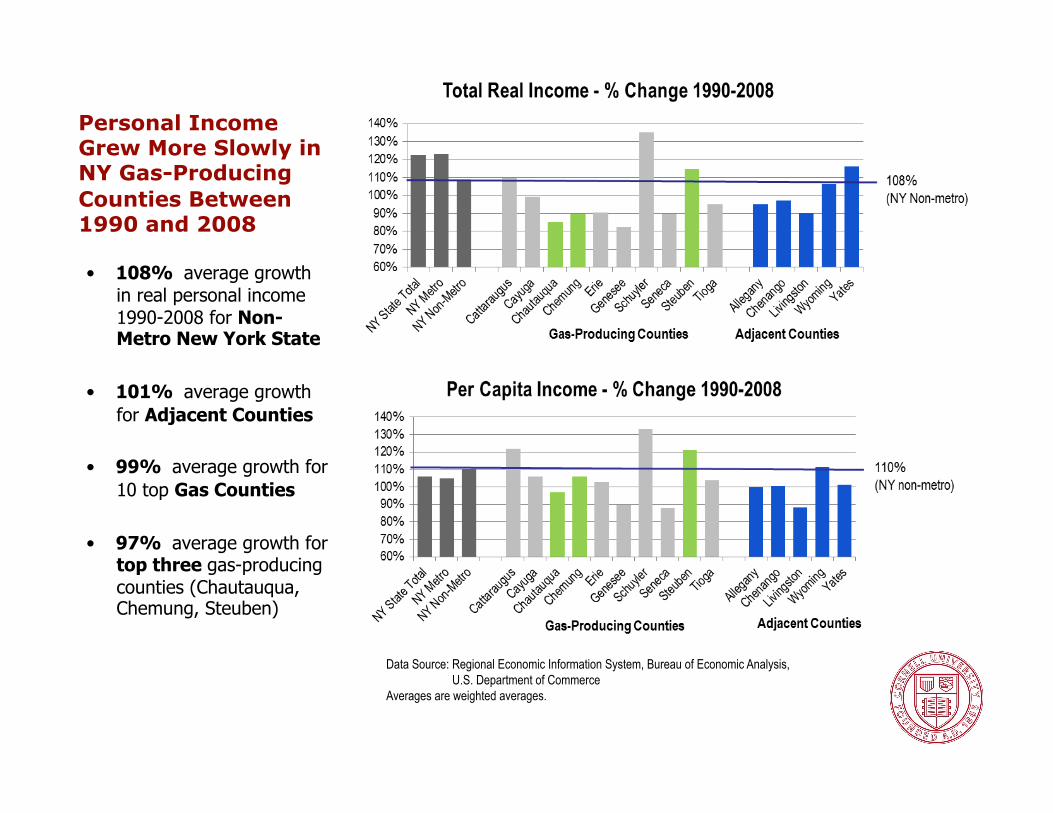
Personal Income Grew More Slowly in NY Gas-Producing Counties Between 1990 and 2008
• 108% average growth in real personal income 1990-2008 for Non-Metro New York State
• 101% average growth for Adjacent Counties
• 99% average growth for 10 top Gas Counties
• 97% average growth for top three gas-producing counties (Chautauqua, Chemung, Steuben)
Data Source: Regional Economic Information System, Bureau of Economic Analysis, U.S. Department of Commerce Averages are weighted averages.
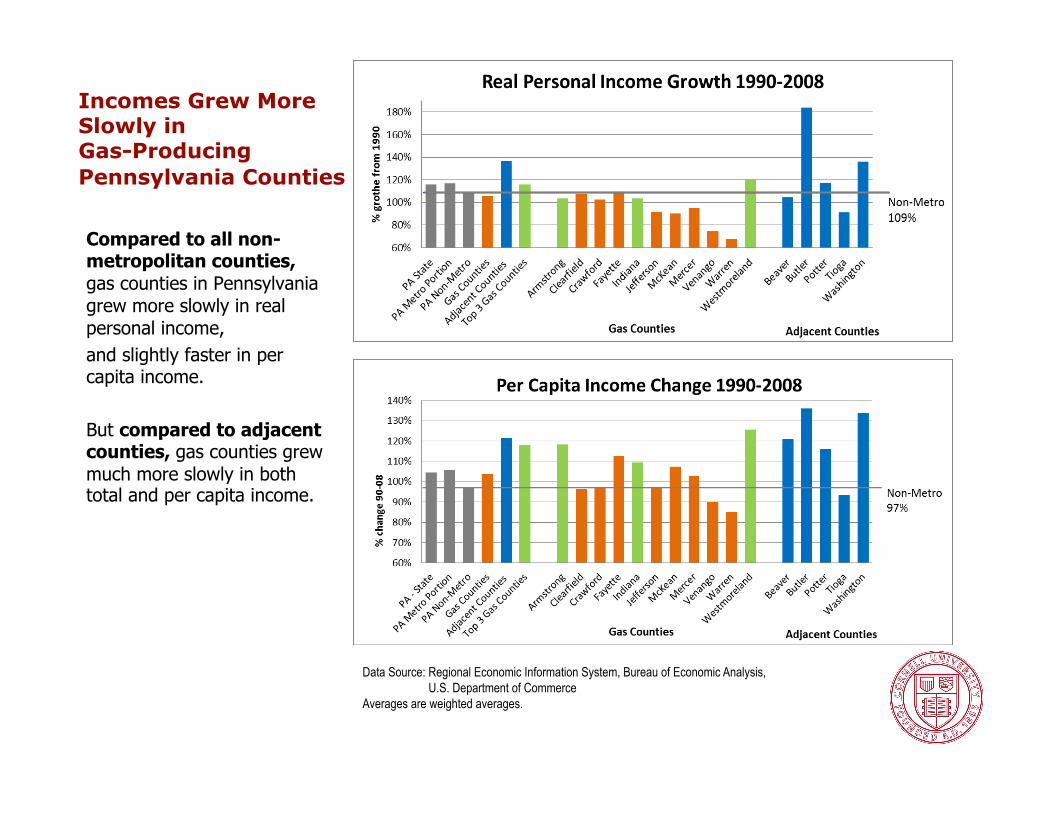
Incomes Grew More Slowly in Gas-Producing Pennsylvania Counties
Compared to all non-metropolitan counties, gas counties in Pennsylvania grew more slowly in real personal income, and slightly faster in per capita income.
But compared to adjacent counties, gas counties grew much more slowly in both total and per capita income.
Data Source: Regional Economic Information System, Bureau of Economic Analysis, U.S. Department of Commerce Averages are weighted averages.

Evidence from the Western States
When compared with peer counties, 26 counties in Western States that have at least 7% of their total jobs in resource extraction industries show:
• Less economic diversity
• Less ability to attract investment in non-extraction industries, such as retirement communities and tourism
They modestly outperformed their peer counties in growth in earnings per job and per capita income.

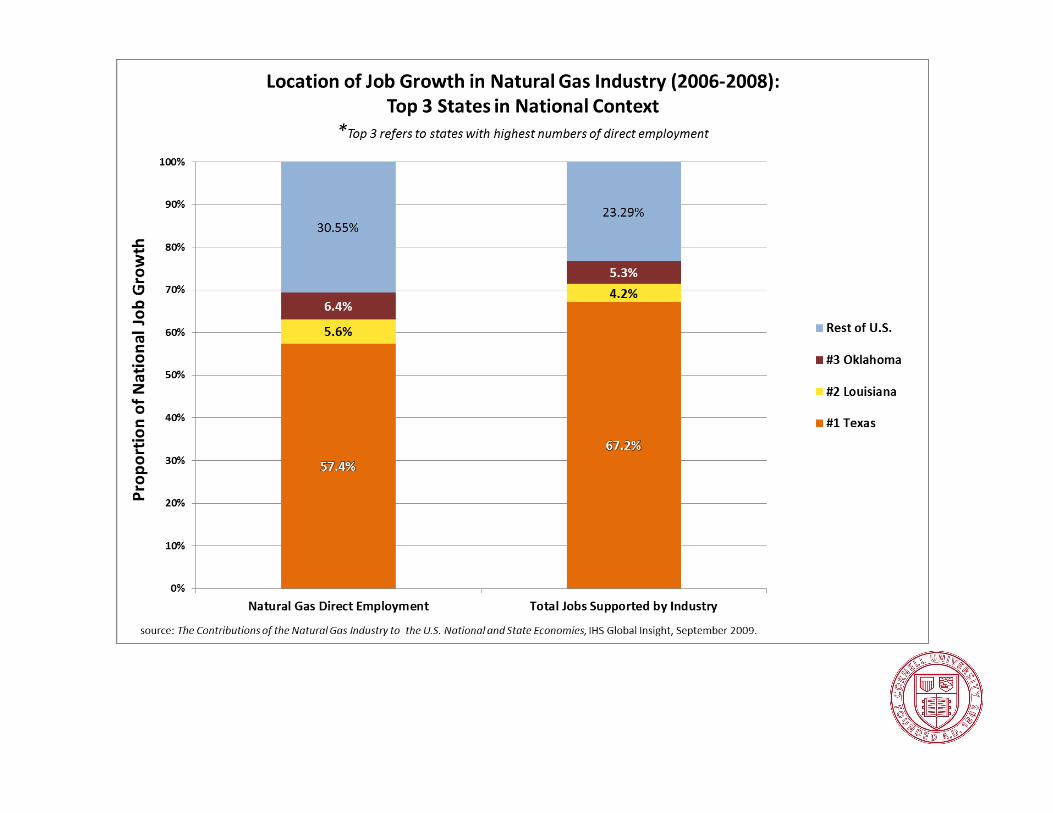
So, as Natural Gas Drilling Expands, What Places Are Likely to Benefit?
How will the economic development benefits of expanded natural gas drilling in US shale gas plays be distributed nationally?
Where will the “good” long-term jobs develop? ... Where the industry is headquartered. (i.e. Texas)
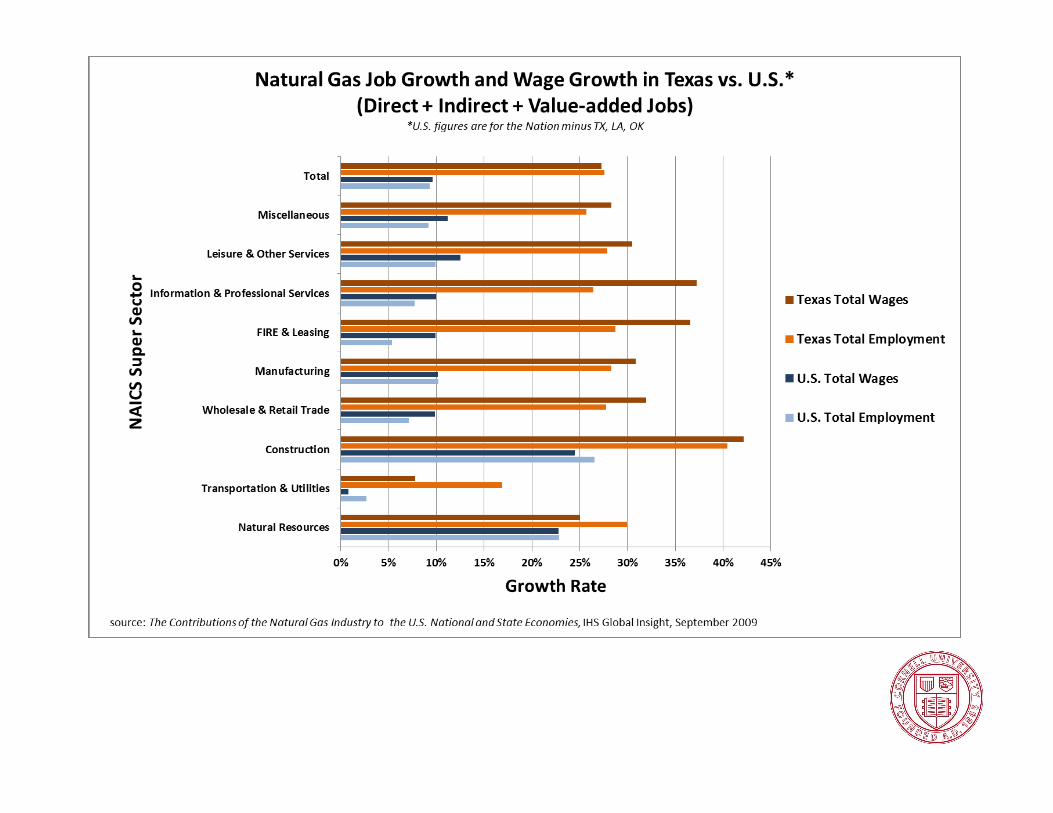
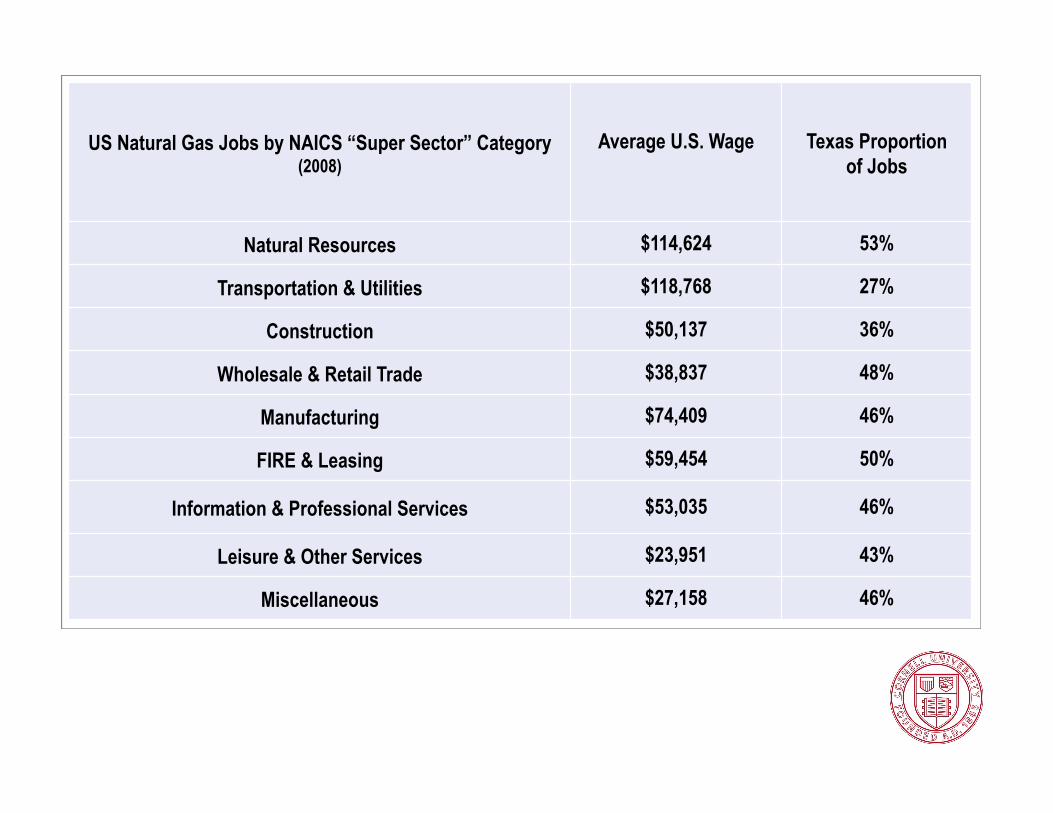
US Natural Gas Jobs by NAICS “Super Sector” Category (2008)
Average U.S. Wage Texas Proportion of Jobs
Natural Resources $114,624 53%
Transportation & Utilities $118,768 27%
Construction $50,137 36%
Wholesale & Retail Trade $38,837 48%
Manufacturing $74,409 46%
FIRE & Leasing $59,454 50%
Information & Professional Services $53,035 46%
Leisure & Other Services $23,951 43%
Miscellaneous $27,158 46%
A Summary of Preliminary Findings
1. We should plan for an accelerated, short-term production cycle.
A Summary of Preliminary Findings
2. We must better understand what will impact the pace and scale of drilling to predict how natural gas drilling will affect royalties, revenue, and jobs.
A Summary of Preliminary Findings
3. The costs to local government are significant.
Depending on the pace and scale of drilling, local governments may not have the capacity to respond to these new demands.
Effective state policies to mitigate negative effects on local communities, and to deal with environmental impacts, can make a difference.
Policy matters!
A Summary of Preliminary Findings
4. Long-term economic development from shale gas drilling is uncertain.
Long-term economic development will depend on the ability of NY and PA to capture private expenditures and public revenues in conjunction with money flowing into the states.
Policy matters!
The Project Funders We are grateful for the generous support of:
The Park Foundation
The Heinz Endowments
The Cornell Center for a Sustainable Future
The Project Team • Susan Riha • Kieran Donaghy • Rod Howe • David Kay • Ned Rightor • Isaac Argentineau • Javier Perez Burgos • Jeffrey Jacquet • Tom Knipe • Viv Li • Jack Lowe • Lydia Morken • Brian Rahm • CJ Randall • Andy Rumbach • Sam Scoppettone
Marcellus Shale Gas Drilling: What Does it Mean for Economic Development?
For further information on our work, contact:
Susan Christopherson Department of City and Regional Planning
Cornell University 607-255-8772