march 2013 italian ministry of economy and finance, treasury
TRANSCRIPT
What makes Italy attractive?
March 2013
Italian Ministry of Economy and Finance, Treasury Department
2
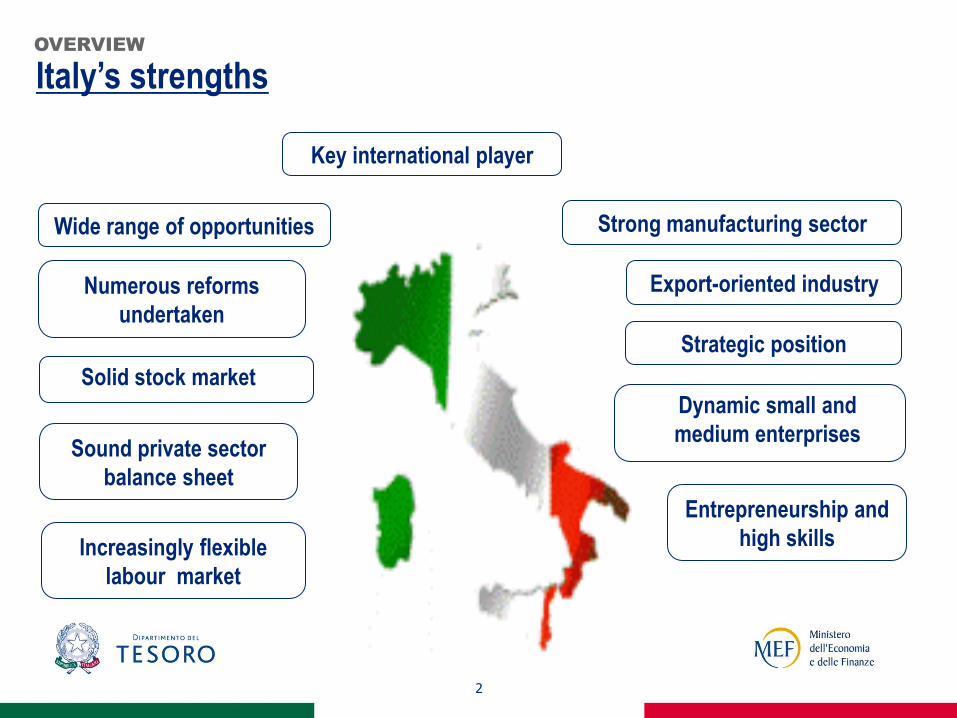
Export-oriented industry
Sound private sector
balance sheet
Strategic position
Strong manufacturing sector
Entrepreneurship and
high skills
Numerous reforms
undertaken
Key international player
Wide range of opportunities
Solid stock market
Increasingly flexible
labour market
Dynamic small and
medium enterprises
Italy’s strengths OVERVIEW
Italy in the global context
G8 member and the third largest economy in Euro Area.
One of the founders of the European Union.
An active player in the international scene.
A hinge-country between Europe and the Mediterranean
and Middle East regions.
3
KEY INTERNATIONAL PLAYER
4
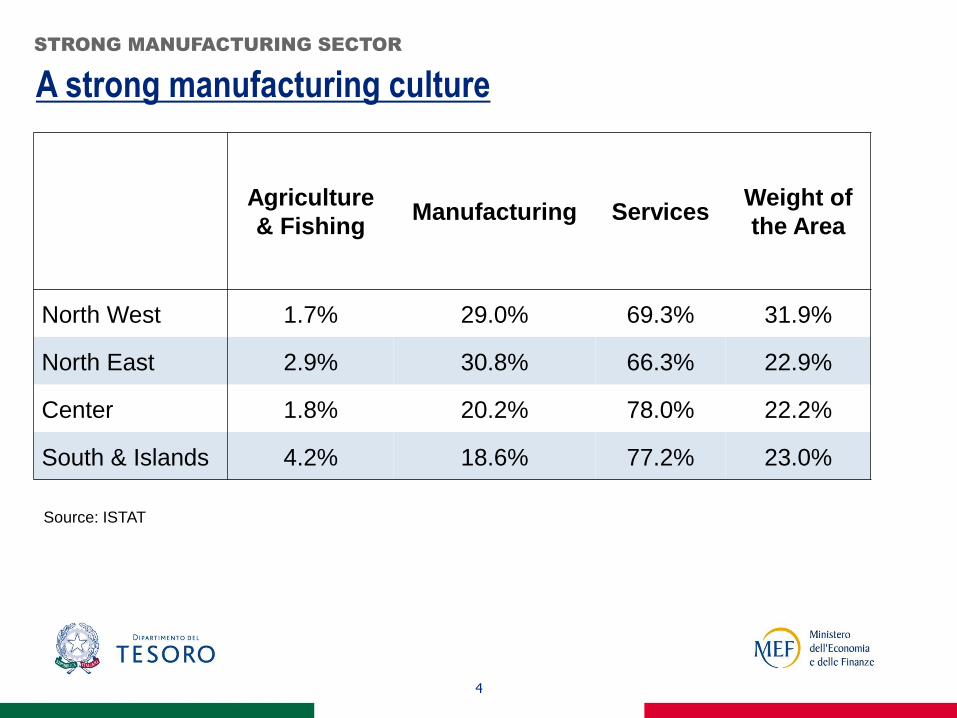
A strong manufacturing culture
STRONG MANUFACTURING SECTOR
Source: ISTAT
Agriculture
& Fishing Manufacturing Services
Weight of
the Area
North West 1.7% 29.0% 69.3% 31.9%
North East 2.9% 30.8% 66.3% 22.9%
Center 1.8% 20.2% 78.0% 22.2%
South & Islands 4.2% 18.6% 77.2% 23.0%
5
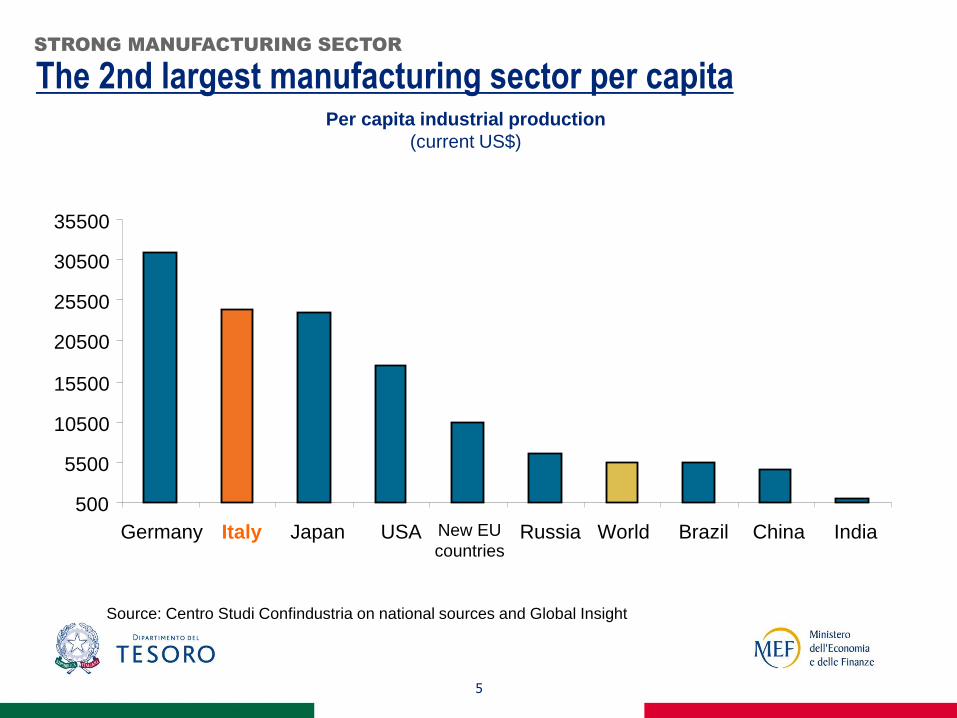
The 2nd largest manufacturing sector per capita
STRONG MANUFACTURING SECTOR
500
5500
10500
15500
20500
25500
30500
35500
Germany Italy Japan USA New EU
countries Russia World Brazil China India
Per capita industrial production
(current US$)
Source: Centro Studi Confindustria on national sources and Global Insight
6
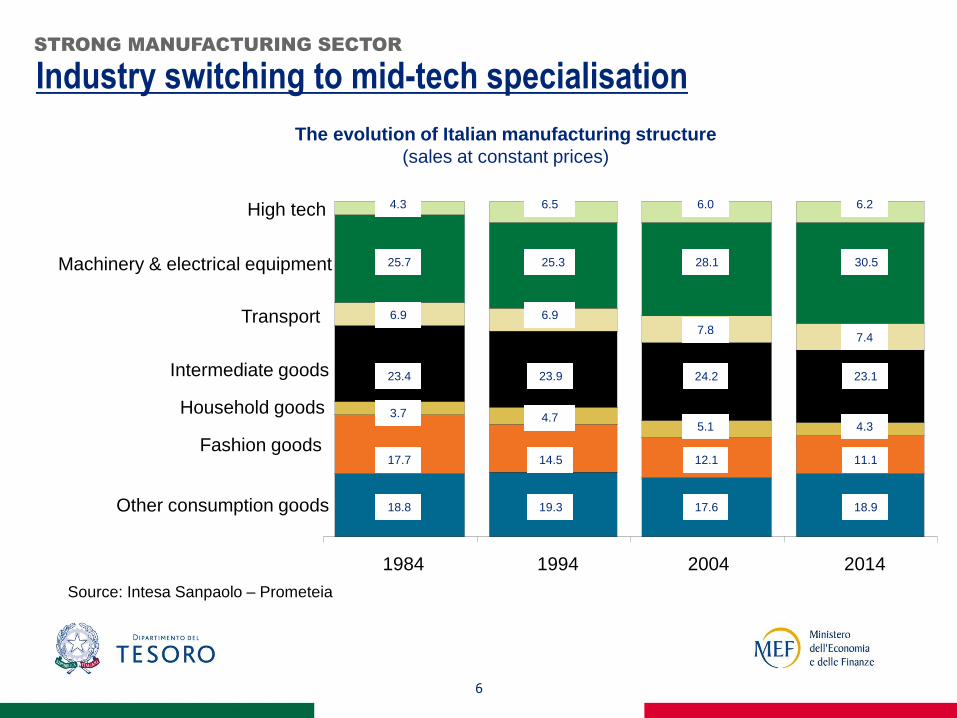
Industry switching to mid-tech specialisation STRONG MANUFACTURING SECTOR
Source: Intesa Sanpaolo – Prometeia
1984 1994 2004 2014
High tech
Machinery & electrical equipment
Transport
Fashion goods
Household goods
Intermediate goods
Other consumption goods
30.5 28.1 25.3 25.7
23.4 23.9 24.2 23.1
14.5 17.7
18.8 19.3 17.6 18.9
11.1 12.1
6.2 6.0 6.5 4.3
7.4 7.8
6.9 6.9
4.3 5.1 4.7 3.7
The evolution of Italian manufacturing structure
(sales at constant prices)
7
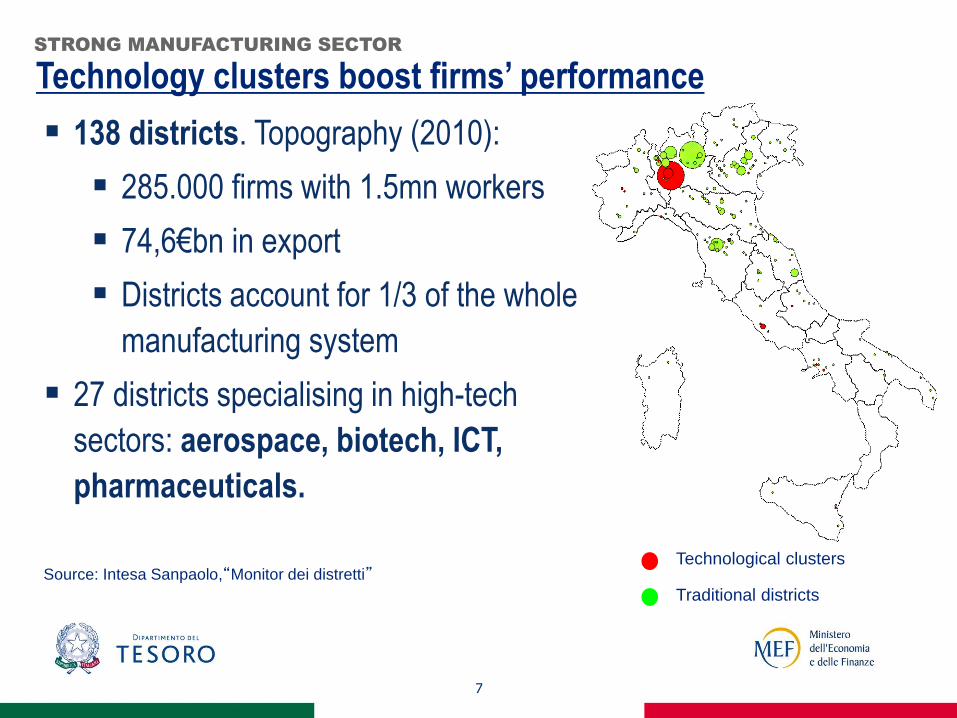
Technology clusters boost firms’ performance STRONG MANUFACTURING SECTOR
138 districts. Topography (2010):
285.000 firms with 1.5mn workers
74,6€bn in export
Districts account for 1/3 of the whole
manufacturing system
27 districts specialising in high-tech
sectors: aerospace, biotech, ICT,
pharmaceuticals.
Traditional districts
Technological clusters Source: Intesa Sanpaolo,“Monitor dei distretti”
8
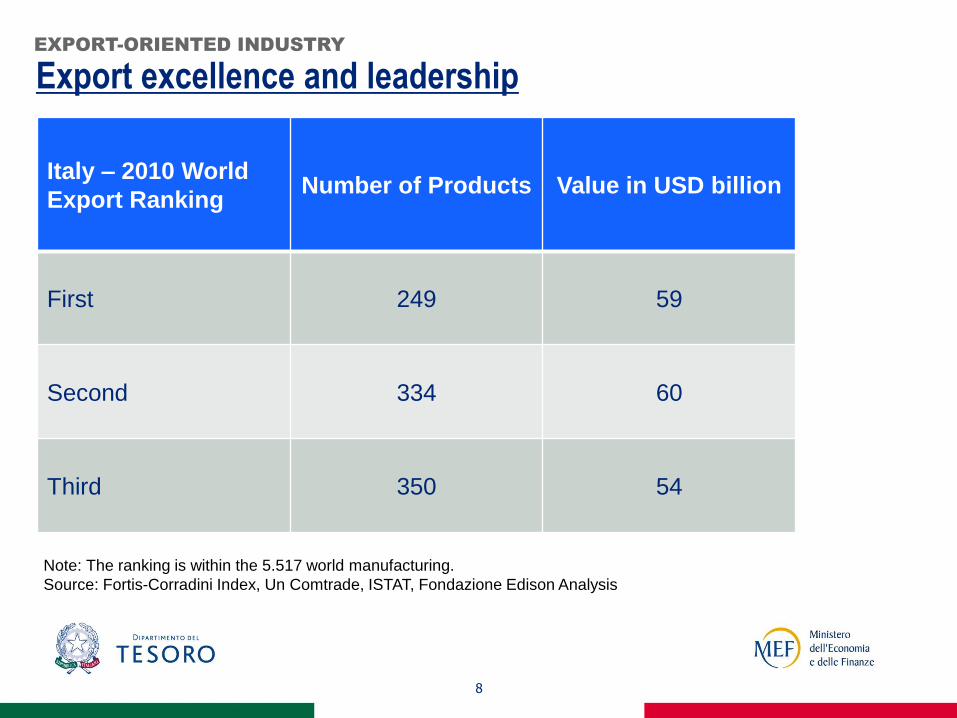
Export excellence and leadership EXPORT-ORIENTED INDUSTRY
Note: The ranking is within the 5.517 world manufacturing.
Source: Fortis-Corradini Index, Un Comtrade, ISTAT, Fondazione Edison Analysis
Italy – 2010 World
Export Ranking Number of Products Value in USD billion
First 249 59
Second 334 60
Third 350 54
9
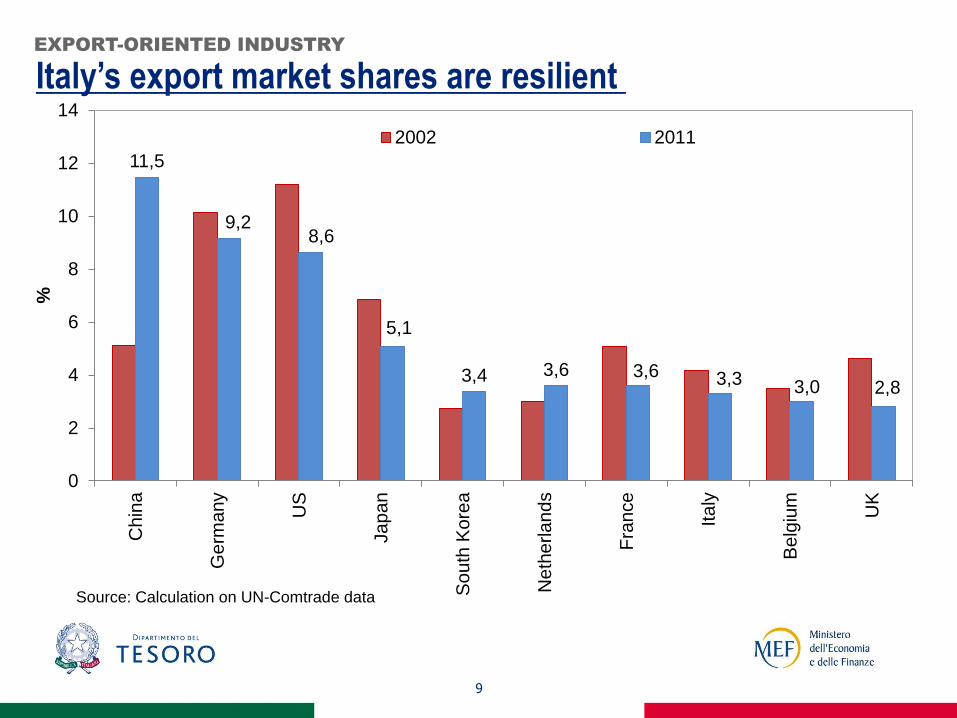
Italy’s export market shares are resilient
EXPORT-ORIENTED INDUSTRY
11,5
9,2 8,6
5,1
3,4 3,6 3,6 3,3 3,0 2,8
0
2
4
6
8
10
12
14
Ch
ina
Ge
rma
ny
US
Ja
pa
n
So
uth
Ko
rea
Ne
the
rla
nd
s
Fra
nce
Ita
ly
Be
lgiu
m
UK
%
Source: Calculation on UN-Comtrade data
2002 2011
10
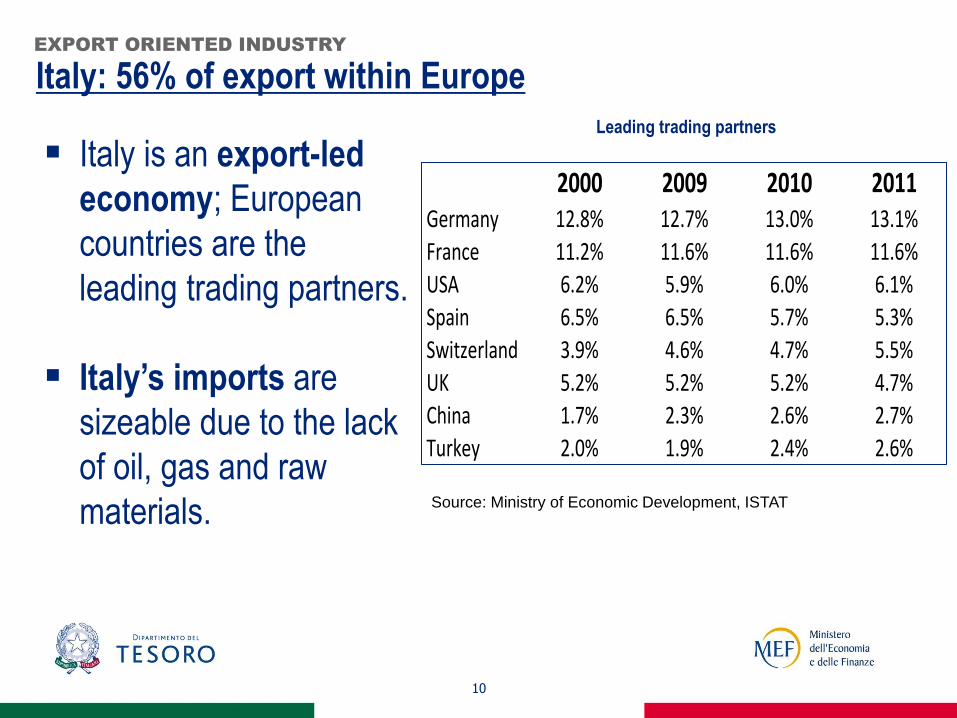
Italy: 56% of export within Europe EXPORT ORIENTED INDUSTRY
Source: Ministry of Economic Development, ISTAT
2000 2009 2010 2011Germany 12.8% 12.7% 13.0% 13.1%France 11.2% 11.6% 11.6% 11.6%
USA 6.2% 5.9% 6.0% 6.1%
Spain 6.5% 6.5% 5.7% 5.3%Switzerland 3.9% 4.6% 4.7% 5.5%
UK 5.2% 5.2% 5.2% 4.7%China 1.7% 2.3% 2.6% 2.7%
Turkey 2.0% 1.9% 2.4% 2.6%
Italy is an export-led
economy; European
countries are the
leading trading partners.
Italy’s imports are
sizeable due to the lack
of oil, gas and raw
materials.
Leading trading partners
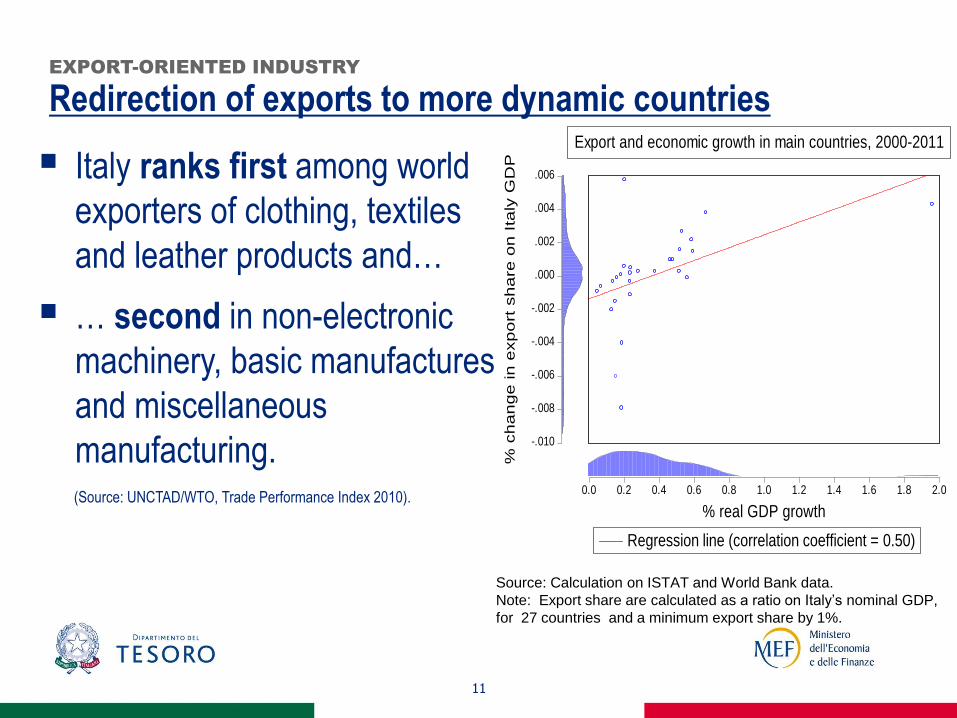
Redirection of exports to more dynamic countries
11
EXPORT-ORIENTED INDUSTRY
Italy ranks first among world
exporters of clothing, textiles
and leather products and…
… second in non-electronic
machinery, basic manufactures
and miscellaneous
manufacturing. (Source: UNCTAD/WTO, Trade Performance Index 2010).
Source: Calculation on ISTAT and World Bank data.
Note: Export share are calculated as a ratio on Italy’s nominal GDP,
for 27 countries and a minimum export share by 1%.
-.010
-.008
-.006
-.004
-.002
.000
.002
.004
.006
% c
ha
ng
e in
exp
ort
sh
are
on
Ita
ly G
DP
0.0 0.2 0.4 0.6 0.8 1.0 1.2 1.4 1.6 1.8 2.0
% real GDP growth
Regression line (correlation coefficient = 0.50)
Export and economic growth in main countries, 2000-2011
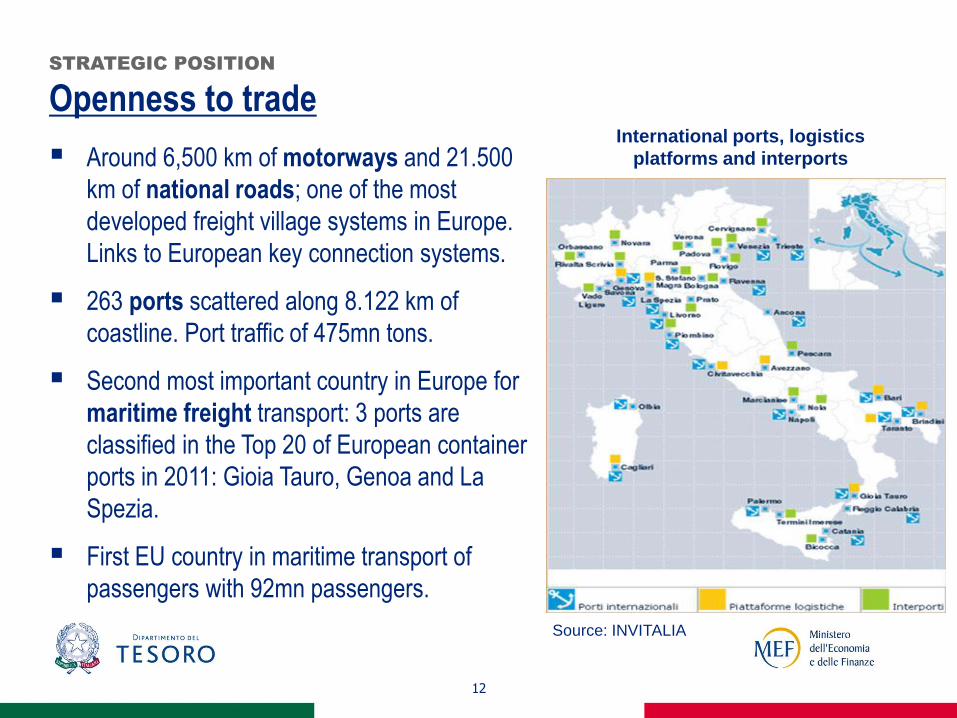
Openness to trade
12
STRATEGIC POSITION
Around 6,500 km of motorways and 21.500
km of national roads; one of the most
developed freight village systems in Europe.
Links to European key connection systems.
263 ports scattered along 8.122 km of
coastline. Port traffic of 475mn tons.
Second most important country in Europe for
maritime freight transport: 3 ports are
classified in the Top 20 of European container
ports in 2011: Gioia Tauro, Genoa and La
Spezia.
First EU country in maritime transport of
passengers with 92mn passengers.
International ports, logistics
platforms and interports
Source: INVITALIA
13
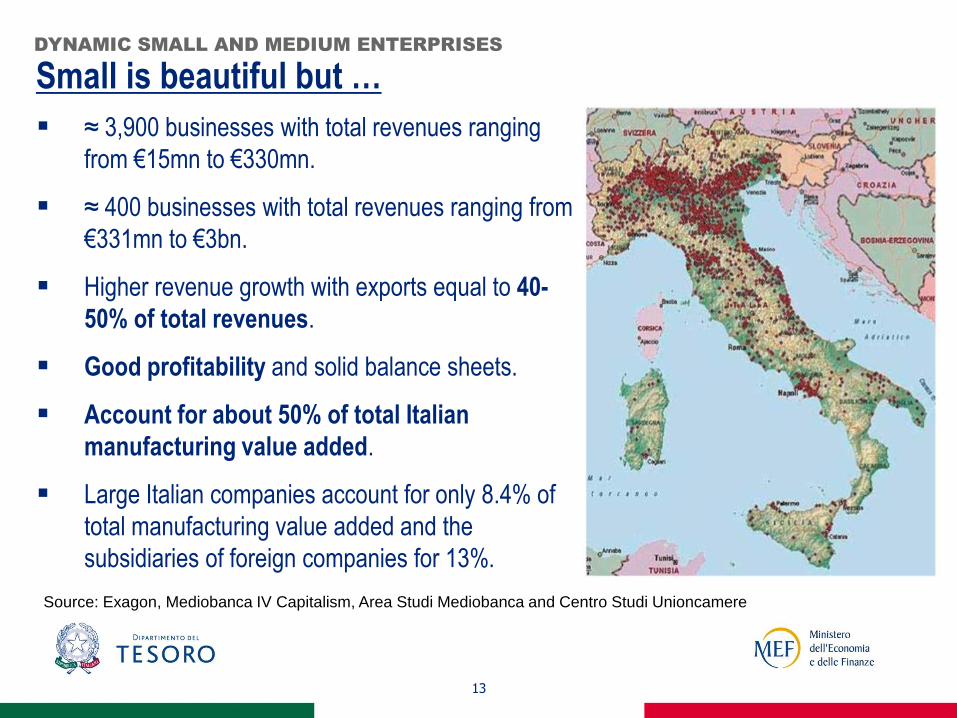
Small is beautiful but … DYNAMIC SMALL AND MEDIUM ENTERPRISES
≈ 3,900 businesses with total revenues ranging
from €15mn to €330mn.
≈ 400 businesses with total revenues ranging from
€331mn to €3bn.
Higher revenue growth with exports equal to 40-
50% of total revenues.
Good profitability and solid balance sheets.
Account for about 50% of total Italian
manufacturing value added.
Large Italian companies account for only 8.4% of
total manufacturing value added and the
subsidiaries of foreign companies for 13%.
Source: Exagon, Mediobanca IV Capitalism, Area Studi Mediobanca and Centro Studi Unioncamere
14
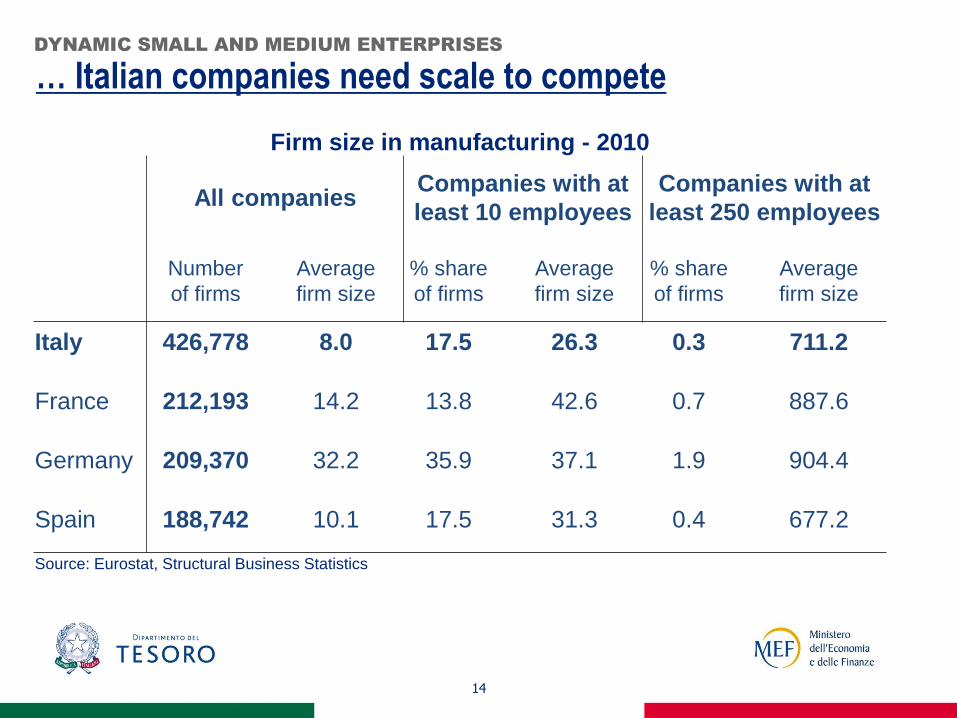
… Italian companies need scale to compete DYNAMIC SMALL AND MEDIUM ENTERPRISES
Firm size in manufacturing - 2010
All companies Companies with at
least 10 employees
Companies with at
least 250 employees
Number
of firms
Average
firm size
% share
of firms
Average
firm size
% share
of firms
Average
firm size
Italy 426,778 8.0 17.5 26.3 0.3 711.2
France 212,193 14.2 13.8 42.6 0.7 887.6
Germany 209,370 32.2 35.9 37.1 1.9 904.4
Spain 188,742 10.1 17.5 31.3 0.4 677.2
Source: Eurostat, Structural Business Statistics
15
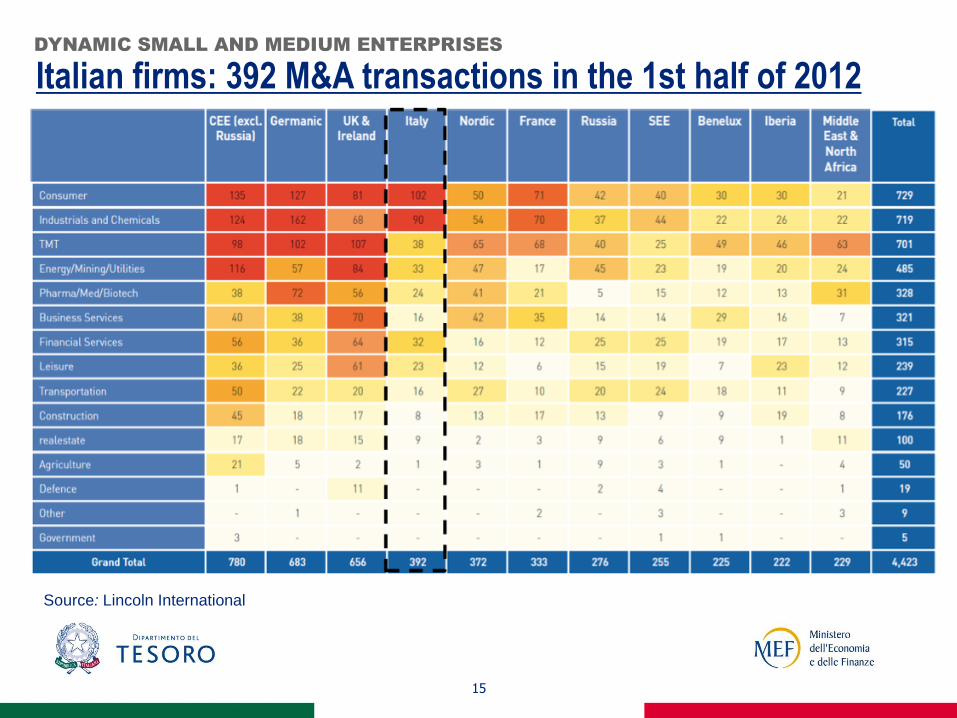
Italian firms: 392 M&A transactions in the 1st half of 2012 DYNAMIC SMALL AND MEDIUM ENTERPRISES
Source: Lincoln International
16
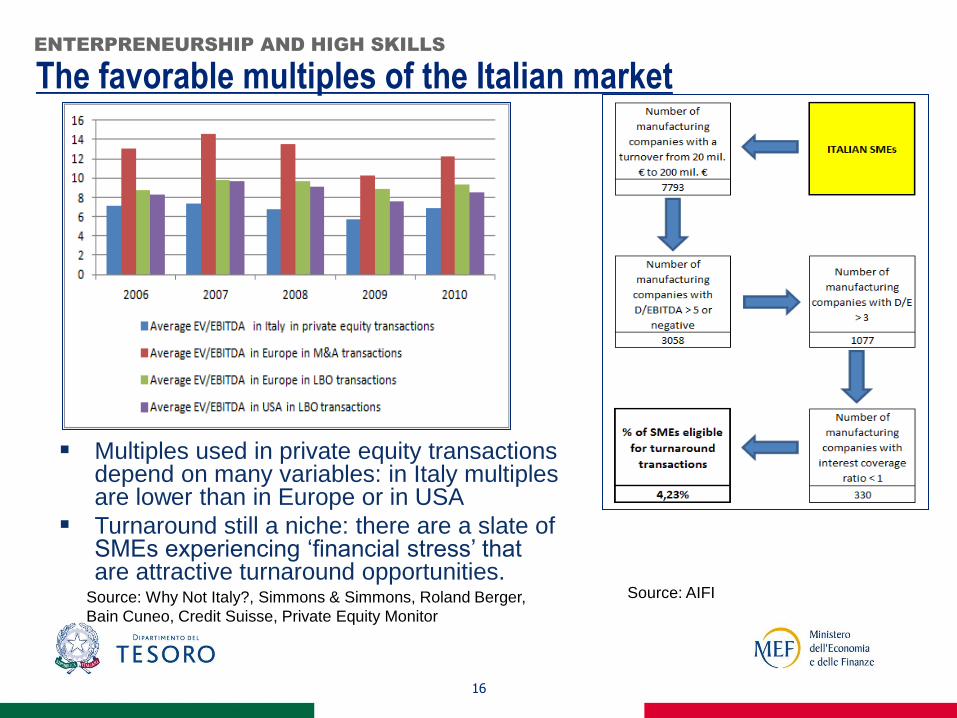
The favorable multiples of the Italian market ENTERPRENEURSHIP AND HIGH SKILLS
Multiples used in private equity transactions depend on many variables: in Italy multiples are lower than in Europe or in USA
Turnaround still a niche: there are a slate of SMEs experiencing ‘financial stress’ that are attractive turnaround opportunities.
Source: Why Not Italy?, Simmons & Simmons, Roland Berger,
Bain Cuneo, Credit Suisse, Private Equity Monitor
Source: AIFI
Entrepreneurial culture and high labour skill
17
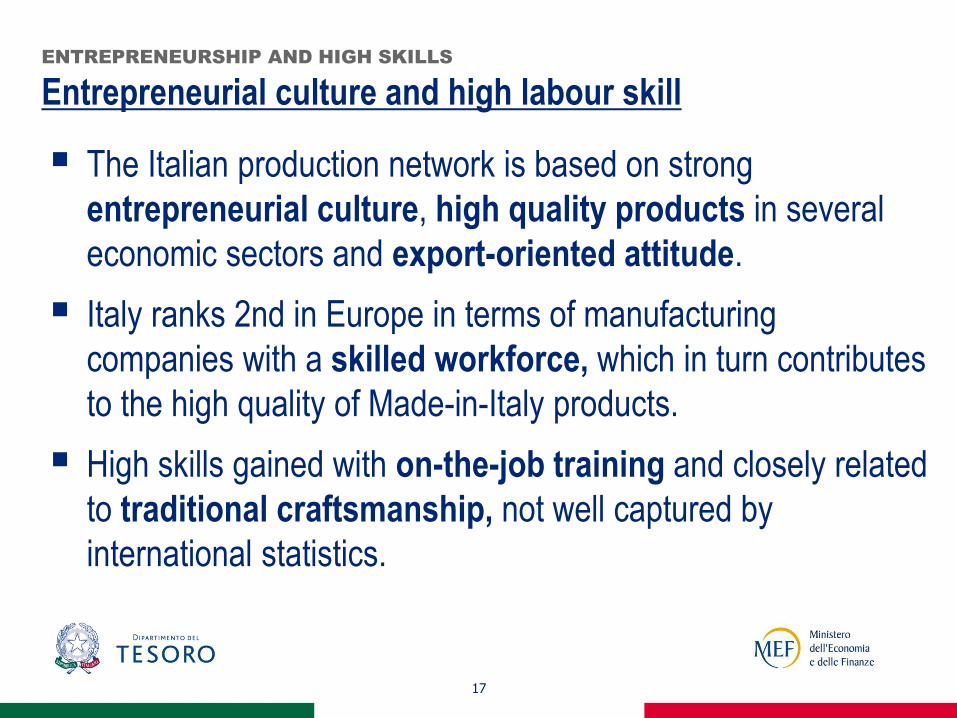
ENTREPRENEURSHIP AND HIGH SKILLS
The Italian production network is based on strong
entrepreneurial culture, high quality products in several
economic sectors and export-oriented attitude.
Italy ranks 2nd in Europe in terms of manufacturing
companies with a skilled workforce, which in turn contributes
to the high quality of Made-in-Italy products.
High skills gained with on-the-job training and closely related
to traditional craftsmanship, not well captured by
international statistics.
18
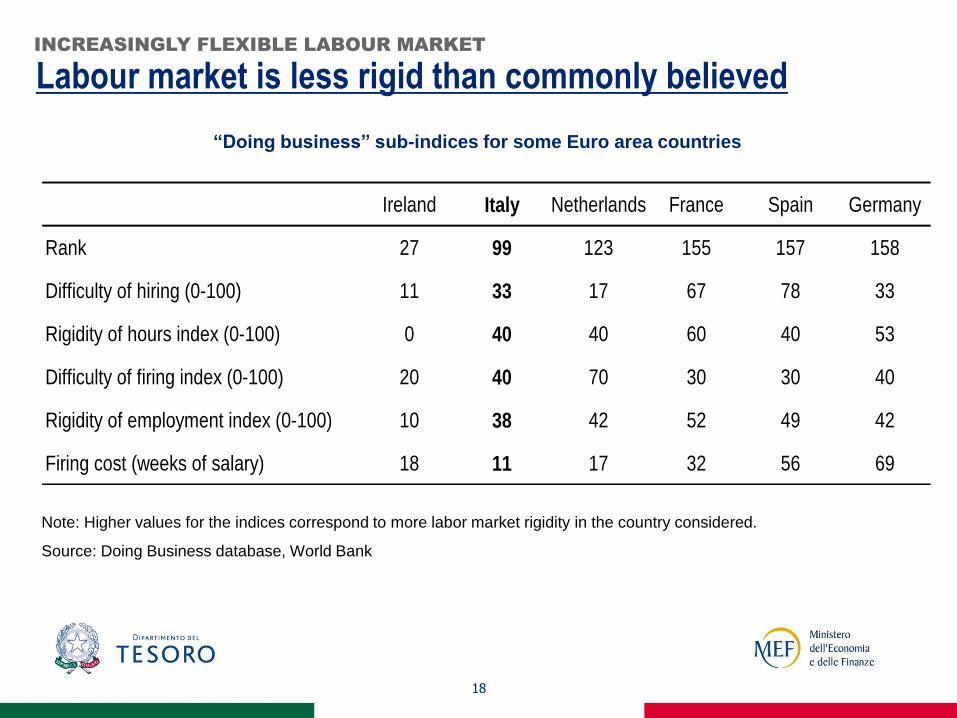
Labour market is less rigid than commonly believed INCREASINGLY FLEXIBLE LABOUR MARKET
Note: Higher values for the indices correspond to more labor market rigidity in the country considered.
Source: Doing Business database, World Bank
“Doing business” sub-indices for some Euro area countries
Ireland Italy Netherlands France Spain Germany
Rank 27 99 123 155 157 158
Difficulty of hiring (0-100) 11 33 17 67 78 33
Rigidity of hours index (0-100) 0 40 40 60 40 53
Difficulty of firing index (0-100) 20 40 70 30 30 40
Rigidity of employment index (0-100) 10 38 42 52 49 42
Firing cost (weeks of salary) 18 11 17 32 56 69
19
The recent reform has increased labour market flexibility
INCREASINGLY FLEXIBLE LABOUR MARKET
The recent labour market reform enhanced entry and exit
flexibility for apprenticeship and fixed-term contracts.
Apprenticeship is the preferential channel for young people
(up to 29 years old) to enter the labour market.
Hiring apprentices: employers benefit from fiscal incentives
for a 3-year period.
National agreement to help boosting labour productivity
Agreement between trade unions and employers’
associations to help boosting labour productivity by providing
for labour contracts that better reflect the needs of individual
companies.
A special fund is designed to cover the reduction of taxes on
productivity-linked wage increases set at local level.
A pact between generations is introduced, allowing for senior
workers to stay at work longer by smoothing retirement
transition and increasing employment of young workers.
20
INCREASINGLY FLEXIBLE LABOUR MARKET
21
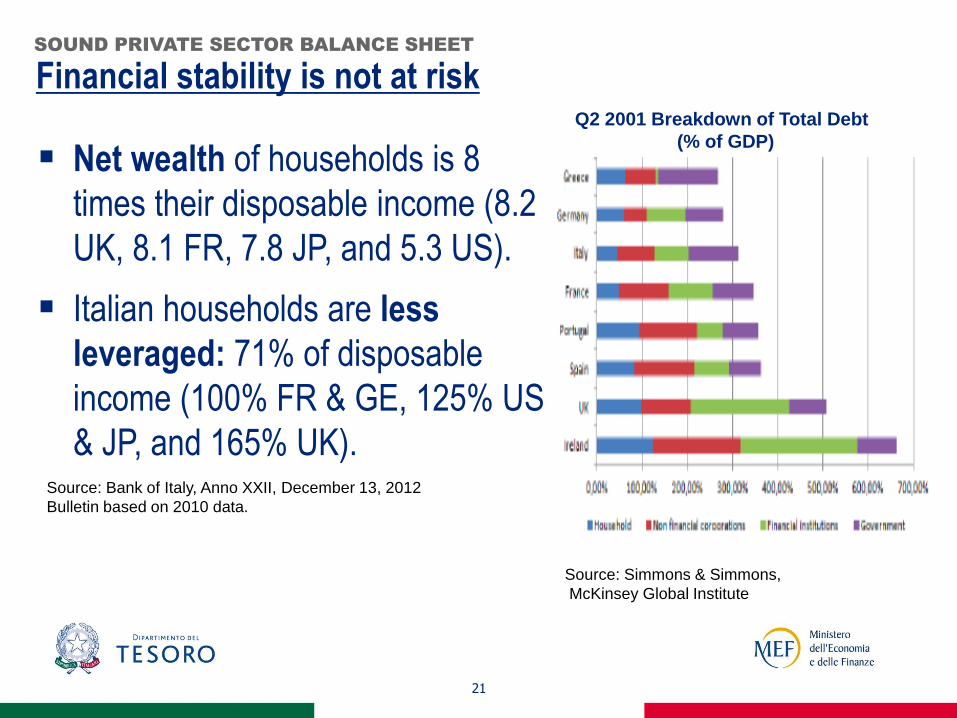
Financial stability is not at risk SOUND PRIVATE SECTOR BALANCE SHEET
Q2 2001 Breakdown of Total Debt
(% of GDP)
Source: Simmons & Simmons,
McKinsey Global Institute
Net wealth of households is 8
times their disposable income (8.2
UK, 8.1 FR, 7.8 JP, and 5.3 US).
Italian households are less
leveraged: 71% of disposable
income (100% FR & GE, 125% US
& JP, and 165% UK). Source: Bank of Italy, Anno XXII, December 13, 2012
Bulletin based on 2010 data.
22
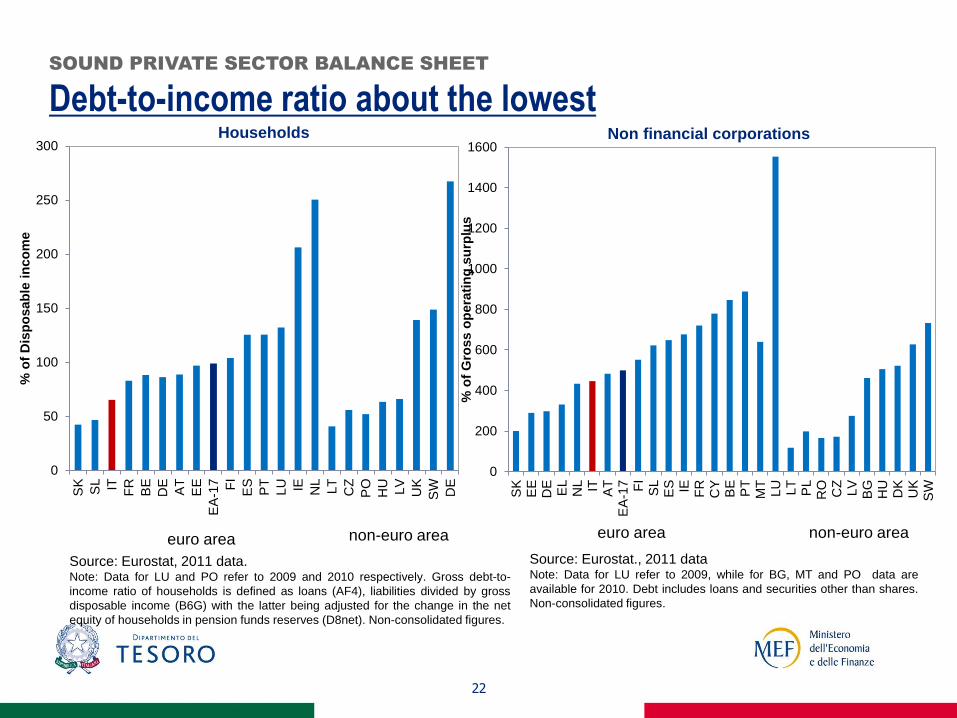
SOUND PRIVATE SECTOR BALANCE SHEET
Debt-to-income ratio about the lowest
Source: Eurostat, 2011 data. Note: Data for LU and PO refer to 2009 and 2010 respectively. Gross debt-to-
income ratio of households is defined as loans (AF4), liabilities divided by gross
disposable income (B6G) with the latter being adjusted for the change in the net
equity of households in pension funds reserves (D8net). Non-consolidated figures.
0
50
100
150
200
250
300
SK
SL IT FR
BE
DE
AT
EE
EA
-17 FI
ES
PT
LU IE NL
LT
CZ
PO
HU
LV
UK
SW DE
% o
f D
isp
osab
le i
nco
me
euro area non-euro area
Households
0
200
400
600
800
1000
1200
1400
1600
SK
EE
DE
EL
NL IT AT
EA
-17 FI
SL
ES IE FR
CY
BE
PT
MT
LU LT
PL
RO
CZ
LV
BG
HU
DK
UK
SW
% o
f G
ross o
pera
tin
g s
urp
lus
euro area non-euro area
Non financial corporations
Source: Eurostat., 2011 data Note: Data for LU refer to 2009, while for BG, MT and PO data are
available for 2010. Debt includes loans and securities other than shares.
Non-consolidated figures.
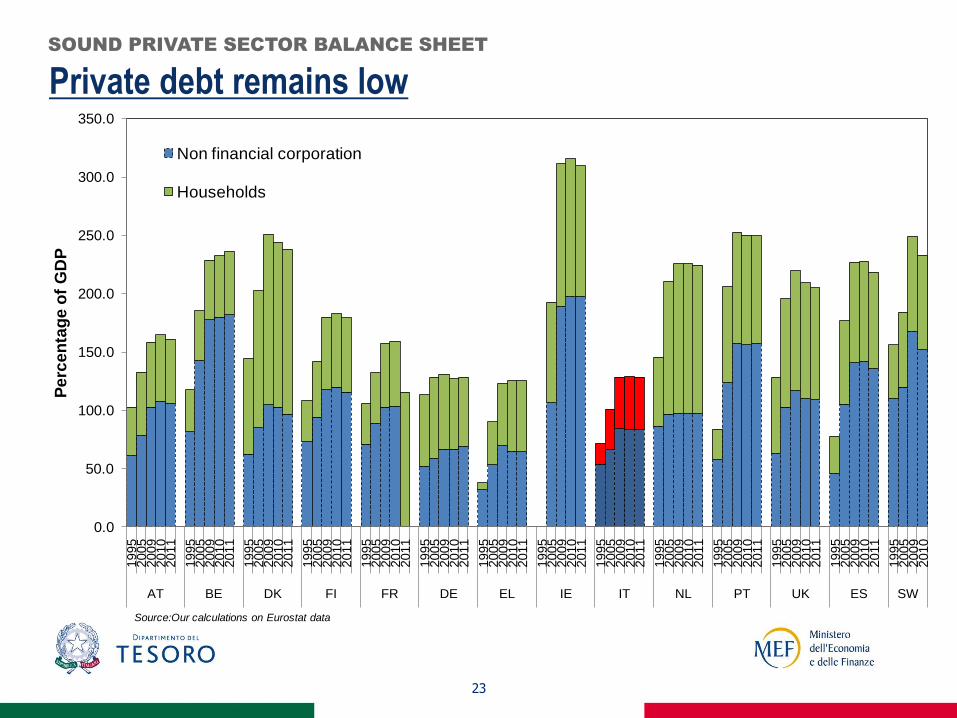
Private debt remains low
23
SOUND PRIVATE SECTOR BALANCE SHEET
0.0
50.0
100.0
150.0
200.0
250.0
300.0
350.01
99
52
00
52
00
92
01
02
01
1
19
95
20
05
20
09
20
10
20
11
19
95
20
05
20
09
20
10
20
11
19
95
20
05
20
09
20
10
20
11
19
95
20
05
20
09
20
10
20
11
19
95
20
05
20
09
20
10
20
11
19
95
20
05
20
09
20
10
20
11
19
95
20
05
20
09
20
10
20
11
19
95
20
05
20
09
20
10
20
11
19
95
20
05
20
09
20
10
20
11
19
95
20
05
20
09
20
10
20
11
19
95
20
05
20
09
20
10
20
11
19
95
20
05
20
09
20
10
20
11
19
95
20
05
20
09
20
10
AT BE DK FI FR DE EL IE IT NL PT UK ES SW
Pe
rce
nta
ge
of
GD
P
Non financial corporation
Households
Source:Our calculations on Eurostat data

24
Italian households’ wealth and its components
SOUND PRIVATE SECTOR BALANCE SHEET
Real
Estate
(62.8 % in 2011)
Financial
Assets
(37.2% in 2011)
Financial
Liabilities
(9.5% in 2011)
Net Wealth Euro
million
Houses
Source: Bank of Italy, Anno XXII, December 13, 2012 Bullettin
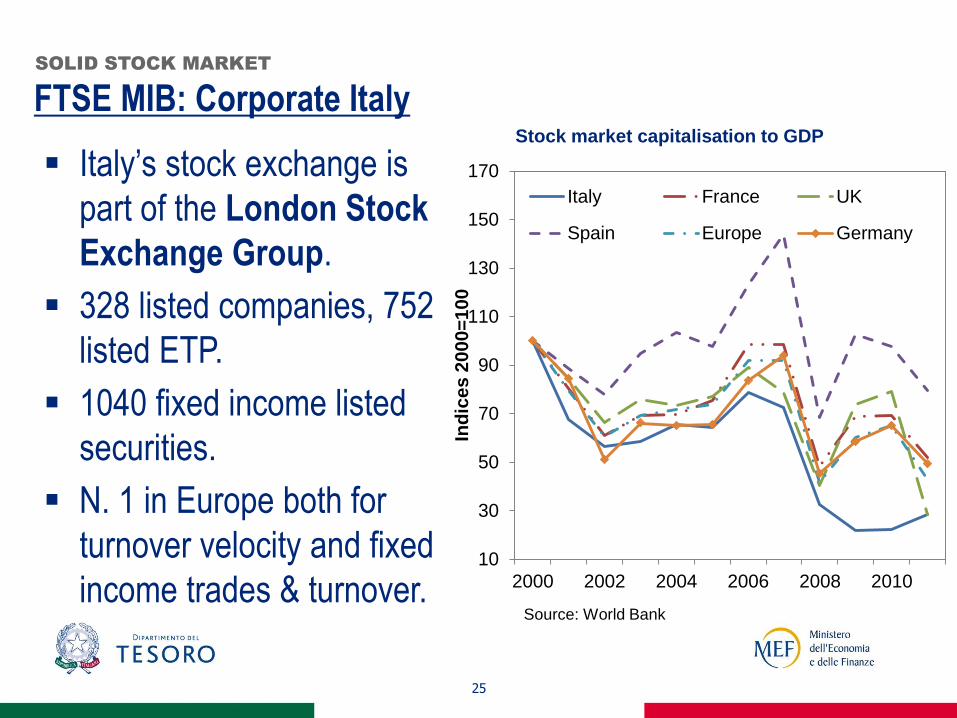
FTSE MIB: Corporate Italy
25
SOLID STOCK MARKET
10
30
50
70
90
110
130
150
170
2000 2002 2004 2006 2008 2010
Ind
ice
s 2
00
0=
10
0
Italy France UK
Spain Europe Germany
Source: World Bank
Stock market capitalisation to GDP
Italy’s stock exchange is
part of the London Stock
Exchange Group.
328 listed companies, 752
listed ETP.
1040 fixed income listed
securities.
N. 1 in Europe both for
turnover velocity and fixed
income trades & turnover.
26
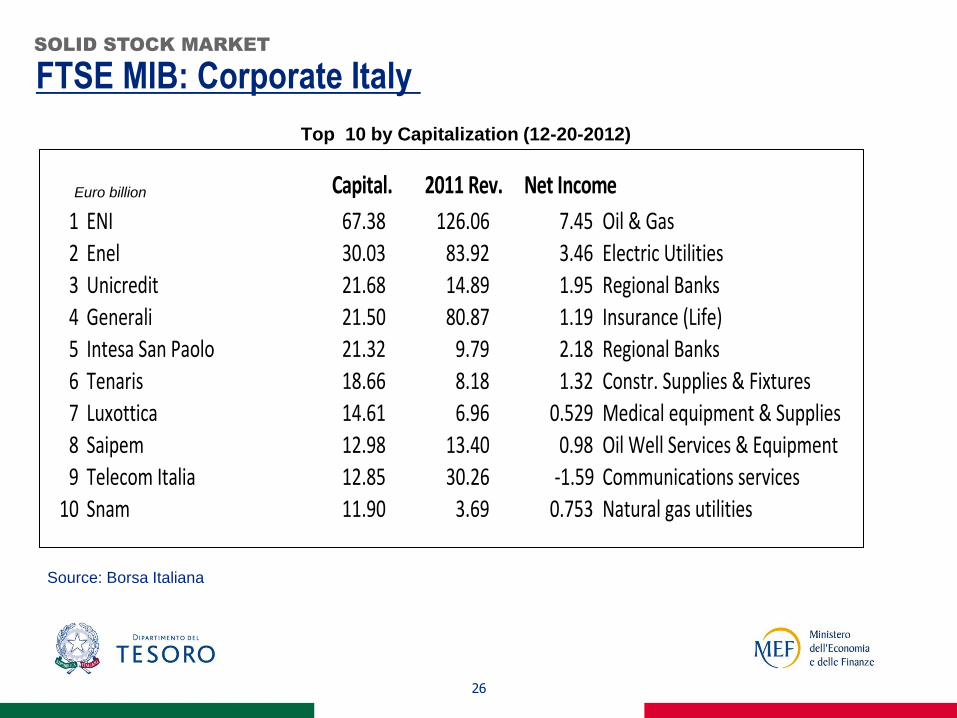
FTSE MIB: Corporate Italy SOLID STOCK MARKET
1 ENI 67.38 126.06 7.45 Oil&Gas
2 Enel 30.03 83.92 3.46 ElectricUtilities3 Unicredit 21.68 14.89 1.95 RegionalBanks4 Generali 21.50 80.87 1.19 Insurance(Life)5 IntesaSanPaolo 21.32 9.79 2.18 RegionalBanks
6 Tenaris 18.66 8.18 1.32 Constr.Supplies&Fixtures7 Luxottica 14.61 6.96 0.529 Medicalequipment&Supplies8 Saipem 12.98 13.40 0.98 OilWellServices&Equipment9 TelecomItalia 12.85 30.26 -1.59 Communicationsservices
10 Snam 11.90 3.69 0.753 Naturalgasutilities
Top 10 by Capitalization (12-20-2012)
Capital. 2011Rev. NetIncomeEuro billion
Source: Borsa Italiana
Structural reforms for a sound business environment
27
STRONG REFORM MOMENTUM
Public administration: (1) access to all services on line; (2)
certified electronic mailing for communications; (3) reduced
administrative burden especially for networks of companies.
Support to businesses: (1) Aid for Economic Growth (ACE) to
reduce the tax burden on capital investment; (2) Central
Guarantee Fund to refinance financial transactions for SMEs.
Cohesion Action Plan: (1) education and professional training;
(2) digital agenda; (3) employment; and (4) railways.
Making bankruptcy procedure easier and reducing trial length.
28
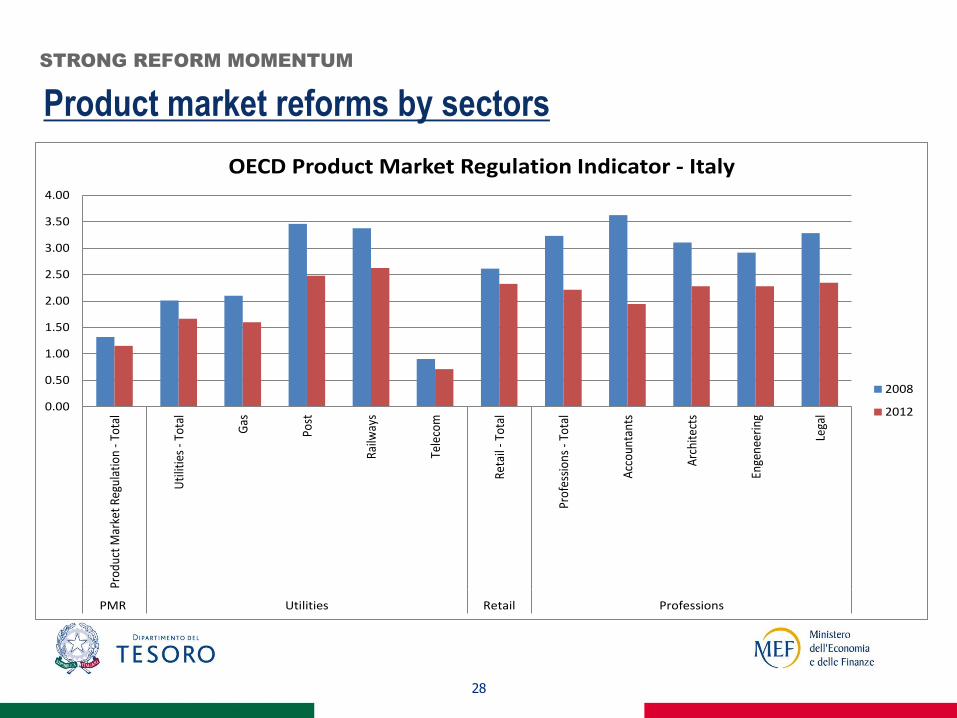
Product market reforms by sectors
0.00
0.50
1.00
1.50
2.00
2.50
3.00
3.50
4.00
Prod
uct
Mar
ket
Regu
lati
on -
Tota
l
Uti
litie
s - T
otal
Gas
Post
Railw
ays
Tele
com
Reta
il - T
otal
Prof
essi
ons
- Tot
al
Acc
ount
ants
Arc
hite
cts
Enge
neer
ing
Lega
l
PMR Utilities Retail Professions
OECD Product Market Regulation Indicator - Italy
2008
2012
STRONG REFORM MOMENTUM
A boost to competitiveness
29
STRONG REFORM MOMENTUM
Single point of contact (Desk Italia) to speed up the
internationalisation of Italian businesses and attract FDI.
Agency for Digital Italy to promote the establishment and the
development of major strategic projects.
More investment in innovation and research: (1) a special
fund for SMEs’ investment in R&D; (2) innovative start-ups to
improve innovation and youth employment

New opportunities for companies growing fast
30
Potential market of almost 60mn consumers for innovative
services (more than 30mn internet users) and products.
Countless opportunities to expand businesses in strategic
sectors such as logistics, tourism, renewable energy and
energy efficiency, green-tech and bio-tech projects.
Plan to boost infrastructure projects (€40bn funded): highways,
high speed trains, intermodal.
Financing of new projects.
WIDE RANGE OF OPPORTUNITIES

31
Sizeable reduction in pension spending due to reforms
Source: Update of 2012 Economic and Financial Document, September 20, 2012. Demographic
projections from Istat, central demographic scenario 2012
WIDE RANGE OF OPPORTUNITIES
12%
13%
14%
15%
16%
17%
18%
19%
2007 2010 2013 2016 2019 2022 2025 2028 2031 2034 2037 2040 2043 2046 2049 2052 2055 2058
Current Legislation Legislation before DL. 201/2011
Legislation before DL. 98/2011 Legislation before DL. 78/2010
Legislation before L. 243/2004
% o
f G
DP
Investment in undersized sectors due to population ageing
32
Investment opportunities both in health services and
childcare and long-term care as a result of the ageing process
and the recent pension reforms.
Recent pension reforms have made the social protection system
fully sustainable: large potential for developments in
alternative and private pension schemes.
WIDE RANGE OF OPPORTUNITIES

33
A new season for privatisation and dismissal of public assets
Conservative estimates of potential revenues from
privatisation of municipally-owned companies (some
listed) is about €200bn.
Real estate assets will be transferred from central and local
government to a real estate fund, which has a mandate to
create value and/or dismiss assets.
A political commitment to reduce the stock of debt by 1pp of
GDP per year with privatisation and dismissals.
WIDE RANGE OF OPPORTUNITIES