march 2017 the us exports economy by metro...
TRANSCRIPT

Garner Economics LLC | The US Exports Economy by Metro Area
March 2017 The US Exports Economy by Metro Area Profile and Trends for Exported Goods, 2010 to 2015
While globalization and trade are major factors in the economic performance of metropolitan areas, the conversation about exports typically focuses on national policies and trends. This brief focuses in on the role played by exports in the economies of the 381 US metropolitan statistical areas, using metro-level data on the valued of exported goods from the International Trade Administration.
author: David Versel, Principal & Analyst email [email protected] | web www.garnereconomics.com
Export growth in the US has been a major driver of the national economic recovery. From 2010 to 2015, the total value of goods exported from the US increased 17.5%, rising from $1.28 trillion to $1.50 trillion. However, only about half of US metro areas posted greater export increases than the nation, and more than one-quarter actually suffered net losses in the total value of exported goods. For this reason, it is important to understand the differences in export patterns among metro areas. The first consideration is which regions have the greatest total value of goods exports. As of 2015, there were 14 US metro areas with $20 billion or more in exports. The largest single region for exports is Houston ($97.1 billion), which jumped from $80.6 billion in 2010 due mostly to growth from the oil/gas and chemical sectors. This surge pushed Houston past New York as the national leader. There was also strong recent export growth in Seattle, Chicago, New Orleans, and Cincinnati. The only non-major metro on this list is El Paso, where a boom in the electronics sector helped its export value grow from $10.3 billion in 2010 to $24.6 billion in 2015, an increase of 138%. Exports now represent 85% of the total GDP for the entire El Paso region, by far the highest share on this list. Three of these regions – Los Angeles, Miami and Boston – actually experienced declines in the value of goods exported from 2010 to 2015.
Regions with More Than $20B in Goods Exported, 2015

Garner Economics LLC | The US Exports Economy by Metro Area 2
Regions with More Than $20B in Goods Exported, 2015 Total Goods Exported ($M)
Metro Area 2010 2015 % Change % of Metro
GDP Houston-The Woodlands-Sugar Land, TX $80,569.7 $97,054.3 20.5% 19.3%
New York-Newark-Jersey City, NY-NJ-PA $85,081.2 $95,645.4 12.4% 6.0%
Seattle-Tacoma-Bellevue, WA $35,409.6 $67,226.4 89.9% 21.4%
Los Angeles-Long Beach-Anaheim, CA $62,167.6 $61,758.7 -0.7% 6.6%
Chicago-Naperville-Elgin, IL-IN-WI $33,672.0 $44,820.9 33.1% 7.0%
Detroit-Warren-Dearborn, MI $43,964.7 $44,348.6 0.9% 18.1%
Miami-Ft. Lauderdale-W. Palm Beach, FL $35,866.9 $33,258.5 -7.3% 10.5%
Dallas-Fort Worth-Arlington, TX $22,500.4 $27,372.9 21.7% 5.6%
New Orleans-Metairie, LA $13,964.9 $27,023.3 93.5% 34.4%
San Francisco-Oakland-Hayward, CA $21,355.4 $25,061.1 17.4% 5.8%
El Paso, TX $10,315.9 $24,560.9 138.1% 85.0%
Philadelphia-Camden-Wilmington, PA-NJ-DE-MD $22,710.0 $24,236.1 6.7% 5.9%
Cincinnati-Middletown, OH-KY-IN $17,598.5 $24,127.0 37.1% 19.0%
Boston-Cambridge-Newton, MA-NH $21,804.5 $21,329.5 -2.2% 5.4%
Source: International Trade Administration; Bureau of Economic Analysis; Garner Economics
A second factor is the growth rate of exports. There were 15 US metro areas that increased their goods export base by at least 145% between 2010 and 2015. While this list does include major metro areas such as Charlotte, San Antonio, and Las Vegas, it is dominated by smaller metro areas in the south and west. Two metro areas more than tripled their goods exports between 2010 and 2015: Manhattan, KS, which had strong growth from the machinery manufacturing sector, and Gulfport-Biloxi, MS, which benefited from growth across multiple sectors. However, these regions still have a stark difference: exports account for just 2.7% of Manhattan’s total GDP, while they comprise 23.9% of GDP in the Gulfport-Biloxi region. This contrast is repeated among the fast-growth regions, as goods exports account for as little as 2.0% of total regional GDP (Gadsden, AL) and as much as 85.0% (El Paso, TX).
20 Fastest Growing Regions for Value of Goods Exported, 2010-2015

Garner Economics LLC | The US Exports Economy by Metro Area 3
20 Fastest Growing Regions for Value of Goods Exported, 2010-2015
Total Goods Exported ($M)
Metro Area 2010 2015 % Change % of Metro
GDP Manhattan, KS $19.6 $89.3 355.8% 2.7%
Gulfport-Biloxi-Pascagoula, MS $899.7 $3,986.3 343.1% 23.9%
Huntington-Ashland, WV-KY-OH $422.2 $1,557.0 268.8% 10.7%
Albuquerque, NM $519.9 $1,761.2 238.8% 4.1%
Bismarck, ND $47.2 $153.0 224.4% 1.9%
Charleston-North Charleston, SC $2,120.0 $6,457.5 204.6% 17.7%
Texarkana, TX-Texarkana, AR $64.9 $189.7 192.1% 3.7%
Amarillo, TX $168.7 $481.0 185.1% 4.0%
Kankakee-Bradley, IL $489.8 $1,310.1 167.4% 33.5%
Missoula, MT $26.0 $69.4 166.7% 1.3%
Las Cruces, NM $603.0 $1,593.7 164.3% 25.0%
Charlotte-Concord-Gastonia, NC-SC $5,424.6 $13,985.8 157.8% 9.2%
San Antonio-New Braunfels, TX $6,416.2 $15,919.2 148.1% 14.6%
Jackson, MS $541.7 $1,336.1 146.6% 4.6%
Las Vegas-Henderson-Paradise, NV $1,187.8 $2,916.2 145.5% 2.8%
Gadsden, AL $23.5 $56.6 141.2% 2.0%
Lafayette, LA $488.1 $1,165.2 138.7% 4.7%
El Paso, TX $10,315.9 $24,560.9 138.1% 85.0%
Columbus, IN $775.5 $1,811.2 133.5% 30.8%
Monroe, MI $304.0 $705.9 132.2% 15.3%
Source: International Trade Administration; Bureau of Economic Analysis; Garner Economics
A third and final consideration is the share of exports as a percentage of regional GDP. Four of the top metro areas are located directly on the US-Mexico border: Laredo, TX, El Paso, TX, El Centro, CA, and Brownsville, TX. The other regions are mainly small to midsize metro areas with major concentrations of manufacturing jobs, such as Midland, MI, Longview, WA, and Greenville, SC. The only major metro area among the top 15 is New Orleans. Most of the areas with the lowest concentration of goods exports in their economies are vacation and/or retirement areas, including: Kahului (Maui), HI; The Villages, FL; Atlantic City, NJ; Fort Walton Beach, FL, and Hilton Head, SC. Others on this list include communities with non-export functions in the oil and gas industry (Fairbanks, AK, Midland, TX), and areas with high concentration of military employees (Lawton, OK, Rapid City, SD).

Garner Economics LLC | The US Exports Economy by Metro Area 4
Top 15 and Bottom 15 Areas for Goods Exports as a Share of GDP
Metro Area Goods Exports as % of GDP,
2015 Metro Area
Goods Exports as % of GDP,
2015 TOP 15 METRO AREAS BOTTOM 15 METRO AREAS
Laredo, TX 103.7%* Kahului-Wailuku-Lahaina, HI 0.1%
El Paso, TX 85.0% Fairbanks, AK 0.2%
El Centro, CA 69.8% Rapid City, SD 0.3%
Midland, MI 66.3% California-Lexington Park, MD 0.3%
Longview, WA 59.5% The Villages, FL 0.3%
Peoria, IL 48.3% Atlantic City-Hammonton, NJ 0.3%
Brownsville-Harlingen, TX 46.1% Lawton, OK 0.3%
Kingsport-Bristol-Bristol, TN-VA 39.2% Santa Fe, NM 0.4%
Greenville-Anderson-Mauldin, SC 38.9% Midland, TX 0.5%
Beaumont-Port Arthur, TX 35.7% Crestview-Ft Walton Beach-Destin, FL 0.5%
Kokomo, IN 35.0% Cheyenne, WY 0.6%
New Orleans-Metairie, LA 34.4% Homosassa Springs, FL 0.6%
Kankakee-Bradley, IL 33.5% Ocean City, NJ 0.6%
Savannah, GA 32.0% Hilton Head-Bluffton-Beaufort, SC 0.6%
Columbus, IN 30.8% Billings, MT 0.7%
*Export value exceeds GDP due to difference in methodology between ITA and BEA data sources
Source: International Trade Administration; Bureau of Economic Analysis; Garner Economics
Taken together, these indicators paint a picture of the level of global connectivity for each metro area. Areas in which exports represent high shares of GDP tend to punch above their weight in the global marketplace. However, not all areas are equally connected to the world. For example, El Paso appears on all three lists, but its trade is almost exclusively with Mexico. Conversely, Greenville, SC is a mid-sized metro area that is home to manufacturing facilities of several major international companies such as Michelin, Lockheed Martin, Mitsubishi, and Honeywell. A full listing of goods export data for all U.S. metro areas is presented beginning on the next page. Due to data restrictions, information is not available for all 381 regions. No data were reported for 2015 for three metro areas (Flagstaff, AZ, Tuscaloosa, AL, and Yuma, AZ), and no 2010 data were reported for 27 different metro areas.

Garner Economics LLC | The US Exports Economy by Metro Area 5
U.S. Metro Areas: Global Goods Export Data 2010 and 2015 Totals in $Millions
Metro Area 2010 2015 % Change % of Metro
GDP, 2015
Abilene, TX $46.8 $99.5 112.7% 1.5%
Akron, OH $3,144.8 $3,019.3 -4.0% 8.8%
Albany, GA $179.7 $329.1 83.2% 6.4%
Albany, OR NA $649.7 NA 18.2%
Albany-Schenectady-Troy, NY $3,362.9 $4,470.3 32.9% 8.7%
Albuquerque, NM $519.9 $1,761.2 238.8% 4.1%
Alexandria, LA $71.0 $111.0 56.3% 2.1%
Allentown-Bethlehem-Easton, PA-NJ $2,555.7 $3,439.9 34.6% 9.3%
Altoona, PA $221.0 $276.7 25.2% 5.5%
Amarillo, TX $168.7 $481.0 185.1% 4.0%
Ames, IA $222.2 $261.7 17.8% 5.3%
Anchorage, AK NA $421.9 NA 1.5%
Ann Arbor, MI $1,050.8 $1,053.0 0.2% 5.0%
Anniston-Oxford-Jacksonville, AL $209.6 $281.1 34.1% 7.4%
Appleton, WI $1,055.9 $837.9 -20.6% 6.8%
Asheville, NC $845.4 $1,144.4 35.4% 6.8%
Athens-Clarke County, GA $194.6 $327.4 68.2% 4.0%
Atlanta-Sandy Springs-Roswell, GA $15,009.7 $19,163.9 27.7% 5.6%
Atlantic City-Hammonton, NJ $62.0 $39.6 -36.1% 0.3%
Auburn-Opelika, AL $351.2 $438.4 24.8% 8.8%
Augusta-Richmond County, GA-SC $1,103.8 $1,153.4 4.5% 5.2%
Austin-Round Rock, TX $8,867.8 $10,094.5 13.8% 8.4%
Bakersfield-Delano, CA $2,147.9 $2,696.8 25.6% 7.5%
Baltimore-Columbia-Towson, MD $5,213.1 $6,047.2 16.0% 3.3%
Bangor, ME $96.9 $129.2 33.3% 2.2%
Barnstable Town, MA $117.5 $112.2 -4.5% 1.0%
Baton Rouge, LA $3,784.2 $6,505.4 71.9% 12.1%
Battle Creek, MI $657.3 $1,085.1 65.1% 19.1%
Bay City, MI $195.7 $243.4 24.4% 7.7%
Beaumont-Port Arthur, TX $3,835.6 $8,794.5 129.3% 35.7%
Beckley, WV NA $37.4 NA 0.8%
Bellingham, WA $1,142.5 $2,044.9 79.0% 20.6%
Bend-Redmond, OR $89.1 $149.3 67.5% 2.0%
Billings, MT $86.7 $66.8 -22.9% 0.7%
Binghamton, NY $542.1 $431.4 -20.4% 4.6%
Birmingham-Hoover, AL $1,687.8 $1,791.2 6.1% 2.8%
Bismarck, ND $47.2 $153.0 224.4% 1.9%
Blacksburg-Christiansburg-Radford, VA $920.1 $1,070.3 16.3% 16.0%
Bloomington, IL $190.1 $259.2 36.4% 2.5%
Bloomington, IN $717.7 $1,107.4 54.3% 16.7%
Bloomsburg-Berwick, PA NA $214.4 NA 5.6%
Boise City-Nampa, ID $3,647.7 $2,668.0 -26.9% 8.8%
Boston-Cambridge-Newton, MA-NH $21,804.5 $21,329.5 -2.2% 5.4%
Boulder, CO $1,058.7 $1,039.1 -1.9% 4.4%
Bowling Green, KY $223.4 $282.0 26.2% 4.3%
Bremerton-Silverdale, WA $64.1 $80.1 24.9% 0.8%

Garner Economics LLC | The US Exports Economy by Metro Area 6
Metro Area 2010 2015 % Change % of Metro
GDP, 2015
Bridgeport-Stamford-Norwalk, CT $9,339.6 $9,207.5 -1.4% 9.1%
Brownsville-Harlingen, TX $3,968.2 $4,412.5 11.2% 46.1%
Brunswick, GA $629.9 $986.3 56.6% 27.3%
Buffalo-Cheektowaga-Niagara Falls, NY $3,792.1 $4,684.6 23.5% 8.3%
Burlington, NC $237.8 $283.5 19.2% 5.6%
Burlington-South Burlington, VT $3,579.9 $2,089.4 -41.6% 16.2%
California-Lexington Park, MD NA $15.3 NA 0.3%
Canton-Massillon, OH $1,523.5 $1,143.1 -25.0% 6.6%
Cape Coral-Fort Myers, FL $298.0 $487.3 63.5% 1.9%
Cape Girardeau, MO-IL $112.6 $117.4 4.2% 3.1%
Carbondale-Marion, IL NA $231.7 NA 4.7%
Carson City, NV $147.1 $119.2 -19.0% 3.9%
Casper, WY $74.4 $43.9 -41.1% 0.7%
Cedar Rapids, IA $749.5 $873.5 16.5% 4.8%
Chambersburg-Waynesboro, PA NA $475.3 NA 9.5%
Champaign-Urbana, IL $871.5 $952.3 9.3% 8.7%
Charleston, WV $1,783.4 $417.0 -76.6% 3.0%
Charleston-North Charleston, SC $2,120.0 $6,457.5 204.6% 17.7%
Charlotte-Concord-Gastonia, NC-SC $5,424.6 $13,985.8 157.8% 9.2%
Charlottesville, VA $252.0 $167.6 -33.5% 1.4%
Chattanooga, TN-GA $1,012.5 $1,200.6 18.6% 4.9%
Cheyenne, WY $24.1 $31.4 30.1% 0.6%
Chicago-Naperville-Elgin, IL-IN-WI $33,672.0 $44,820.9 33.1% 7.0%
Chico, CA $244.7 $294.9 20.5% 3.9%
Cincinnati-Middletown, OH-KY-IN $17,598.5 $24,127.0 37.1% 19.0%
Clarksville, TN-KY $238.3 $296.5 24.4% 2.7%
Cleveland, TN $171.6 $276.1 60.9% 6.1%
Cleveland-Elyria, OH $10,260.9 $9,629.7 -6.2% 7.5%
Coeur d'Alene, ID $310.9 $203.1 -34.7% 3.9%
College Station-Bryan, TX $65.4 $122.5 87.4% 1.3%
Colorado Springs, CO $1,193.1 $832.4 -30.2% 2.8%
Columbia, MO $255.6 $214.0 -16.3% 2.6%
Columbia, SC $1,511.3 $2,011.8 33.1% 5.2%
Columbus, GA-AL $341.8 $530.8 55.3% 3.9%
Columbus, IN $775.5 $1,811.2 133.5% 30.8%
Columbus, OH $3,554.4 $6,201.6 74.5% 5.0%
Corpus Christi, TX $2,842.4 $5,187.9 82.5% 22.6%
Corvallis, OR $319.7 $237.7 -25.6% 5.4%
Crestview-Fort Walton Beach-Destin, FL $124.1 $67.6 -45.6% 0.5%
Cumberland, MD-WV $28.7 $30.0 4.5% 1.0%
Dallas-Fort Worth-Arlington, TX $22,500.4 $27,372.9 21.7% 5.6%
Dalton, GA $437.2 $493.2 12.8% 8.2%
Danville, IL $217.8 $271.4 24.6% 9.9%
Daphne-Fairhope-Foley, AL NA $880.2 NA 12.9%
Davenport-Moline-Rock Island, IA-IL $4,792.8 $5,711.8 19.2% 29.2%
Dayton, OH $2,509.8 $2,991.1 19.2% 7.6%
Decatur, AL $819.4 $563.4 -31.2% 10.4%
Decatur, IL NA $1,833.9 NA 29.6%

Garner Economics LLC | The US Exports Economy by Metro Area 7
Metro Area 2010 2015 % Change % of Metro
GDP, 2015
Deltona-Daytona Beach-Ormond Beach, FL $437.5 $419.4 -4.1% 2.8%
Denver-Aurora-Lakewood, CO $4,990.9 $3,909.5 -21.7% 2.0%
Des Moines-West Des Moines, IA $767.9 $1,047.8 36.5% 2.3%
Detroit-Warren-Dearborn, MI $43,964.7 $44,348.6 0.9% 18.1%
Dothan, AL $173.2 $221.4 27.8% 4.3%
Dover, DE $60.9 $55.0 -9.7% 0.8%
Dubuque, IA $121.0 $136.5 12.9% 2.5%
Duluth, MN-WI $658.9 $574.4 -12.8% 4.6%
Durham-Chapel Hill, NC $2,736.6 $2,807.2 2.6% 6.3%
East Stroudsburg, PA NA $77.5 NA 1.3%
Eau Claire, WI $479.8 $813.2 69.5% 10.1%
El Centro, CA $2,452.7 $4,152.0 69.3% 69.8%
El Paso, TX $10,315.9 $24,560.9 138.1% 85.0%
Elizabethtown-Fort Knox, KY $148.1 $282.8 90.9% 4.5%
Elkhart-Goshen, IN $1,514.0 $1,532.3 1.2% 10.7%
Elmira, NY $139.3 $183.9 32.0% 5.4%
Erie, PA $1,063.3 $1,482.5 39.4% 13.6%
Eugene-Springfield, OR $415.5 $400.2 -3.7% 2.8%
Evansville, IN-KY $2,793.3 $4,483.7 60.5% 25.8%
Fairbanks, AK NA $8.8 NA 0.2%
Fargo, ND-MN $548.6 $543.2 -1.0% 3.5%
Farmington, NM $24.1 $43.8 81.7% 0.7%
Fayetteville, NC $260.1 $256.3 -1.5% 1.5%
Fayetteville-Springdale-Rogers, AR-MO $678.0 $710.1 4.7% 2.7%
Flagstaff, AZ $163.1 NA NA NA
Flint, MI $367.1 $582.8 58.7% 4.2%
Florence, SC $631.8 $696.7 10.3% 8.5%
Florence-Muscle Shoals, AL $242.1 $393.7 62.7% 8.1%
Fond du Lac, WI $465.2 $583.1 25.3% 12.5%
Fort Collins-Loveland, CO $694.1 $990.7 42.7% 6.4%
Fort Smith, AR-OK $413.6 $485.3 17.3% 4.6%
Fort Wayne, IN $1,059.2 $1,529.0 44.4% 7.2%
Fresno, CA $2,018.5 $2,681.7 32.9% 6.9%
Gadsden, AL $23.5 $56.6 141.2% 2.0%
Gainesville, FL $277.7 $291.6 5.0% 2.4%
Gainesville, GA $559.9 $728.4 30.1% 8.5%
Gettysburg, PA NA $55.7 NA 1.8%
Glens Falls, NY $231.8 $247.2 6.6% 5.2%
Goldsboro, NC $108.1 $147.2 36.2% 3.3%
Grand Forks, ND-MN $196.6 $187.7 -4.5% 3.8%
Grand Island, NE NA $715.4 NA 17.7%
Grand Junction, CO $81.5 $125.5 53.9% 2.3%
Grand Rapids-Wyoming, MI $2,474.0 $5,143.0 107.9% 9.5%
Grants Pass, OR NA $49.9 NA 2.5%
Great Falls, MT $100.5 $75.8 -24.6% 2.2%
Greeley, CO $865.4 $1,240.1 43.3% 11.8%
Green Bay, WI $669.9 $968.1 44.5% 5.2%
Greensboro-High Point, NC $4,007.8 $3,286.1 -18.0% 8.4%

Garner Economics LLC | The US Exports Economy by Metro Area 8
Metro Area 2010 2015 % Change % of Metro
GDP, 2015
Greenville, NC $552.3 $912.1 65.1% 12.2%
Greenville-Anderson-Mauldin, SC $8,746.3 $14,918.7 70.6% 38.9%
Gulfport-Biloxi-Pascagoula, MS $899.7 $3,986.3 343.1% 23.9%
Hagerstown-Martinsburg, MD-WV $269.5 $187.8 -30.3% 2.1%
Hammond, LA NA $95.5 NA 2.6%
Hanford-Corcoran, CA $254.4 $373.9 47.0% 6.9%
Harrisburg-Carlisle, PA $2,077.9 $2,926.2 40.8% 8.7%
Harrisonburg, VA $287.5 $543.7 89.1% 7.3%
Hartford-West Hartford-East Hartford, CT $7,894.2 $10,092.4 27.8% 11.7%
Hattiesburg, MS $291.3 $287.5 -1.3% 5.1%
Hickory-Lenoir-Morganton, NC $1,280.6 $1,797.3 40.3% 13.8%
Hilton Head Island-Bluffton-Beaufort, SC NA $49.8 NA 0.6%
Hinesville-Fort Stewart, GA $376.6 $313.6 -16.7% 9.1%
Homosassa Springs, FL NA $17.0 NA 0.6%
Hot Springs, AR $48.2 $95.8 98.9% 2.8%
Houma-Thibodaux, LA $348.2 $496.2 42.5% 4.2%
Houston-The Woodlands-Sugar Land, TX $80,569.7 $97,054.3 20.5% 19.3%
Huntington-Ashland, WV-KY-OH $422.2 $1,557.0 268.8% 10.7%
Huntsville, AL $986.8 $1,344.7 36.3% 5.5%
Idaho Falls, ID $220.6 $307.7 39.5% 5.3%
Indianapolis-Carmel-Anderson, IN $9,446.7 $9,809.4 3.8% 7.3%
Iowa City, IA $336.7 $308.0 -8.5% 3.3%
Ithaca, NY $246.5 $292.0 18.5% 6.0%
Jackson, MI $295.1 $433.0 46.7% 7.4%
Jackson, MS $541.7 $1,336.1 146.6% 4.6%
Jackson, TN $268.1 $361.5 34.8% 5.9%
Jacksonville, FL $1,940.5 $2,564.4 32.2% 3.8%
Jacksonville, NC $37.9 $54.8 44.5% 0.7%
Janesville-Beloit, WI $1,048.1 $966.1 -7.8% 16.0%
Jefferson City, MO $188.3 $225.7 19.8% 3.3%
Johnson City, TN $116.5 $130.7 12.1% 2.0%
Johnstown, PA $104.4 $114.1 9.3% 2.8%
Jonesboro, AR $82.3 $97.2 18.1% 2.0%
Joplin, MO $178.3 $254.5 42.7% 3.8%
Kahului-Wailuku-Lahaina, HI NA $7.1 NA 0.1%
Kalamazoo-Portage, MI $1,301.9 $1,355.5 4.1% 9.1%
Kankakee-Bradley, IL $489.8 $1,310.1 167.4% 33.5%
Kansas City, MO-KS $7,374.1 $6,723.2 -8.8% 5.4%
Kennewick-Richland, WA $728.4 $583.9 -19.8% 4.9%
Killeen-Temple, TX $98.5 $120.8 22.7% 0.7%
Kingsport-Bristol-Bristol, TN-VA $2,901.2 $4,623.2 59.4% 39.2%
Kingston, NY $212.3 $226.5 6.7% 4.0%
Knoxville, TN $2,280.2 $2,395.4 5.1% 6.1%
Kokomo, IN $1,116.0 $1,559.3 39.7% 35.0%
La Crosse-Onalaska, WI-MN $624.7 $619.6 -0.8% 8.8%
Lafayette, LA $488.1 $1,165.2 138.7% 4.7%
Lafayette-West Lafayette, IN $558.6 $630.7 12.9% 6.3%
Lake Charles, LA $2,499.4 $4,283.9 71.4% 27.9%

Garner Economics LLC | The US Exports Economy by Metro Area 9
Metro Area 2010 2015 % Change % of Metro
GDP, 2015
Lake Havasu City-Kingman, AZ $126.5 $99.1 -21.6% 2.6%
Lakeland-Winter Haven, FL $769.5 $1,318.6 71.3% 6.9%
Lancaster, PA $983.8 $901.3 -8.4% 3.5%
Lansing-East Lansing, MI $929.3 $852.5 -8.3% 4.1%
Laredo, TX $5,306.6 $7,842.7 47.8% 103.7%
Las Cruces, NM $603.0 $1,593.7 164.3% 25.0%
Las Vegas-Henderson-Paradise, NV $1,187.8 $2,916.2 145.5% 2.8%
Lawrence, KS $80.3 $75.9 -5.5% 1.9%
Lawton, OK $22.2 $16.8 -24.2% 0.3%
Lebanon, PA $276.1 $606.6 119.7% 13.2%
Lewiston, ID-WA $62.8 $98.7 57.3% 4.5%
Lewiston-Auburn, ME $116.8 $112.6 -3.6% 2.7%
Lexington-Fayette, KY $2,400.4 $2,065.7 -13.9% 7.2%
Lima, OH $682.8 $462.7 -32.2% 7.6%
Lincoln, NE $722.7 $1,189.3 64.6% 6.3%
Little Rock-North Little Rock-Conway, AR $790.2 $1,777.5 124.9% 4.5%
Logan, UT-ID $286.8 $453.0 57.9% 10.0%
Longview, TX $507.7 $313.8 -38.2% 2.8%
Longview, WA $1,218.7 $2,267.7 86.1% 59.5%
Los Angeles-Long Beach-Anaheim, CA $62,167.6 $61,758.7 -0.7% 6.6%
Louisville/Jefferson County, KY-IN $6,187.8 $8,037.9 29.9% 11.4%
Lubbock, TX $772.8 $330.9 -57.2% 2.6%
Lynchburg, VA $368.8 $522.1 41.6% 5.6%
Macon, GA $329.2 $186.7 -43.3% 2.0%
Madera-Chowchilla, CA $249.1 $503.4 102.1% 10.1%
Madison, WI $1,906.5 $2,280.4 19.6% 4.9%
Manchester-Nashua, NH $2,612.1 $1,556.6 -40.4% 6.1%
Manhattan, KS $19.6 $89.3 355.8% 2.7%
Mankato-North Mankato, MN $216.5 $261.6 20.8% 5.3%
Mansfield, OH $271.1 $298.1 10.0% 7.1%
McAllen-Edinburg-Mission, TX $4,527.1 $5,327.1 17.7% 28.3%
Medford, OR $125.1 $232.6 86.0% 3.2%
Memphis, TN-MS-AR $11,069.1 $11,819.5 6.8% 16.6%
Merced, CA $542.5 $970.8 78.9% 11.6%
Miami-Fort Lauderdale-West Palm Beach, FL $35,866.9 $33,258.5 -7.3% 10.5%
Michigan City-La Porte, IN $289.9 $323.1 11.5% 8.3%
Midland, MI NA $2,739.7 NA 66.3%
Midland, TX $87.2 $110.1 26.2% 0.5%
Milwaukee-Waukesha-West Allis, WI $7,654.5 $7,953.6 3.9% 7.8%
Minneapolis-St. Paul-Bloomington, MN-WI $23,192.8 $19,608.6 -15.5% 7.9%
Missoula, MT $26.0 $69.4 166.7% 1.3%
Mobile, AL $1,432.8 $1,828.9 27.6% 9.9%
Modesto, CA $1,232.6 $1,986.1 61.1% 10.4%
Monroe, LA $136.1 $168.8 24.0% 2.3%
Monroe, MI $304.0 $705.9 132.2% 15.3%
Montgomery, AL $1,520.1 $1,392.5 -8.4% 8.2%
Morgantown, WV $42.7 $71.6 67.5% 1.0%
Morristown, TN $277.2 $261.8 -5.6% 6.8%

Garner Economics LLC | The US Exports Economy by Metro Area 10
Metro Area 2010 2015 % Change % of Metro
GDP, 2015
Mount Vernon-Anacortes, WA $584.6 $708.3 21.2% 13.1%
Muncie, IN $154.9 $324.1 109.3% 8.3%
Muskegon-Norton Shores, MI $583.4 $708.9 21.5% 12.4%
Myrtle Beach-Conway-North Myrtle Beach, SC-NC $231.3 $331.4 43.3% 2.1%
Napa, CA $231.3 $361.0 56.1% 3.9%
Naples-Immokalee-Marco Island, FL $344.0 $253.2 -26.4% 1.5%
Nashville-Davidson-Murfreesboro-Franklin, TN $5,748.5 $9,353.0 62.7% 8.2%
New Bern, NC NA $378.7 NA 7.6%
New Haven-Milford, CT $1,778.8 $1,756.3 -1.3% 3.9%
New Orleans-Metairie, LA $13,964.9 $27,023.3 93.5% 34.4%
New York-Newark-Jersey City, NY-NJ-PA $85,081.2 $95,645.4 12.4% 6.0%
Niles-Benton Harbor, MI $339.2 $320.9 -5.4% 5.1%
North Port-Sarasota-Bradenton, FL $689.9 $760.0 10.2% 2.7%
Norwich-New London, CT $270.5 $405.9 50.0% 2.6%
Ocala, FL $159.1 $142.2 -10.6% 1.8%
Ocean City, NJ $38.6 $29.6 -23.4% 0.6%
Odessa, TX $191.9 $91.9 -52.1% 1.0%
Ogden-Clearfield, UT $831.3 $1,415.6 70.3% 5.7%
Oklahoma City, OK $1,196.1 $1,353.1 13.1% 1.9%
Olympia-Tumwater, WA $362.9 $219.7 -39.5% 2.0%
Omaha-Council Bluffs, NE-IA $2,079.4 $3,753.4 80.5% 6.4%
Orlando-Kissimmee-Sanford, FL $3,453.6 $3,082.7 -10.7% 2.5%
Oshkosh-Neenah, WI $985.4 $1,323.0 34.3% 13.6%
Owensboro, KY $89.1 $107.0 20.1% 1.8%
Oxnard-Thousand Oaks-Ventura, CA $2,611.2 $2,991.7 14.6% 6.2%
Palm Bay-Melbourne-Titusville, FL $858.3 $1,224.5 42.7% 6.2%
Panama City-Lynn Haven-Panama City Beach, FL $95.0 $195.9 106.3% 2.5%
Parkersburg-Vienna, WV $1,023.5 $790.2 -22.8% 21.7%
Pensacola-Ferry Pass-Brent, FL $883.6 $1,171.0 32.5% 7.2%
Peoria, IL $11,104.0 $9,826.9 -11.5% 48.3%
Philadelphia-Camden-Wilmington, PA-NJ-DE-MD $22,710.0 $24,236.1 6.7% 5.9%
Phoenix-Mesa-Scottsdale, AZ $9,342.7 $13,821.5 47.9% 6.3%
Pine Bluff, AR $181.7 $251.4 38.3% 8.2%
Pittsburgh, PA $12,160.7 $9,137.1 -24.9% 6.6%
Pittsfield, MA $410.7 $537.9 30.9% 8.5%
Pocatello, ID $126.7 $198.5 56.7% 7.8%
Port St. Lucie, FL $272.8 $264.6 -3.0% 2.1%
Portland-South Portland, ME $1,561.5 $1,140.9 -26.9% 4.0%
Portland-Vancouver-Hillsboro, OR-WA $18,544.9 $18,847.8 1.6% 11.9%
Prescott, AZ $49.2 $51.0 3.5% 1.0%
Providence-Warwick, RI-MA $5,791.9 $5,048.8 -12.8% 6.4%
Provo-Orem, UT $2,024.6 $2,216.4 9.5% 10.7%
Pueblo, CO $122.6 $205.0 67.2% 4.3%
Punta Gorda, FL $26.5 $33.0 24.2% 0.9%
Racine, WI $1,554.6 $1,233.5 -20.7% 15.8%
Raleigh-Cary, NC $1,912.4 $2,553.4 33.5% 3.4%
Rapid City, SD $25.0 $16.1 -35.4% 0.3%
Reading, PA $1,325.3 $1,777.9 34.2% 10.2%
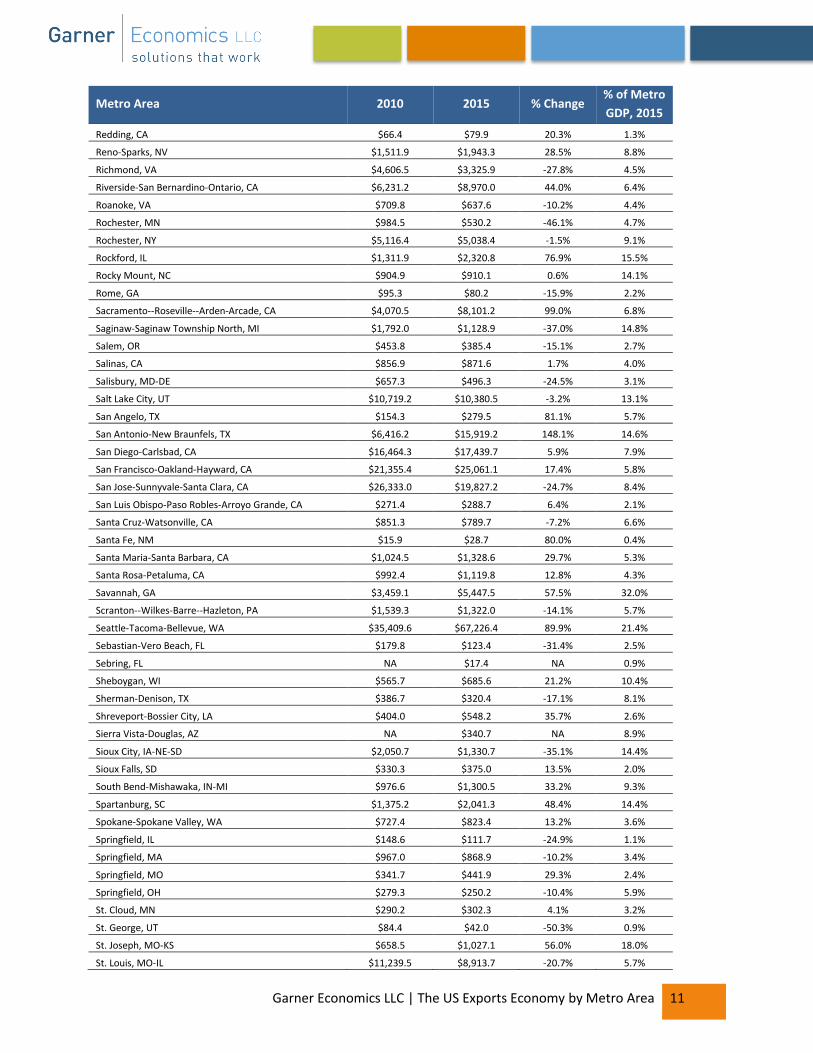
Garner Economics LLC | The US Exports Economy by Metro Area 11
Metro Area 2010 2015 % Change % of Metro
GDP, 2015
Redding, CA $66.4 $79.9 20.3% 1.3%
Reno-Sparks, NV $1,511.9 $1,943.3 28.5% 8.8%
Richmond, VA $4,606.5 $3,325.9 -27.8% 4.5%
Riverside-San Bernardino-Ontario, CA $6,231.2 $8,970.0 44.0% 6.4%
Roanoke, VA $709.8 $637.6 -10.2% 4.4%
Rochester, MN $984.5 $530.2 -46.1% 4.7%
Rochester, NY $5,116.4 $5,038.4 -1.5% 9.1%
Rockford, IL $1,311.9 $2,320.8 76.9% 15.5%
Rocky Mount, NC $904.9 $910.1 0.6% 14.1%
Rome, GA $95.3 $80.2 -15.9% 2.2%
Sacramento--Roseville--Arden-Arcade, CA $4,070.5 $8,101.2 99.0% 6.8%
Saginaw-Saginaw Township North, MI $1,792.0 $1,128.9 -37.0% 14.8%
Salem, OR $453.8 $385.4 -15.1% 2.7%
Salinas, CA $856.9 $871.6 1.7% 4.0%
Salisbury, MD-DE $657.3 $496.3 -24.5% 3.1%
Salt Lake City, UT $10,719.2 $10,380.5 -3.2% 13.1%
San Angelo, TX $154.3 $279.5 81.1% 5.7%
San Antonio-New Braunfels, TX $6,416.2 $15,919.2 148.1% 14.6%
San Diego-Carlsbad, CA $16,464.3 $17,439.7 5.9% 7.9%
San Francisco-Oakland-Hayward, CA $21,355.4 $25,061.1 17.4% 5.8%
San Jose-Sunnyvale-Santa Clara, CA $26,333.0 $19,827.2 -24.7% 8.4%
San Luis Obispo-Paso Robles-Arroyo Grande, CA $271.4 $288.7 6.4% 2.1%
Santa Cruz-Watsonville, CA $851.3 $789.7 -7.2% 6.6%
Santa Fe, NM $15.9 $28.7 80.0% 0.4%
Santa Maria-Santa Barbara, CA $1,024.5 $1,328.6 29.7% 5.3%
Santa Rosa-Petaluma, CA $992.4 $1,119.8 12.8% 4.3%
Savannah, GA $3,459.1 $5,447.5 57.5% 32.0%
Scranton--Wilkes-Barre--Hazleton, PA $1,539.3 $1,322.0 -14.1% 5.7%
Seattle-Tacoma-Bellevue, WA $35,409.6 $67,226.4 89.9% 21.4%
Sebastian-Vero Beach, FL $179.8 $123.4 -31.4% 2.5%
Sebring, FL NA $17.4 NA 0.9%
Sheboygan, WI $565.7 $685.6 21.2% 10.4%
Sherman-Denison, TX $386.7 $320.4 -17.1% 8.1%
Shreveport-Bossier City, LA $404.0 $548.2 35.7% 2.6%
Sierra Vista-Douglas, AZ NA $340.7 NA 8.9%
Sioux City, IA-NE-SD $2,050.7 $1,330.7 -35.1% 14.4%
Sioux Falls, SD $330.3 $375.0 13.5% 2.0%
South Bend-Mishawaka, IN-MI $976.6 $1,300.5 33.2% 9.3%
Spartanburg, SC $1,375.2 $2,041.3 48.4% 14.4%
Spokane-Spokane Valley, WA $727.4 $823.4 13.2% 3.6%
Springfield, IL $148.6 $111.7 -24.9% 1.1%
Springfield, MA $967.0 $868.9 -10.2% 3.4%
Springfield, MO $341.7 $441.9 29.3% 2.4%
Springfield, OH $279.3 $250.2 -10.4% 5.9%
St. Cloud, MN $290.2 $302.3 4.1% 3.2%
St. George, UT $84.4 $42.0 -50.3% 0.9%
St. Joseph, MO-KS $658.5 $1,027.1 56.0% 18.0%
St. Louis, MO-IL $11,239.5 $8,913.7 -20.7% 5.7%

Garner Economics LLC | The US Exports Economy by Metro Area 12
Metro Area 2010 2015 % Change % of Metro
GDP, 2015
State College, PA $188.3 $225.4 19.7% 2.8%
Staunton-Waynesboro, VA NA $271.2 NA 5.5%
Steubenville-Weirton, OH-WV $124.4 $153.0 23.0% 3.9%
Stockton-Lodi, CA $913.7 $1,493.4 63.4% 6.1%
Sumter, SC $88.0 $173.8 97.7% 4.8%
Syracuse, NY $1,759.1 $1,930.3 9.7% 6.1%
Tallahassee, FL $117.8 $191.2 62.2% 1.3%
Tampa-St. Petersburg-Clearwater, FL $6,633.6 $5,660.4 -14.7% 4.2%
Terre Haute, IN $338.8 $257.6 -24.0% 3.9%
Texarkana, TX-Texarkana, AR $64.9 $189.7 192.1% 3.7%
The Villages, FL NA $6.6 NA 0.3%
Toledo, OH $1,980.3 $4,021.3 103.1% 11.8%
Topeka, KS $478.1 $363.5 -24.0% 3.7%
Trenton-Ewing, NJ $678.0 $812.9 19.9% 2.6%
Tucson, AZ $2,099.3 $2,485.9 18.4% 6.9%
Tulsa, OK $2,741.8 $2,699.7 -1.5% 4.9%
Tuscaloosa, AL NA NA NA NA
Tyler, TX $184.4 $207.3 12.4% 2.0%
Urban Honolulu, HI $439.5 $446.4 1.6% 0.7%
Utica-Rome, NY $602.3 $712.6 18.3% 6.6%
Valdosta, GA $124.3 $257.6 107.2% 5.3%
Vallejo-Fairfield, CA $396.8 $564.6 42.3% 2.9%
Victoria, TX $1,407.0 $99.7 -92.9% 1.9%
Vineland-Bridgeton, NJ $280.8 $286.5 2.0% 5.0%
Virginia Beach-Norfolk-Newport News, VA-NC $2,450.7 $3,556.4 45.1% 3.7%
Visalia-Porterville, CA $1,018.1 $1,086.8 6.7% 6.9%
Waco, TX $311.4 $469.4 50.7% 4.3%
Walla Walla, WA NA $136.4 NA 5.2%
Warner Robins, GA $63.1 $87.6 38.8% 1.3%
Washington-Arlington-Alexandria, DC-VA-MD-WV $11,082.9 $13,900.4 25.4% 2.8%
Waterloo-Cedar Falls, IA $221.3 $305.8 38.2% 3.3%
Watertown-Fort Drum, NY NA $206.8 NA 3.2%
Wausau, WI $259.9 $272.7 4.9% 3.6%
Wenatchee-East Wenatchee, WA $367.3 $506.3 37.8% 11.5%
Wheeling, WV-OH $96.4 $117.7 22.1% 1.6%
Wichita Falls, TX $148.1 $247.5 67.2% 3.9%
Wichita, KS $5,512.0 $3,717.6 -32.6% 11.8%
Williamsport, PA $244.8 $257.3 5.1% 5.2%
Wilmington, NC $1,161.9 $617.3 -46.9% 4.5%
Winchester, VA-WV $231.4 $290.8 25.7% 4.9%
Winston-Salem, NC $1,554.6 $1,267.4 -18.5% 4.4%
Worcester, MA-CT $2,355.7 $3,144.1 33.5% 8.0%
Yakima, WA $997.9 $1,251.3 25.4% 13.9%
York-Hanover, PA $1,823.3 $2,075.8 13.9% 12.1%
Youngstown-Warren-Boardman, OH-PA $1,008.4 $1,252.4 24.2% 5.8%
Yuba City, CA $343.5 $338.2 -1.5% 5.9%
Yuma, AZ $258.1 NA NA NA
Source: International Trade Administration; Bureau of Economic Analysis; Garner Economics NA= Not Available

Garner Economics LLC | The US Exports Economy by Metro Area 13
Jay Garner is a member of the
About Garner Economics: We are data driven strategists helping companies, communities and
organizations, large and small, urban and rural, achieve success.
We offer location advisory services, analytical research, industry targeting, strategic planning, and organizational assessments with a wealth of expertise to companies, communities, and organizations globally. We are based in Atlanta, GA with representative offices in Europe (Berlin), Asia (Seoul), and North Carolina.
Garner Economics LLC 715 Birkdale Drive | Atlanta, GA 30215 770-716-9544 (office) http://www.garnereconomics.com| [email protected]