march 23, 2012 nestlé india (nesind)content.icicidirect.com/mailimages/icicidirect_nestle... ·...
TRANSCRIPT
March 23, 2012
Initiating Coverage
ICICI Securities Ltd | Retail Equity Research
Strong brand dominance to rule growth… Nestlé India Limited (NIL), the undisputed leader of instant noodles (~88% share by volume in FY11) and milk products segment in India, is largest food company in country. Its strong brands, ‘Maggi’, ‘Cerelac’, ‘Nescafe’ and ‘KitKat’ have become synonymous with the respective categories. Despite increasing competition in the segments (noodles, milk products and chocolate), NIL’s strong brand value has helped it to consistently maintain its volume growth (~12% CAGR FY04-11). Going ahead, with slew of new launches and aggressive promotion campaigns, we expect the sales growth by volumes to be at 13.1% CAGR and revenue growth to be 17.8% CAGR (CY11-13E). Growth in profitability would continue to be impressive at ~20.7% CAGR (CY11-13E), in spite of the huge capex undertaken by the company. We initiate coverage on the stock with BUY rating. Volumes growth to remain robust
Nestlé India’s revenues (gross) have grown at a CAGR of 18.3% from |2372.6 crore in CY04 to |7673.6 crore in CY11. The growth was largely driven by volumes (11.8% CAGR CY04-11) with the price led growth being moderate (5.8% CAGR CY04-11). Strong brand equity of its flagship brands (Maggi, Cerelac, Nescafe and KitKat), vast distribution network (4.1 million outlets) and the company’s immunity to cost hikes have helped it to consistently grow through volumes. Going ahead, we believe that sales growth would continue to be driven by volumes (13.1% CAGR CY11-13E) largely in the prepared dishes and chocolates segment. Opportunity size big in foods
With the country’s food consumption expected to reach 230 billion USD (CAGR of 5.6% CY08-13E according to BMI, Q12009 & CSO) by 2013, and NIL being the largest food company, we believe that there is a huge untapped opportunity for the company. Further, the increasing rural consumption growth in the categories such as instant snacks, milk products and chocolates and NIL’s dominant share in these categories, we believe the double digit growth in revenues to sustain.
Valuation Historically, NIL has traded at 1.5x premium to FMCG index which we believe is justified backed by the consistency in its earnings, strong free cash flows, high RoEs, and opportunity size in its business. At the CMP, stock is trading at 37.7x its CY12E EPS of |122.1, (~30% higher than its average range of ~27x 1-year forward P/E for past 5 years) and 31.7x its CY13E EPS of |145.3. We have valued the stock by average fair value of P/E, price to sales and DCF methodology, arriving at a TP of | 5074/share with a BUY rating.
Exhibit 1: Valuation Metrics (Year-end December) CY09 CY10 CY11 CY12E CY13ENet Sales (| crore) 5,129.4 6,254.7 7,490.8 8,902.3 10,393.6 EBITDA (| crore) 1,034.5 1,249.7 1,552.8 1,821.7 2,150.5 Net Profit (| crore) 655.0 818.7 961.6 1,177.0 1,400.7 EPS (|) 67.9 84.9 99.7 122.1 145.3 P/E (x) 67.8 54.2 46.2 37.7 31.7 Price / Book (x) 76.4 51.9 34.8 24.2 18.1 EV/EBITDA (x) 42.8 35.3 29.2 24.7 20.8 RoCE (%) 158.8 131.2 62.3 64.6 67.0 RoE (%) 112.7 95.7 75.5 64.1 57.1
Source: Company, ICICIdirect.com Research
Nestlé India (NESIND) | 4604
Rating Matrix Rating : Buy
Target : | 5074
Target Period : 12-15 months
Potential Upside : 10 %
YoY Growth (%) (YoY Growth) CY10 CY11 CY12E CY13ENet Sales 21.9 19.8 18.8 16.8 EBITDA 20.8 24.3 17.3 18.0 Net Profit 25.0 17.5 22.4 19.0 EPS (Rs) 25.0 17.5 22.4 19.0
Current & target multiple CY10 CY11 CY12E CY13E
P/E (Adjusted) 53.0 43.6 37.7 31.7 Target P/E 59.9 51.0 41.7 35.0 EV / EBITDA 35.3 29.2 24.7 20.8 P/BV 51.9 34.8 24.2 18.1 Price / Sales 7.1 5.9 5.0 4.3 RoNW 95.7 75.5 64.1 57.1 RoCE 131.2 62.3 64.6 67.0
Stock Data
Bloomberg/Reuters Code NEST.IN / NEST.BOSensex 17,361.7 Average volumes 6,515.0 Market Cap (| crore) 44,389.8
52 week H/L 4588 / 3501Equity Capital (| crore) 96.4 Promoter's Stake (%) 62.8 FII Holding (%) 10.9 DII Holding (%) 8.0
Comparative return matrix (%)
Return % 1M 3M 6M 12MHUL 2.9 9.1 5.8 25.2 ITC 4.6 (3.1) 19.3 47.9 GSK 5.3 7.8 15.1 29.2 Nestle 2.9 9.8 4.8 22.7
Price movement
0
1,000
2,000
3,000
4,000
5,000
Mar-12Dec-11Sep-11Jun-11Apr-11
0
1,000
2,000
3,000
4,000
5,000
6,000
7,000
Price (R.H.S) Nifty (L.H.S)
Analyst’s name
Sanjay Manyal [email protected]
Parineeta Poddar [email protected]

Page 2ICICI Securities Ltd | Retail Equity Research
Company background Nestlé India Limited (NIL), a subsidiary of Nestlé SA of Switzerland, established itself in India in 1912 and has completed 100 years of operation in the country. Nestle SA holds a 62.76% stake in Nestle India. NIL, headquartered in Gurgaon, has set-up seven manufacturing units in the country located at Goa, Himachal Pradesh, Karnataka, Punjab, Tamil Nadu and Uttaranchal. It operates under four segments, Milk Products & Nutrition (43.7% of revenues in FY11), Prepared dishes and cooking aids (28.1% of revenues in FY11), Chocolates & Confectionery (14.3% of revenues in FY11) and Beverages (13.9% of revenues in FY11). The company enjoys high brand equity with its popular brands in each category. ‘Maggi’, largest and most popular brand of NIL India, occupies 86.5% share by value (July, 2010) in the instant noodles category. The brand also has soups, ketchup and other culinary products under its umbrella. ‘Nescafe’, the instant coffee brand, is the market leader in India with ~37% share by value (FY11). ‘Cerelac’, the infant food brand’ is one of the oldest brands occupying ~70% share by value (FY11) in the infant food category. Other popular brands of the company are, KitKat, MilkyBar, Polo and Munch in the chocolate & confectionery segment and Nestle Pure Life in the bottled water segment. Leveraging on its strong brand equity in each of the categories NIL has constantly launched new products through innovation and an established distribution network (~4 million outlets), thereby doubling its revenues in the past five years from |3504.4 crore in CY07 to |7490.8 crore in CY11, growing at a CAGR of 20.6%. Further, with the ability to pass on the costs and manage operations efficiently its profitability growth has been higher at 25.1% (CAGR from CY07-11) from |413.8 crore in CY07 to |961.6 crore in CY11.
Exhibit 2: Nestle India’s journey so far….
Source: Company, ICICIdirect.com Research
Entered the noodle mkt with the brand 'Maggi'
1931 1949 1961 1963 1967 1984 1989 1990 1991 1993 1994 1995 1996 1997 1998 2001 2005 2006 2010-11
Nestle SA set up a subsidiary in India
2nd factory in TN to process tea
Set-up the Karnataka factory
Launched 'Munch' & 5 new variants of Maggi noodles
1st factory at Moga (Punjab) to develop the milk economy
'Nescafe' was launched in India
Entered choc. Segment with 'Nestle Premium Chocolates' & entered soups & ketchup mkt extending brand Maggi
Launched 'Bar One'
'Cerelac' was launched in India
2nd factory at Goa
Launched 'Milo'; Extended Maggi to culinary products
Ser-up factory at Haryana
Launched 'Milkmaid' & 'Polo'
Set up factory at Goa; Launched 'KitKat'
Entered white choc mkt with 'MilkyBar'
Ventured into bottled water segment & launched 'Pure Life' & 'San Pellegrino'
Set up its 7th factory at Uttakhand to mfg culinary products; Repositioned as 'Health & Wellness' Company
Entered the instant Pasta mkt with 'Maggi Pazzta' & launched 'Acti Plus' milk
Shareholding pattern (Q4CY11)
Shareholder Holding (%)
Promotors 62.8
Institutional Shareholding 8.0
Non Promotor Corportares 2.1
Public 15.8
FII & DII holding trend (%)
11.1 10.9 11.1 11.3 11.3
8.4 8.5 8.2 8.0 8.0
0.00
2.00
4.00
6.00
8.00
10.00
12.00
Q4CY10 Q1CY11 Q2CY11 Q3CY11 Q4CY11
FII DII
Page 3ICICI Securities Ltd | Retail Equity Research
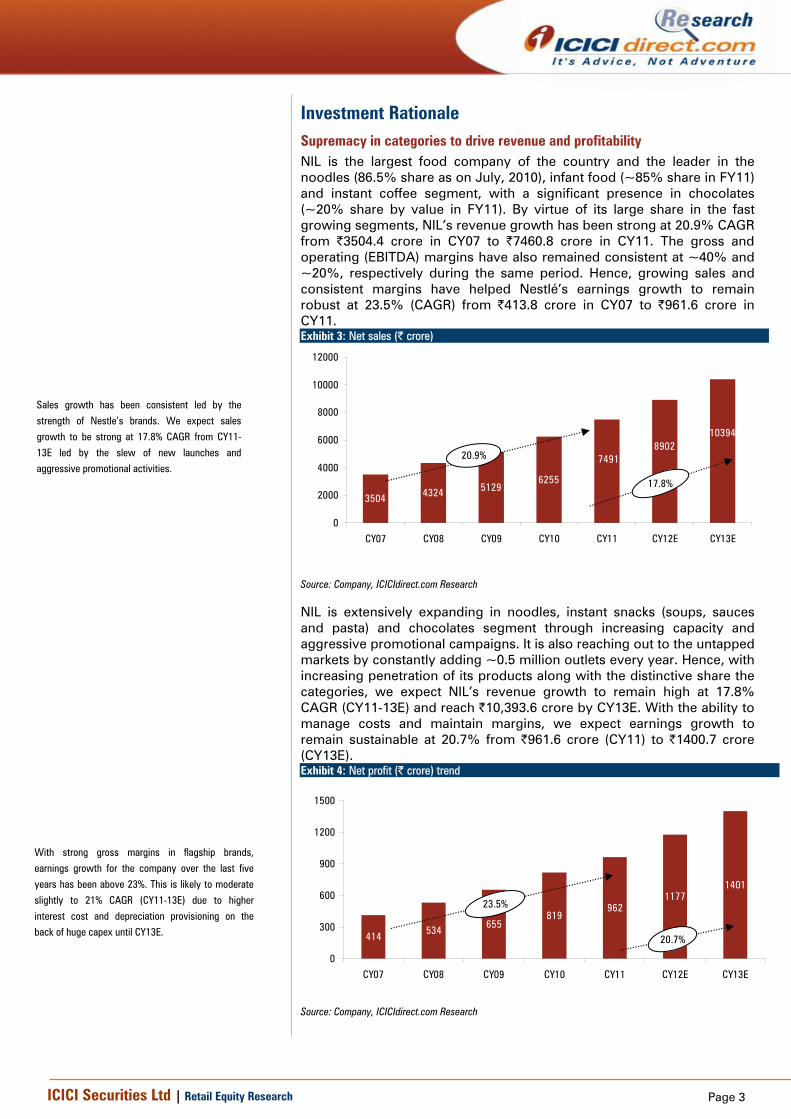
Investment Rationale Supremacy in categories to drive revenue and profitability NIL is the largest food company of the country and the leader in the noodles (86.5% share as on July, 2010), infant food (~85% share in FY11) and instant coffee segment, with a significant presence in chocolates (~20% share by value in FY11). By virtue of its large share in the fast growing segments, NIL’s revenue growth has been strong at 20.9% CAGR from |3504.4 crore in CY07 to |7460.8 crore in CY11. The gross and operating (EBITDA) margins have also remained consistent at ~40% and ~20%, respectively during the same period. Hence, growing sales and consistent margins have helped Nestlé’s earnings growth to remain robust at 23.5% (CAGR) from |413.8 crore in CY07 to |961.6 crore in CY11. Exhibit 3: Net sales (| crore)
3504 4324 51296255
7491
103948902
0
2000
4000
6000
8000
10000
12000
CY07 CY08 CY09 CY10 CY11 CY12E CY13E
20.9%
17.8%
Source: Company, ICICIdirect.com Research
NIL is extensively expanding in noodles, instant snacks (soups, sauces and pasta) and chocolates segment through increasing capacity and aggressive promotional campaigns. It is also reaching out to the untapped markets by constantly adding ~0.5 million outlets every year. Hence, with increasing penetration of its products along with the distinctive share the categories, we expect NIL’s revenue growth to remain high at 17.8% CAGR (CY11-13E) and reach |10,393.6 crore by CY13E. With the ability to manage costs and maintain margins, we expect earnings growth to remain sustainable at 20.7% from |961.6 crore (CY11) to |1400.7 crore (CY13E). Exhibit 4: Net profit (| crore) trend
414 534 655819
9621177
1401
0
300
600
900
1200
1500
CY07 CY08 CY09 CY10 CY11 CY12E CY13E
23.5%
20.7%
Source: Company, ICICIdirect.com Research
Sales growth has been consistent led by the
strength of Nestle’s brands. We expect sales
growth to be strong at 17.8% CAGR from CY11-
13E led by the slew of new launches and aggressive promotional activities.
With strong gross margins in flagship brands,
earnings growth for the company over the last five
years has been above 23%. This is likely to moderate
slightly to 21% CAGR (CY11-13E) due to higher
interest cost and depreciation provisioning on the back of huge capex until CY13E.

Page 4ICICI Securities Ltd | Retail Equity Research
Revenue mix : Strengthening the dominating segments further
NIL’s revenues comprise largely from the milk products & nutrition and the prepared dishes segment comprising strong brands as Cerelac, Lactogen, EveryDay, Neslac and Maggi, respectively. With a series of new products and successful launches by the company and increasing penetration of packaged foods (milk and prepared dishes) in the country NIL’s revenue contribution from these two categories has increased from 64.6% in CY07 to 69.2% in CY11. Going ahead, we expect the contribution from these two segments to be 74.2% by CY13E.
Accordingly, we expect the growth (CAGR CY11-13E) in prepared dishes & cooking aids (Maggi) to be 20.5% (volume growth of 17%) and in milk products and nutrition segment to be 19.3% (volume growth of 9.5%)
Exhibit 5: Revenue Mix (| crore)
1575.6 1938.8 2311.3 2776.3 3351.0 4017.9 4773.2
781.1 1051.9 1335.0 1725.0 2154.5 2644.0 3128.3
568.6 679.5 771.9 975.9 1099.7 1305.6 1521.6721.9 800.9 804.2 899.4 1068.4 1144.5 1226.0
0%
20%
40%
60%
80%
100%
CY07 CY08 CY09 CY10 CY11 CY12E CY13E
Milk Product and Nutrition Prepared dishes and cooking aids Chocolate and confectionery Beverages
43.7%
28.1%
15.3%
14.1%
44.8%
29.4%
14.3%
11.5%
Source: Company, ICICIdirect.com Research
In the chocolate segment, the company is the leader in whites and wafers category (Brands: MilkyBar, KitKat and Munch) and has witnessed revenue growth of 17.9% (CAGR CY07-11) with its contribution remaining constant at ~15%. We expect the growth and contribution from this segment to sustain at 17.6% (CAGR CY11-13E) and ~15%, respectively.
Beverages, comprising instant coffee and bottled water categories, has been a weak link for the company over the years with its contribution declining from 19.8% in CY07 to 14.1% in CY11. With the growth in other segments being relatively higher, we believe that contribution from beverages to revenues would further decline to 11.5% by CY13E.
Page 5ICICI Securities Ltd | Retail Equity Research
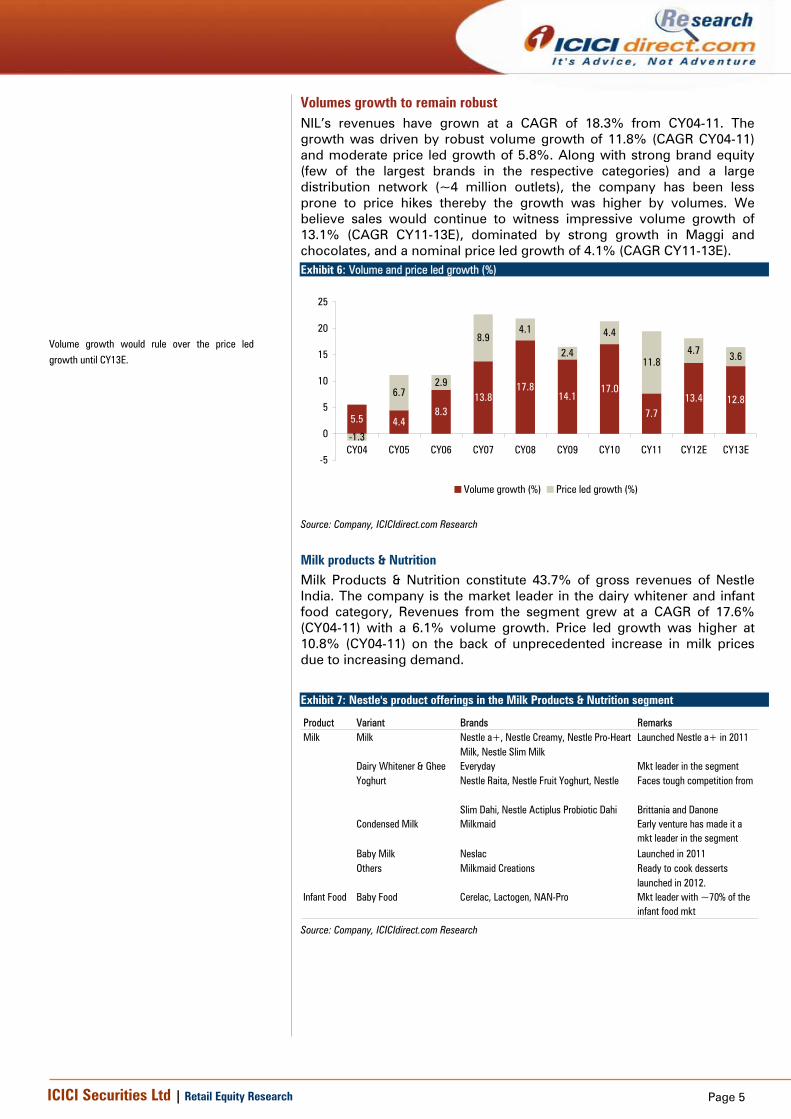
Volumes growth to remain robust NIL’s revenues have grown at a CAGR of 18.3% from CY04-11. The growth was driven by robust volume growth of 11.8% (CAGR CY04-11) and moderate price led growth of 5.8%. Along with strong brand equity (few of the largest brands in the respective categories) and a large distribution network (~4 million outlets), the company has been less prone to price hikes thereby the growth was higher by volumes. We believe sales would continue to witness impressive volume growth of 13.1% (CAGR CY11-13E), dominated by strong growth in Maggi and chocolates, and a nominal price led growth of 4.1% (CAGR CY11-13E). Exhibit 6: Volume and price led growth (%)
5.5 4.48.3
13.817.8
14.117.0
7.713.4 12.8
-1.3
6.72.9
8.94.1
2.4
4.4
11.84.7 3.6
-5
0
5
10
15
20
25
CY04 CY05 CY06 CY07 CY08 CY09 CY10 CY11 CY12E CY13E
Volume growth (%) Price led growth (%)
Source: Company, ICICIdirect.com Research
Milk products & Nutrition Milk Products & Nutrition constitute 43.7% of gross revenues of Nestle India. The company is the market leader in the dairy whitener and infant food category, Revenues from the segment grew at a CAGR of 17.6% (CY04-11) with a 6.1% volume growth. Price led growth was higher at 10.8% (CY04-11) on the back of unprecedented increase in milk prices due to increasing demand.
Exhibit 7: Nestle's product offerings in the Milk Products & Nutrition segment
Product Variant Brands RemarksMilk Milk Nestle a+, Nestle Creamy, Nestle Pro-Heart
Milk, Nestle Slim MilkLaunched Nestle a+ in 2011
Dairy Whitener & Ghee Everyday Mkt leader in the segmentYoghurt Nestle Raita, Nestle Fruit Yoghurt, Nestle
Slim Dahi, Nestle Actiplus Probiotic Dahi
Faces tough competition from
Brittania and DanoneCondensed Milk Milkmaid Early venture has made it a
mkt leader in the segmentBaby Milk Neslac Launched in 2011Others Milkmaid Creations Ready to cook desserts
launched in 2012. Infant Food Baby Food Cerelac, Lactogen, NAN-Pro Mkt leader with ~70% of the
infant food mkt Source: Company, ICICIdirect.com Research
Volume growth would rule over the price led growth until CY13E.

Page 6ICICI Securities Ltd | Retail Equity Research
Exhibit 8: Milk Products & Nutrition business growth trend
8.3
1.8 2.9 5.410.1
13.17.6
2.5
9.0 10.0
0.7
7.1 6.3
16.311.7 5.4
11.617.8
10.0 8.0
0
5
10
15
20
25
CY04 CY05 CY06 CY07 CY08 CY09 CY10 CY11 CY12E CY13E
Volume (%) Price growth (%)
Source: Company, ICICIdirect.com Research
With increasing consumer preference for packaged milk and milk products and the risk of adulteration in milk, NIL is actively increasing penetration in semi-urban areas. Hence, we expect volume growth of 9.5% and price increases of 9.0% from CY11-13E.
Prepared dishes and cooking aids Maggi is NIL’s largest brand (Nescafe was the largest until mid-1990’s) with a sales (gross) of |2154.5 crore (FY11). It includes the sales of instant noodles and pasta cooking aids, soups and sauces. Enjoying virtual monopoly in the segment until FY10, NIL revenues from the segment have grown at a CAGR of 26.3% (CY04-11) backed by volume growth of 20.5% and price growth of 4.8%. Exhibit 9: Nestle's offerings and brands in the Prepared Dishes Segment Product Variant Brands RemarksReady to Eat Food Noodles Meri Maggi 2 min noodles |10/80g pack and |5/50g pack
(since 2002)Dumdaar Maggi - Curry, Tomato, Chicken
Launched at a higher price point of ~|15/pack
Cup Noodles Maggi Cuppa Mania Launched in 2008Ready to Eat Noodles Maggi Noodletz -Chicken & Masala
flavorLaunched only in North East India
Healthy Noodles Maggi Atta Noodles, Maggi Multi grainz noodles
Launched in May,2005
Instant Pasta Maggi Pazzta available in 4 flavors ~42% (FY11)share (mkt leader) within a year of launch, ITC's share is ~40% (FY11)
Cooking Aids Bhuna Masala Maggi Bhuna masal for gravy dishes &veg, & dal
Magic Cubes Maggi Veg & ChickenSpices Maggi Magic MasalaPizza Sauce Maggi Pizza MazzaCoconut Powder Maggi Coconut Powder
Soups Healthy Soups Maggi Soups & Super-Roni Entered in 1998; Faces tough competition from 'Knorr' of HUL
Sauces Ketchup Maggi - Rich Tomato, Hot & Sweet, Tomato Chilli
Leader till 1990's, lost share to HUL's Kissan
Others Maggi Imli Pichkoo Launched in 2008
Extended the Maggi brand to other products through 1995 & 1996
Source: Company, ICICIdirect.com Research
Nestlé’s high brand value as a nutrition, health and
wellness company helps it in acquiring volumes from
this change in consumer preferences. We expect volume
growth of 9.7% and price increases to the tune of 9%
during CY10-13
‘Maggi’ brand was established in 1984 with entry into
the instant noodles category in 1984. Currently, the
noodles market is estimates at ~|1500 crore with NIL
enjoying 86.5% share by value (July,2010).
Extending the strength of the brand equity created in the
noodles category, NIL entered various new categories over the years.
Page 7ICICI Securities Ltd | Retail Equity Research
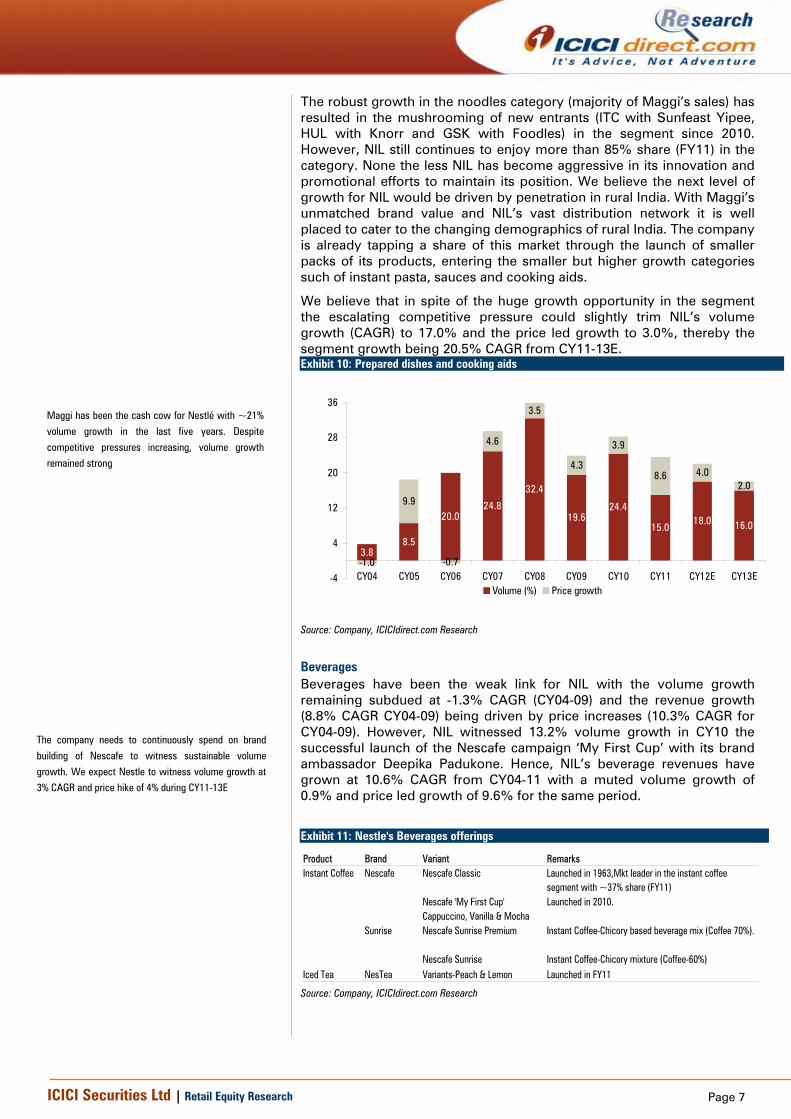
The robust growth in the noodles category (majority of Maggi’s sales) has resulted in the mushrooming of new entrants (ITC with Sunfeast Yipee, HUL with Knorr and GSK with Foodles) in the segment since 2010. However, NIL still continues to enjoy more than 85% share (FY11) in the category. None the less NIL has become aggressive in its innovation and promotional efforts to maintain its position. We believe the next level of growth for NIL would be driven by penetration in rural India. With Maggi’s unmatched brand value and NIL’s vast distribution network it is well placed to cater to the changing demographics of rural India. The company is already tapping a share of this market through the launch of smaller packs of its products, entering the smaller but higher growth categories such of instant pasta, sauces and cooking aids.
We believe that in spite of the huge growth opportunity in the segment the escalating competitive pressure could slightly trim NIL’s volume growth (CAGR) to 17.0% and the price led growth to 3.0%, thereby the segment growth being 20.5% CAGR from CY11-13E. Exhibit 10: Prepared dishes and cooking aids
3.88.5
20.024.8
32.4
19.624.4
15.018.0 16.0
-1.0
9.9
-0.7
4.6
3.5
4.3
3.9
8.6 4.02.0
-4
4
12
20
28
36
CY04 CY05 CY06 CY07 CY08 CY09 CY10 CY11 CY12E CY13EVolume (%) Price growth
Source: Company, ICICIdirect.com Research
Beverages Beverages have been the weak link for NIL with the volume growth remaining subdued at -1.3% CAGR (CY04-09) and the revenue growth (8.8% CAGR CY04-09) being driven by price increases (10.3% CAGR for CY04-09). However, NIL witnessed 13.2% volume growth in CY10 the successful launch of the Nescafe campaign ‘My First Cup’ with its brand ambassador Deepika Padukone. Hence, NIL’s beverage revenues have grown at 10.6% CAGR from CY04-11 with a muted volume growth of 0.9% and price led growth of 9.6% for the same period.
Exhibit 11: Nestle's Beverages offerings
Product Brand Variant RemarksInstant Coffee Nescafe Nescafe Classic Launched in 1963,Mkt leader in the instant coffee
segment with ~37% share (FY11)Nescafe 'My First Cup' Launched in 2010.Cappuccino, Vanilla & Mocha
Sunrise Nescafe Sunrise Premium Instant Coffee-Chicory based beverage mix (Coffee 70%).
Nescafe Sunrise Instant Coffee-Chicory mixture (Coffee-60%)Iced Tea NesTea Variants-Peach & Lemon Launched in FY11 Source: Company, ICICIdirect.com Research
The company needs to continuously spend on brand
building of Nescafe to witness sustainable volume
growth. We expect Nestle to witness volume growth at 3% CAGR and price hike of 4% during CY11-13E
Maggi has been the cash cow for Nestlé with ~21%
volume growth in the last five years. Despite
competitive pressures increasing, volume growth remained strong

Page 8ICICI Securities Ltd | Retail Equity Research
We believe that the company needs to enhance its brand building exercise for this segment to witness volume growth. Going ahead, we remain cautious on the volume growth and expect prices to continue dominating the revenue growth from this segment. We expect the beverages segment to witness a volume growth of 3.0% (CAGR CY11-13E) and price growth of of 4.0% (CAGR CY11-13E).
Exhibit 12: Beverages growth trend
-4.0-1.6
7.9
-3.1
13.2
0.93.0 3.0
12.114.4
10.6
10.9
3.6-1.2
17.8
4.0 4.0
-9.20.8
-10
-5
0
5
10
15
20
CY04 CY05 CY06 CY07 CY08 CY09 CY10 CY11 CY12E CY13E
Volume (%) Price growth (%)
Significant jump following the launch of Nescafe campaign with Deepika Padukone
Source: Company, ICICIdirect.com Research
Chocolates and confectionaries NIL is the 2nd largest player in chocolates (~20% share by value) with Cadbury India dominating the market (~70% share by value). NIL, an early entrant, has benefited from high growth in the category and is the leader in white chocolates and wafers category. Following its early establishment in the segment, revenues have grown at a CAGR of 17.9% (CY04-11) with volume growth of 12.2% and price increases of 5.1%. Recently, it ventured into the dark chocolates at lower price points of |20 (lowest in the dark chocolate segment) and positioned it as health chocolates. NIL also launched smaller SKUs, single finger KitKat at |5, and re launched BarOne in 2010. With continuous new products and variant launches and introduction of smaller SKUs (where margins are higher) we expect the company to witness revenue growth of 17.6%, volume growth being 11.5% and price led growth being 5.5%, during CY11-13E.
Exhibit 13: Nestle's Chocolates and Confectionery Portfolio
Product Variant Brand RemarksChocolate White Chocolate MilkyBar Mkt Leader in whites
Milk Chocolate Nestle milk choc & fudges ~20% of choc mkt.Dark Chocolates Nestle Dark Choc & Dry Fruits Launched in FY12Fine Chocolates Nestle Selections Launched in FY12Wafer Chocolates KitKat, Munch, MilkyBar Crispy Closest competitor Perk
(Cadbury)Others BarOne, MilkyBar Choo, Eclairs
Confectionery Milnt Polo, Polo Holes
Source: Company, ICICIdirect.com Research
The consumption of chocolates in India is very low (54
gm/person/year) compared to that of the developed
economies (10.5 kg/person/year in USA and 10 kg/person/year in UK).

Page 9ICICI Securities Ltd | Retail Equity Research
Exhibit 14: Chocolate and confectionary growth trend
9.9 11.315.8 17.6
12.4 9.7
21.2
-1.5
12.0 11.0
-0.3
2.36.1
6.3
3.5
4.3
14.4
6.0 5.0
-6.3-10
-5
0
5
10
15
20
25
30
CY04 CY05 CY06 CY07 CY08 CY09 CY10 CY11 CY12E CY13E
Volume (%) Price growth (%)
Source: Company, ICICIdirect.com Research
The chocolate segment has witnessed strong volume
growth till CY10 and took mild price hikes. However,
CY11 has been dismal with volume de-growth of 1.5%. The company took an aggressive price hike of 14.4%
Page 10ICICI Securities Ltd | Retail Equity Research
Opportunity size of NIL’s segments With a population of ~1.2 billion India is one of the largest consumer markets in the world. The categories in which NIL operates have comparatively lower penetration in India when compared to the world economies. Further, with penetration in urban India itself being low, rural India has further lower penetration thereby providing a huge scope of growth for the company.
Noodles With the instant noodles market estimated at ~|1500 crore (FY11) the total consumption is only 1500 million packs (considering | 10/pack) thereby accounting a mere 1.3 packs/person per annum. With the segment growing at ~20% p.a. and expected to reach |3200~3500 crore by 2015 consumption would only reach ~2.7 packs/person per annum. However, we believe that with the growing rate of penetration of noodles in the urban and rural India led by the openness of Indian consumers to instant food, the segment has a greater scope. Hence, with Maggi having a lion’s share in the segment it would continue to witness robust growth. Moreover, the other products, ready to cook mix and soups, under prepared dishes are also witnessing high growth rates of ~64% and ~20%. (Source: IMRB Research).
Milk Products & Nutrition According to the National Dairy Research Institute (NDRI), total consumption of milk in India was ~110 million tonnes (MT) in 2011, which is likely to rise to 170 MT by 2020. Out of this, only ~10% is sold through pouches while ~1% is sold packaged milk. With the increasing health concerns due to rising adulteration in milk and milk products there is a huge opportunity for NIL due to its expand its sales in this segment.
Chocolates & Confectionery
The chocolate penetration in India is only 6-7% (FY10) compared to ~75% in Brazil. Moreoever. the consumption of chocolate per capita/year is only ~55 gms compared to 10.5kg in US and ~10kg in UK. The demand for the segment is growing at ~20% p.a. and the demand for premium chocolates is increasing at ~10% p.a.. Hence, with only two major players in the country, NIL and Cadbury, NIL is grabbing the opportunity to grow in this market through entry into premium chocolates, dark chocolates and variants at lower price point.
Beverages
Though this has shown a weak performance over the years, the exceptional growth in CY10 and supported by the parallel growth in the instant coffee consumption in India (1951-2000 grew at ~2%, 2003 onwards ~6%, 2010 grew by ~7%), we believe the market leader (NIL) would be the largest beneficiary. Further, we expect the shift of tea consuming population to coffee (especially young population) would help in increasing the per capita consumption of the country which is remarkable low.
We believe Nestlé’s presence is in these low penetrated food categories with a huge opportunity size and having a dominant presence would keep NIL’s volume growth intact for a long period.
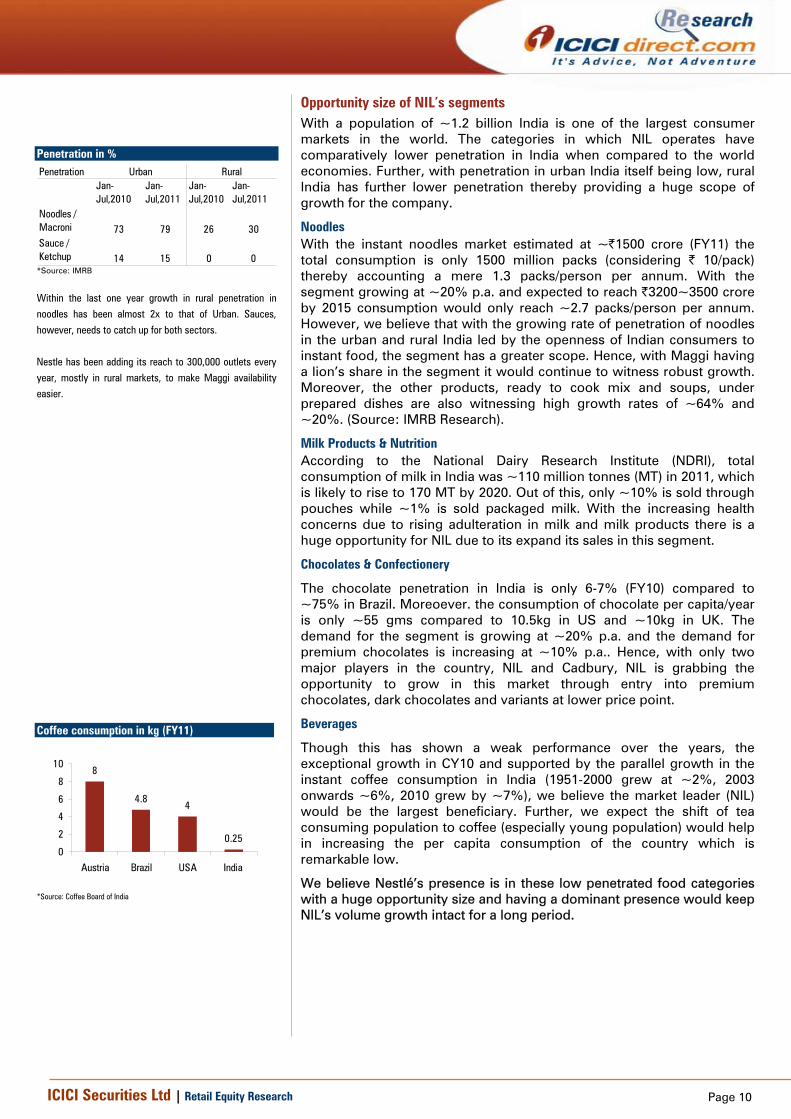
Penetration in % Penetration
Jan-Jul,2010
Jan-Jul,2011
Jan-Jul,2010
Jan-Jul,2011
Noodles / Macroni 73 79 26 30Sauce / Ketchup 14 15 0 0
Urban Rural
*Source: IMRB
Within the last one year growth in rural penetration in
noodles has been almost 2x to that of Urban. Sauces,
however, needs to catch up for both sectors.
Nestle has been adding its reach to 300,000 outlets every
year, mostly in rural markets, to make Maggi availability easier.
Coffee consumption in kg (FY11)
8
4.84
0.250
2
4
6
8
10
Austria Brazil USA India
*Source: Coffee Board of India

Page 11ICICI Securities Ltd | Retail Equity Research
Effective advertisement and strong distribution to tap new markets Over the years, NIL has continuously invested in brand building through sustained expenditure on advertisement and aggressively expansion its distribution network. With aggressive brand investment in Maggi in the 90’s, when there was almost no competition for the company, it built strong brand equity for the product garnering ~90% share volume. Leveraging on the strength of the brand NIL extended the brand to soups, ketchups and pastas. Today, it is considered as one of the top 10 most trusted brands of the country. Similarly, Nescafe also has become a leader in the instant coffee segment. The launch of the advertisement “Know your Neighbors”, thereby associating the brand with Deepika Padukone was an instant hit contributing immensely to the jump in Nescafe’s sales.
The company has extended its distribution reach from urban areas in the nineties to semi-urban and rural areas lately. Nestlé added 464,000 new points of sales in 2010 and is focusing on penetrating the Tier-II, III and IV towns to support additional production volumes from new capacities. We believe even implementation of GST would simplify the distribution network, going forward. Exhibit 15: Advertisement and distribution cost (percentage to net sales)
9.5 9.4
10.19.8 9.7 9.7 9.7
8
9
10
11
CY07 CY08 CY09 CY10 CY11 CY12 CY13
Advertisement Cost (%of sales)
Source: Company, ICICIdirect.com Research
Aggressive capex Considering the rising consumer demand in the prepared dishes segment (specifically noodles) and chocolates, NIL is aggressively enhancing its current capacities. Simultaneously, it is planning to launch various products and variants specifically in the premium category to tap growing income levels. NIL has a planned capex of ~|2300 crore in CY11-12 for capacity expansion in its Bicholim (~|150 crore), Moga (~|300 crore), Nanjangud (~|400 crore) and Ponda (~|500 crore) facilities and two greenfield units in Samaikha (~|650 crore) and Tahliwal. This capex is much higher than the |1550 crore spent in the last five years (CY07-11). Its Nanjangud facility has already commenced operations. Considering GST implementation in 2012, it would be commissioning the Tahliwal, Himachal Pradesh facility before April 2012 so that it can get excise and income tax benefits. To fund the capex plan, the company intends to take ~|2000 crore of debt in a phased manner till 2013. It has already taken ~|900 crore of debt in 2011, which includes ~|650 crore of external commercial
Advertisement cost as a percentage of sales has
been lower than other FMCG companies
specifically in the non-food segment. Nestlé would
continue to spend ~10% on advertisements with respect to continuous launches

Page 12ICICI Securities Ltd | Retail Equity Research
borrowings (ECBs) from Nestlé SA. We believe expansion of these facilities would help the company to cater to the increasing demand in milk, prepared dishes and chocolates segment.
Exhibit 16: Capex (| crore)
300598
1767
483157 261 206
0200400600800
100012001400160018002000
CY07 CY08 CY09 CY10 CY11 CYY12E CY13E
Source: Company, ICICIdirect.com Research
Exhibit 17: Capacity Utilization across segments in FY11 (%)
91.9 97.2
58.1
144.5
0
40
80
120
160
Milk Products Prepared Dishes Beverages Chocolates
Source: Company, ICICIdirect.com Research
Strong product portfolio of Nestlé SA Strong brands of Nestlé SA, the parent company of Nestlé India, have always been an added advantage for the company. The company has launched many products in India with similar brand names, capturing the brand value of Nestlé SA’s product. The company has been present in five categories and can launch many products without investing much in R&D and brand building. We believe the company would continue to launch new product from Nestlé SA’s product portfolio and would continue to Leverage its existing brand equity. In new launches, Nestlé A+ Milk and Dahi, which is branded as unadulterated milk, without any preservatives like formalin and hydrogen peroxide is targeted to convert consumption from open to packaged milk. Similarly, the company has launched Nestlé dark chocolate and Nestlé dark chocolate – dry fruit with the positioning of healthy chocolate.
Exhibit 18: Nestlé SA Brands
CategoriesBaby Foods Cerelac Gerber Gerber Graduates NaturNes NestumBottled water PureLife Perrier Poland Spring S.PellegrinoCereals Chocapic Cini Minis Cookie Crisp Estrelitas FitnessChocolates & Confectionery Aero Butterfinger Cailler Crunch KitkatCoffee Nescafe Nescafe 3 in 1 Nescafe Cappuccino Nescafe Classic Nestle DecaffCulinary Buitoni Herta Hot Pockets Lean cuisine MaggiDairy Carnation Coffee-Mate La Laitiere NidoDrinks Juicy Juice Milo Nesquick NesteaFood Service Chef Chef-mate Lean cuisine Maggi MiloHealthcare Nutrition Boost Nutren Junior Peptamen ResourceIce Cream Dreyer's Extreme Haagen Dazs Movenpick NestlePetcare Alpo Bakers Complete Beneful Cat chow Chef Michael’s Canine Creations
Sports Nutrition PowerBarWeight management Jenny Craig
Key Brands
Source: Company, ICICIdirect.com Research
Page 13ICICI Securities Ltd | Retail Equity Research
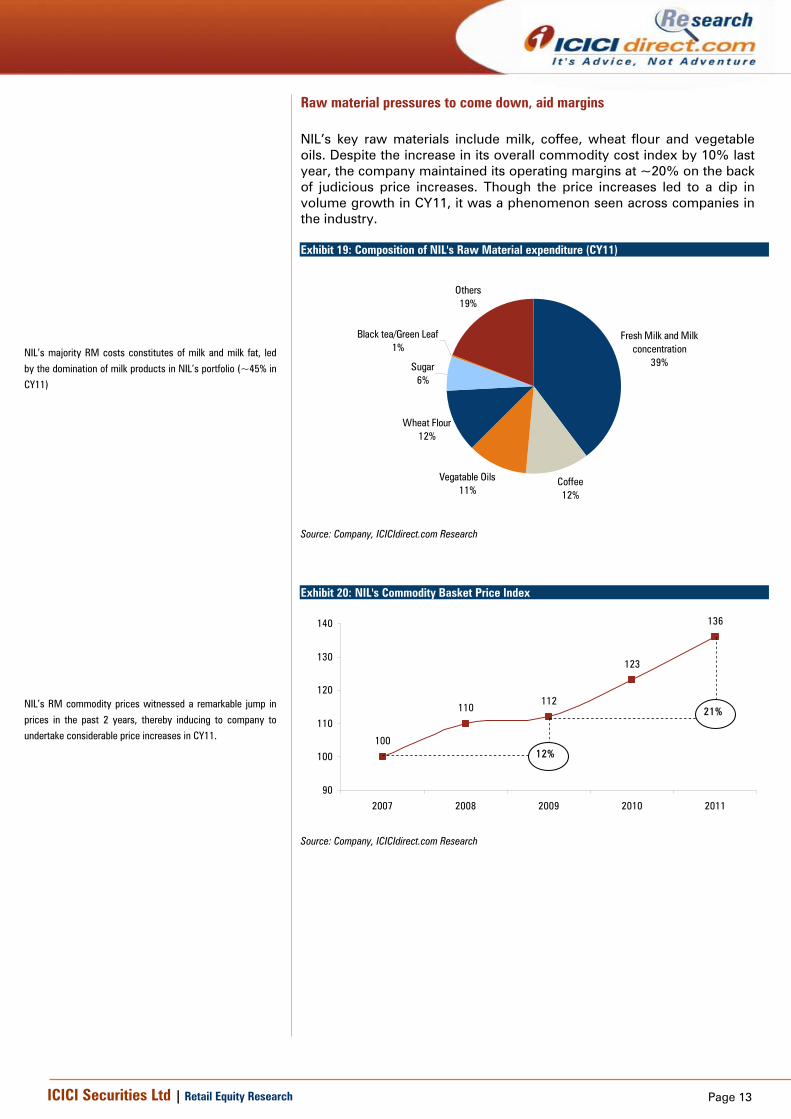
Raw material pressures to come down, aid margins NIL’s key raw materials include milk, coffee, wheat flour and vegetable oils. Despite the increase in its overall commodity cost index by 10% last year, the company maintained its operating margins at ~20% on the back of judicious price increases. Though the price increases led to a dip in volume growth in CY11, it was a phenomenon seen across companies in the industry. Exhibit 19: Composition of NIL's Raw Material expenditure (CY11)
Others19%
Black tea/Green Leaf1%
Sugar6%
Wheat Flour12%
Vegatable Oils11%
Coffee12%
Fresh Milk and Milk concentration
39%
Source: Company, ICICIdirect.com Research
Exhibit 20: NIL's Commodity Basket Price Index
100
110112
123
136
90
100
110
120
130
140
2007 2008 2009 2010 2011
12%
21%
Source: Company, ICICIdirect.com Research
NIL’s majority RM costs constitutes of milk and milk fat, led
by the domination of milk products in NIL’s portfolio (~45% in
CY11)
NIL’s RM commodity prices witnessed a remarkable jump in
prices in the past 2 years, thereby inducing to company to undertake considerable price increases in CY11.

Page 14ICICI Securities Ltd | Retail Equity Research
With milk prices increasing by 5.5% (CAGR from CY05-09) but almost 17% during CY09-11 (CAGR) NIL was forced take price hikes in milk products segment. However, we do not expect such a steep price rise from current levels and thereby expect NIL to sustain volume growth in the segment. Coffee prices have witnessed a moderate increase of ~5%, however it has been relatively high for NIL on the back of the high quality coffee sourcing by the company. However, the major concern for NIL is the low volume growth in the segment. We believe with the additional advertisement expenditure and better promotional strategy, NIL will be able consolidate its presence in the segment.
Exhibit 21: NIL's Fresh Milk Fat Price Index
100
109.6
131.6
143.8
80
100
120
140
160
2008 2009 2010 2011
Source: Company, ICICIdirect.com Research
Exhibit 22: NIL's Coffee Price Index
100
94.1
83.5
112.8
70
80
90
100
110
120
2008 2009 2010 2011
Source: Company, ICICIdirect.com Research
During the year, palm oil prices witnessed unprecedented increase of ~40%, thereby compelling the company to pass on the increase in costs through higher prices. The breathers in commodity prices were for NIL were sugar and wheat. We believe Nestlé with its dominance in the categories in which it operates has the ability to pass on the increase in costs through price hikes and maintain its market share. Hence, we believe that NIL’s margins would continue to reign at ~20% and with any softening in commodity prices it could improve further.
Exhibit 23: NIL's Wheat Price Index
100
104.2
114.3
109.1
90
95
100
105
110
115
120
2008 2009 2010 2011
Source: Company, ICICIdirect.com Research
Exhibit 24: NIL's Palm Oil Price Index
100
83.6
76.7
107.4
60
70
80
90
100
110
120
2008 2009 2010 2011
Source: Company, ICICIdirect.com Research
Milk prices have risen at a CAGR of 12.7% during CY07-11. However, we believe prices would cool off in the near future, which should help the company to penetrate its milk product category in semi-urban areas

Page 15ICICI Securities Ltd | Retail Equity Research
Financials Robust revenue growth
Nestlé’s revenue growth from CY07-CY11 has been at a CAGR of 20.9% to | 7491 crore led by robust growth in the prepared dishes (Maggi) and chocolate segment. We believe the prepared dishes segment, chocolates and milk products segment would continue to witness strong volume as well as value growth in future. We believe the company would aggressively launch new products in CY12E and CY13E (considering huge capacity addition during CY10-13E) and witness revenue growth of 17.8% CAGR during CY11-13E to | 10394 crore. Exhibit 25: Net sales (| crore) trend
3504 4324 51296255
74918902
10394
23.4
18.6
21.919.8
16.8
18.8
24.4
0
4000
8000
12000
CY07 CY08 CY09 CY10 CY11 CY12E CY13E
0
5
10
15
20
25
30
Net Sales (LHS) in | crore Revenue growth (%)- RHS
Source: Company, ICICIdirect.com Research
EBITDA margins sustain at ~20% Nestlé’s EBITDA margin has expanded from 19.9% in CY07 to 20.7% in CY11 despite a sharp rise in milk and other commodity prices. The company has taken calibrated price hikes and grammage reductions in order to fight sticky food inflation. Nestlé’ commands high gross margins in milk products, beverages and chocolates whereas moderate price hikes in Maggi, due to increasing competition, has led to the shrinkage in its gross margins. We believe food inflation would cool off in the near term and the company would not take similar price hikes in future. We expect margins to remain at above ~20% in CY12E and CY13E.
Exhibit 26: EBITDA margin (%) trend
19.920.0
20.2
20.0
20.7
20.5
20.7
19.4
19.6
19.8
20.0
20.2
20.4
20.6
20.8
CY07 CY08 CY09 CY10 CY11 CY12E CY13E
EBITDA Margins (%)
Source: Company, ICICIdirect.com Research
Revenue is expect to grow at a CAGR of 17.8%
led by robust volume growth in Maggi and milk
products
We believe food inflation would cool off in the near
term and the company would not take similar
price hikes in future. We expect margins to remain above ~20% in CY12E and CY13E

Page 16ICICI Securities Ltd | Retail Equity Research
Earnings growth to remain strong
The company’s net profit has grown at a CAGR of 23.5% to | 962 crore during CY07-11 mainly led by increasing revenues, sustained EBITDA margins and higher other income. Other income has grown from | 25.4 crore in CY07 to | 50.9 crore in CY11. We believe earnings will grow at a CAGR of 20.7% during CY11-13E to | 1401 crore led by higher revenue growth and sustained margins.
Exhibit 27: Net profit (| crore) trend
414 534 655 819 962 1177 1401
31.329.1
22.625.0
17.519.0
22.4
0
400
800
1200
1600
CY07 CY08 CY09 CY10 CY11 CY12E CY13E
0
5
10
15
20
25
30
35
Net Profit (| crore)-LHS Growth (%)-RHS
Source: Company, ICICIdirect.com Research
Return ratios to come down substantially
Nestlé’s return ratios have always been very high due to strong earnings growth, low capex and high dividend payout. The company’s RoCE and RoE have come down from CY07 to CY11 due to a reduction in dividend payout on the back of higher accruals and debt requirement for capex. The company is undertaking ~|2300 crore of capital expense, which is higher than the cumulative previous five year capex. We believe return of equity will further go down to ~57% in CY13E. Similarly, RoCE will further come down to ~67% in CY13E due to the peak capital requirement. However, we believe in the long run, the company would increase its dividend payout once the current capex cycle is over.
Exhibit 28: Return ratios (%) trend
98.9112.8 112.7
95.7
64.1 57.1
147.5163.0 158.8
131.2
64.6 67.075.5
62.3
0
30
60
90
120
150
180
CY07 CY08 CY09 CY10 CY11 CY12E CY13E
RoE(%) RoCE(%)
Source: Company, ICICIdirect.com Research
We believe earnings will grow at a CAGR of 20.7%
during CY11-13E to | 1401 crore led by higher revenue growth and sustained margins
We believe RoE and RoCE will further go down to ~57%
and ~67% by CY13E, respectively due to the peak capital
requirement. However, we believe the company would
increase its dividend payout and improve return ratios once
the current capex cycle is over

Page 17ICICI Securities Ltd | Retail Equity Research
Steady dividends to increase yield in the long term
Nestlé’s dividend payout has come down substantially on the back of higher capital requirement to fund capex. We expect the payout to further come down due to peak funds requirement in CY12E-13E. However, we believe dividend payout will increase post CY13E after most of the capex requirements are over.
NIL’s dividend yield is expected to almost double by CY13E compared to that of CY07. With the stock price being ~|1000 in CY07 (for those who hasd invested in CY07), return trough dividend yield stood at 3.3% and rose to ~5% in CY11 (jump of ~47% in 5 years). With the expected dividend of |70/share in CY13E, the yield for the investor would increase to ~7%, accounting almost 2x the jump in yield. Hence, we believe that investment at current levels would entail similar benefits to the investors in 3-5 years from now. Exhibit 29: Dividend payout (%) and dividend per share (|)
33.0 42.5 48.5 48.5 48.5 55.0 70.0
76.9 76.771.4
57.148.6 48.245.1
0
30
60
90
CY07 CY08 CY09 CY10 CY11 CY12E CY13E
0
20
40
60
80
Divident per share (|) Divident payout (%)
Source: Company, ICICIdirect.com Research
Negative working capital
Nestlé’s efficient working capital management results in strong free cash flows. This has enabled the company to even pay higher interim dividend. We believe the company’s net working capital would continue to remain negative, going forward. Exhibit 30: Net working capital (| crore)
-320-387
-587-645
-998
-873-1037
-1200
-1000
-800
-600
-400
-200
0
CY07 CY08 CY09 CY10 CY11E CY12E CY13E
Net Working capital (| crore)
Source: Company, ICICIdirect.com Research
Dividend payout has come down from ~75% in
CY07 to 48% in CY11 and would further come
down to 33% in CY13E due to higher capex requirements
Nestlé’s efficient working capital management
results in strong free cash flows, which has
enabled the company to even pay higher interim dividend.
Page 18ICICI Securities Ltd | Retail Equity Research
Risk & concerns Volatile commodity prices In the last two years, commodity prices have risen sharply, specifically milk, sugar and wheat. Milk and sugar prices have almost doubled in last four years. The company has passed on this increase to consumers, which has curbed volumes growth in segments like beverages and milk products. If these commodity prices continue to witness a similar sharp increase, we believe the company would be unable to pass on the entire increase to consumers, which could negatively impact margins, going forward.
Volume growth may moderate The company has taken price increases in CY10 and CY11 to maintain its margins as cost pressures continue due to commodity inflation. This has significantly impacted volumes in CY11. Volume growth in CY11 has been 7.7% as against average 14.2% in the previous five years. We believe the company has to concentrate on volume growth specifically in some segments like beverages and chocolates. If Nestlé continues to focus on margins and gives away volume growth, it could lose market share to some of its competitors.
Increasing Competition Though in milk products, the company is facing competition from well established company Amul and some regional companies, it can grow and take significant market share due to demand shift from open to packaged milk. Maggi noodle is Nestlé India’s flagship brand. In the last two years, many new players have entered the noodles category like GSK’s Foodles, ITC’s Sunfeast Yippee and HUL’s Knorr soupy noodles. Simultaneously, most of the brands have been launched in different variants like multi grain, masala and atta noodles. We believe the company needs to constantly launch new variants and needs to aggressively push in newer sub-categories like pastas and macaronis to compete with newer brands with a differentiating strategy.
Rich Valuations The stock is trading at almost 33-38x its one year forward earnings multiple due to sustained revenue growth and EBITDA margins. The stock is trading at almost 30-40% premium to the FMCG index, which makes it vulnerable to any negative event. We believe any substantial decline in revenue or margins would not only negatively impact earnings but would also shrink valuation multiples. This can result in a sharp correction in the stock price.

Page 19ICICI Securities Ltd | Retail Equity Research
Valuation We have valued the stock on average fair value of PE, price to sales and DCF methodology and assigning a TP of | 5074/share. Historically, NIL has traded at 1.5x premium to FMCG index which we believe is justified backed by consistency in its earnings, strong free cash flows, high RoEs, efficient management and opportunity size of its businesses.
Price to Earnings (P/E) At CMP, stock is trading at 37.7x its CY12E EPS of |122.1 and 31.7x its CY13E EPS of |145.3, which is 30% premium to its historic average (average has been 27x 1-year forward P/E from CY07-11). NIL has achieved growth at 20.9% and 23.5% CAGR in net sales and earnings, respectively from CY07-11. Given such a high revenue and earnings growth, we believe the high valuation is justified. With the expected revenue growth of 17.8% and earnings growth of 20.7% (CAGR CY11-13E) on the back of huge capex and various new launches, we assign the stock a P/E multiple of 35x to its CY13E EPS arriving at fair value of |5084/share. Exhibit 31: 1-year P/E Band
0
2000
4000
6000
Dec-
05
Apr-0
6
Aug-
06
Dec-
06
Apr-0
7
Aug-
07
Dec-
07
Apr-0
8
Aug-
08
Dec-
08
Apr-0
9
Aug-
09
Dec-
09
Apr-1
0
Aug-
10
Dec-
10
Apr-1
1
Aug-
11
Dec-
11
Apr-1
2
Aug-
12
Close price 18x 23x 28x 33x 38x
Source: Bloomberg, ICICIdirect.com Research

Page 20ICICI Securities Ltd | Retail Equity Research
Price to Sales (P/S) At CMP, the stock is trading at 5.0x its CY12E sales/share of |923 and 4.3x its CY13E sales/share of |1078. Historically, the stock has traded in the range of 3-5x its sales per share. Using P/S valuation, assigning it a multiple of 4.7x its CY13E sales/share |1078, the fair value for NIL would be |5067/share. Exhibit 32: One year Price to sales band (x)
0
1000
2000
3000
4000
5000
Dec-
05
Apr-0
6
Aug-
06
Dec-
06
Apr-0
7
Aug-
07
Dec-
07
Apr-0
8
Aug-
08
Dec-
08
Apr-0
9
Aug-
09
Dec-
09
Apr-1
0
Aug-
10
Dec-
10
Apr-1
1
Aug-
11
Dec-
11
Apr-1
2
Aug-
12
3x 3.5x 4x 4.5x 5x Close price
Source: Company, ICICIdirect.com Research
DCF valuation Using DCF valuation methodology, we have arrived at a fair value of |5069/share, considering a terminal growth of 3% and weighted average cost of capital (WACC) of 7.3%.
Exhibit 33: WACC Assumption
WACC 7.3%
Revenue CAGR over FY11E-20E 15.4%
Present Value of Cash Flow till FY20E 12,917.7
Terminal Growth 3.0%
Present Value of terminal cash flow 36,859.7
PV of firm 49,777.4
Less: Current Debt 970.9
Total present value of the Equity (excluding current cash) 48,806.5
Number of Equity Shares outstanding 9.6
Per Share Value (excluding current cash) 5,062.1
Add Current Cash Per Share 7.3
DCF - Target price (|) 5,069.4
Source: Company, ICICIdirect.com Research
Exhibit 34: DCF sensitivity analysis
6.3% 6.8% 7.3% 7.8% 8.3%
2.0% 5,485 4,838 4,316 3,885 3,524
2.5% 6,057 5,272 4,653 4,152 3,739
3.0% 6,804 5,821 5,069 4,476 3,996
3.5% 7,820 6,537 5,596 4,875 4,307
4.0% 9,279 7,511 6,282 5,380 4,689
WACC %
Term
inal
Gro
wth
Ra
te %
Source: Company, ICICIdirect.com Research

Page 21ICICI Securities Ltd | Retail Equity Research
Peer comparison NIL is trading at a significant premium to its global as well as domestic peers. We believe NIL would continue to command premium valuations compared to its peers due to its presence in the high growth and high margin categories.
Exhibit 35: Peer comparison
Indian peers Mkt Cap (| crore) Sales (| crore) EPS (in |) P/E (x) P/S (x) EV/EBITDA (x) P/B (x) RoE (%)HUL 83022 29107 16.1 23.9 2.9 18.3 18.1 81.1ITC 178308 32435 10.8 19.1 4.9 12.1 7.2 37.5GSK 10997 4398 145.8 18.0 2.5 12.8 5.7 35.0Dabur 17929 5895 4.8 21.6 3.0 17.2 6.6 35.7Average 20.6 3.3 15.1 9.4 47.3
Global Peers Mkt Cap (| crore) Sales (| crore) EPS (US$) P/E (x) P/S (x) EV/EBITDA (x) P/B (x) RoE (%)Kraft 322099 280569 2.8 13.6 1.1 9.0 1.6 12.7Pepsi 476093 325097 4.1 15.4 1.5 9.7 4.4 30.7ConAgra 51826 63288 1.8 14.5 0.8 7.8 2.2 15.5Kellog 89899 66792 3.5 15.1 1.3 10.1 6.7 58.3Tyson 35170 172094 2.3 8.6 0.2 4.4 1.0 11.9Average 13.4 1.0 8.2 3.2 25.8
Source: Company, ICICIdirect.com Research

Page 22ICICI Securities Ltd | Retail Equity Research
Exhibit 36: Profit & Loss Accounts (| crore)
(Year-end December) CY09 CY10 CY11 CY12E CY13ENet Sales 5,129.4 6,254.7 7,490.8 8,902.3 10,393.6 Other Operating Income - - - - - Total Operating Income 5,129.4 6,254.7 7,490.8 8,902.3 10,393.6 Other Income 37.8 42.7 50.9 64.5 70.3 Total Revenue 5,167.2 6,297.4 7,541.7 8,966.8 10,463.9
- - - - - - Raw Material Expenses 2,014.3 2,560.1 2,933.4 3,490.5 4,068.6 Packaging Material consumed 383.8 482.7 589.4 665.2 766.7 Manufacturing cost 125.9 78.2 251.4 182.2 213.0 Power and Fuel 158.9 219.2 295.8 318.9 372.7 Employee Expenses 432.4 433.4 546.5 710.7 777.4 Marketing Expenses 516.5 613.5 680.0 865.6 1,011.7 Administrative Expenses 412.8 605.3 575.1 738.1 905.2 Total Operating Expenditure 4,094.9 5,005.1 5,938.1 7,080.6 8,243.1
- - - - - - EBITDA 1,034.5 1,249.7 1,552.8 1,821.7 2,150.5 Interest 1.4 1.1 5.1 23.1 16.5 PBDT 1,070.9 1,291.2 1,598.6 1,863.1 2,204.3 Depreciation 111.3 127.8 153.3 139.4 191.3 PBT 917.0 1,145.1 1,387.9 1,723.7 2,013.0 Total Tax 262.0 326.4 426.4 546.7 612.3 PAT before MI 655.0 818.7 961.6 1,177.0 1,400.7 Minority Interest - - - - - PAT 655.0 818.7 961.6 1,177.0 1,400.7 EPS 67.9 84.9 99.7 122.1 145.3
Source: Company, ICICIdirect.com Research
Exhibit 37: Balance Sheet (| crore)
(Year-end December) CY09 CY10 CY11 CY12E CY13EEquity Capital 96.4 96.4 96.4 96.4 96.4 Reserve and Surplus 484.8 759.0 1,177.5 1,738.9 2,356.0 Total Shareholders funds 581.3 855.4 1,273.9 1,835.3 2,452.4 Secured Loan - - 970.9 770.9 470.9 Unsecured Loan - - - - - Total Debt - - 970.9 770.9 470.9 Deferred Tax Liability 32.0 33.3 43.5 53.7 58.7 Toal Liabilities 613.3 888.7 2,288.3 2,659.9 2,982.0
- - - - - - - - - -
Gross Block 1,587.2 1,795.8 2,493.3 3,393.3 3,893.3 Less: Accumulated Depreciation 673.3 761.8 917.6 1,057.0 1,248.3 Net Block 913.9 1,034.0 1,575.8 2,336.4 2,645.0 Capital work in progress 79.6 348.9 1,575.8 1,175.8 975.8 Total Fixed Assets 993.5 1,382.9 3,151.5 3,512.1 3,620.8 Net Intangible Assets 3.6 (0.0) (0.0) (0.0) (0.0) Investments 203.3 150.7 134.4 184.4 234.4 Inventory 498.7 576.0 734.0 973.2 1,304.8 Debtors 64.2 63.3 115.4 146.3 199.3 Loans and Advances 138.0 151.4 196.4 248.8 374.8 Cash 134.3 234.0 70.1 104.8 66.9 Total Current Assets 835.3 1,024.7 1,115.9 1,473.1 1,945.9 Creditors 587.6 761.7 1,009.6 1,195.1 1,281.4 Total Current Liabilities 1,422.4 1,669.6 2,113.5 2,509.7 2,819.1 Net Current Assets (587.1) (644.9) (997.6) (1,036.6) (873.2) Total Assets 613.3 888.7 2,288.3 2,659.9 2,982.0
Source: Company, ICICIdirect.com Research
Page 23ICICI Securities Ltd | Retail Equity Research
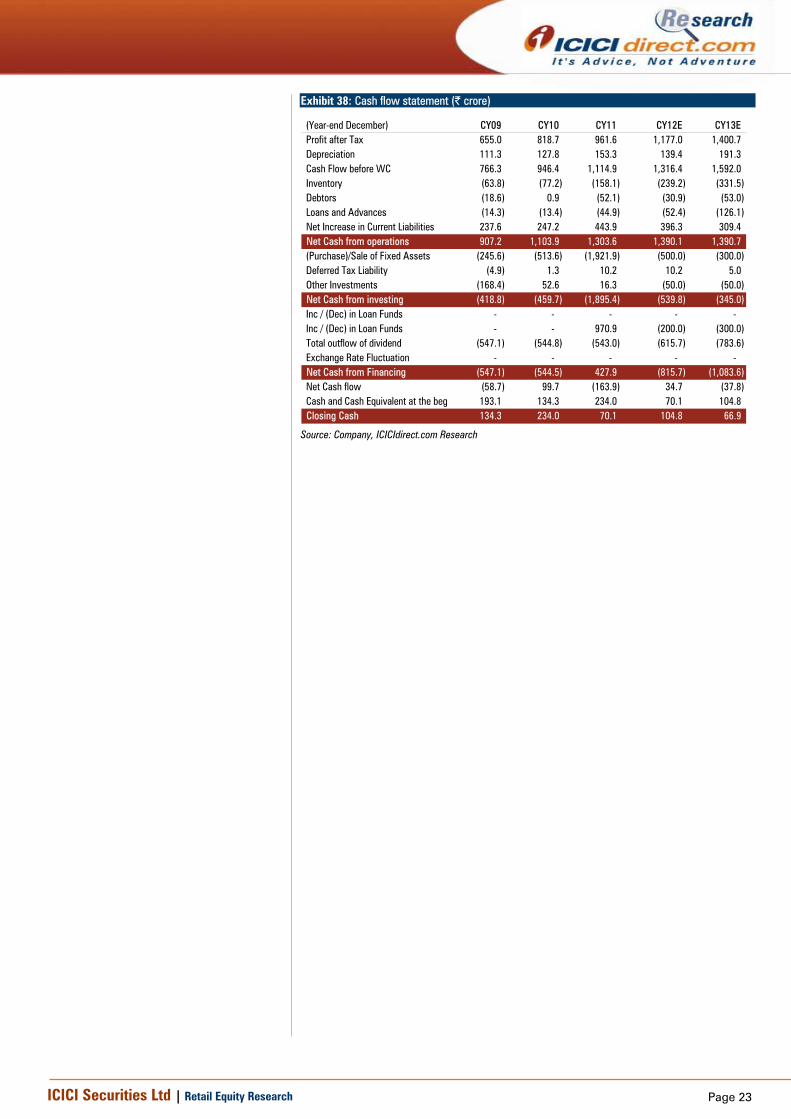
Exhibit 38: Cash flow statement (| crore)
(Year-end December) CY09 CY10 CY11 CY12E CY13EProfit after Tax 655.0 818.7 961.6 1,177.0 1,400.7 Depreciation 111.3 127.8 153.3 139.4 191.3 Cash Flow before WC 766.3 946.4 1,114.9 1,316.4 1,592.0 Inventory (63.8) (77.2) (158.1) (239.2) (331.5) Debtors (18.6) 0.9 (52.1) (30.9) (53.0) Loans and Advances (14.3) (13.4) (44.9) (52.4) (126.1) Net Increase in Current Liabilities 237.6 247.2 443.9 396.3 309.4 Net Cash from operations 907.2 1,103.9 1,303.6 1,390.1 1,390.7 (Purchase)/Sale of Fixed Assets (245.6) (513.6) (1,921.9) (500.0) (300.0) Deferred Tax Liability (4.9) 1.3 10.2 10.2 5.0 Other Investments (168.4) 52.6 16.3 (50.0) (50.0) Net Cash from investing (418.8) (459.7) (1,895.4) (539.8) (345.0) Inc / (Dec) in Loan Funds - - - - - Inc / (Dec) in Loan Funds - - 970.9 (200.0) (300.0) Total outflow of dividend (547.1) (544.8) (543.0) (615.7) (783.6) Exchange Rate Fluctuation - - - - - Net Cash from Financing (547.1) (544.5) 427.9 (815.7) (1,083.6) Net Cash flow (58.7) 99.7 (163.9) 34.7 (37.8) Cash and Cash Equivalent at the beg 193.1 134.3 234.0 70.1 104.8 Closing Cash 134.3 234.0 70.1 104.8 66.9
Source: Company, ICICIdirect.com Research
Page 24ICICI Securities Ltd | Retail Equity Research
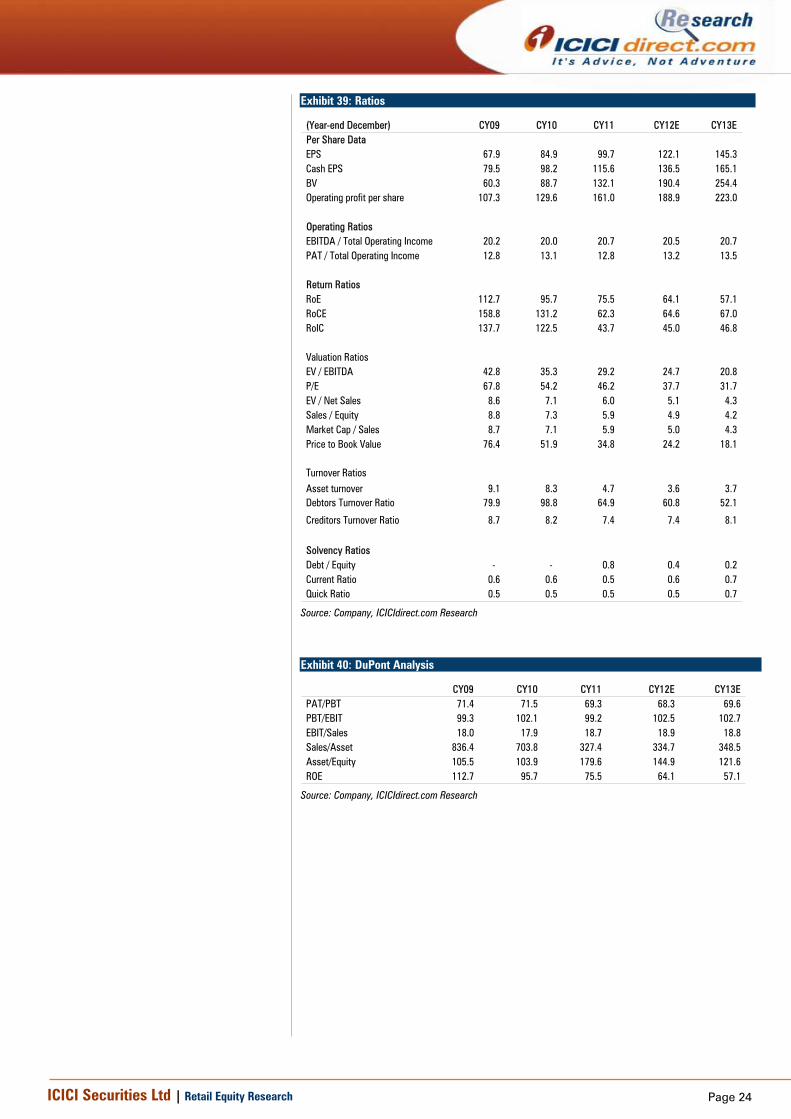
Exhibit 39: Ratios
(Year-end December) CY09 CY10 CY11 CY12E CY13EPer Share DataEPS 67.9 84.9 99.7 122.1 145.3 Cash EPS 79.5 98.2 115.6 136.5 165.1 BV 60.3 88.7 132.1 190.4 254.4 Operating profit per share 107.3 129.6 161.0 188.9 223.0
Operating RatiosEBITDA / Total Operating Income 20.2 20.0 20.7 20.5 20.7 PAT / Total Operating Income 12.8 13.1 12.8 13.2 13.5
Return RatiosRoE 112.7 95.7 75.5 64.1 57.1 RoCE 158.8 131.2 62.3 64.6 67.0 RoIC 137.7 122.5 43.7 45.0 46.8
Valuation RatiosEV / EBITDA 42.8 35.3 29.2 24.7 20.8 P/E 67.8 54.2 46.2 37.7 31.7 EV / Net Sales 8.6 7.1 6.0 5.1 4.3 Sales / Equity 8.8 7.3 5.9 4.9 4.2 Market Cap / Sales 8.7 7.1 5.9 5.0 4.3 Price to Book Value 76.4 51.9 34.8 24.2 18.1
Turnover RatiosAsset turnover 9.1 8.3 4.7 3.6 3.7 Debtors Turnover Ratio 79.9 98.8 64.9 60.8 52.1
Creditors Turnover Ratio 8.7 8.2 7.4 7.4 8.1
Solvency RatiosDebt / Equity - - 0.8 0.4 0.2 Current Ratio 0.6 0.6 0.5 0.6 0.7 Quick Ratio 0.5 0.5 0.5 0.5 0.7
Source: Company, ICICIdirect.com Research
Exhibit 40: DuPont Analysis
CY09 CY10 CY11 CY12E CY13EPAT/PBT 71.4 71.5 69.3 68.3 69.6 PBT/EBIT 99.3 102.1 99.2 102.5 102.7 EBIT/Sales 18.0 17.9 18.7 18.9 18.8 Sales/Asset 836.4 703.8 327.4 334.7 348.5 Asset/Equity 105.5 103.9 179.6 144.9 121.6 ROE 112.7 95.7 75.5 64.1 57.1
Source: Company, ICICIdirect.com Research

Page 25ICICI Securities Ltd | Retail Equity Research
Appendix
Exhibit 41: Milk Price Index
90
120
150
180
210
Jan-
07
May
-07
Sep-
07
Jan-
08
May
-08
Sep-
08
Jan-
09
May
-09
Sep-
09
Jan-
10
May
-10
Sep-
10
Jan-
11
May
-11
Sep-
11
Jan-
12
Source: Bloomberg, ICICIdirect.com Research
Exhibit 42: JP Morgan Arabica Coffee Index
0
1000
2000
3000
Jan-
07
May
-07
Sep-
07
Jan-
08
May
-08
Sep-
08
Jan-
09
May
-09
Sep-
09
Jan-
10
May
-10
Sep-
10
Jan-
11
May
-11
Sep-
11
Jan-
12
Source: Bloomberg, ICICIdirect.com Research
Exhibit 43: Wheat Price Index
80
120
160
200
Jan-
07
May
-07
Sep-
07
Jan-
08
May
-08
Sep-
08
Jan-
09
May
-09
Sep-
09
Jan-
10
May
-10
Sep-
10
Jan-
11
May
-11
Sep-
11
Jan-
12
Source: Bloomberg, ICICIdirect.com Research
Exhibit 44: Vegetable oil prices trend (|/kg)
100
110
120
130
140
150Ja
n-07
Jul-0
7
Jan-
08
Jul-0
8
Jan-
09
Jul-0
9
Jan-
10
Jul-1
0
Jan-
11
Source: Bloomberg ICICIdirect.com Research
Exhibit 45: Palm oil prices trend (|/quintal)
0
300
600
900
1200
1500
Jan-
07
May
-07
Sep-
07
Jan-
08
May
-08
Sep-
08
Jan-
09
May
-09
Sep-
09
Jan-
10
May
-10
Sep-
10
Jan-
11
May
-11
Sep-
11
Jan-
12
Source: Bloomberg, ICICIdirect.com Research
Exhibit 46: Delhi sugar prices (| per quintal) trend
1000
2000
3000
4000
5000
Jan-
07
May
-07
Sep-
07
Jan-
08
May
-08
Sep-
08
Jan-
09
May
-09
Sep-
09
Jan-
10
May
-10
Sep-
10
Jan-
11
May
-11
Sep-
11
Jan-
12
Source: Bloomberg ICICIdirect.com Research

Page 26ICICI Securities Ltd | Retail Equity Research
RATING RATIONALE ICICIdirect.com endeavours to provide objective opinions and recommendations. ICICIdirect.com assigns ratings to its stocks according to their notional target price vs. current market price and then categorises them as Strong Buy, Buy, Hold and Sell. The performance horizon is two years unless specified and the notional target price is defined as the analysts' valuation for a stock. Strong Buy: >15%/20% for large caps/midcaps, respectively, with high conviction; Buy: > 10%/ 15% for large caps/midcaps, respectively; Hold: Up to +/-10%; Sell: -10% or more;
Pankaj Pandey Head – Research [email protected]
ICICIdirect.com Research Desk, ICICI Securities Limited, 1st Floor, Akruti Trade Centre, Road No. 7, MIDC, Andheri (East) Mumbai – 400 093
ANALYST CERTIFICATION We /I, Sanjay Manyal MBA (FINANCE) Parineeta Poddar MBA (FINANCE) research analysts, authors and the names subscribed to this report, hereby certify that all of the views expressed in this research report accurately reflect our personal views about any and all of the subject issuer(s) or securities. We also certify that no part of our compensation was, is, or will be directly or indirectly related to the specific recommendation(s) or view(s) in this report. Analysts aren't registered as research analysts by FINRA and might not be an associated person of the ICICI Securities Inc.
Disclosures: ICICI Securities Limited (ICICI Securities) and its affiliates are a full-service, integrated investment banking, investment management and brokerage and financing group. We along with affiliates are leading underwriter of securities and participate in virtually all securities trading markets in India. We and our affiliates have investment banking and other business relationship with a significant percentage of companies covered by our Investment Research Department. Our research professionals provide important input into our investment banking and other business selection processes. ICICI Securities generally prohibits its analysts, persons reporting to analysts and their dependent family members from maintaining a financial interest in the securities or derivatives of any companies that the analysts cover.
The information and opinions in this report have been prepared by ICICI Securities and are subject to change without any notice. The report and information contained herein is strictly confidential and meant solely for the selected recipient and may not be altered in any way, transmitted to, copied or distributed, in part or in whole, to any other person or to the media or reproduced in any form, without prior written consent of ICICI Securities. While we would endeavour to update the information herein on reasonable basis, ICICI Securities, its subsidiaries and associated companies, their directors and employees (“ICICI Securities and affiliates”) are under no obligation to update or keep the information current. Also, there may be regulatory, compliance or other reasons that may prevent ICICI Securities from doing so. Non-rated securities indicate that rating on a particular security has been suspended temporarily and such suspension is in compliance with applicable regulations and/or ICICI Securities policies, in circumstances where ICICI Securities is acting in an advisory capacity to this company, or in certain other circumstances.
This report is based on information obtained from public sources and sources believed to be reliable, but no independent verification has been made nor is its accuracy or completeness guaranteed. This report and information herein is solely for informational purpose and may not be used or considered as an offer document or solicitation of offer to buy or sell or subscribe for securities or other financial instruments. Though disseminated to all the customers simultaneously, not all customers may receive this report at the same time. ICICI Securities will not treat recipients as customers by virtue of their receiving this report. Nothing in this report constitutes investment, legal, accounting and tax advice or a representation that any investment or strategy is suitable or appropriate to your specific circumstances. The securities discussed and opinions expressed in this report may not be suitable for all investors, who must make their own investment decisions, based on their own investment objectives, financial positions and needs of specific recipient. This may not be taken in substitution for the exercise of independent judgment by any recipient. The recipient should independently evaluate the investment risks. The value and return of investment may vary because of changes in interest rates, foreign exchange rates or any other reason. ICICI Securities and affiliates accept no liabilities for any loss or damage of any kind arising out of the use of this report. Past performance is not necessarily a guide to future performance. Investors are advised to see Risk Disclosure Document to understand the risks associated before investing in the securities markets. Actual results may differ materially from those set forth in projections. Forward-looking statements are not predictions and may be subject to change without notice.
ICICI Securities and its affiliates might have managed or co-managed a public offering for the subject company in the preceding twelve months. ICICI Securities and affiliates might have received compensation from the companies mentioned in the report during the period preceding twelve months from the date of this report for services in respect of public offerings, corporate finance, investment banking or other advisory services in a merger or specific transaction. It is confirmed that Sanjay Manyal MBA (FINANCE) Parineeta Poddar MBA (FINANCE) research analysts and the authors of this report have not received any compensation from the companies mentioned in the report in the preceding twelve months. Our research professionals are paid in part based on the profitability of ICICI Securities, which include earnings from Investment Banking and other business.
ICICI Securities or its subsidiaries collectively do not own 1% or more of the equity securities of the Company mentioned in the report as of the last day of the month preceding the publication of the research report.
It is confirmed that Sanjay Manyal MBA (FINANCE) Parineeta Poddar MBA (FINANCE) research analysts and the authors of this report or any of their family members does not serve as an officer, director or advisory board member of the companies mentioned in the report.
ICICI Securities may have issued other reports that are inconsistent with and reach different conclusion from the information presented in this report. ICICI Securities and affiliates may act upon or make use of information contained in the report prior to the publication thereof.
This report is not directed or intended for distribution to, or use by, any person or entity who is a citizen or resident of or located in any locality, state, country or other jurisdiction, where such distribution, publication, availability or use would be contrary to law, regulation or which would subject ICICI Securities and affiliates to any registration or licensing requirement within such jurisdiction. The securities described herein may or may not be eligible for sale in all jurisdictions or to certain category of investors. Persons in whose possession this document may come are required to inform themselves of and to observe such restriction.