march quarter 2018 results - alibabagroup.com · cash, cash equivalents and short-term investments...
TRANSCRIPT

March Quarter 2018 Results
May 4, 2018

Disclaimer
2
This presentation contains forward-looking statements. These statements are made under the “safe harbor” provisions of the U.S. Private Securities Litigation Reform Act of 1995. These forward-looking statements can be identified by terminology such as “will,” “expects,” “anticipates,” “future,” “intends,” “plans,” “believes,” “estimates,” “potential,” “continue,” “ongoing,” “targets,” “guidance” and similar statements. Among other things, statements that are not historical facts, including statements about Alibaba’s strategies and business plans, Alibaba’s beliefs and expectations regarding the growth of its businesses and its revenue, the business outlook and quotations from management in this presentation, as well as Alibaba’s strategic and operational plans, are or contain forward-looking statements. Alibaba may also make forward-looking statements in its periodic reports to the U.S. Securities and Exchange Commission (the “SEC”), in press releases and other written materials and in oral statements made by its officers, directors or employees to third parties. Forward-looking statements involve inherent risks and uncertainties. A number of factors could cause actual results to differ materially from those contained in any forward-looking statement, including but not limited to the following: Alibaba’s goals and strategies; Alibaba’s future business development; Alibaba’s ability to maintain the trusted status of its ecosystem, reputation and brand; risks associated with increased investments in Alibaba’s business and new business initiatives; risks associated with strategic acquisitions and investments; Alibaba’s ability to retain or increase engagement of consumers, merchants and other participants in its ecosystem and enable new offerings; Alibaba’s ability to maintain or grow its revenue or business; risks associated with limitation or restriction of services provided by Alipay; changes in laws, regulations and regulatory environment that affect Alibaba’s business operations; privacy and regulatory concerns; competition; security breaches; the continued growth of the e-commerce market in China and globally; risks associated with the performance of our business partners, including but not limited to Ant Financial, and fluctuations in general economic and business conditions in China and globally and assumptions underlying or related to any of the foregoing. Further information regarding these and other risks is included in Alibaba’s filings with the SEC. All information provided in this presentation is as of the date of this presentation and are based on assumptions that we believe to be reasonable as of this date, and Alibaba does not undertake any obligation to update any forward-looking statement, except as required under applicable law.
This presentation contains certain financial measures that are not recognized under generally accepted accounting principles in the United States (“GAAP”), including adjusted EBITDA (including adjusted EBITDA margin), adjusted EBITA (including adjusted EBITA margin), non-GAAP net income, non-GAAP diluted EPS and free cash flow. For a reconciliation of these non-GAAP financial measures to the most directly comparable GAAP measures, see GAAP to adjusted Non-GAAP measures Reconciliation.

3
617 MM Mobile MAUs (1)
Notes: Unless otherwise indicated, all figures above are for the three months ended Mar 31, 2018.(1) For the month ended Mar 31, 2018; in a given month, the number of unique mobile devices that were used to visit or access certain of our mobile applications
at least once during that month.(2) Formerly annual active buyers; for the 12-month period ended Mar 31, 2018; the number of annual active consumers on our China retail marketplaces.(3) All translations of RMB into US$ were made at RMB6.2726 to US$1.00, the exchange rate on Mar 30, 2018 as set forth in the H.10 statistical release of the
Federal Reserve Board.
March Quarter 2018 Financial Highlights
61% YoY Total Revenue Growth
552 MMAnnual Active Consumers (2)
103% YoYCloud Computing Revenue Growth 62% YoY
Core CommerceRevenue Growth
43% Core Commerce EBITA Margin
Revenue Cloud
Profitability and
Cash FlowConsumers
US$1.4 Bn(3)
Non-GAAP Free Cash Flow
Total Revenue Breakdown
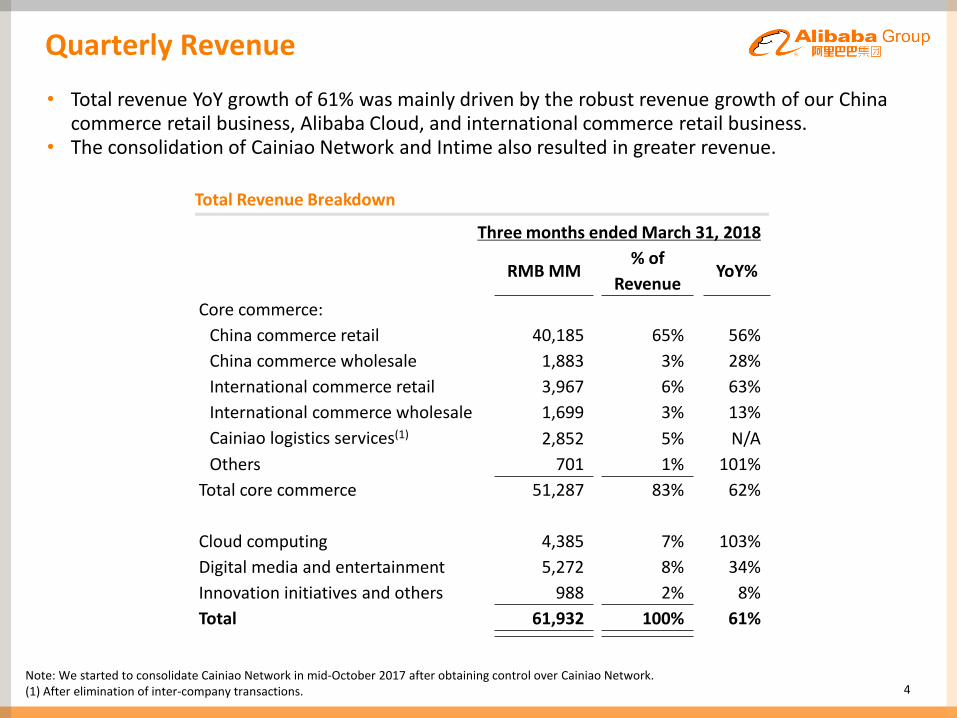
Quarterly Revenue
• Total revenue YoY growth of 61% was mainly driven by the robust revenue growth of our China commerce retail business, Alibaba Cloud, and international commerce retail business.
• The consolidation of Cainiao Network and Intime also resulted in greater revenue.
4
Three months ended March 31, 2018
RMB MM% of
RevenueYoY%
Core commerce:
China commerce retail 40,185 65% 56%
China commerce wholesale 1,883 3% 28%
International commerce retail 3,967 6% 63%
International commerce wholesale 1,699 3% 13%
Cainiao logistics services(1) 2,852 5% N/A
Others 701 1% 101%
Total core commerce 51,287 83% 62%
Cloud computing 4,385 7% 103%
Digital media and entertainment 5,272 8% 34%
Innovation initiatives and others 988 2% 8%
Total 61,932 100% 61%
Note: We started to consolidate Cainiao Network in mid-October 2017 after obtaining control over Cainiao Network.(1) After elimination of inter-company transactions.

2.3 3.1 3.1
Sep 30, 2017 Dec 31, 2017 Mar 31, 2018
5
Quarterly Cost Trends
Cost of Revenue (Excluding SBC) Product Development Expenses (Excluding SBC)
3.4 4.4 4.2
Sep 30, 2017 Dec 31, 2017 Mar 31, 2018
Sales & Marketing Expenses (Excluding SBC)
5.8 8.1 7.0
Sep 30, 2017 Dec 31, 2017 Mar 31, 2018
General & Administrative Expenses (Excluding SBC)
(RMB Bn) (RMB Bn)
(RMB Bn) (RMB Bn)
20.6
33.8 30.8
Sep 30, 2017 Dec 31, 2017 Mar 31, 2018
40% 50%
Note: For the three months ended on the respective dates.
38%% of Revenue
5%6%% of Revenue
7%
11%10%% of
Revenue10% 5%4%
% of Revenue
4%

4.35
5.73
Mar 31, 2017 Mar 31, 2018
Non-GAAP Diluted EPS
Non-GAAP Net Income and Non-GAAP Diluted EPS
6
Non-GAAP Net Income(1)
(RMB Bn)
Notes: Unless otherwise indicated, all figures in the above charts are for the three months ended on the respective dates.(1) Non-GAAP net income represents net income before share-based compensation expense, amortization, impairment of goodwill and investments, gain on deemed
disposals/disposals/revaluation of investments, amortization of excess value receivable arising from the restructuring of commercial arrangements with Ant Financial, immediate recognition of unamortized professional fees and upfront fees upon termination of bank borrowings and others, as adjusted for the tax effects on non-GAAP adjustments.
(2) Non-GAAP diluted EPS represents non-GAAP net income attributable to ordinary shareholders divided by the weighted average number of shares outstanding during the periods on a diluted basis, including accounting for the effects of the assumed conversion of convertible preference shares.
(3) All translations of RMB into US$ were made at RMB6.2726 to US$1.00, the exchange rate on Mar 30, 2018 as set forth in the H.10 statistical release of the Federal Reserve Board.
10.4
14.1
Mar 31, 2017 Mar 31, 2018
Non-GAAP Net Income
Non-GAAP Diluted EPS(2)
(RMB)
32%35%
US$0.91(3)

Free Cash Flow and Cash
7
Cash, Cash Equivalents and Short-term Investments
(RMB Bn)
Non-GAAP Free Cash Flow (1)
(RMB Bn)
Notes: Unless otherwise indicated, all figures in the above charts are for the three months ended on the respective dates.(1) Non-GAAP free cash flow represents net cash provided by operating activities as presented in Alibaba Group’s consolidated cash flow statement less purchases of
property and equipment and intangible assets (excluding acquisition of land use rights and construction in progress) and others.(2) All translations of RMB into US$ were made at RMB6.2726 to US$1.00, the exchange rate on Mar 30, 2018 as set forth in the H.10 statistical release of the Federal
Reserve Board.
146.7
220.4 205.4
143.7
212.2 199.3
3.0
8.2 6.1
As of Mar 31, 2017 As of Dec 31, 2017 As of Mar 31, 2018
Cash and Cash Equivalents
Short-term Investments
8.0
46.1
8.6
Mar 31, 2017 Dec 31, 2017 Mar 31, 2018
Non-GAAP Free Cash Flow
US$1.4 Bn(2)
• The decrease in cash, cash equivalents and short-term investments during the quarter ended March 31, 2018 was primarily due to cash used in investing activities, including investments in Wanda Cinemas and Easyhome, and cash used to acquire additional shares of Intime, partly offset by free cash flow generated from operations of RMB8,564 million (US$1,365 million).

2.8
9.0
5.60.6
1.4
1.5
Mar 31, 2017 Dec 31, 2017 Mar 31, 2018
Acquisitions of Land Use Rights and Construction in Progress
Non-real Estate CAPEX and Intangible Assets
Capital Expenditures
8
Capital Expenditures and Intangible Assets
(RMB Bn)
Note: Unless otherwise indicated, all figures in the above charts are for the three months ended on the respective dates.
9%7%Non-real Estate CAPEX and Intangible Assets
as a % of Revenue11%
7.1
3.4
10.4
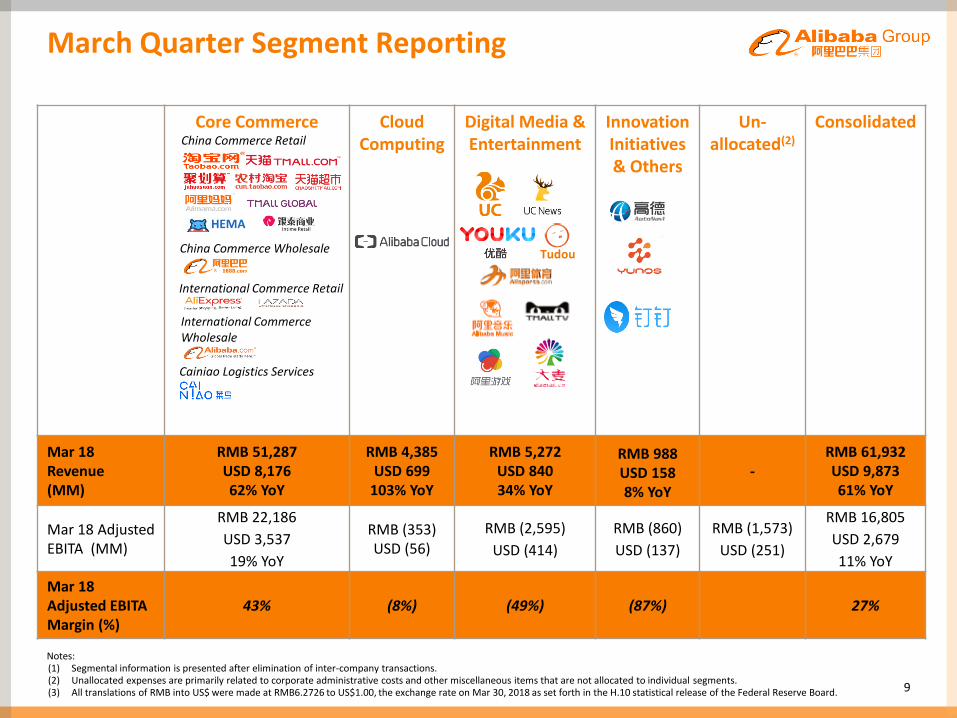
March Quarter Segment Reporting
9
Core Commerce Cloud Computing
Digital Media & Entertainment
Innovation Initiatives& Others
Un-allocated(2)
Consolidated
Mar 18 Revenue (MM)
RMB 51,287USD 8,17662% YoY
RMB 4,385USD 699
103% YoY
RMB 5,272USD 84034% YoY
RMB 988USD 1588% YoY
-RMB 61,932USD 9,87361% YoY
Mar 18 Adjusted EBITA (MM)
RMB 22,186
USD 3,537
19% YoY
RMB (353)USD (56)
RMB (2,595)
USD (414)
RMB (860)
USD (137)
RMB (1,573)
USD (251)
RMB 16,805
USD 2,679
11% YoY
Mar 18 Adjusted EBITA Margin (%)
43% (8%) (49%) (87%) 27%
International Commerce Wholesale
China Commerce Wholesale
International Commerce Retail
Notes:(1) Segmental information is presented after elimination of inter-company transactions.(2) Unallocated expenses are primarily related to corporate administrative costs and other miscellaneous items that are not allocated to individual segments. (3) All translations of RMB into US$ were made at RMB6.2726 to US$1.00, the exchange rate on Mar 30, 2018 as set forth in the H.10 statistical release of the Federal Reserve Board.
Tudou
China Commerce Retail
HEMA
Cainiao Logistics Services

10
Notes: Unless otherwise indicated, all figures above are for the twelve months ended March 31, 2018.(1) All translations of RMB into US$ were made at RMB6.2726 to US$1.00, the exchange rate on Mar 30, 2018 as set forth in the H.10 statistical release of the Federal Reserve Board. (2) For the month ended Mar 31, 2018; in a given month, the number of unique mobile devices that were used to visit or access certain of our mobile applications at least once during that month.(3) Formerly annual active buyers; for the 12-month period ended Mar 31, 2018; the number of annual active consumers on our China retail marketplaces.
Fiscal 2018 Financial Highlights
58% YoY
Total Revenue Growth
101% YoY
Revenue Growth (6%) EBITA Margin
Revenue
Cloud
Strong Profitability and Cash Flow
US$15.8 Bn(1)
Non-GAAP Free Cash Flow
RMB 4.8 Trillion(US$ 768 Bn(1))
Transacted on China retail marketplaces
GMV
Stable YoY EBITA margin,
excluding investments in New Retail, Cainiao Network and
Lazada
Core Commerce
617 MM Mobile MAUs (2)
552 MM Annual Active Consumers (3)
Consumers
Core Commerce
53% EBITA Margin
60% YoY
Revenue Growth

Fiscal 2018 Segment Reporting
11
Core Commerce Cloud Computing
Digital Media &Entertainment
Innovation Initiatives& Others
Un-allocated(2)
Consolidated
FY18 Revenue (MM)
RMB 214,020USD 34,120
60% YoY
RMB 13,390USD 2,135101% YoY
RMB 19,564USD 3,11933% YoY
RMB 3,292USD 52410% YoY
-RMB 250,266USD 39,898
58% YoY
FY18Adjusted EBITA (MM)
RMB 114,100
USD 18,190
38% YoY
RMB (799)USD (127)
RMB (8,305)
USD (1,324)
RMB (2,996)
USD (478)
RMB (4,997)
USD (796)
RMB 97,003
USD 15,465
40% YoY
FY18Adjusted EBITA Margin (%)
53% (6%) (42%) (91%) 39%
Notes:(1) Segmental information is presented after elimination of inter-company transactions.(2) Unallocated expenses are primarily related to corporate administrative costs and other miscellaneous items that are not allocated to individual segments. (3) All translations of RMB into US$ were made at RMB6.2726 to US$1.00, the exchange rate on Mar 30, 2018 as set forth in the H.10 statistical release of the Federal Reserve Board.
Tudou
International Commerce Wholesale
China Commerce Wholesale
International Commerce Retail
China Commerce Retail
HEMA
Cainiao Logistics Services

12
Structural Change to Core Commerce Margin Profile
• New Retail revenue is primarily recorded on a gross basis but our core of Core Commerce revenue is recorded on a net basis. Increasing mix of New Retail revenue inside Core Commerce will structurally change the margin profile of the Core Commerce segment.
• Excluding New Retail, consolidation of Cainiao, and investment in Lazada, the adjusted EBITA margin of the core of core commerce is 63%.
• The adjusted EBITA margin of the core of core commerce improved due to operating leverage net of investments in user and user experience.
• The investment in user and user experience resulted in increasing market leadership and greater user growth for fiscal year 2018.
Note: New Retail primarily includes Intime, Hema, and Tmall Import.
Core CommerceFull FY
FY 2017 Core commerce Adjusted EBITA Margin 62%
Operating leverage net of investments in user and user experience
1%
FY2018 Core of core commerce Adjusted EBITA margin 63%
Investment in New Retail*, consolidation of Cainiao, and Lazada
(10%)
FY2018 Core commerce Adjusted EBITA margin 53%
13
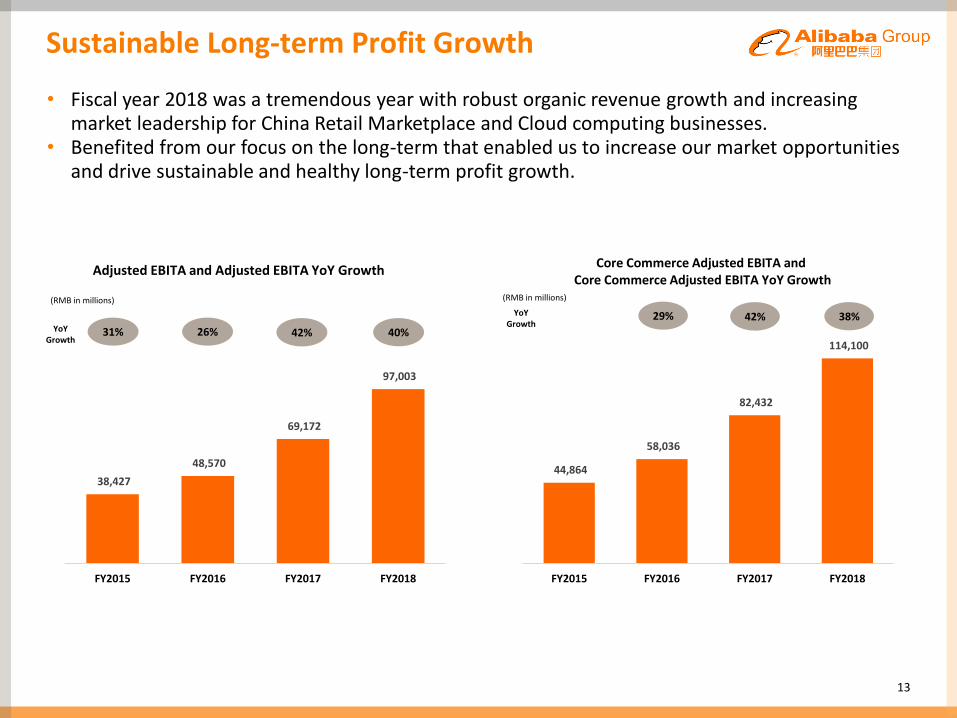
Sustainable Long-term Profit Growth
• Fiscal year 2018 was a tremendous year with robust organic revenue growth and increasing market leadership for China Retail Marketplace and Cloud computing businesses.
• Benefited from our focus on the long-term that enabled us to increase our market opportunities and drive sustainable and healthy long-term profit growth.
38,427
48,570
69,172
97,003
FY2015 FY2016 FY2017 FY2018
(RMB in millions)
Adjusted EBITA and Adjusted EBITA YoY Growth
31% 26% 42% 40%YoY Growth
44,864
58,036
82,432
114,100
FY2015 FY2016 FY2017 FY2018
(RMB in millions)
Core Commerce Adjusted EBITA andCore Commerce Adjusted EBITA YoY Growth
29% 42% 38%YoY Growth
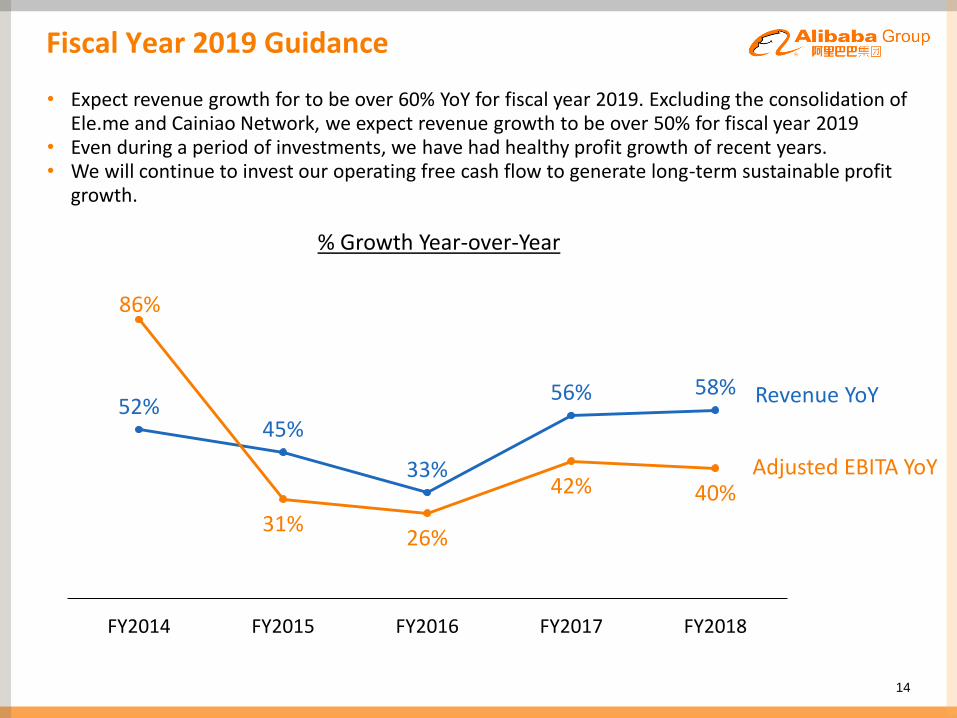
52%45%
33%
56% 58%
86%
31%26%
42% 40%
FY2014 FY2015 FY2016 FY2017 FY2018
% Growth Year-over-Year
14
Fiscal Year 2019 Guidance
• Expect revenue growth for to be over 60% YoY for fiscal year 2019. Excluding the consolidation of Ele.me and Cainiao Network, we expect revenue growth to be over 50% for fiscal year 2019
• Even during a period of investments, we have had healthy profit growth of recent years.• We will continue to invest our operating free cash flow to generate long-term sustainable profit
growth.
Revenue YoY
Adjusted EBITA YoY

15
Share of Results of Equity Investees
In RMB MM unless otherwise stated Mar Q 2017 Mar Q 2018 FY2017 FY2018
Share of (loss) profit of equity investees:
- Koubei (505) - (990) (1,340)
- Cainiao Network* (375) - (1,056) (518)
- Other equity investees
(41) 480 (838) 1,040
Impairment losses - - (245) (18,153)
Dilution losses (61) (75) (336) (128)
Others** (462) (475) (1,562) (1,693)
TOTAL (1,444) (70) (5,027) (20,792)
Note:* We started to consolidate Cainiao Network in mid-October 2017 after obtaining control over Cainiao Network.** Others mainly include amortization of intangible assets of equity investees and share-based compensation expenses.All translations of RMB into US$ were made at RMB6.2726 to US$1.00, the exchange rate on Mar 30, 2018 as set forth in the H.10 statistical release of the Federal Reserve Board.
• Share of results of equity investees in the quarter ended March 31, 2018 was a loss of RMB70 million (US$11 million), compared to a loss of RMB1,444 million in the same quarter of 2017.
• Our cumulative share of Koubei’s losses had reduced the carrying value of our investment in Koubei to zero. As a result, we have ceased to recognize further losses for this investment.

GAAP to Adjusted/Non-GAAP Measures Reconciliation
16
For the Three Months Ended
Mar 31, 2017 Mar 31, 2018
Adjusted EBITDA (RMB MM) (RMB MM) (US$MM)
Income from operations 9,532 9,221 1,470
Add: Share-based compensation expense 4,306 6,255 997
Add: Depreciation and amortization of property and equipment and land
use rights 1,446 2,649 422
Add: Amortization of intangible assets 1,313 1,329 212
Adjusted EBITDA 16,597 19,454 3,101
Adjusted EBITDA margin 43% 31%
Non-GAAP net income
Net income 9,852 6,641 1,059
Add: Share-based compensation expense 4,306 6,255 997
Add: Amortization of intangible assets 1,313 1,329 212
Add: Impairment of goodwill and investments 133 89 14
Less: Gain on deemed disposals/disposals/ revaluation of investments and others (5,603) (153) (24)
Add: Amortization of excess value receivable arising from the restructuring of commercial arrangements with Ant Financial 65 65 10
Adjusted for tax effects on non-GAAP adjustments 374 (127) (20)
Non-GAAP net income 10,440 14,099 2,248
Non-GAAP Free cash flow
Net cash provided by operating activities 10,746 14,180 2,261
Less: Purchase of property and equipment and intangible assets (excluding land use rights and construction in progress) (2,832) (5,616) (896)
Add: Others 66 - -
Non-GAAP free cash flow 7,980 8,564 1,365
(1) All translations of RMB into US$ were made at RMB6.2726 to US$1.00, the exchange rate on Mar 30, 2018 as set forth in the H.10 statistical release of the Federal Reserve Board.
